1. Introduction
Wave load analysis is an essential part of the design for marine structures, as a result of the fact that the static and dynamic loads induced by waves are important and main factors affecting the structural safety and durability in the marine environment [
1]. USVs such as Wave glider, AutoNaut, Saildrone and SailBuoy usually adopt sandwich-structured composite hulls, which can suffer irreversible material damage due to material fatigue under cyclic loads caused by wave impacts. Singh and Davidson conducted a study on the effects of different factors on the flexural strength, stiffness, and life of sandwich composites, of which the impact damage had little effect on the static results, but caused a significant loss in fatigue life [
2]. Kanny and Mahfuz investigated the effect of frequency on the fatigue behavior of sandwich composites and found that the crack growth rate decreased with increase in loading frequency [
3]. It is important to comprehend the wave impacts, the characteristics of cyclic wave loads to which a type of USV utilizing wave motion energy are subjected during their normal operating conditions, are of interest in this investigation.
Water wave modeling and the calculation of wave loads can be carried out through analytical method, empirical method, physical experiment and numerical simulation [
4].
The analytical method uses mathematical equations to build simplified models of different water waves phenomena in nature. These equations are used to describe the most important characteristics of waves and to predict wave behaviors. Famous theories of water waves include linear water wave theory (also called Small-amplitude theory or Airy wave theory), nonlinear finite amplitude wave theory (Stokes wave theory), Boussinesq wave theory, cnoidal wave theory, Solitary wave theory, Fenton’s theory and others for phenomena more complex such as wave breaking, hydraulic jump and bore.
Regarding the empirical method, the Morison equation with its improved formulation is a common semi-empirical equation used to predict the wave loads acting on offshore structures when the characteristic dimension is small compared to the wave length [
5]. For example, Yang and Li successfully calculated the inner and outer water hydrodynamic pressure of hollow piers using the expanded Morison equation [
6]. Lee et al. compared the experimentally measured wave forces and those calculated by the Morison equation, and thus proposed a non-dimensional wave force function which improves the accuracy of secondary load cycle computation on cylindrical structures [
7].
Physical water wave experiments are also common. They consist in constructing a basin, wave flume or wave tank for physically generating waves. Experimental models are usually scaled down, and the scaling laws should be applied for estimating real water wave effects. Waves are generated by the movement of wavemakers that may be roughly categorized into piston-type and flap-type. A single such structure can be used to generate both linear and nonlinear waves, while grouped such structures can be used to generate irregular wave surfaces by simultaneous motions with different phases. In physical experiments, stable waveforms are generated and disturbing factors like wave reflections may be eliminated by controlling the motions of the wavemaker. A physical model can be applied to the study of water waves phenomena and related FSI problems. One can refer to these related research articles [
8,
9,
10,
11,
12].
With the increase in computing power and the development of related software, numerical simulation has become an economical and convenient method to study water waves and related FSI problems. A variety of analytical theories can be applied and numerical models of physical wave tanks can be constructed for investigating the generation of waves as well as the interaction between waves and structures. Anbarsooz et al. constructed both piston-type and flap-type numerical wave tanks to generate linear and nonlinear waves in intermediate and deep-water conditions, and the models were validated by referring to experimental data [
13]. Park et al. constructed a piston-type wave tank based on Boussinesq equation for generating the cnoidal waves and solitary waves, and verified the mean power characteristic range of the related theories [
14]. Francis et al. constructed a piston-type numerical wave tank for generating stable solitary waves [
15]. Ohyama and Nadaoka constructed a numerical wave tank with open boundary condition using a sponge layer and Sommerfeld’s radiation condition to eliminate wave reflections and analyzed the generation of nonlinear and irregular waves [
16]. Miquel et al. analyzed the performance of different wave generations and absorption methods in CFD (computational fluid dynamics)-based numerical wave tanks [
17]. Westphalen et al. constructed a numerical wave tank to study the interactions between focused waves and the structure, and verified the numerical wave tank model by referring to the experimental data [
18]. Hu et al. built a numerical wave tank to study the fluid–structure interaction problem, and simulated, respectively, first- and second-order Stokes waves and the extreme wave cases [
19].
Wave impact on a structure is an FSI problem involving multiple materials (air, water and structure). Waves propagate and reach the structure, then the impact process is completed in a very short time. A finite element-based FSI model contains both fluid and solid materials. With the Lagrangian method, the interface between different materials can be easily tracked based on the mesh deformation. However, in FSI problems, large material deformation may occur which can lead to mesh distortion and computational instability. In contrast, the mesh distortion problem does not exist when applying the Eulerian method because the mesh remains unchanged during the computation. Facing this problem, the Arbitrary Lagrangian Eulerian method successfully combines the advantages of the Lagrangian and Eulerian methods. The method allows the presence of both Eulerian elements of fluid materials and Lagrangian elements of solid materials in the same model, and the large deformation issue can be solved by the advection process. Furthermore, the ALE-based multi-material formulation enables the simultaneous presence of more than one fluid material in a single element, which makes it possible to achieve precise interface tracking between different materials.
The Arbitrary Lagrangian Eulerian method has become an important and efficient approach to solve FSI problems. The models implanted with ALE formulation have been successfully applied to different FSI scenarios, such as sloshing tanks, bird impact, airbag inflation, slamming phenomena, soil–structure interaction and underwater explosive simulations. Hughes et al. firstly gave a finite element formulation for incompressible viscous flows based on the ALE method to solve the free surface and the FSI problem therein [
20]. Souli et al. introduced the essential ideas of the ALE method for FSI problems and proposed a method to control the distortion of the mesh [
21]. Rider et al. improved the ALE code ALEGRA, the new methodology enhanced the second-order accurate numerical method to a third-order accurate in one dimension [
22]. Souli and Gabrys numerically simulated the problem of bird impact into an aircraft radome using ALE formulation and validated the model through experimental approaches [
23]. Souli and Shahrour analyzed the effect of blast loading on a coupled soil–structure system using the ALE method [
24]. Ozdemir et al. simulated the Sloshing tank problem affected by earthquake conditions using the ALE method. The coupling forces were calculated and their experimental results were verified to be accurate by referring to the existing analytical results [
25]. Aquelet et al. introduced a damping force based on the relative velocity of the fluid in the ALE method to simulate the slamming phenomena in the shipbuilding industry [
26]. Gong conducted an underwater explosion scenario using the ALE formulation, in order to simulate the response of a submersible hull build of glass–epoxy composite due to explosive shock and bubble [
27].
The reliability of the ALE method for modeling free surface problems has been demonstrated by existing research cases such as the Sloshing tank problem mentioned above. In the study of Souli and Zolesio, the free surface motions of viscous and incompressible flows were solved by the ALE method with the Galerkin/least-square (GLS) finite element formulation [
28]. Thus, the ALE method can be equally applied to the free surface problem of simulated wave generation.
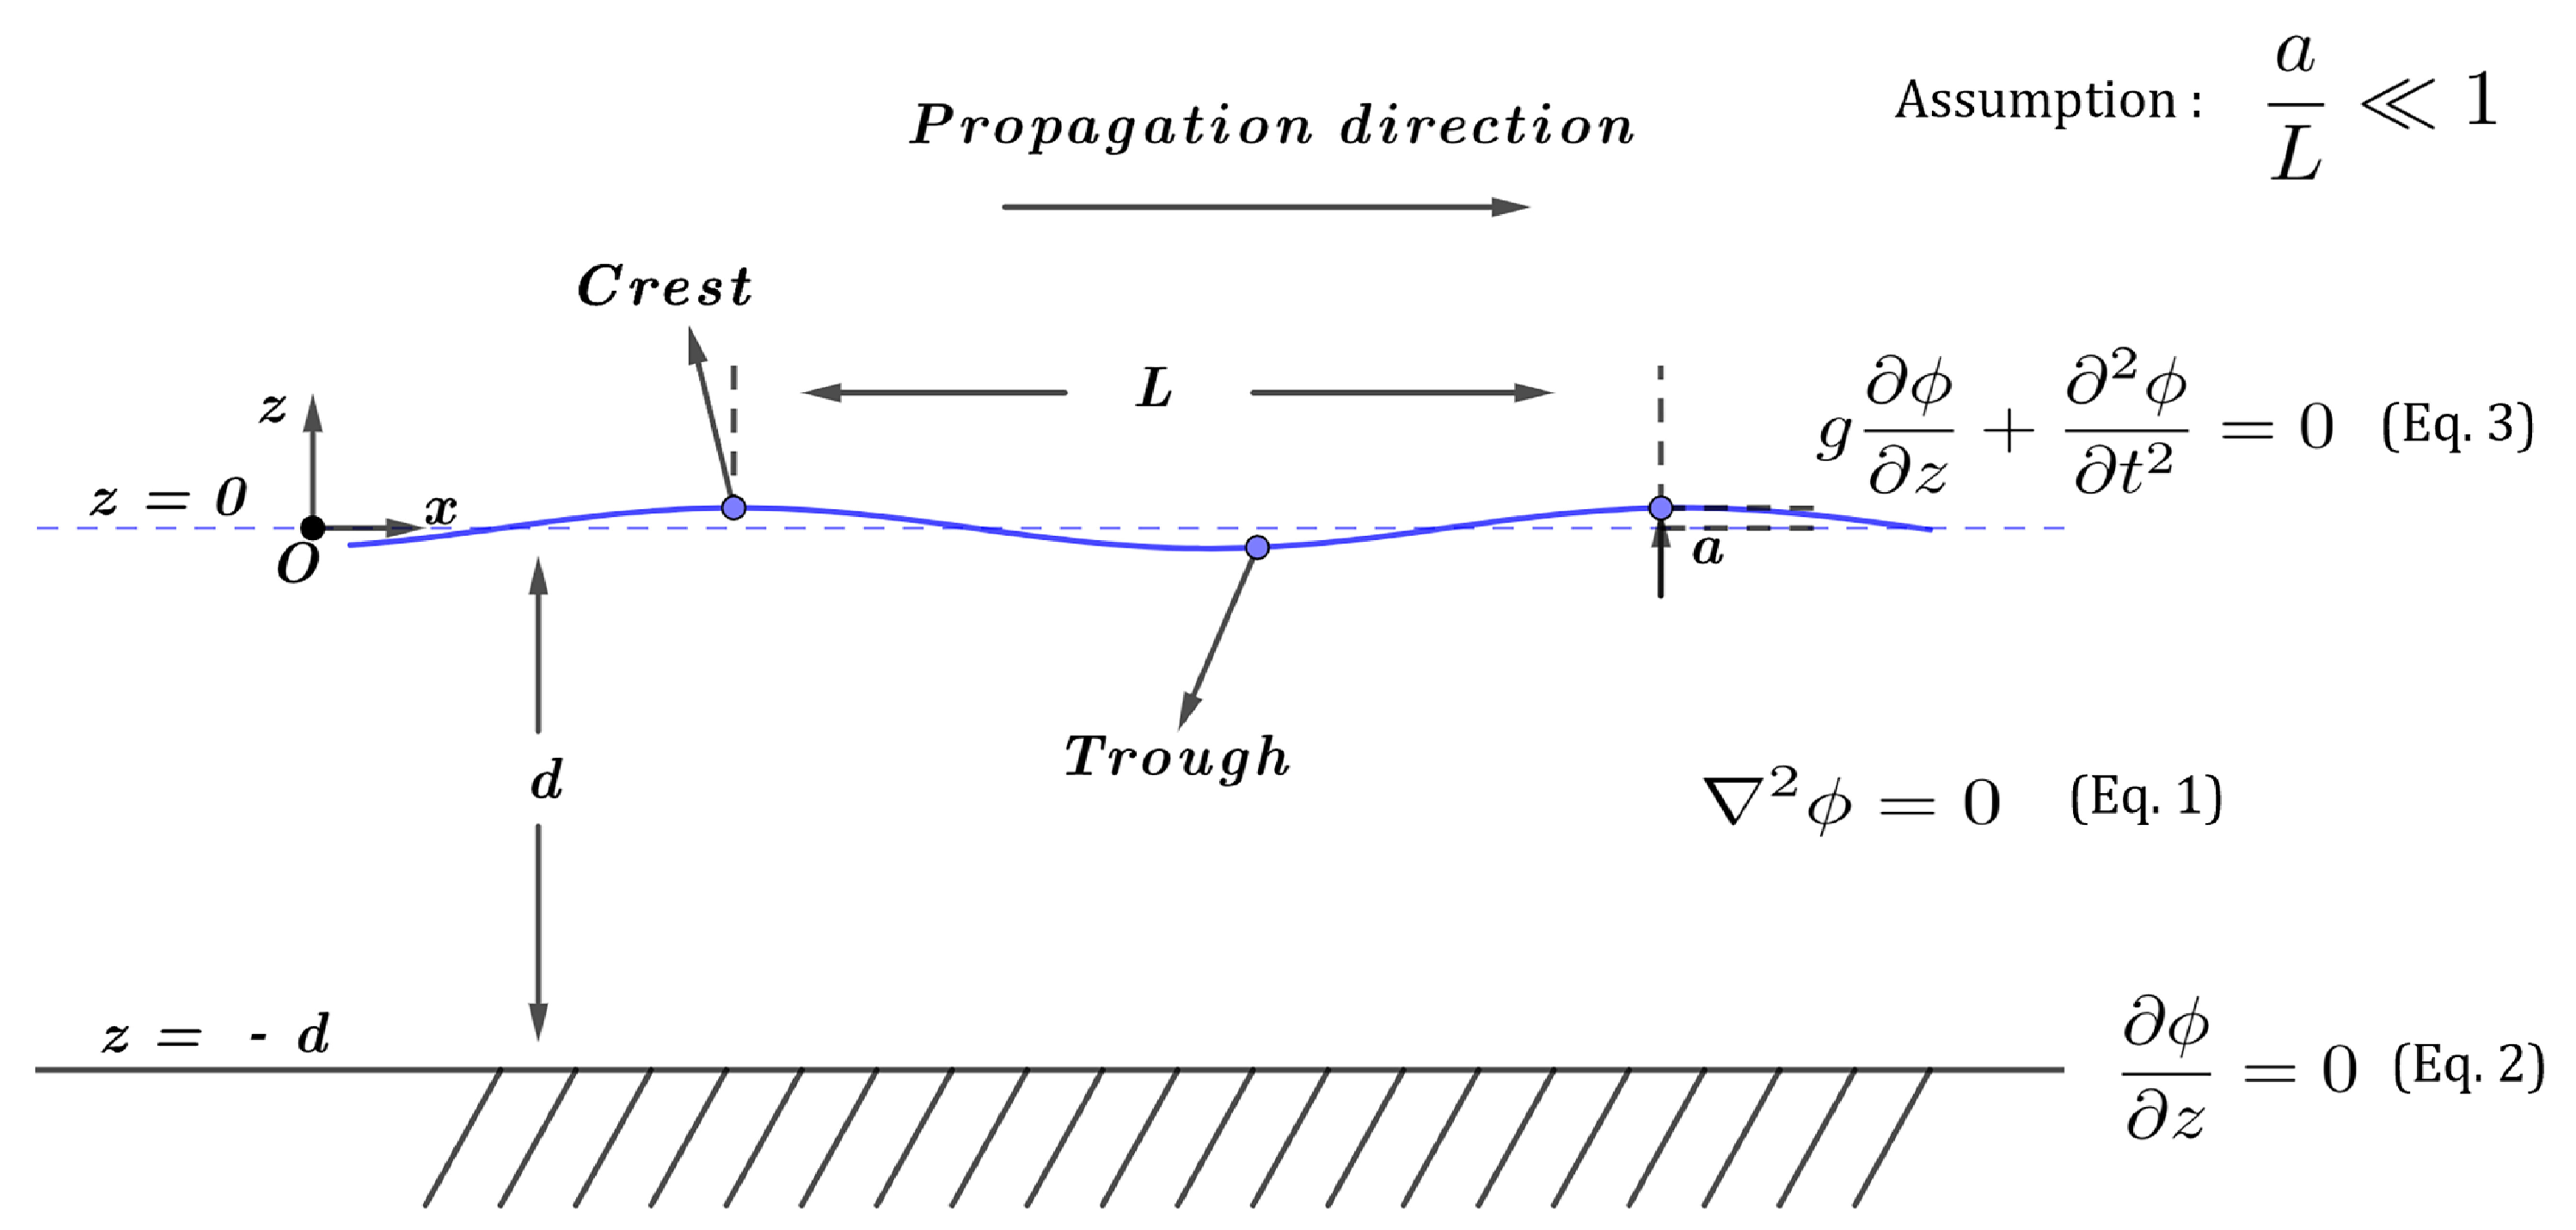
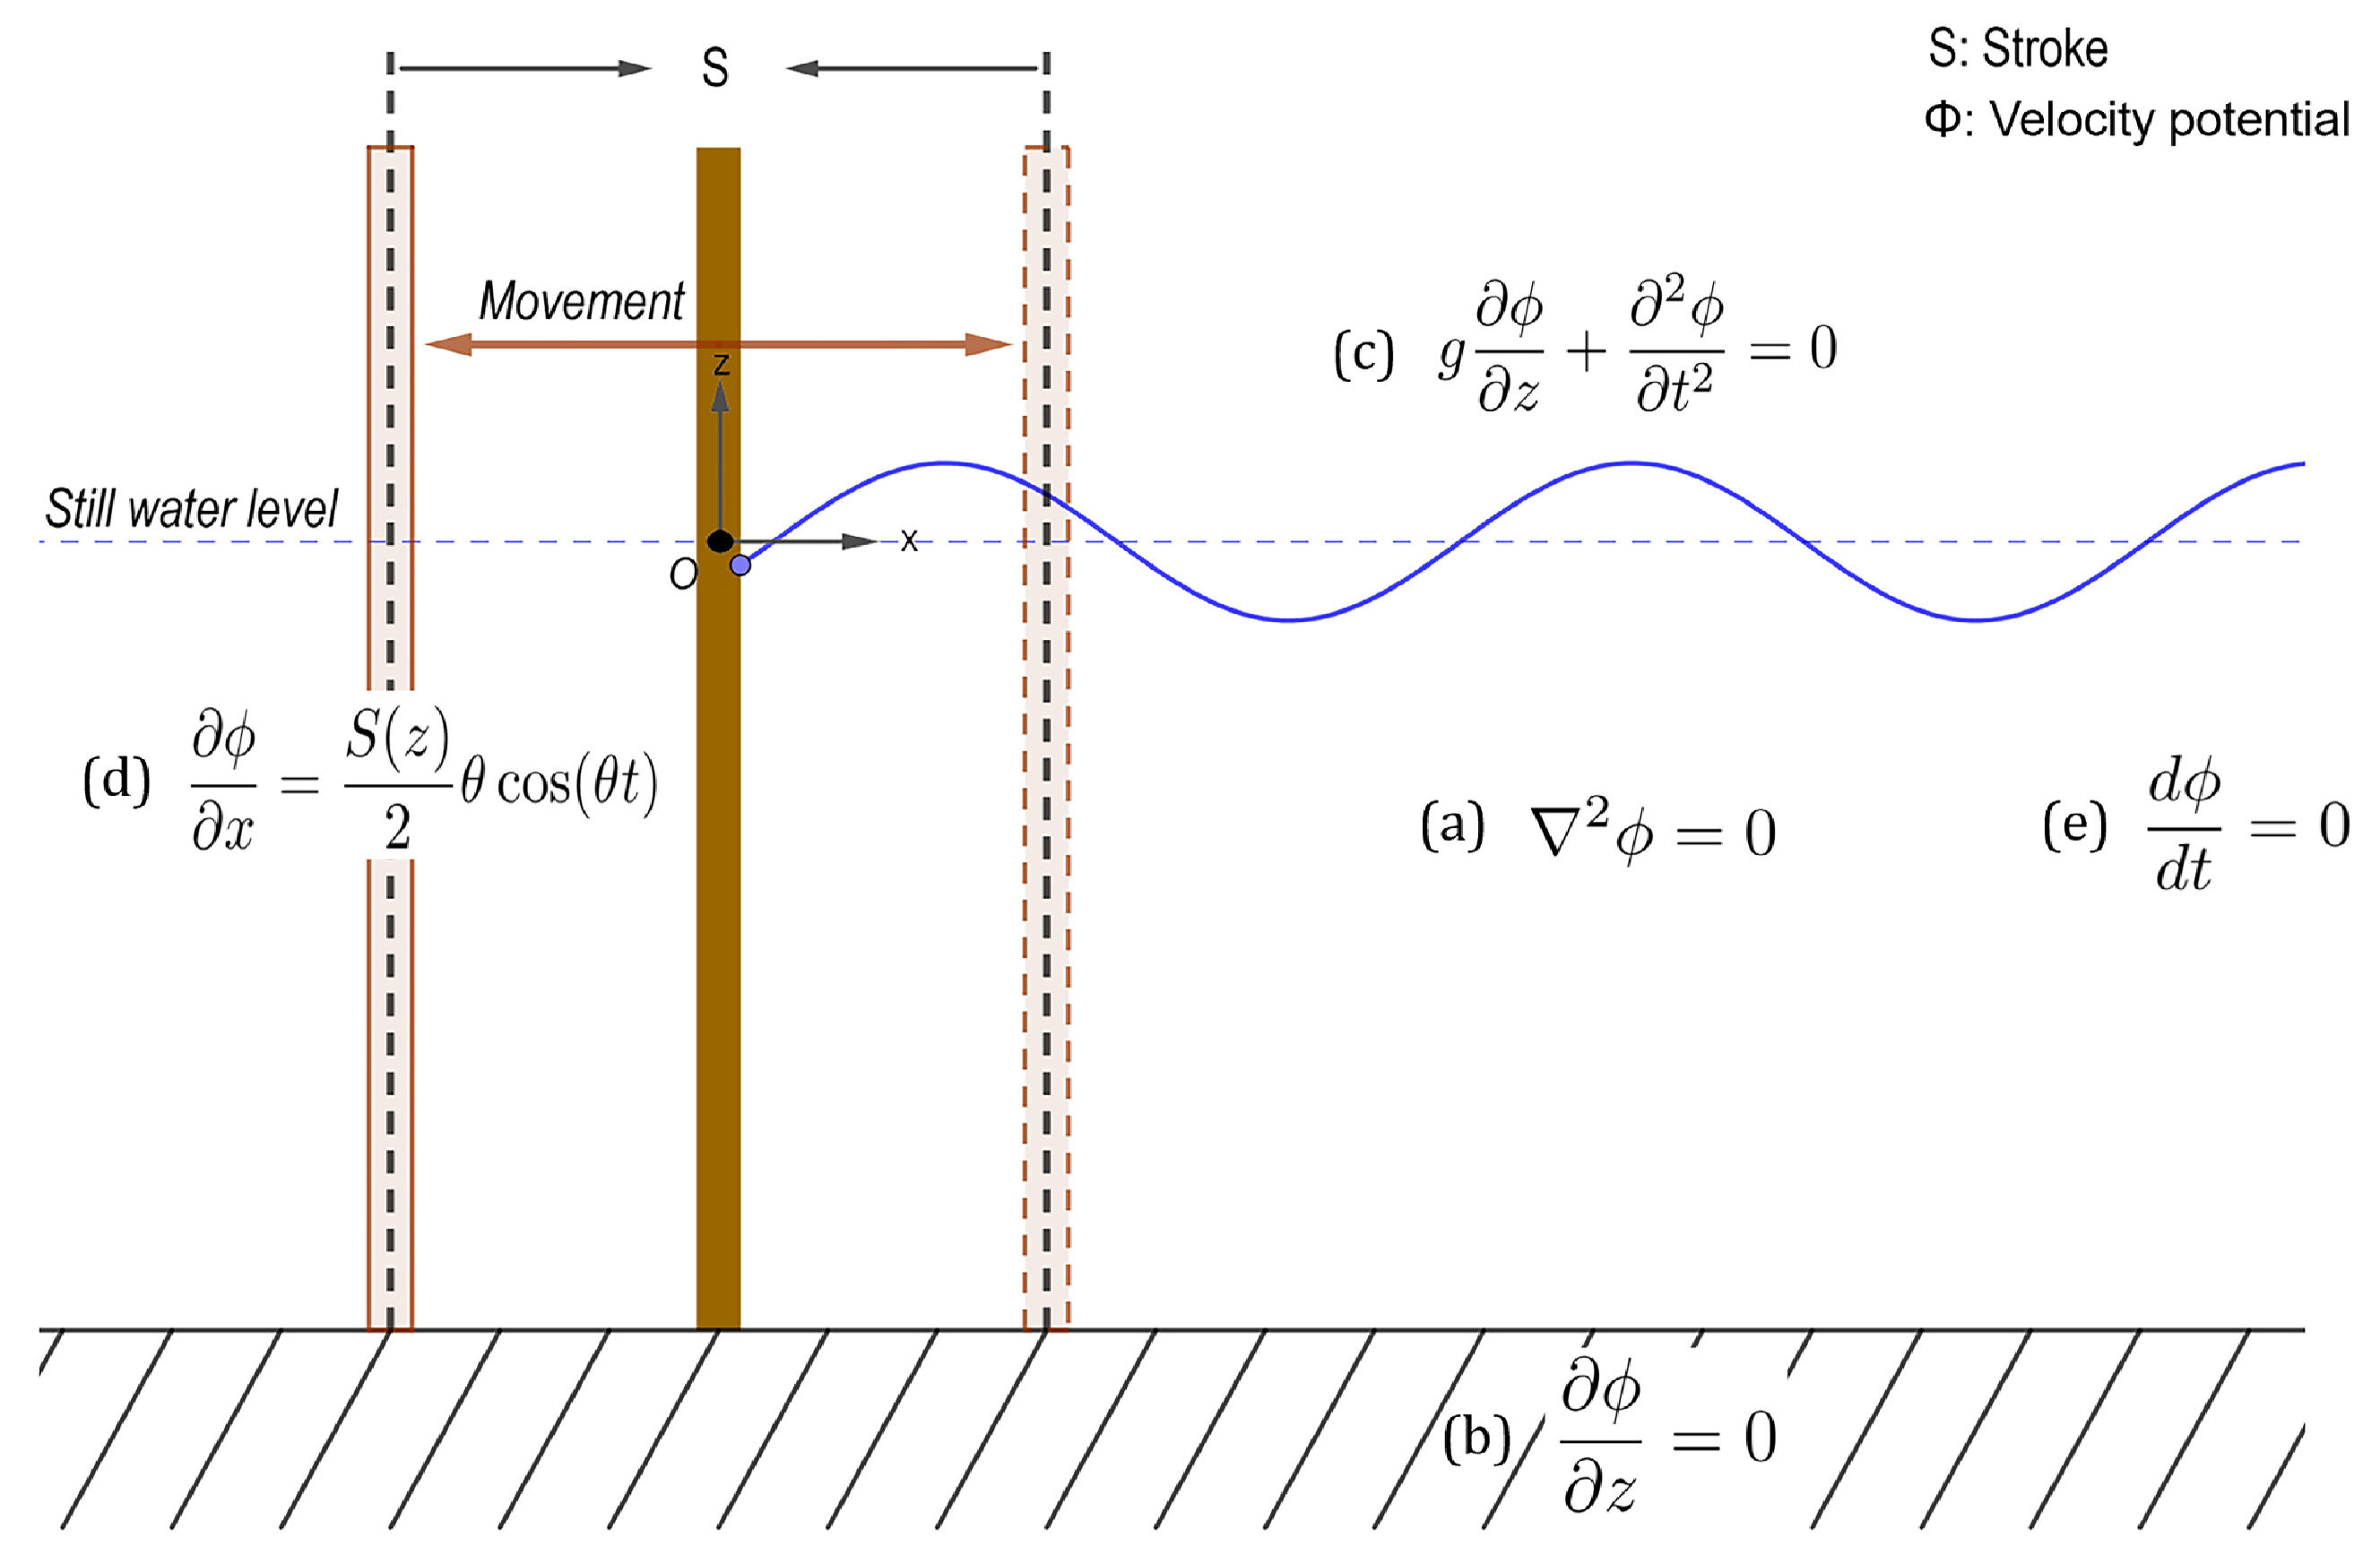
This article starts from the linear wave and the related wavemaker theory. The wave absorption method using the damping effect is considered. The ALE formulation based on the Navier–Stokes (NS) equation, the interface tracking and reconstruction method for free surface and the coupling based on the penalty method are then described. For studying the cyclic loading process on a floating structure under wave impacts, an ALE wave flume model is established, regular linear waves are generated and their accuracy is verified referring to analytical solutions. Then, the system is coupled with a structure for FSI simulations, the coupling forces between the interface of the fluid and the structure are computed and the impact process and load data are analyzed.
3. ALE Formulation for Wave Generation and FSI
The Lagrangian and Eulerian formulations are, respectively, the classical methods for processing numerical simulations of structural analysis and fluid dynamics. For the Lagrange formulation, the elements deform with the material. Whereas for the Eulerian formulation, the nodes are fixed in space and the material travels through the mesh. In the face of FSI problems with potentially large deformations and interface tracking requirement, using one of these formulations in isolation is not an effective approach. However, the ALE formulation represents a combination of two different finite element modeling techniques.
3.1. ALE Description
In the ALE description, a referential domain is introduced in addition to the classical material domain (Lagrangian configuration) and spatial domain (Eulerian configuration). In other words, the ALE description considers two superimposed meshes, including a deformable Lagrangian mesh for structures and a fixed Eulerian or ALE mesh for fluids. When large deformations are present, the mesh distortion can be reduced by realizing the motion of the internal nodes through the referential domain.
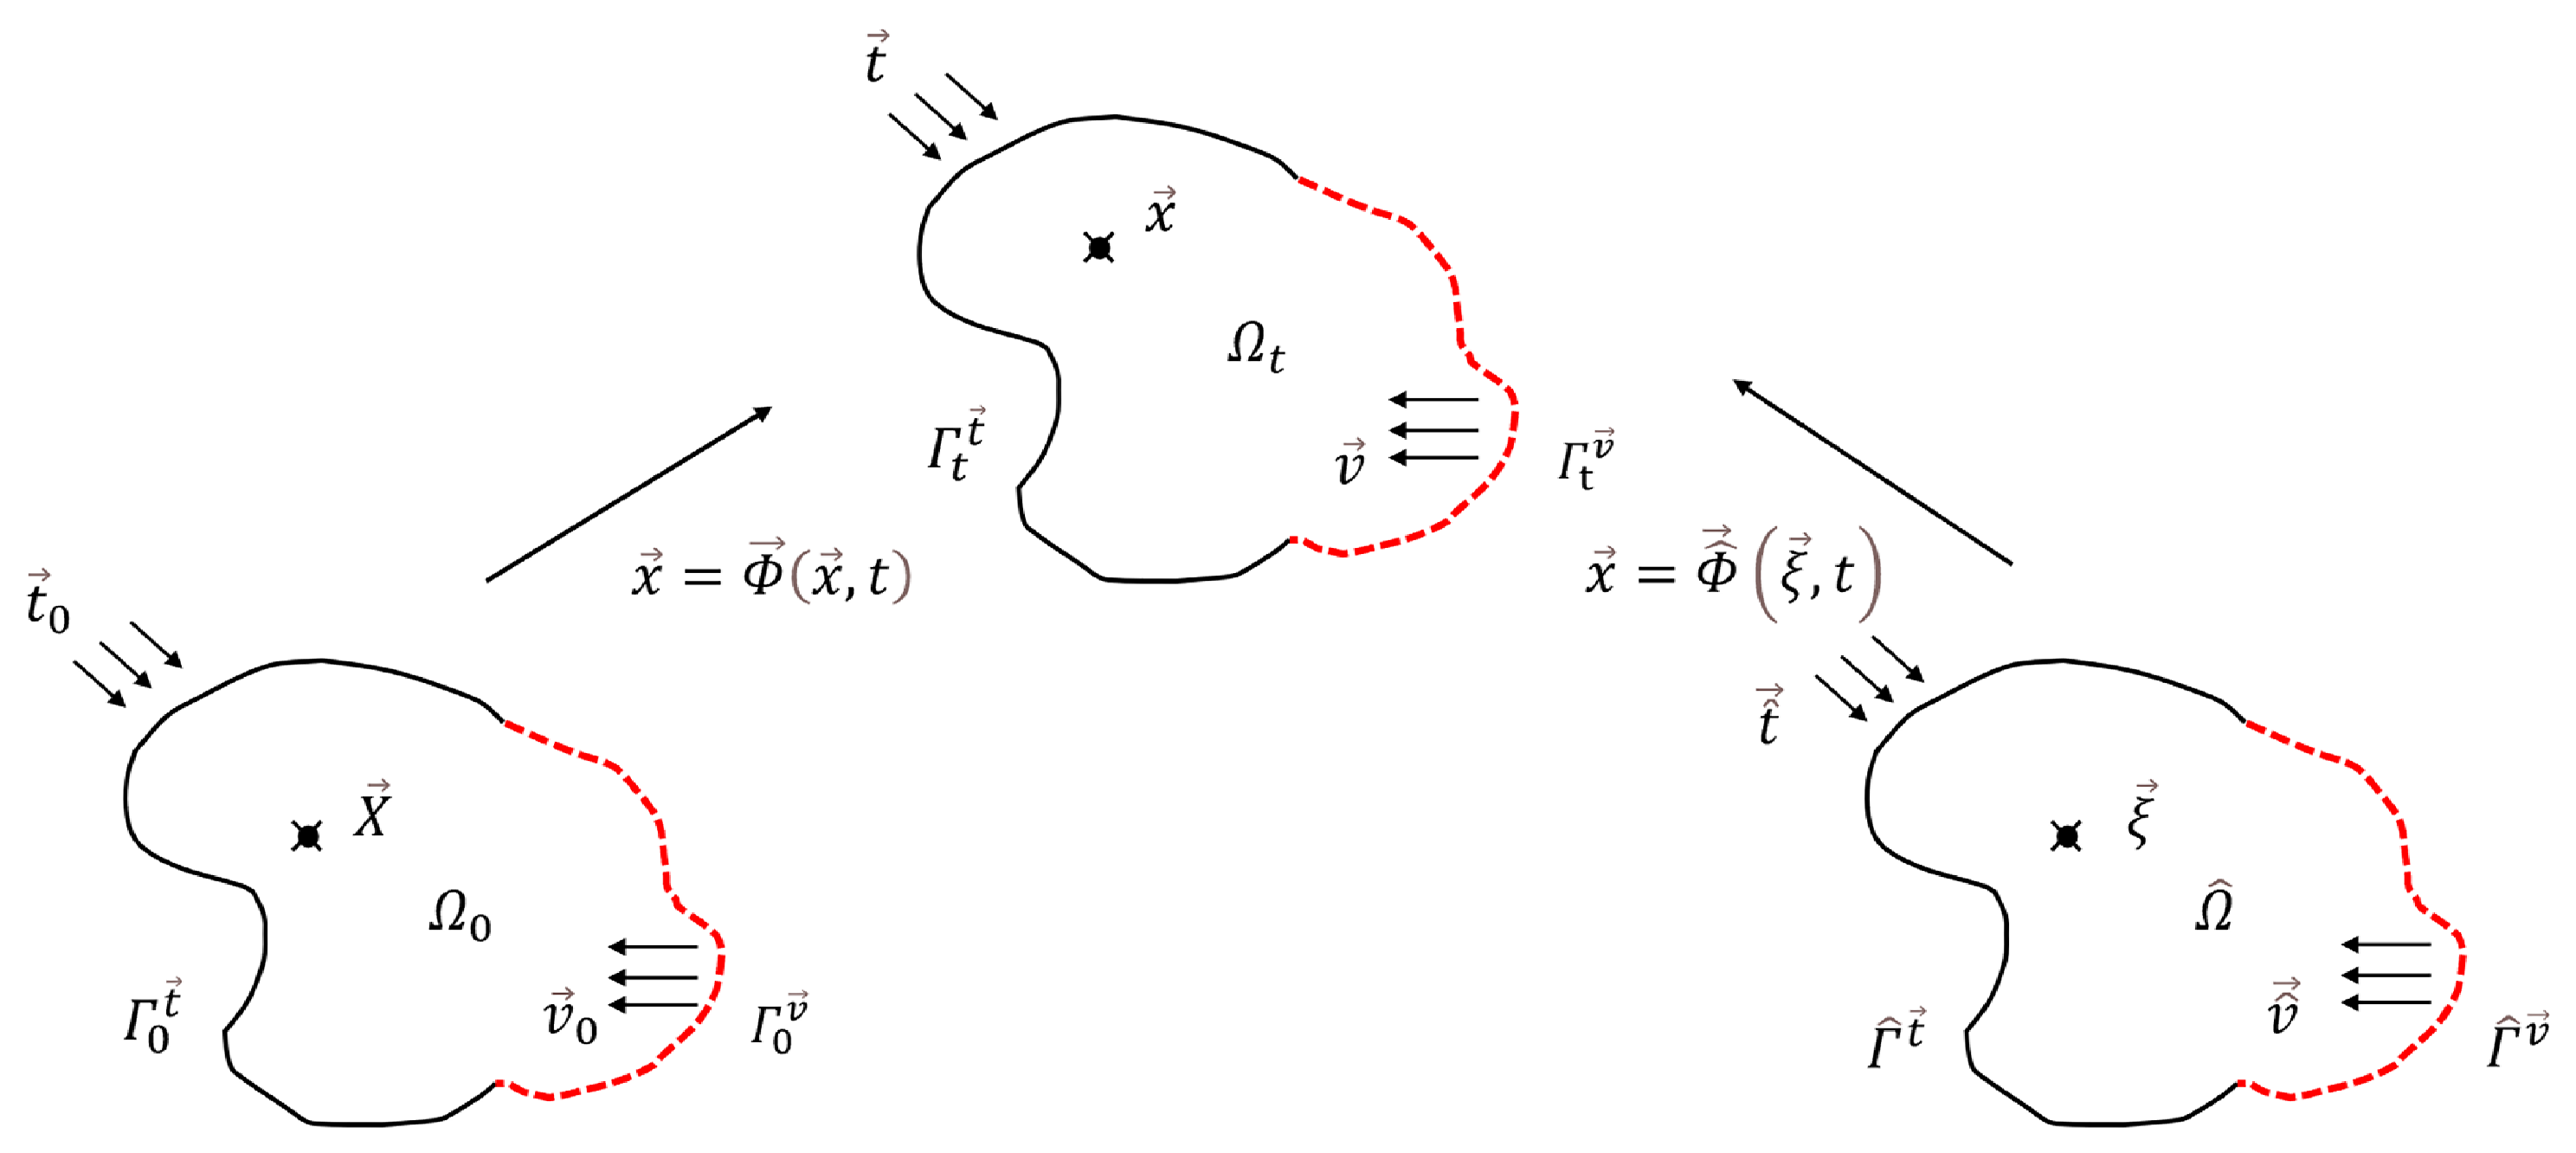
Consider three domains, the material domain
, the spatial domain
and the referential domain
shown in
Figure 3. The material domain represents the initial configuration of a finite continuum body at
, with its boundary being
. The spatial domain represents the configuration of this continuum body at time
t, and its boundary is
. Then, the referential domain represents an arbitrary grid domain whose boundary is
. For the material domain, the coordinates of all the material points of which the continuum body is composed are expressed in terms of
. And at time
t, the coordinates of all material points comprising the spatial domain are expressed by
. The coordinates of all material points of the referential domain are then expressed by
. Then, the transformation of their coordinates can be achieved through injective functions
and
.
For a variable
f, the partial derivative with respect to time in the referential domain can be related to the material derivative with respect to time, expressed as follows:
where the term
can be be defined as the convective velocity
; that is,
. Thus, the convective velocity represents the difference in velocity between the fluid and the grid of the referential domain.
3.2. ALE Formulation of Navier–Stokes Equations
In most CFD solvers, the governing equations implanted to describe the fluids are the Navier-Stokes equations. NS equations take into account the viscosity of the fluid, which is considerably more realistic and can be applied to a wider range of fluid analysis. However, the NS governing equations can still be applied to the linear waves. This is because, when considering incompressible non-viscous fluids, the momentum equation in the NS equations can be reduced to Euler’s equation, which in combination with the continuity equation can still lead to the governing equation of the linear water wave, the Laplace’s equation.
Subsequently, the NS governing equations under the ALE description in the considered case can be obtained. The mass conservation equation can be expressed as follows,
where
represents the density of the fluid.
The momentum conservation equation can be expressed as follows:
where
represents the stress tensor, and
represents a force per unit mass from the body force generally being the gravity.
And the energy conservation equation can be expressed as follows:
where
e represents the internal energy.
While facing the computational difficulties posed by the presence of advection terms, there are two commonly used techniques that can be employed to solve the Navier–Stokes equations in ALE formulation. The first technique is to solve the fully coupled equations, but it is determined that this technique can only deal with the case of a single material in an element, as for example in the study of Longatte et al. [
40]. The second technique is called the “split” method and this method divides the Lagrangian and advection terms in the NS equations at each time step and solves them in two sequential computational cycles, namely the Lagrangian phase and the advection phase [
21].
In the Lagrangian phase, the explicit finite element method (FEM) is applied and the mesh moves following with the fluid particles. Since in this phase the mass conservation equation reduces to an algebraic equation, only the momentum conservation and the energy conservation need to be treated, which are expressed as follows:
In the advection phase, the transportation of mass, momentum and energy across element boundaries is computed. Depending on convective velocity, it involves either the remapping of the displaced mesh at the Lagrangian phase back to its initial position, or onto a new arbitrary ALE mesh. The conservative equations in the advection phase are written as follows:
In fact, the transport of variables lies in a hyperbolic equation system that needs to be considered. The problem can be solved using a finite volume method (FVM). The second-order advection algorithm, the Van Leer algorithm described by Benson, is adopted in this study [
41].
3.3. Interface Tracking and Reconstruction
The method of interface tracking and reconstruction implanted in this study is based on Young’s method [
42]. The method determines the position of the interface and defines the materials distribution based on the volume fractions of different materials in each element cell. Then, in every element cell, the interface segments are approximated by a straight line, reconstructing the entire free surface.
For the calculation of volume fractions, a function based on the volume fraction is used similarly to the Volume-of-Fluid method (VOF) proposed by Hirt and Nichols [
43]. This function satisfies the equation expressed as follows:
where
represents the volume fraction and
is the fluid particle velocity.
Depending on the value of the volume fraction, it is easy to determine whether a specific fluid exists in the current element cell.
With regard to the reconstruction of the interface, Young’s method has a better accuracy than the Simple Line Interface Calculation (SLIC) method. In a two-dimensional scheme, the slope of the straight line that comes to approximate the interface segment for a central element is determined by its eight surrounding element cells.
Figure 4 shows the determination of the slope by volume fraction. And similar for the three-dimensional case, the process is sequentially carried out following the elements in two directions to reconstruct the free surface.
Once the slope is determined, the approximate interface portion adjusts its position to match the actual free surface based on the current volume fraction of the element cell. The reconstructed interface will be continuous, since the free surface motion region is much larger than element size. Yet, even if there is a complex interface between multiple materials in an element cell, Young’s method can equally handle the situation by repetition of the same interface reconstruction logic.
3.4. Euler–Lagrange Penalty Coupling
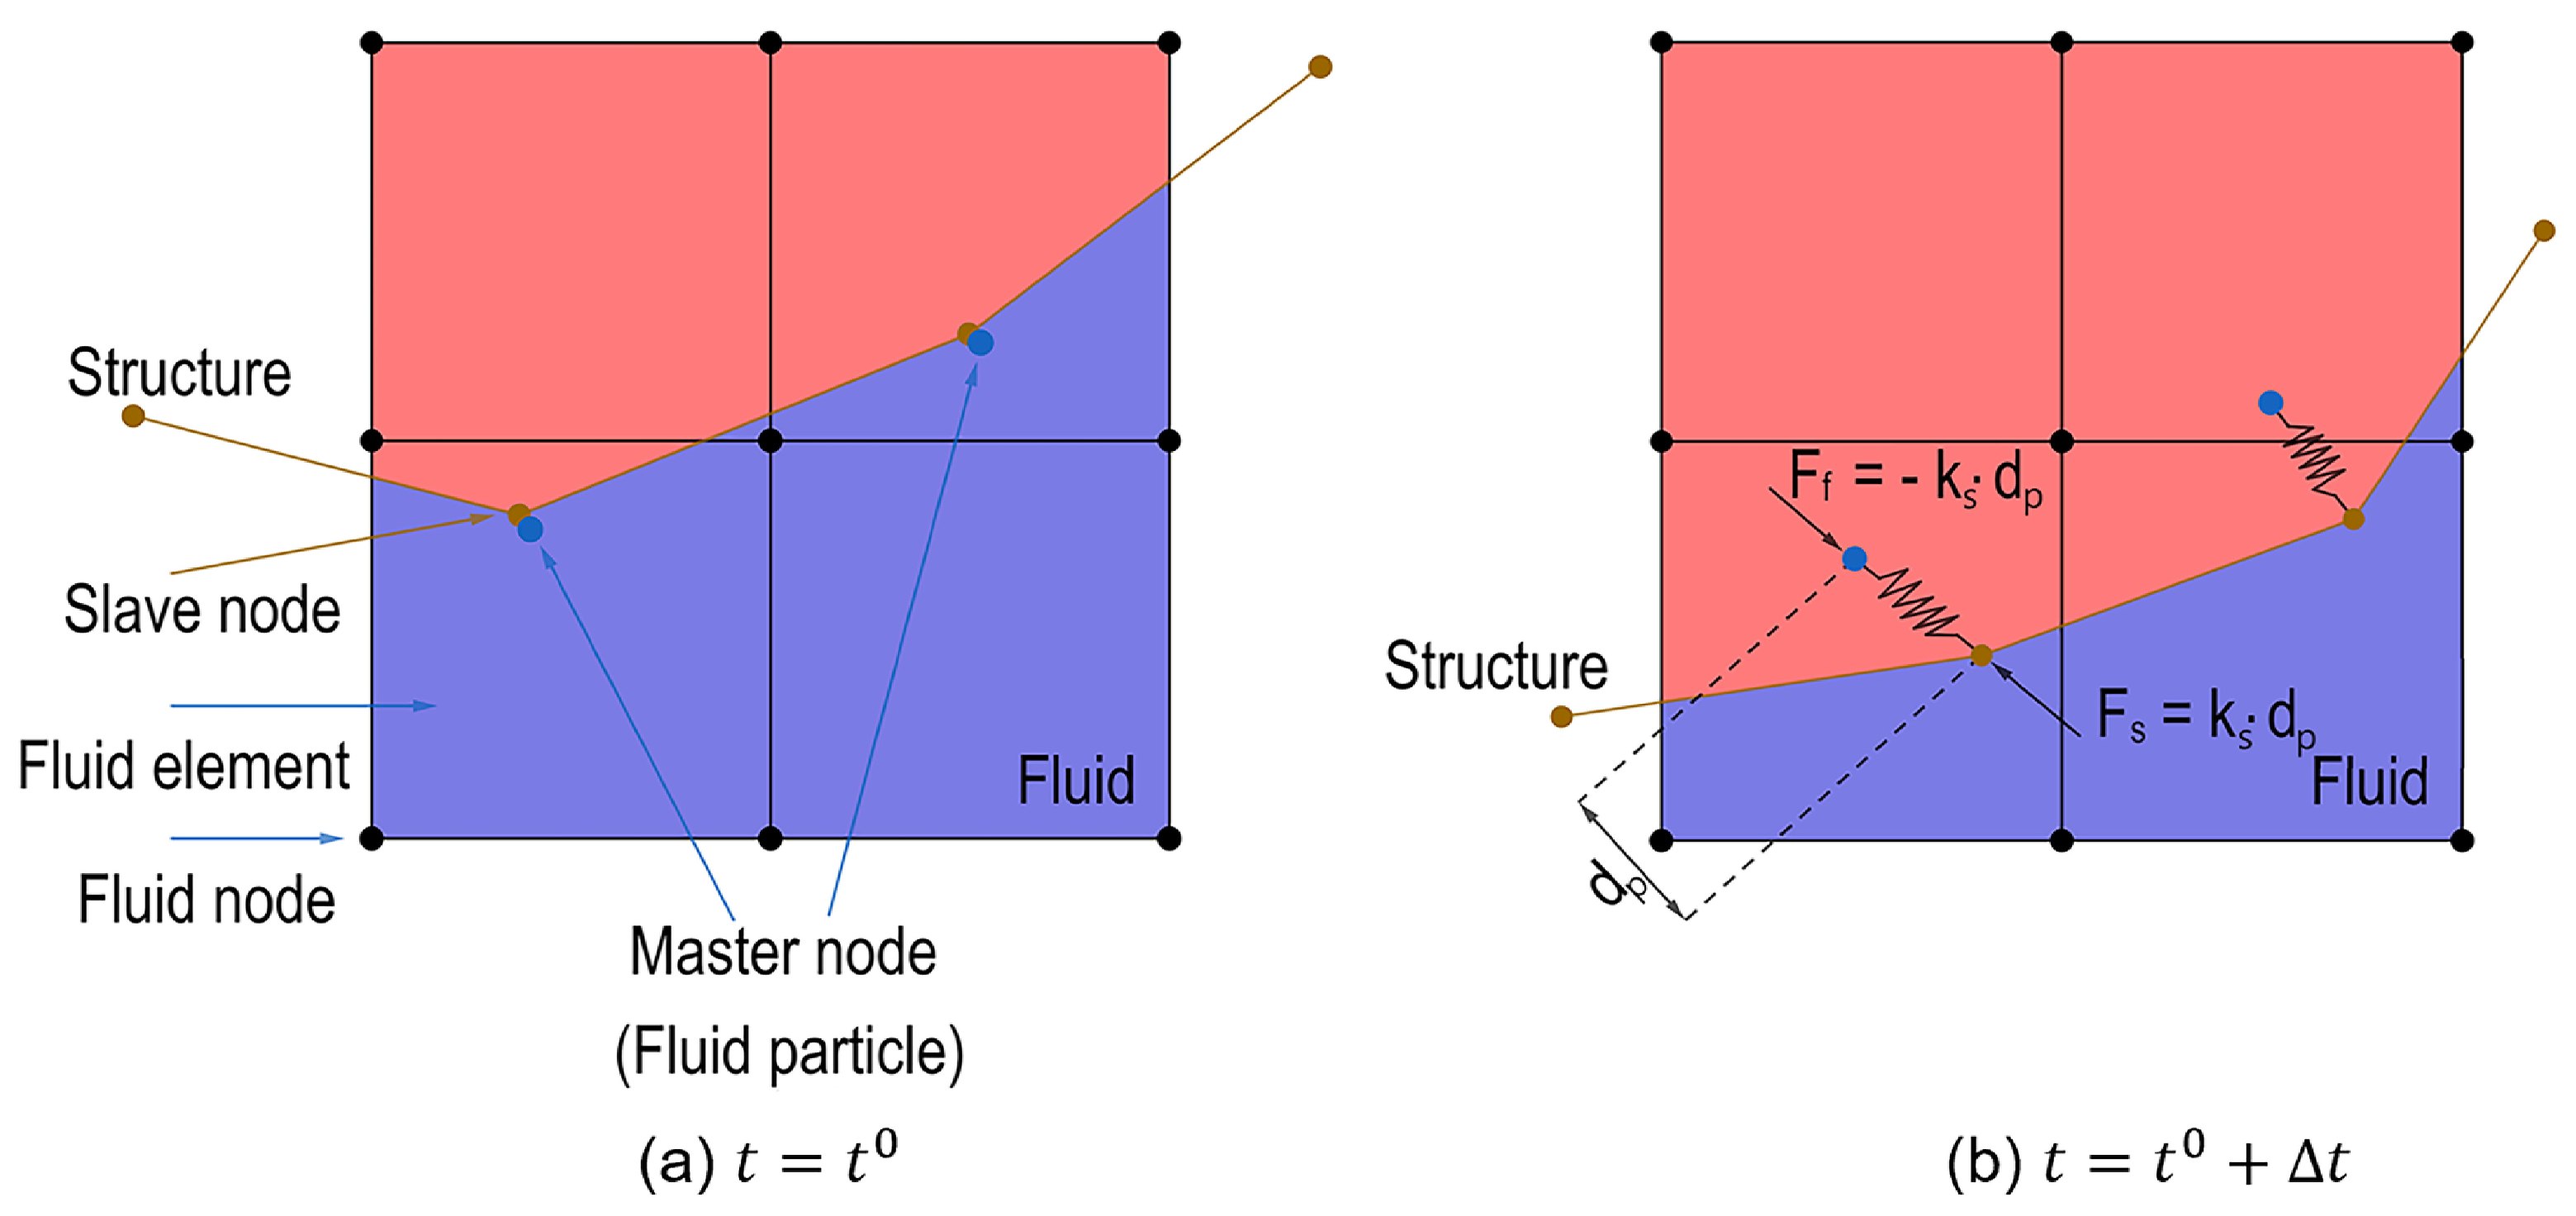
When dealing with contact in FSI studies, the same problem will be encountered in numerical simulations, that is, the rapid motion and large deformation of the fluid will result in a mesh distortion at the fluid–structure interface. For the solution of this problem, it is possible to continue the idea of the ALE method by using a contact algorithm based on the penalty method. It may handle the coupling of the Eulerian fluid part and the Lagrangian structure part, so as to calculate the coupling force at the interface. In the contact algorithm based on the penalty method, a master–slave property is used to define the fluid surface and the structure surface (or penetrating and reference surfaces) that will come into contact. And similarly, the nodes or segments on the surface follow this same rule. In a FSI model, the Eulerian fluid is usually defined as the master part, while the structure of the Lagrangian formulation is the slave part [
44]. The key concept of the penalty method is the implantation of a spring-like system where normal interface springs are placed between the master nodes and slave nodes, as shown in
Figure 5. Similar to the classical contact algorithm where the contact force is computed via a proportional function based on the penetration vector, the calculation of the contact force in the penalty method is based on the penetration depth and the spring stiffness [
23].
The calculation of the coupling force for the penalty method is as follows:
where
is the spring stiffness and
is the penetration depth. In fact, in the time integration calculation, the penetration depth as well as the coupling forces are alternately updated at each time step, and the penetration depth depends on the relative velocity between the fluid and the structure nodes, expressed as follows:
It should be pointed out that the penalty method exerts a resisting force on the slave nodes. A pair of forces in Equation (
18) is respectively imposed on the master and slave nodes in opposite directions, forming an equilibrium state at the coupling interface (
Figure 5). This is for the conformity with the fluid–structure interface condition in actual coupling based on the action–reaction principle. This symmetry of the coupling forces in the penalty method made it almost immune to mesh hourglassing phenomena and also simplified the implementation of the method.
Then, at the structure nodes of the contact surface,
The determination of the spring stiffness value in Equation (
18) is an important and difficult challenge in the coupling problem. This stiffness value depends on the problem to be studied and it needs to be obtained through a large number of experimental tests. A proper value of stiffness for the problem can reduce the energy interface for the total energy conservation and prevent the fluid from penetrating in the structure. The stiffness value in this study will be taken using the following expression:
where
represents the maximum value of the fluid density in the case of multi-materials,
is relative velocity between the fluid material and the structure material,
represents the average surface area of the Lagrangian elements at the contact interface and
describes the interface gap based on the element size of the model.
5. Simulation Results
The numerical flume model and FSI model are solved using OpenRadioss, an open-source Finite Element Analysis (FEA) software specializing in simulating impacts and dynamic events. Then, the simulation results are post-processed using Paraview.
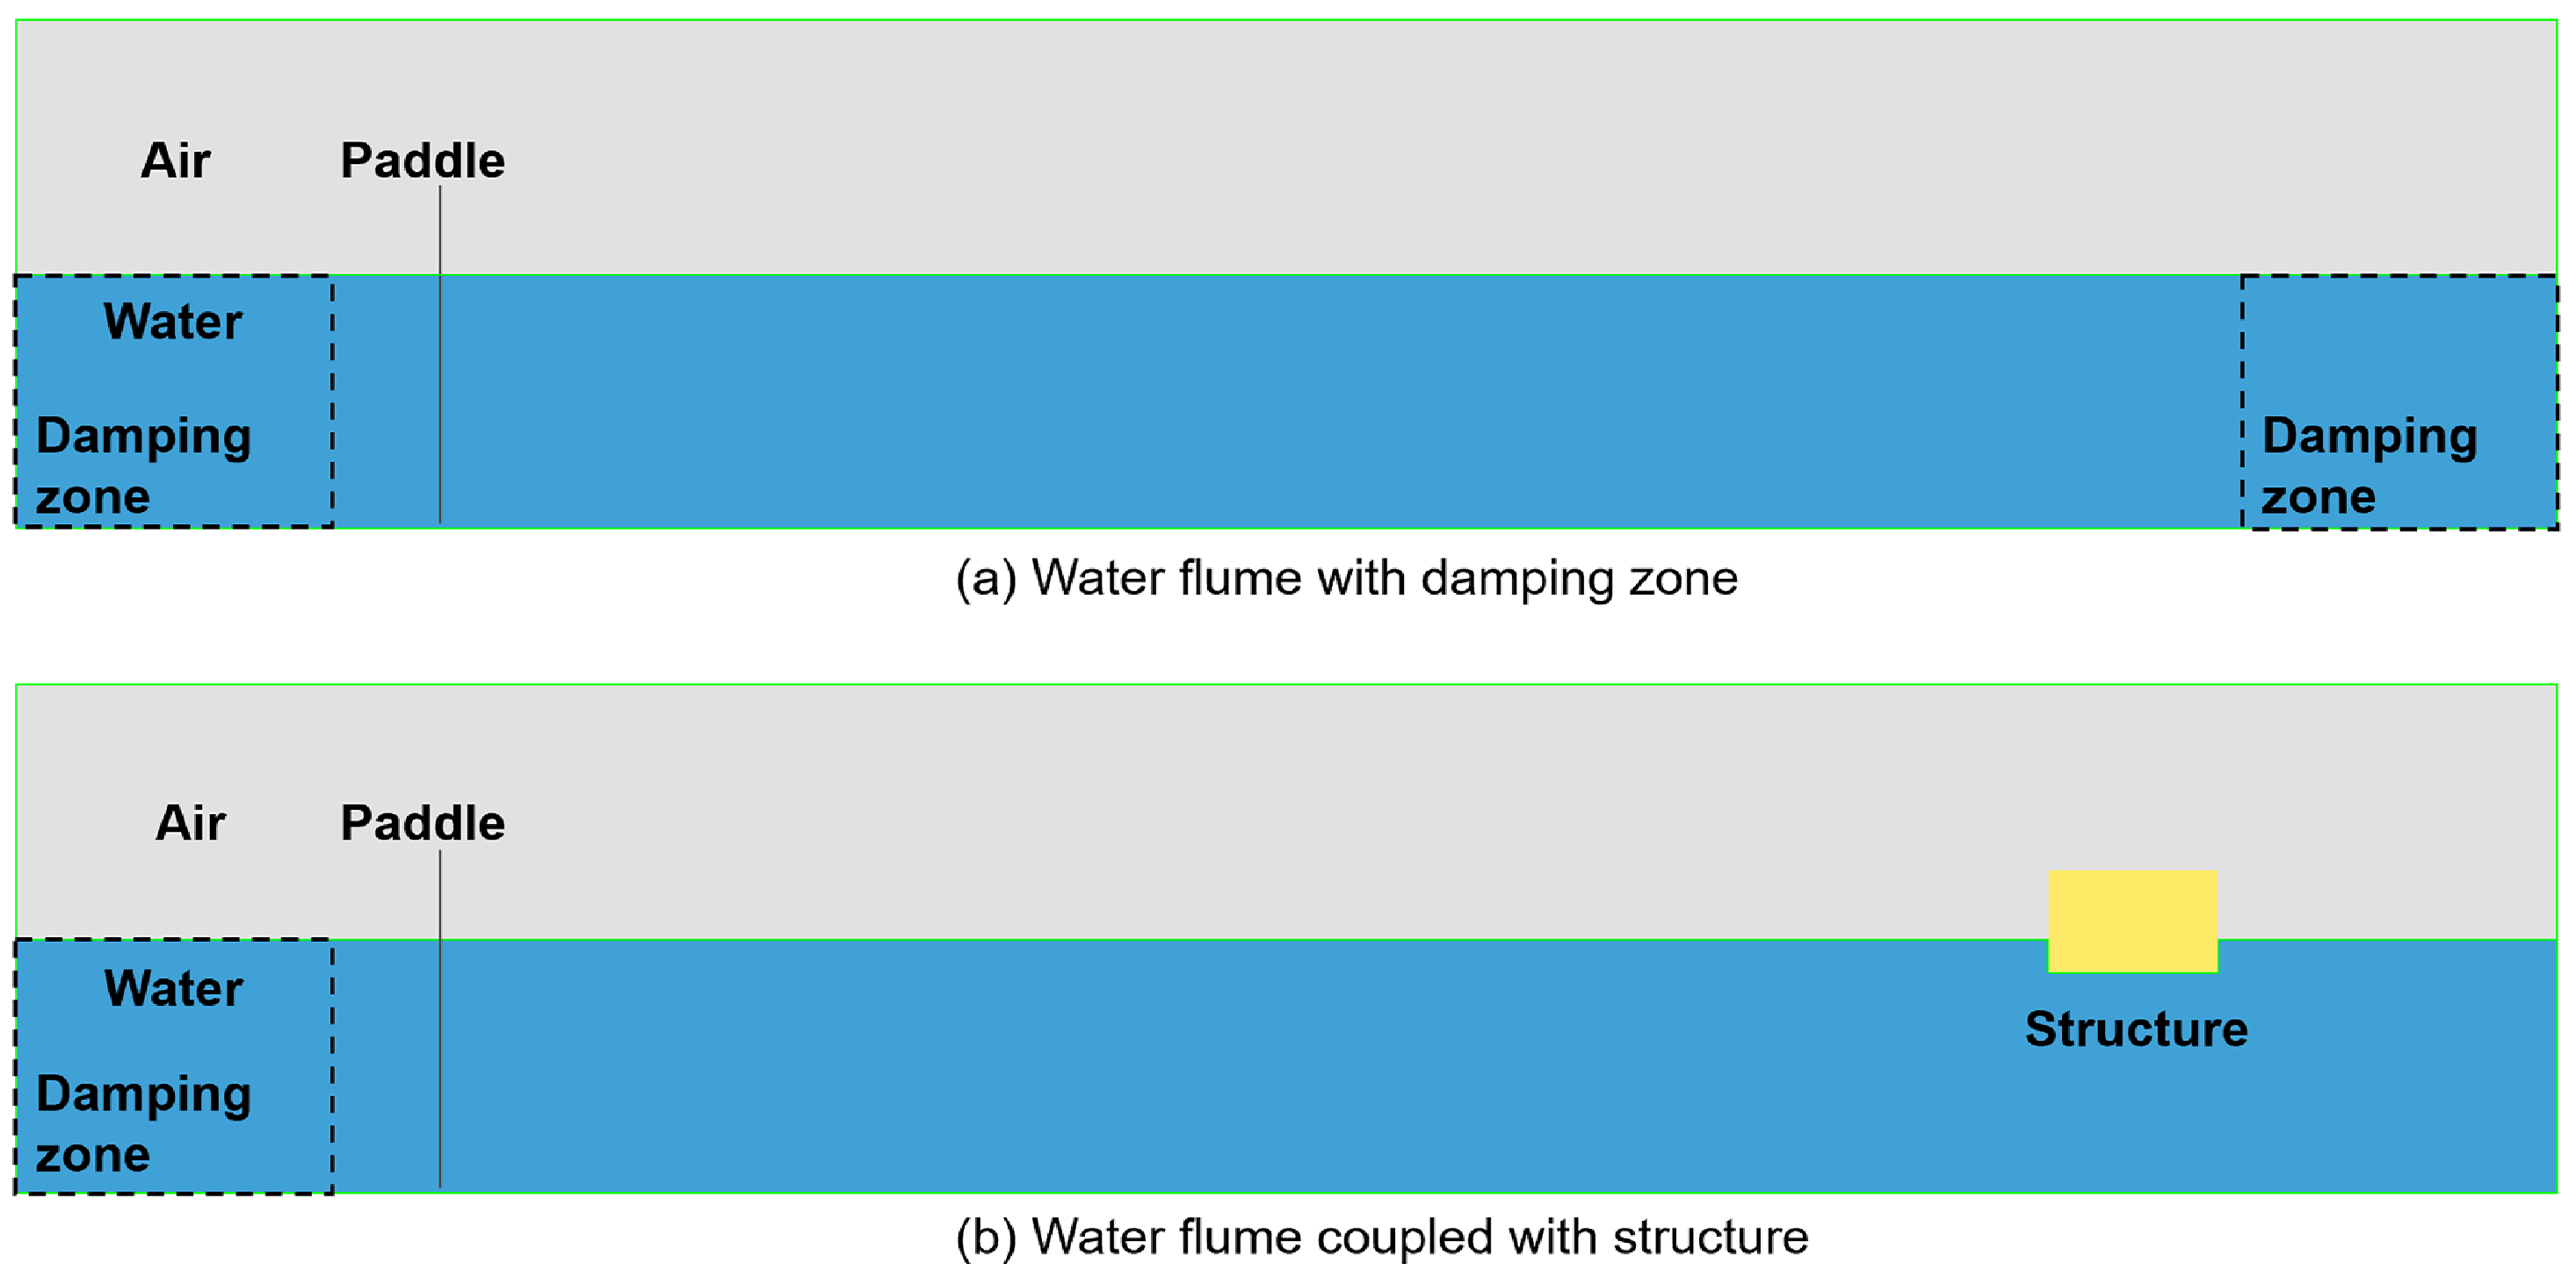
Regarding the size and water depth characteristics of the numerical wave flume, the approximate period range for generating effective waves from the model is determined as . All simulations last 20 s, with increments of 0.1 s. In order to observe the complete wave profile over the entire wavelength and to accurately measure the wave parameters, four sets of target waves with different periods were selected. These waves have a wavelength not exceeding the length of the wave flume. For each set of waves, different stroke settings of the wavemaker are assigned to generate waves with different wave heights. The same waves are used in FSI simulations after validation, with contact pressure history data along the fluid–structure interface are obtained.
5.1. Generated Waves
The period and stroke parameters for the four selected sets of waves, as well as their corresponding analytical wavelength and wave height solutions, are given in
Table 1.
In the study of water wave problems, the relative depth (
), wave steepness (
) and relative wave height (
) are three important dimensionless parameters used for characterization of waves. The relative depth, wave steepness and relative wave height parameters of the target waves are given in
Table 2.
The wave steepness of target waves shown in
Table 2 is a small quantity, just as the ratio of the wave height to the wavelength in linear wave theory is assumed to be small. And for relative depth, they settle into a range of 1/20–1/2, which allows the target waves to be classified as an intermediate water depth condition.
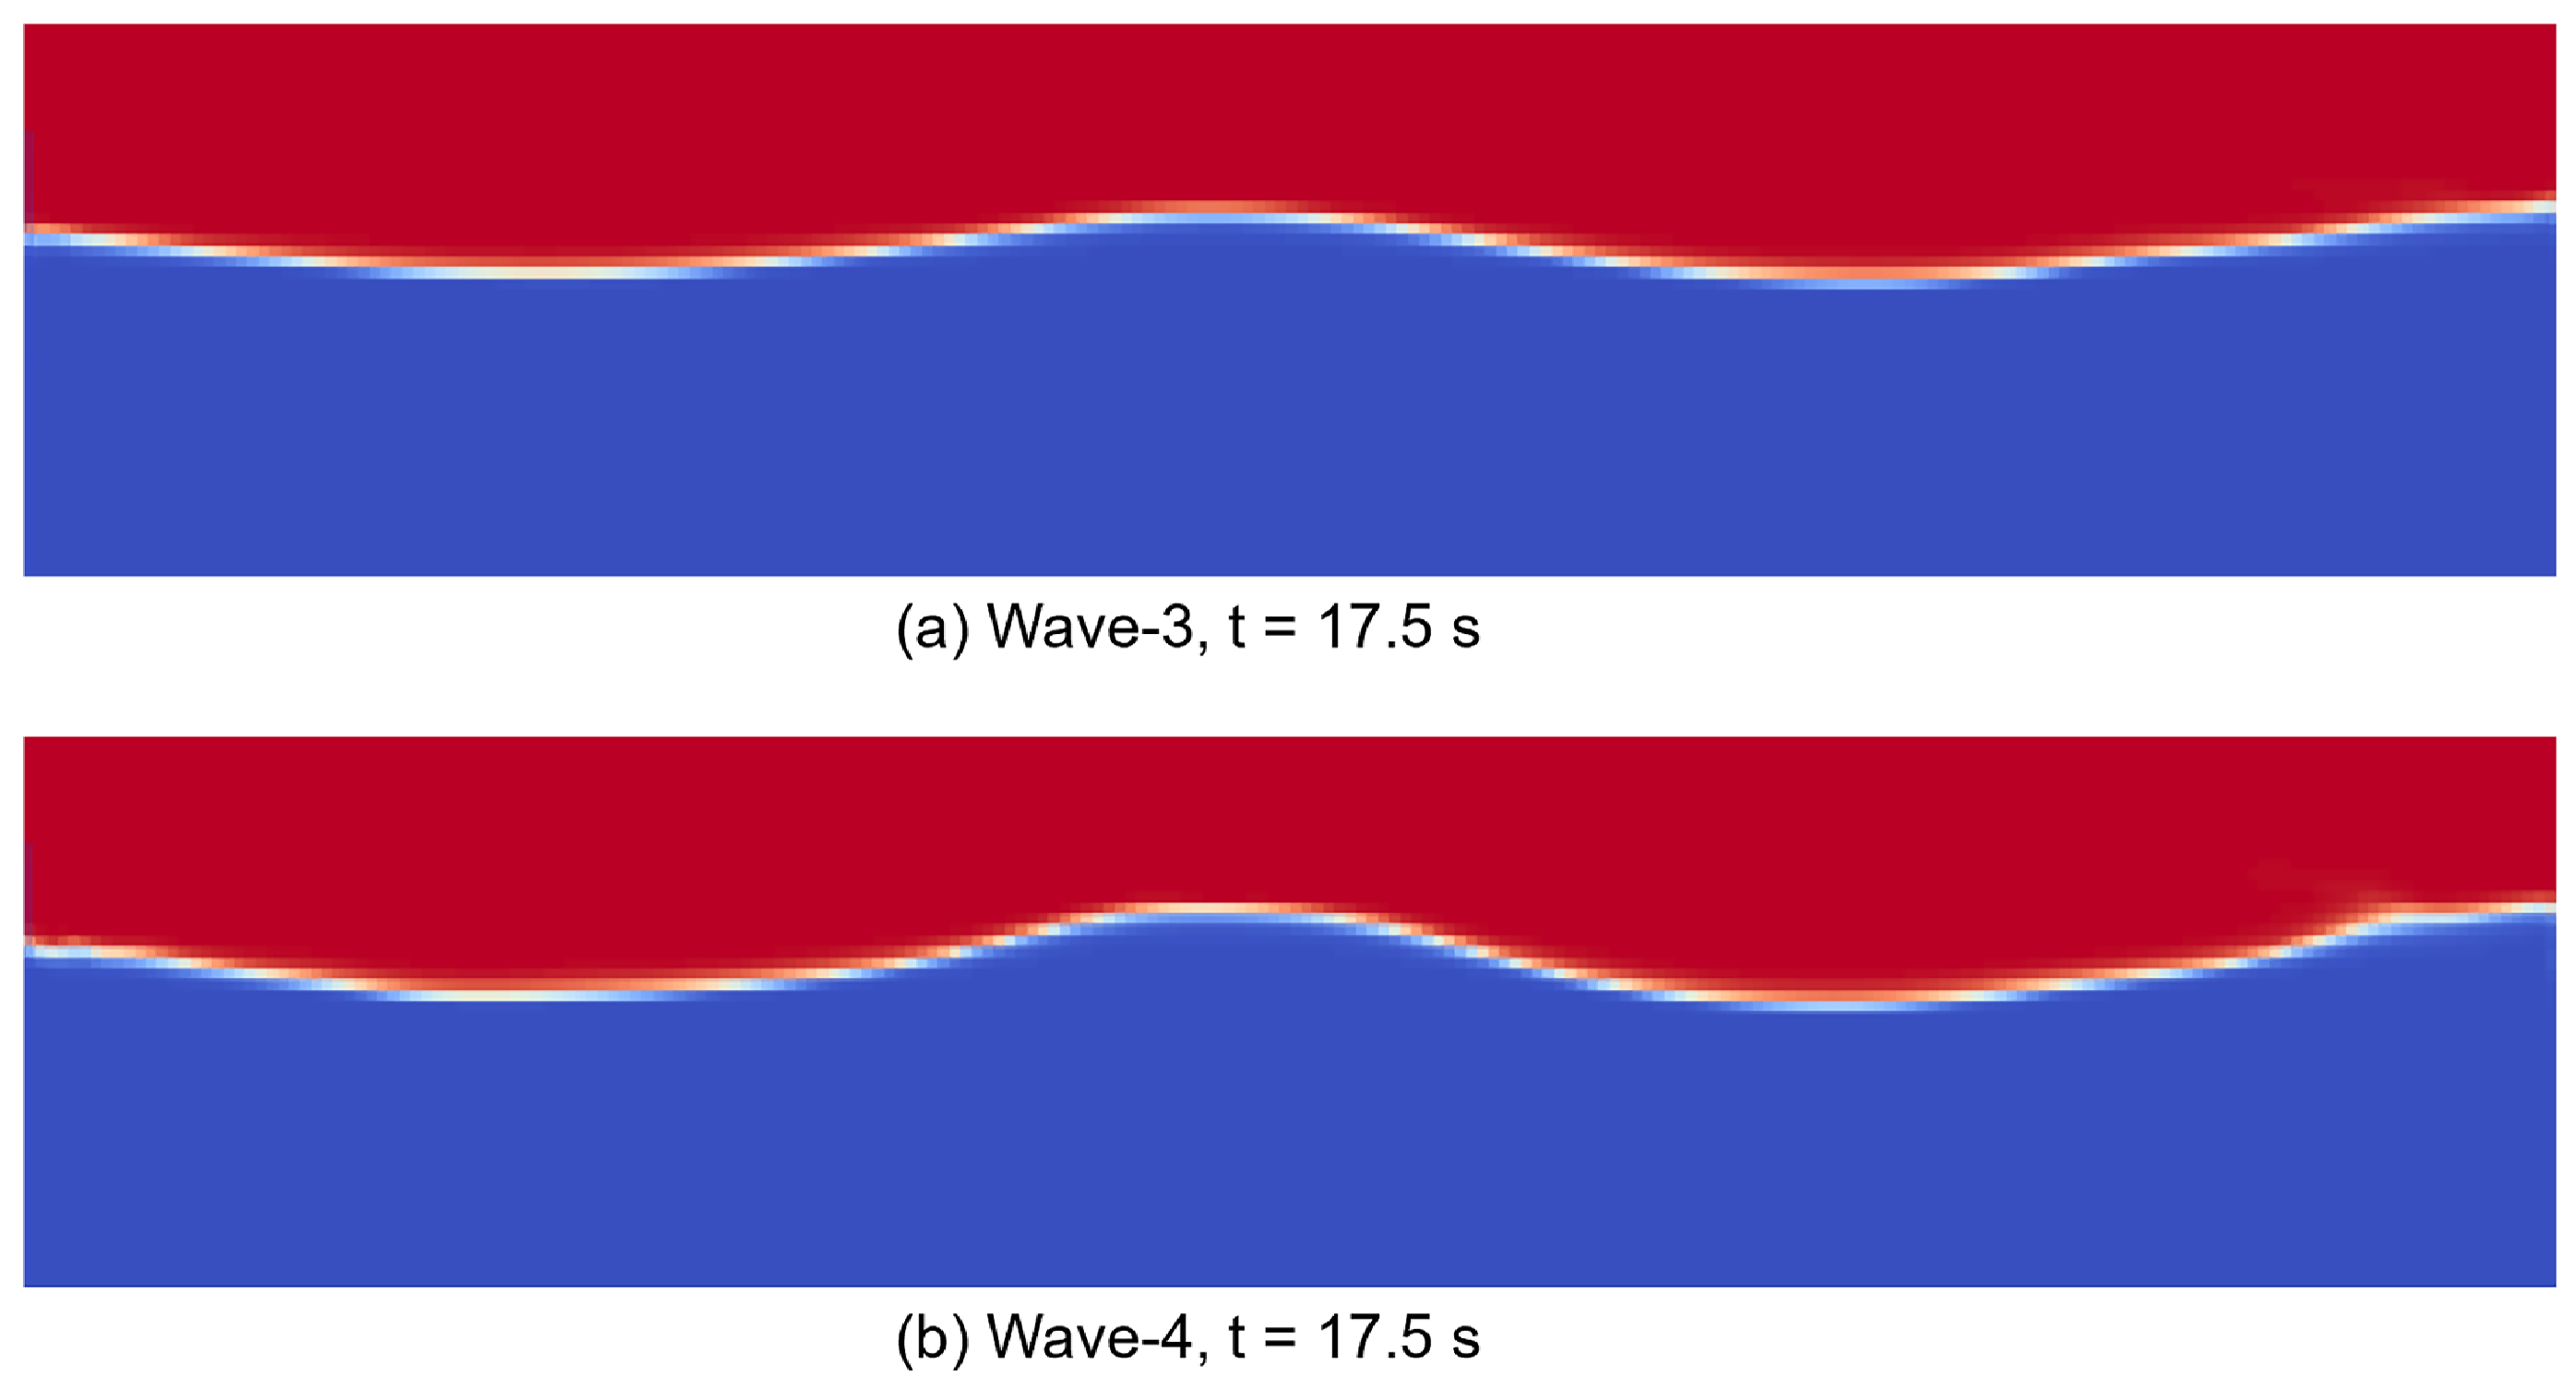
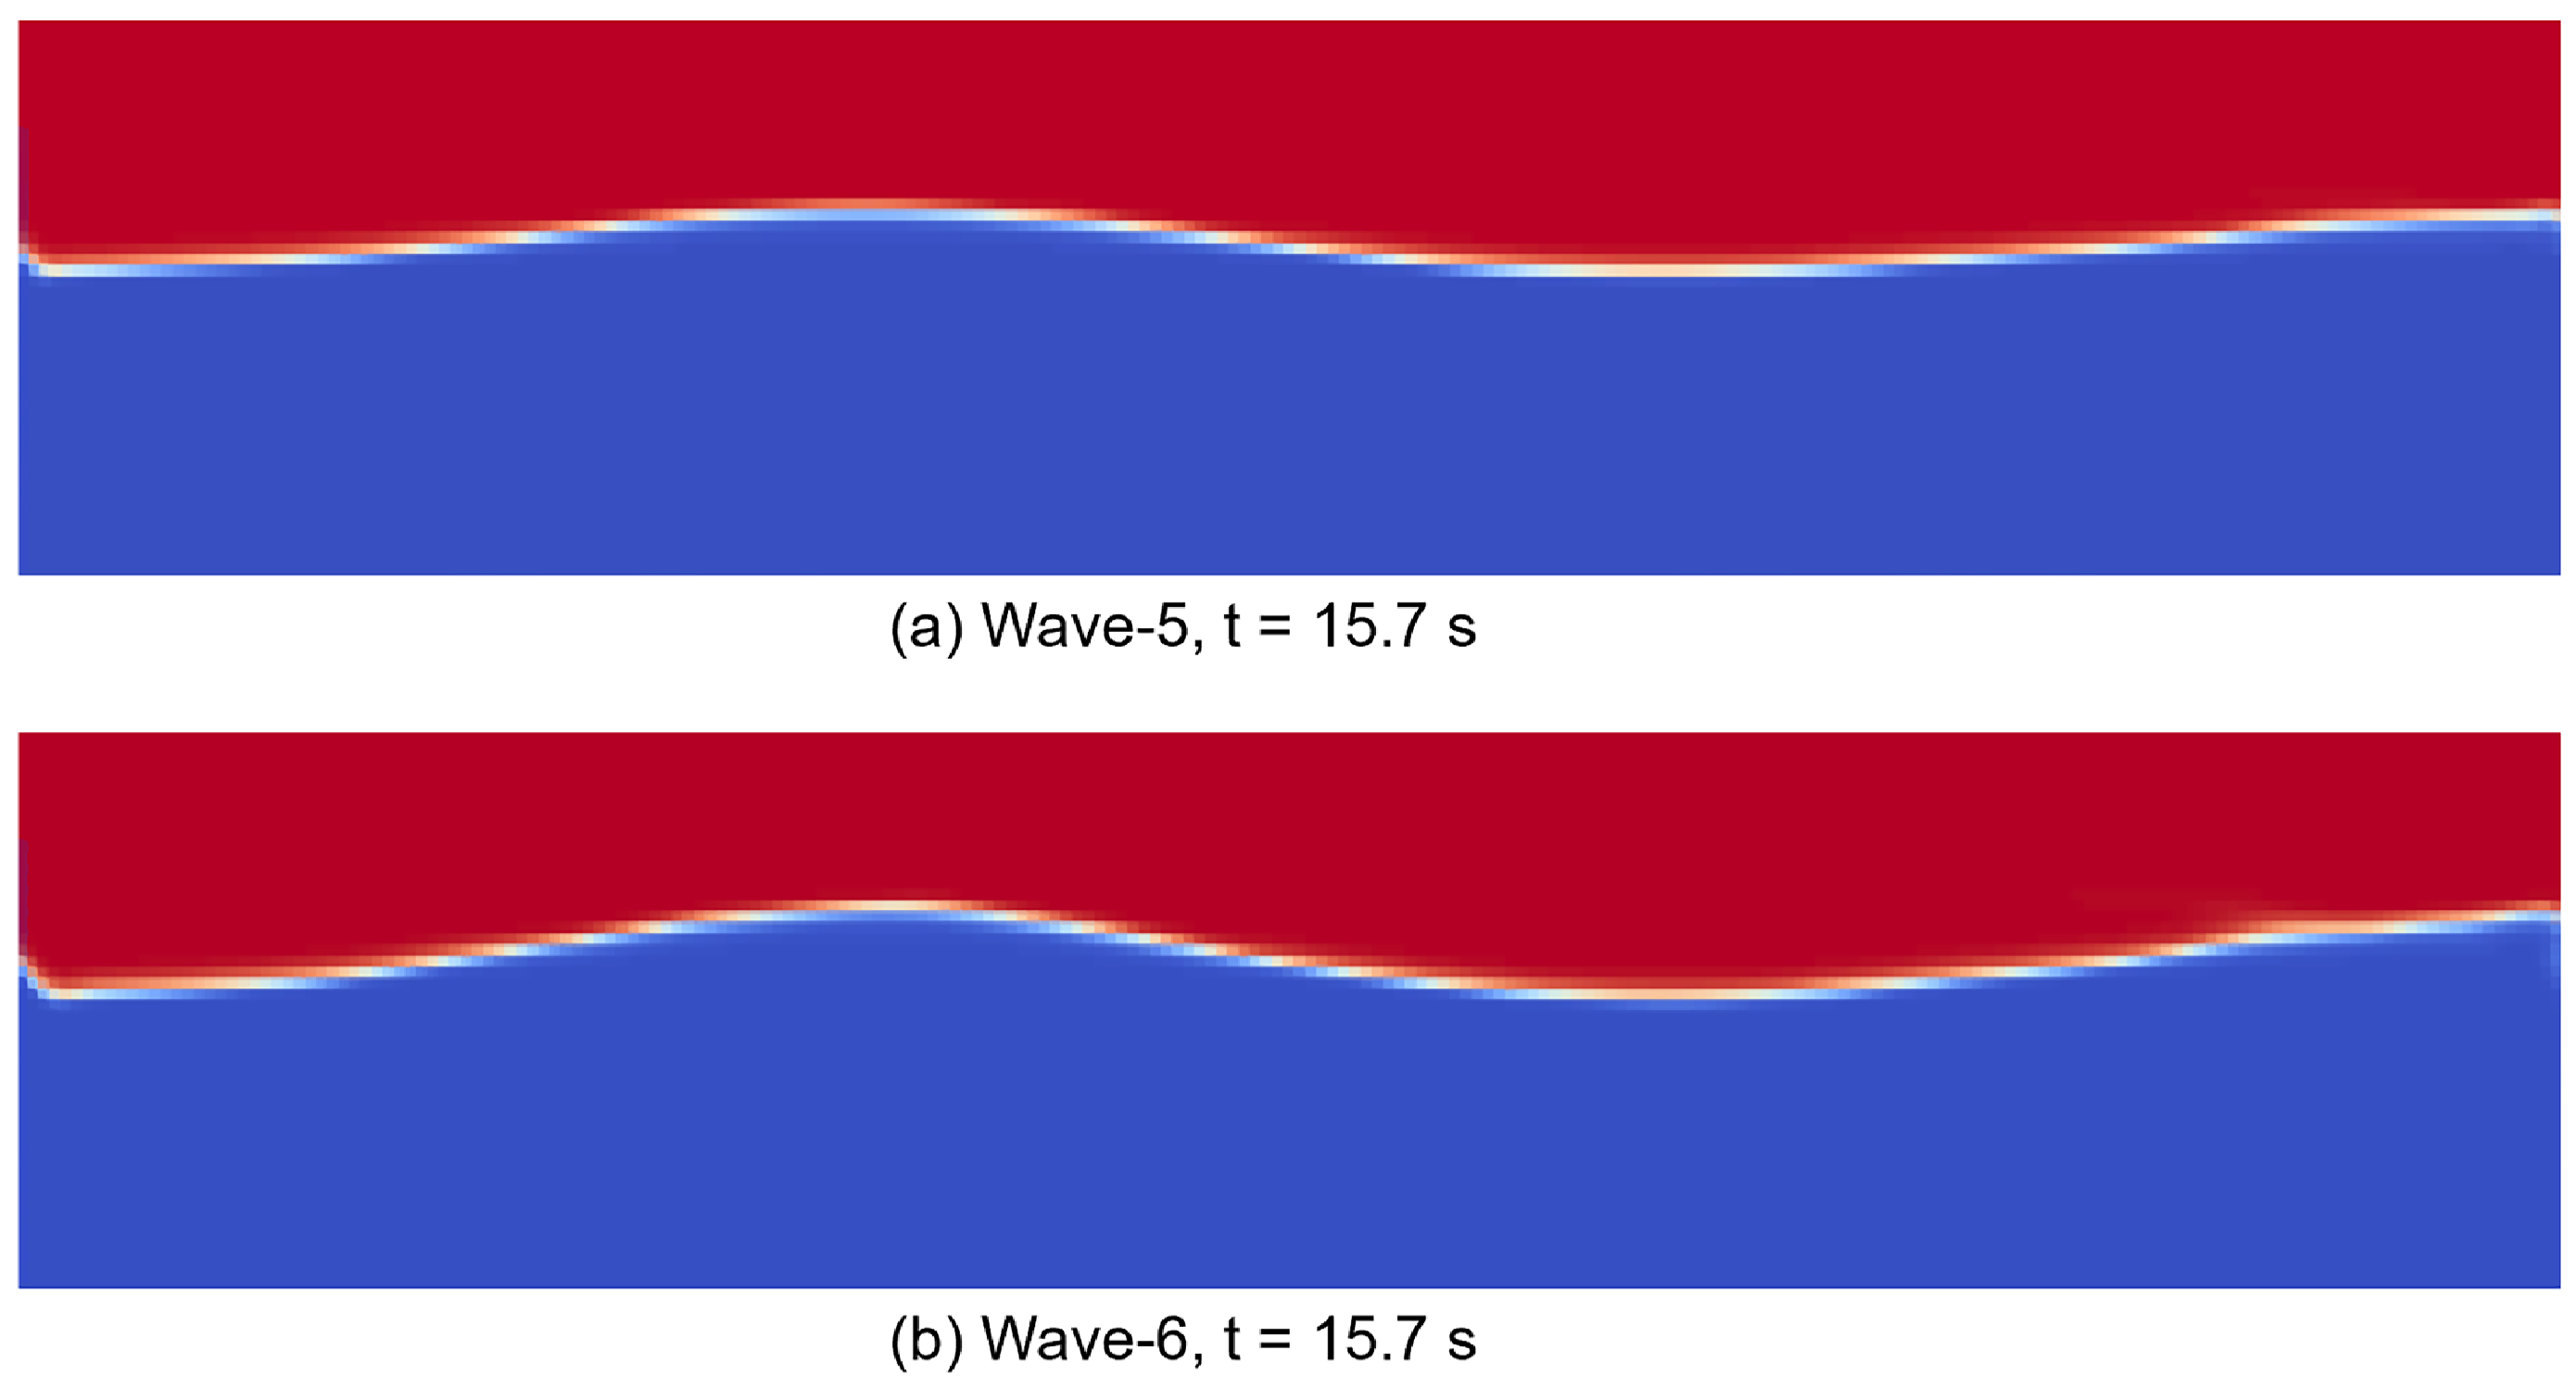
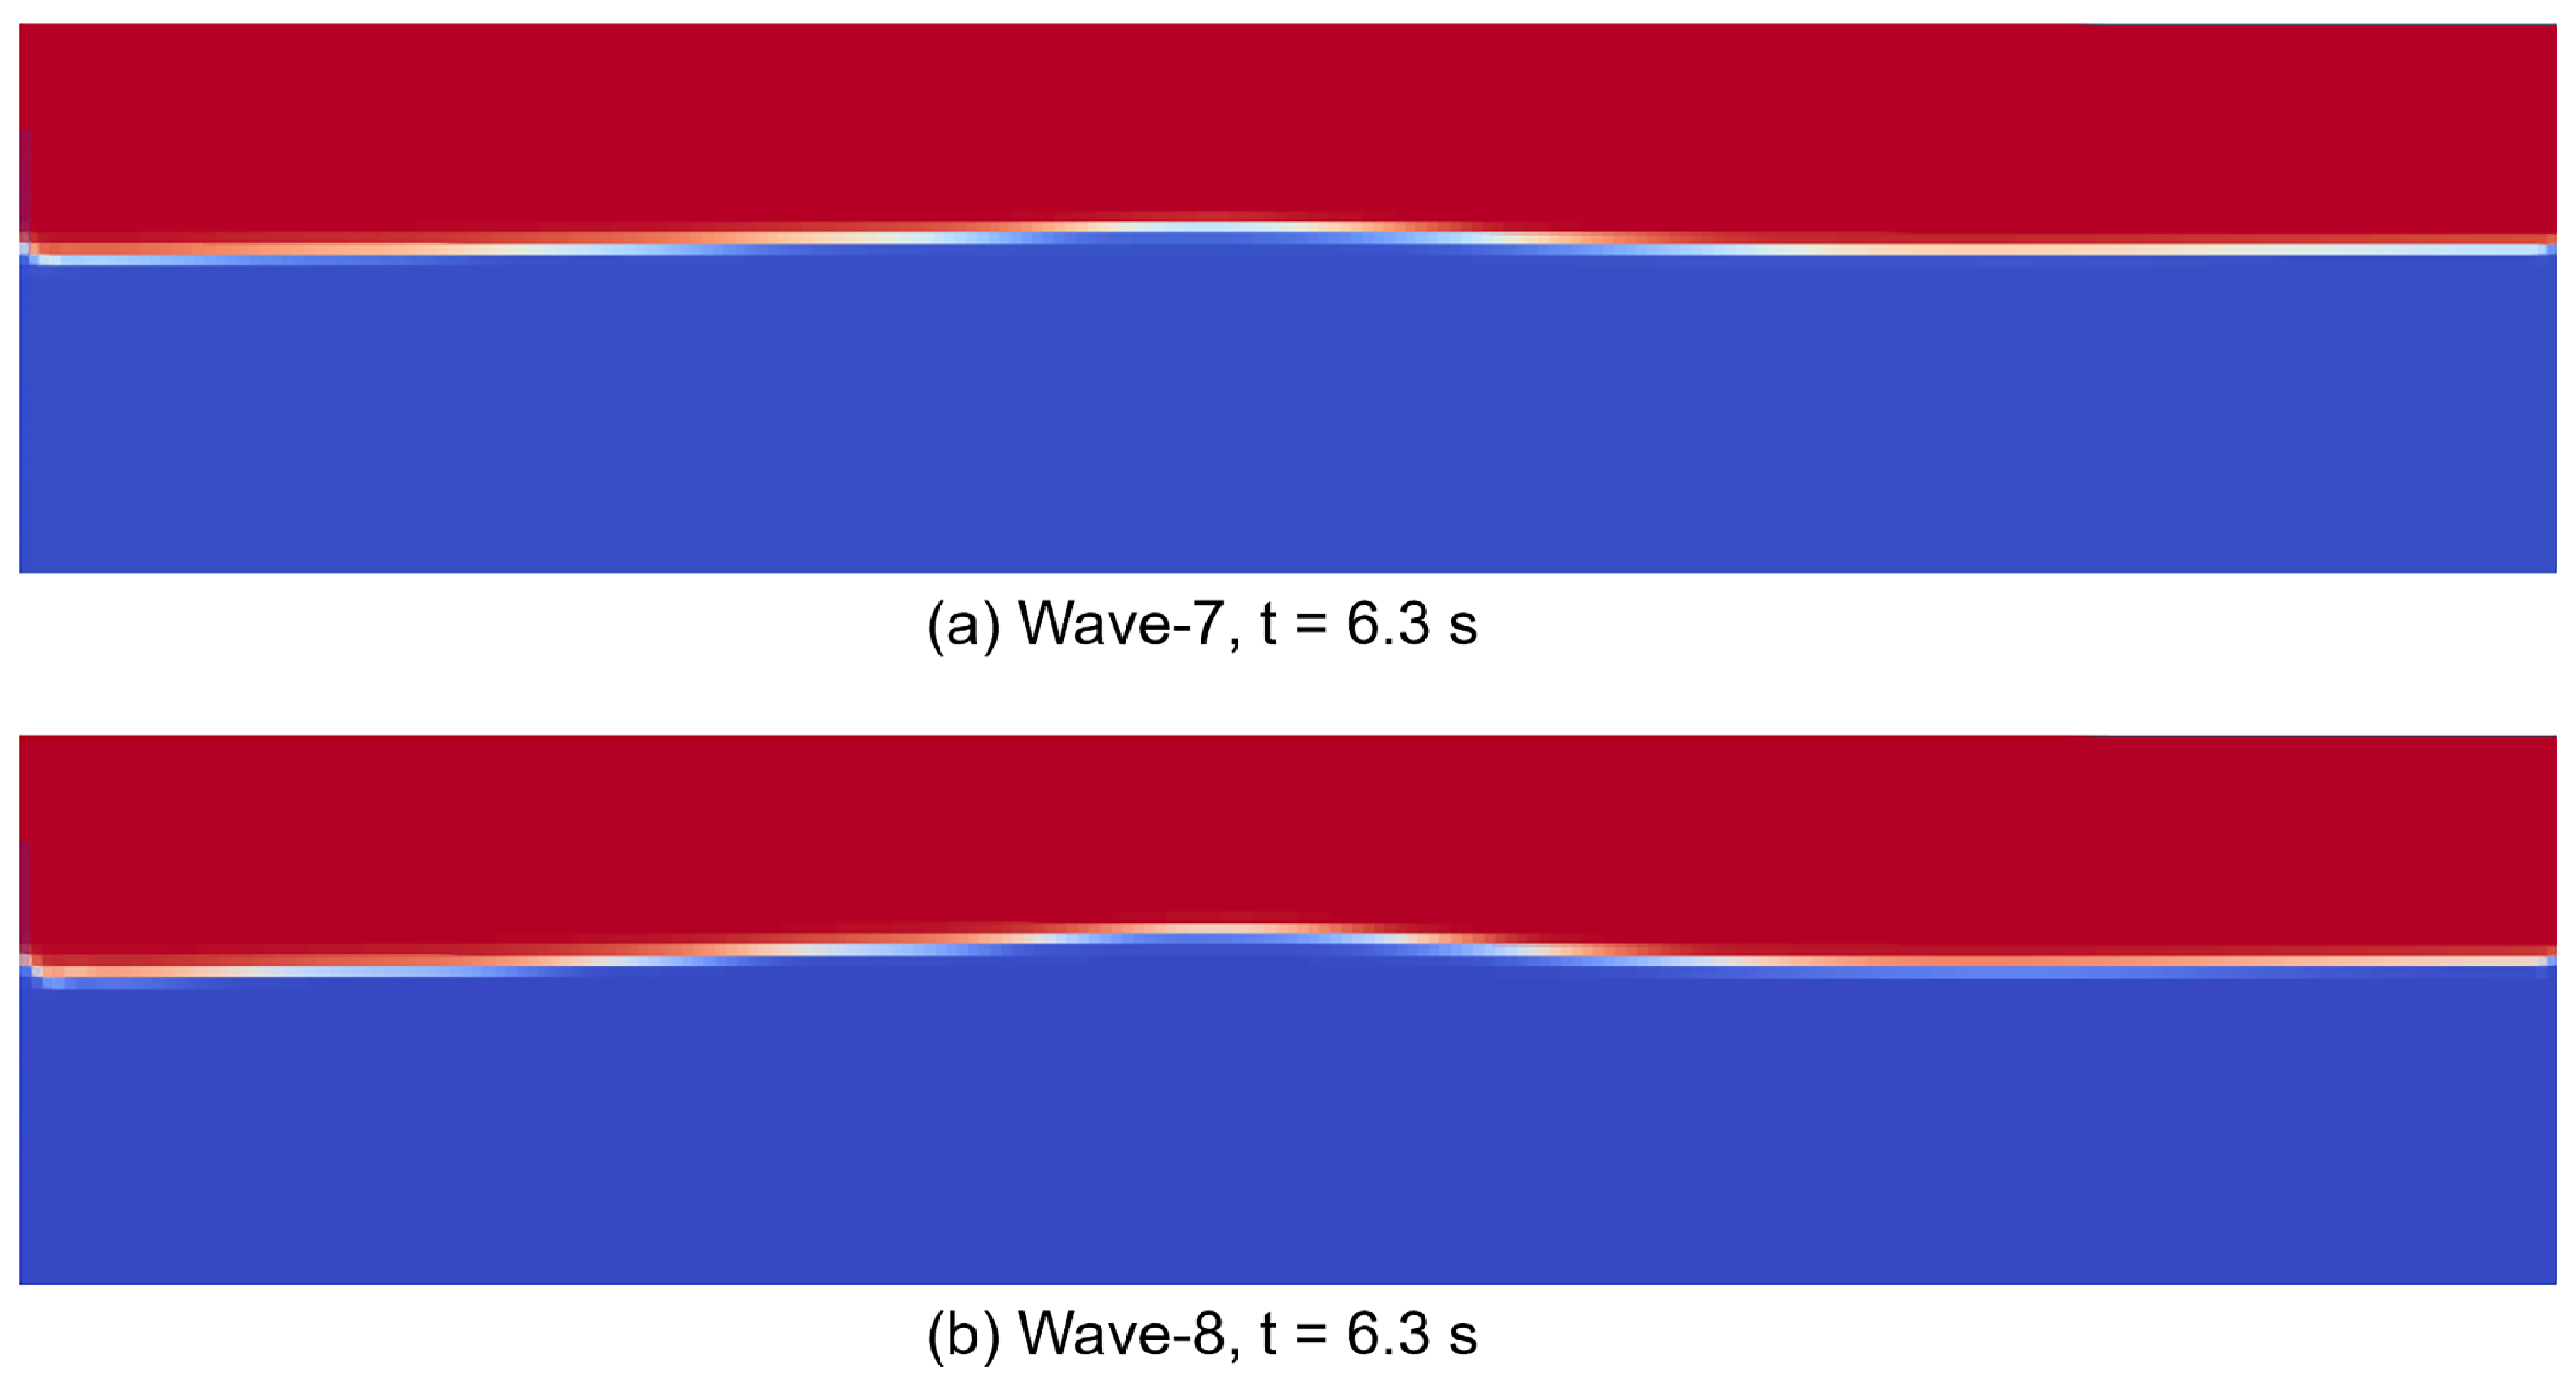
The four sets of target waves are, respectively, presented in
Figure 7,
Figure 8,
Figure 9 and
Figure 10. The measured parameters are compared, and it can be observed that the wavelength of the four sets of waves gradually increases. And within each group, a larger stroke increases the wave height.
The effect of introducing the damping zone to reduce the influence of wave reflection is verified prior to validation of the target waves. Four nodes are selected and their velocity history data are compared to verify the damping effect. Nodes
A and
B are a pair of neighbor nodes, while
A is in the left damping zone and
B is off the left damping zone. Same for nodes
C and
D, they are another pair of neighbor nodes, while
C is located at the entering side of the right damping zone, and
D represents the water particle that has just entered the right damping zone.
Figure 11 shows the velocity of the selected nodes, and the velocities of normal and damping nodes are compared.
Nodes B and C represent normally propagating water particles that have almost similar velocity data. As for node A and node D, which are in the damping zone, the damping effect dissipates the energy of the water wave, resulting in a drastic reduction in the velocity in the Z-direction. And no significant standing wave phenomenon is observed. The incorporation of the damping zone effectively suppresses the effect of wave reflection on the target waves.
The parameters of the generated target waves were measured and compared with the analytical solutions. The errors of the numerical wave flume model in generating effective waves with respect to the theoretical values were derived as follows in
Table 3. During the measurement process, parameters at several time spots are measured and their average value is taken as the reference value.
The error rate in the wavelength of the target waves is basically maintained at a level of less than 3.3%. The errors in wave height were more noteworthy, fluctuating between 4.3 and 6.5%. In this study, the simulated target waves are considered acceptable and have met the theoretical expectations.
5.2. Impact Wave Loads
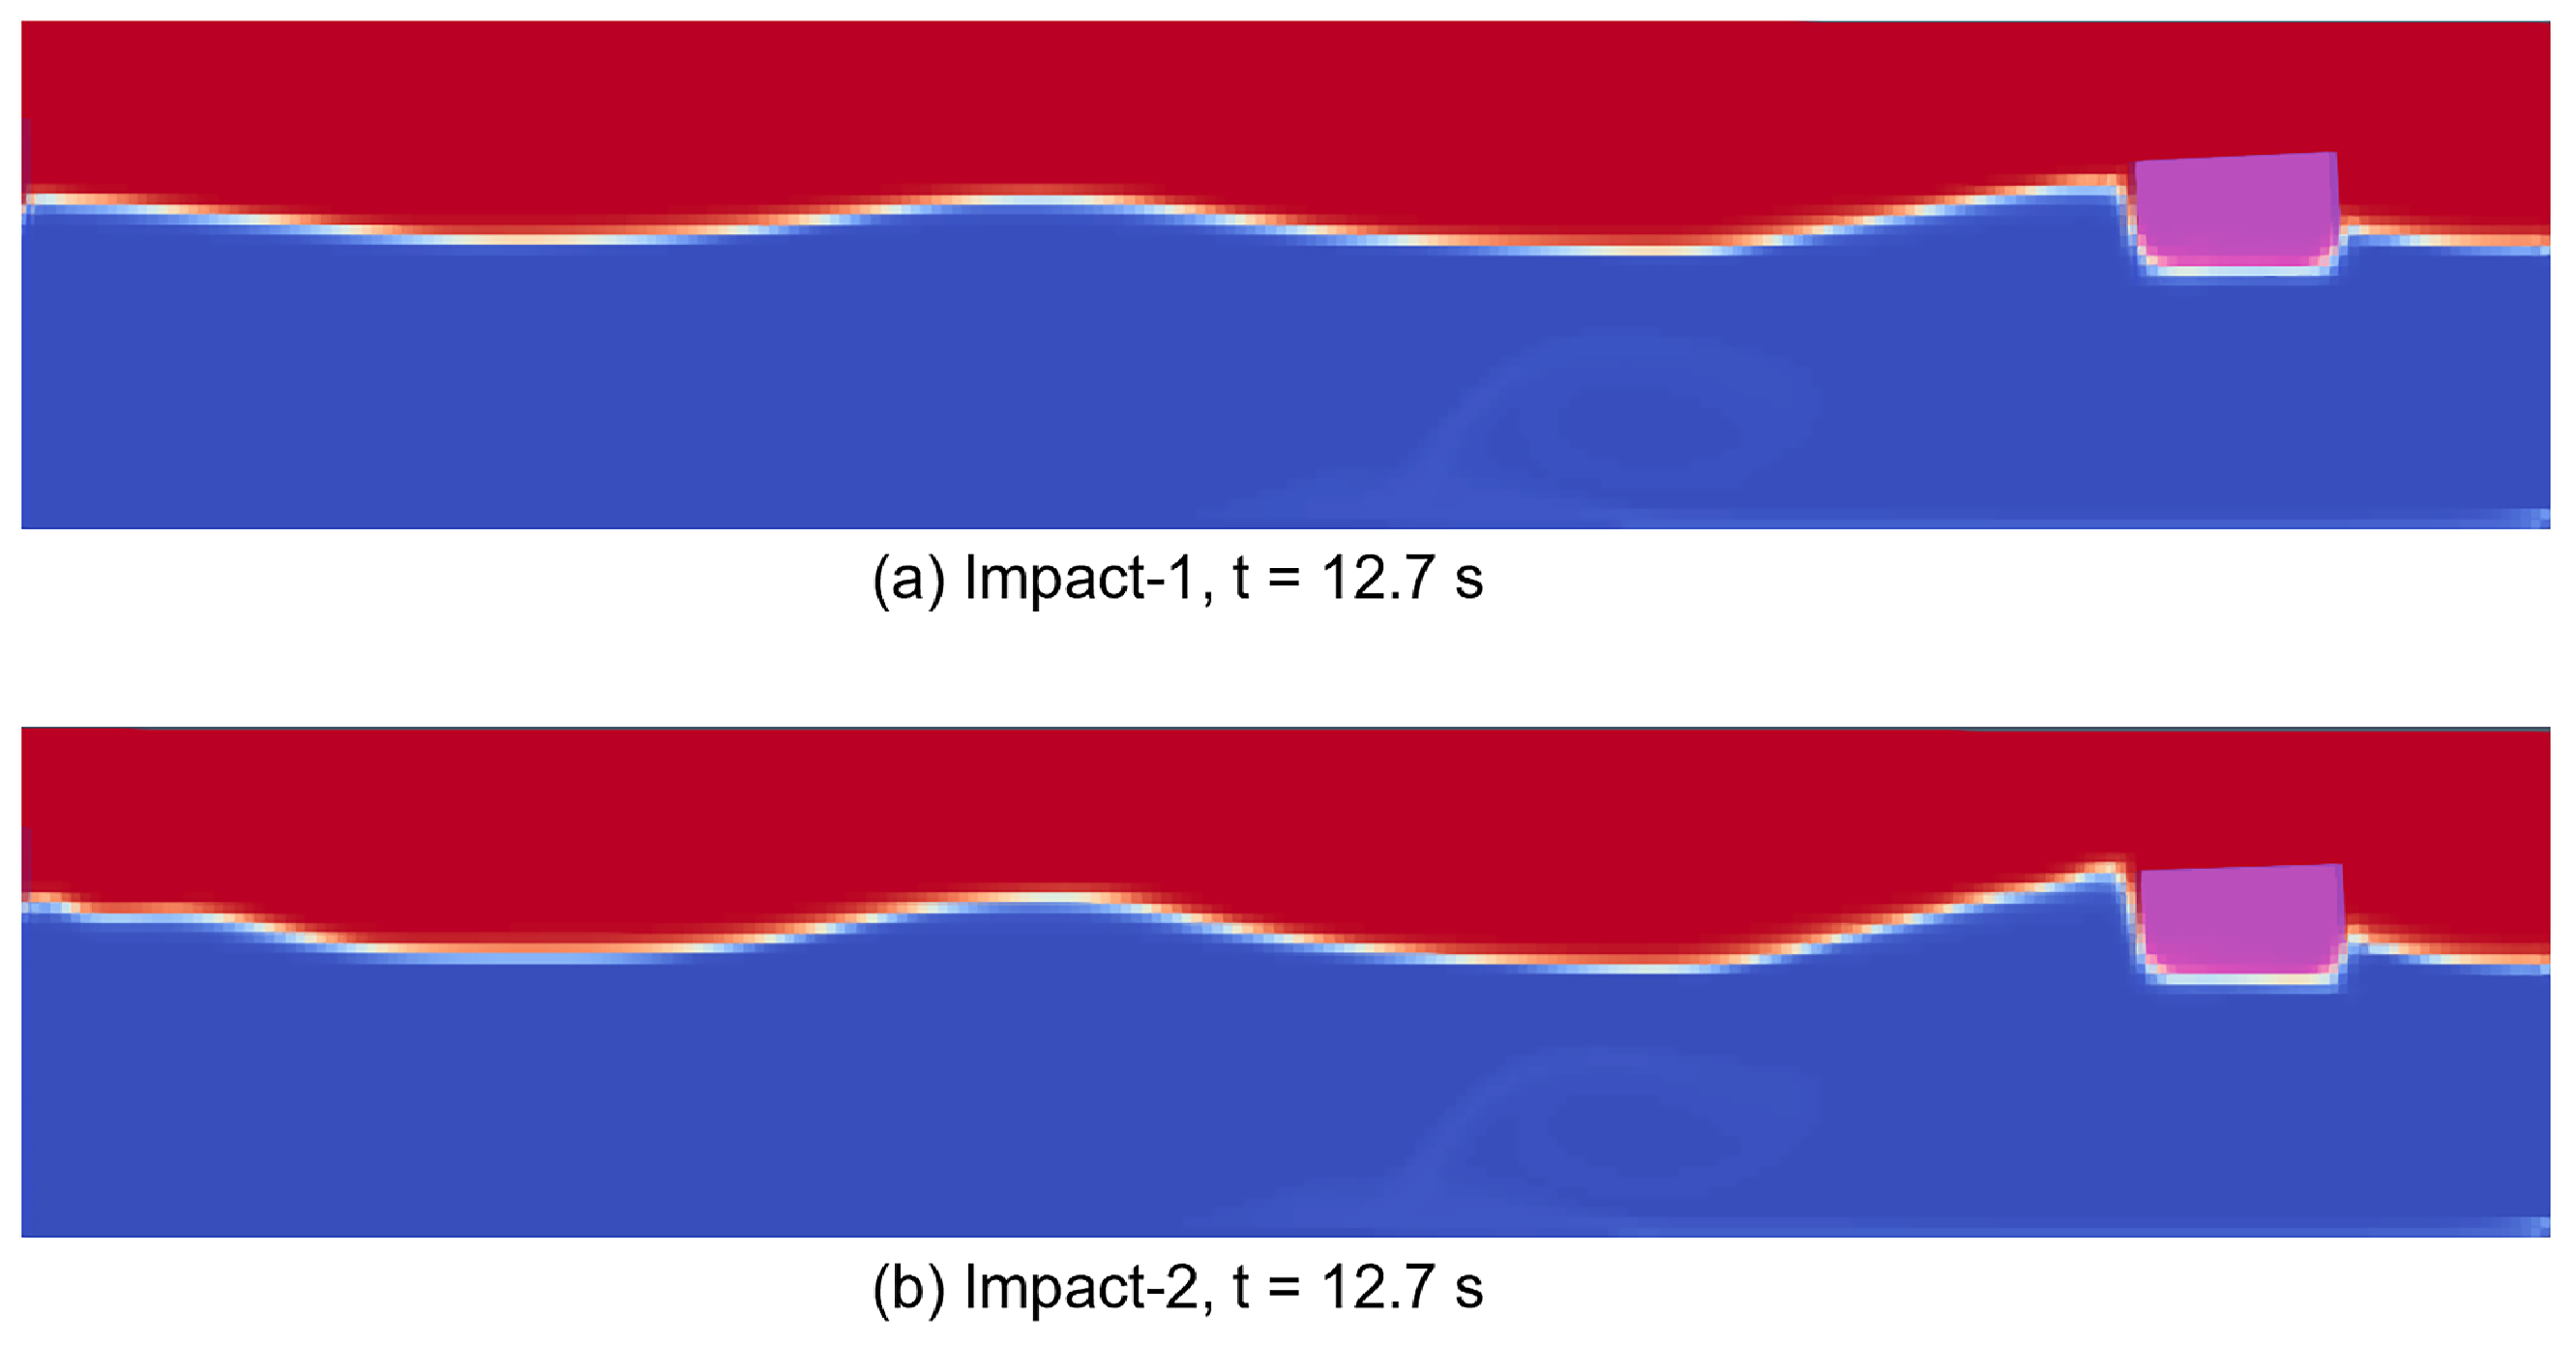
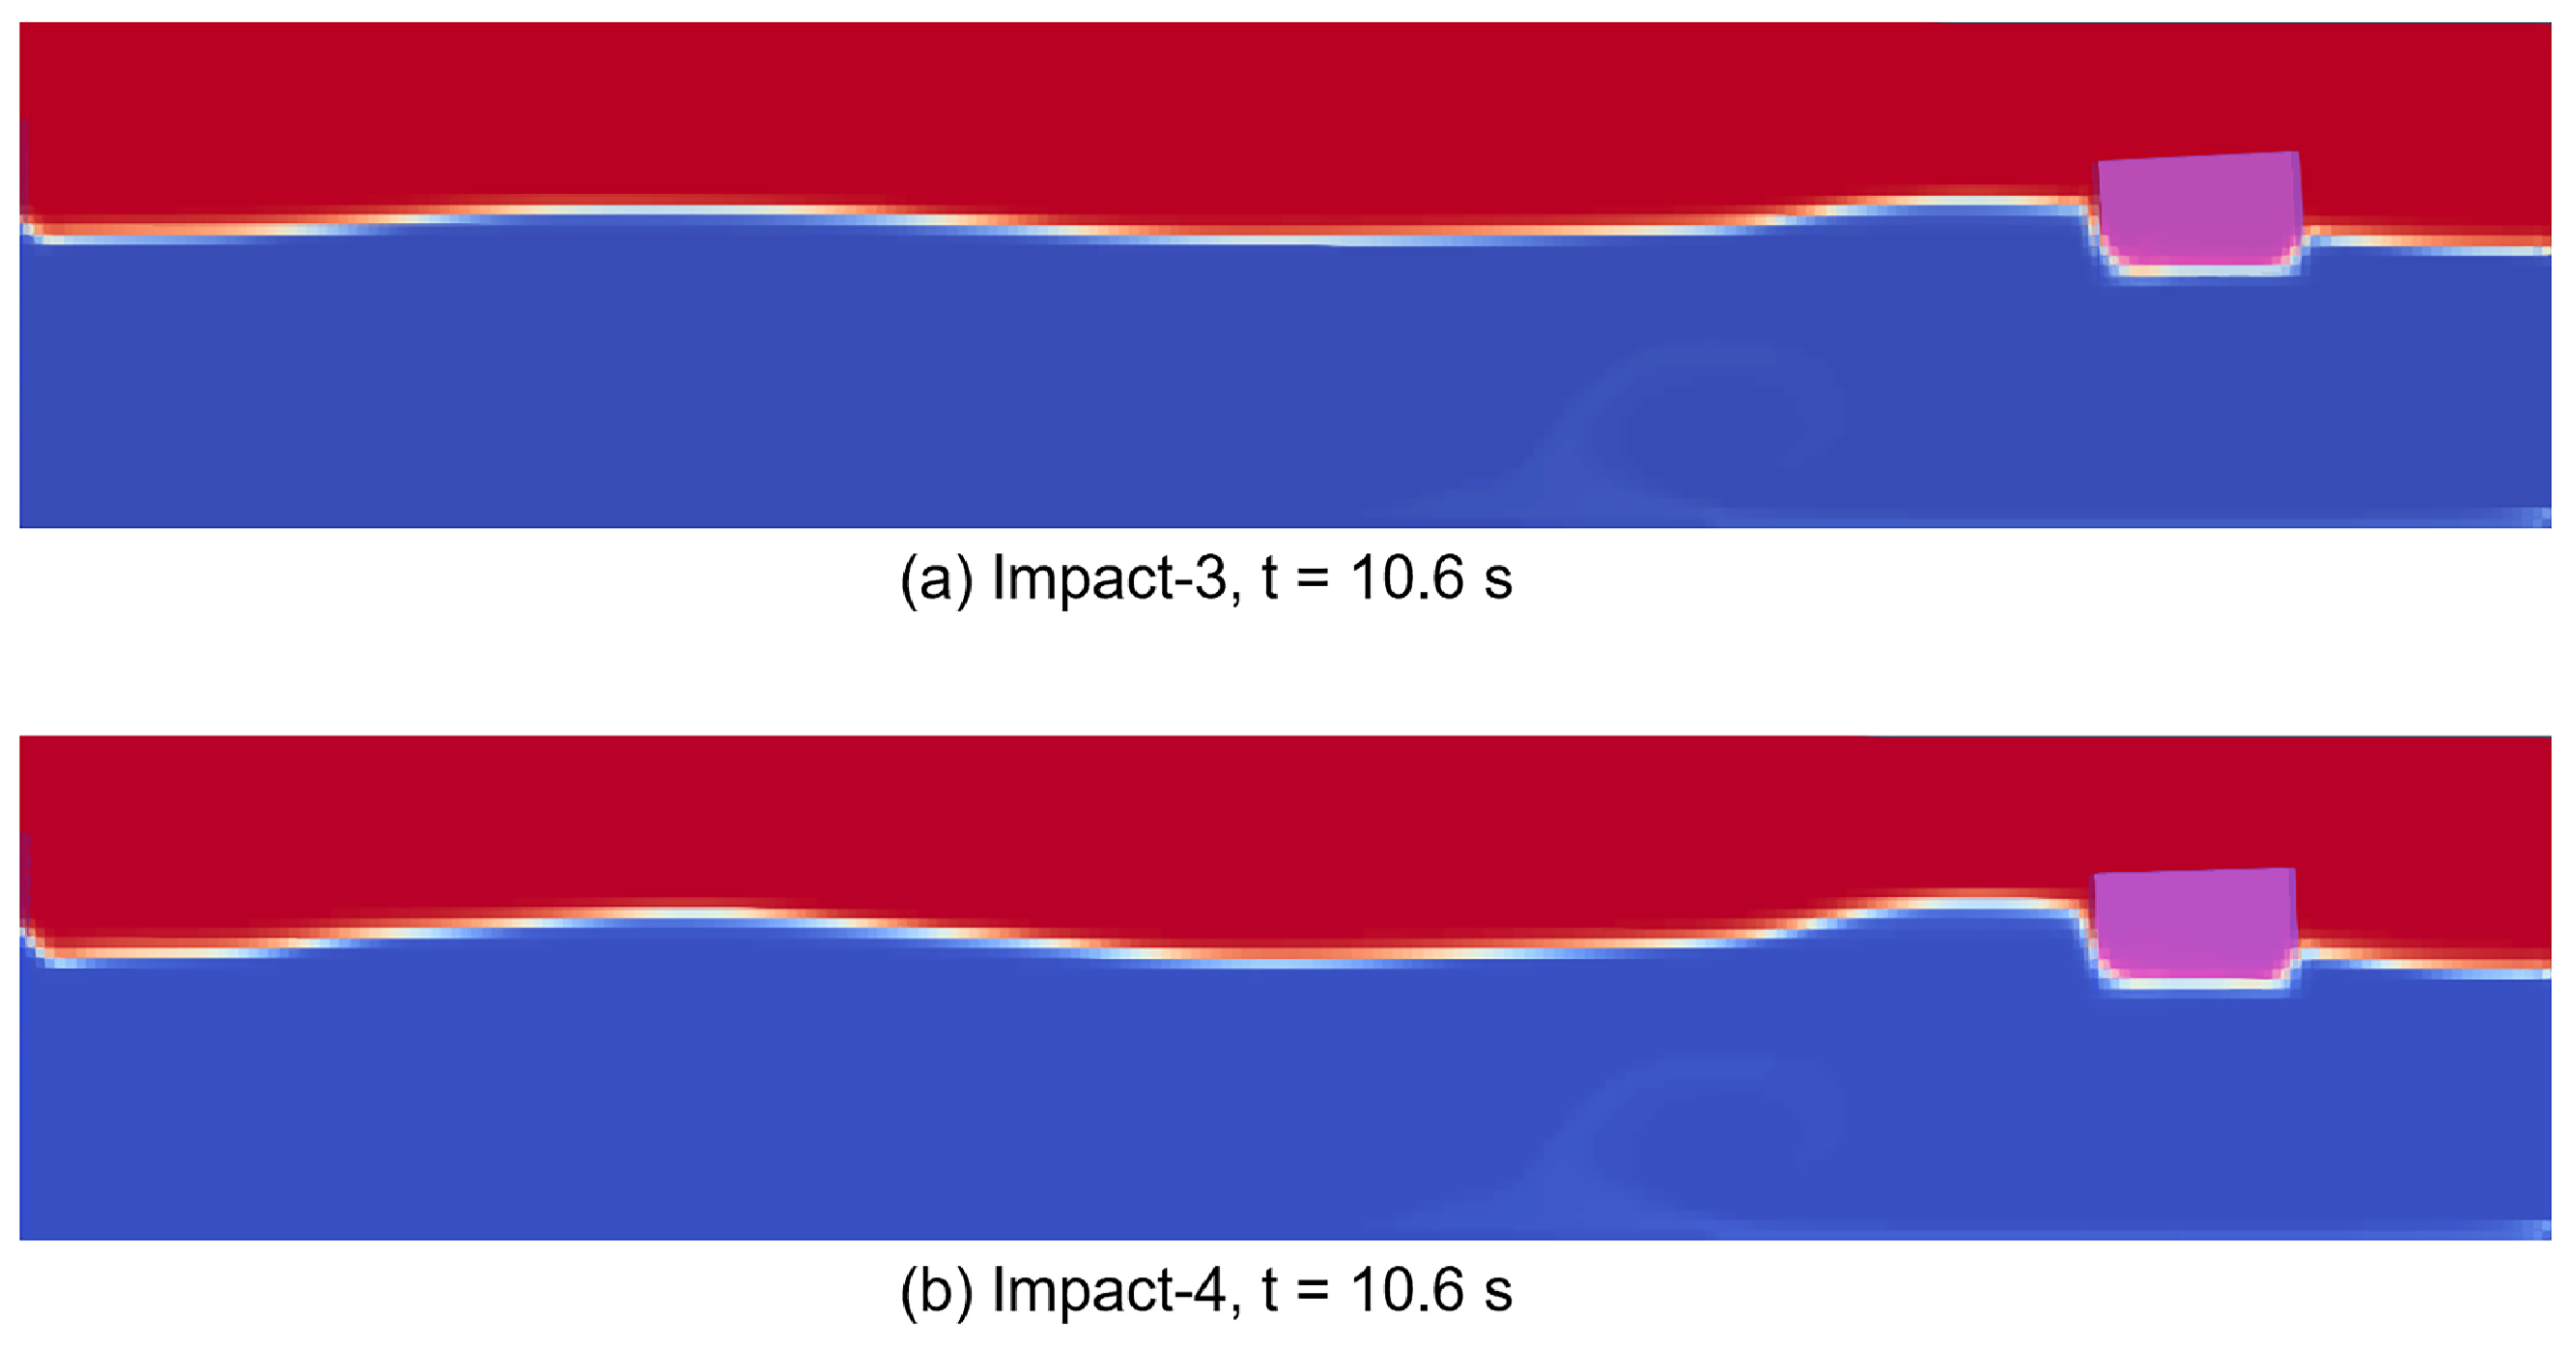
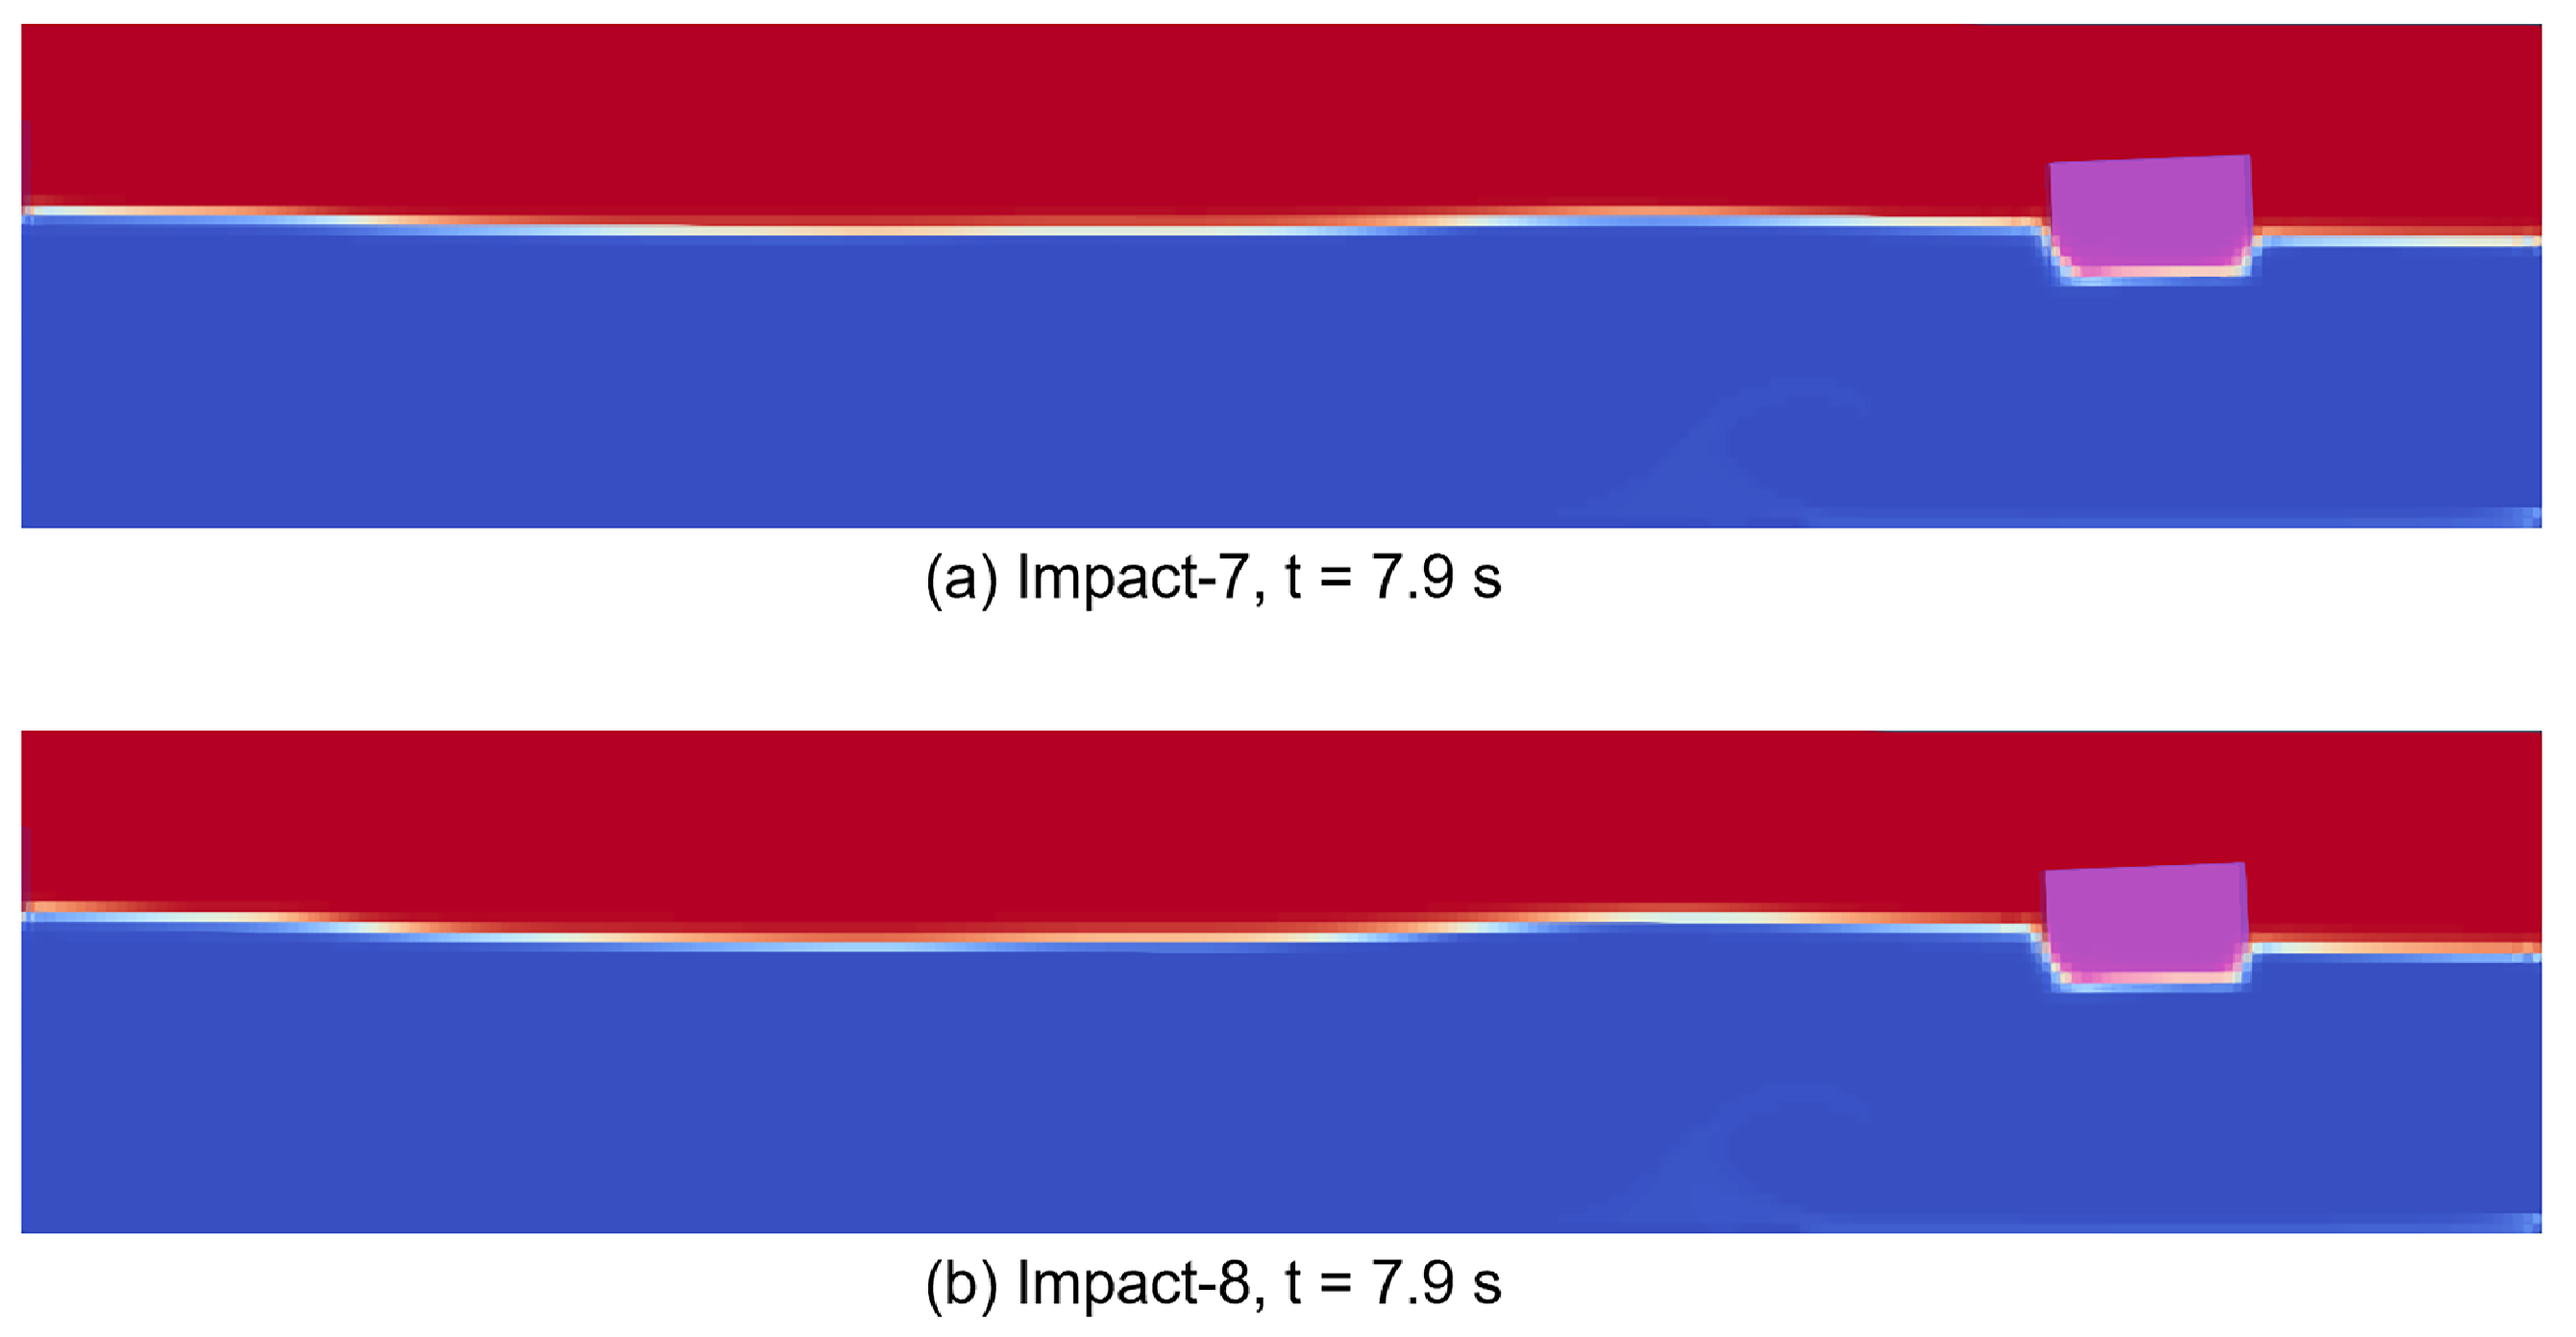
The coupled structure is a cubic body. This geometry is chosen for computational economy. A part of the structure is submerged in water, this submerged depth coincides with the depth of the draft caused by the weight of the structure. Thus, at the beginning of the simulation, the structure is stationary in the water without causing disturbing water waves. And the height of the part above still water level is 0.8 m. This simulation scenario can be considered as the impact of waves on a floating object such as boats and surface vehicles. The following figures,
Figure 12,
Figure 13,
Figure 14 and
Figure 15, present different wave impact scenarios on the structure.
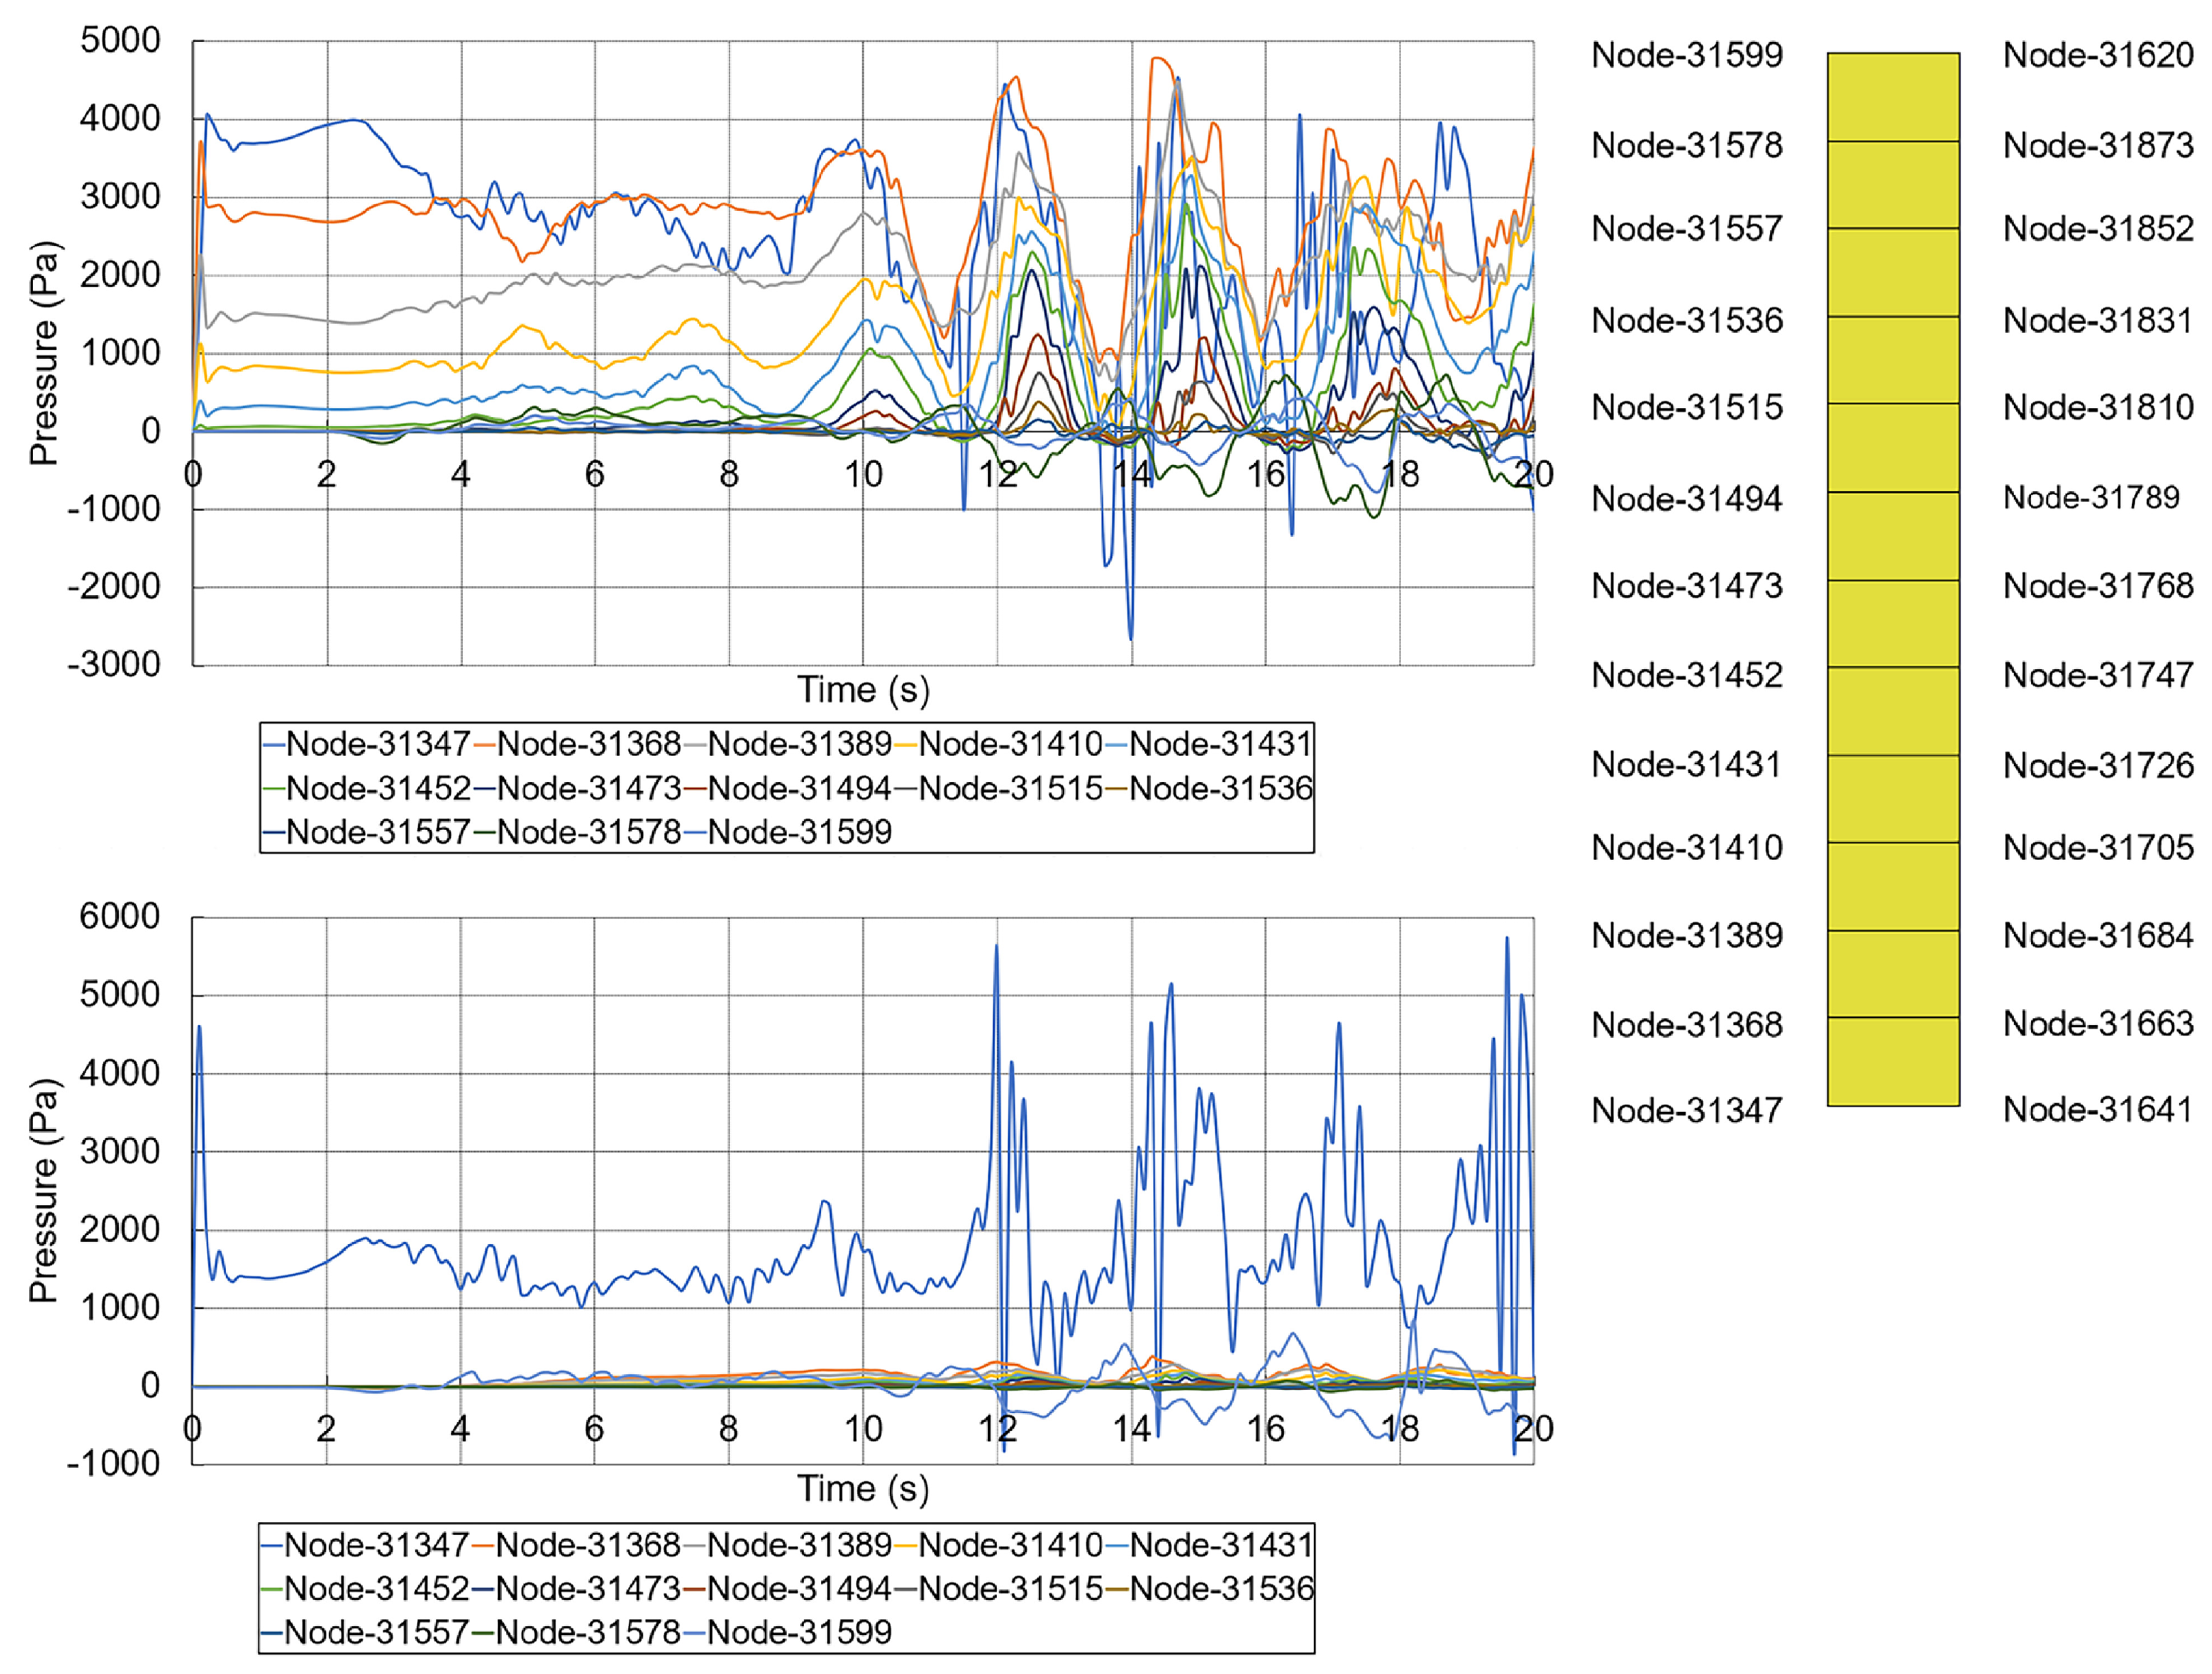
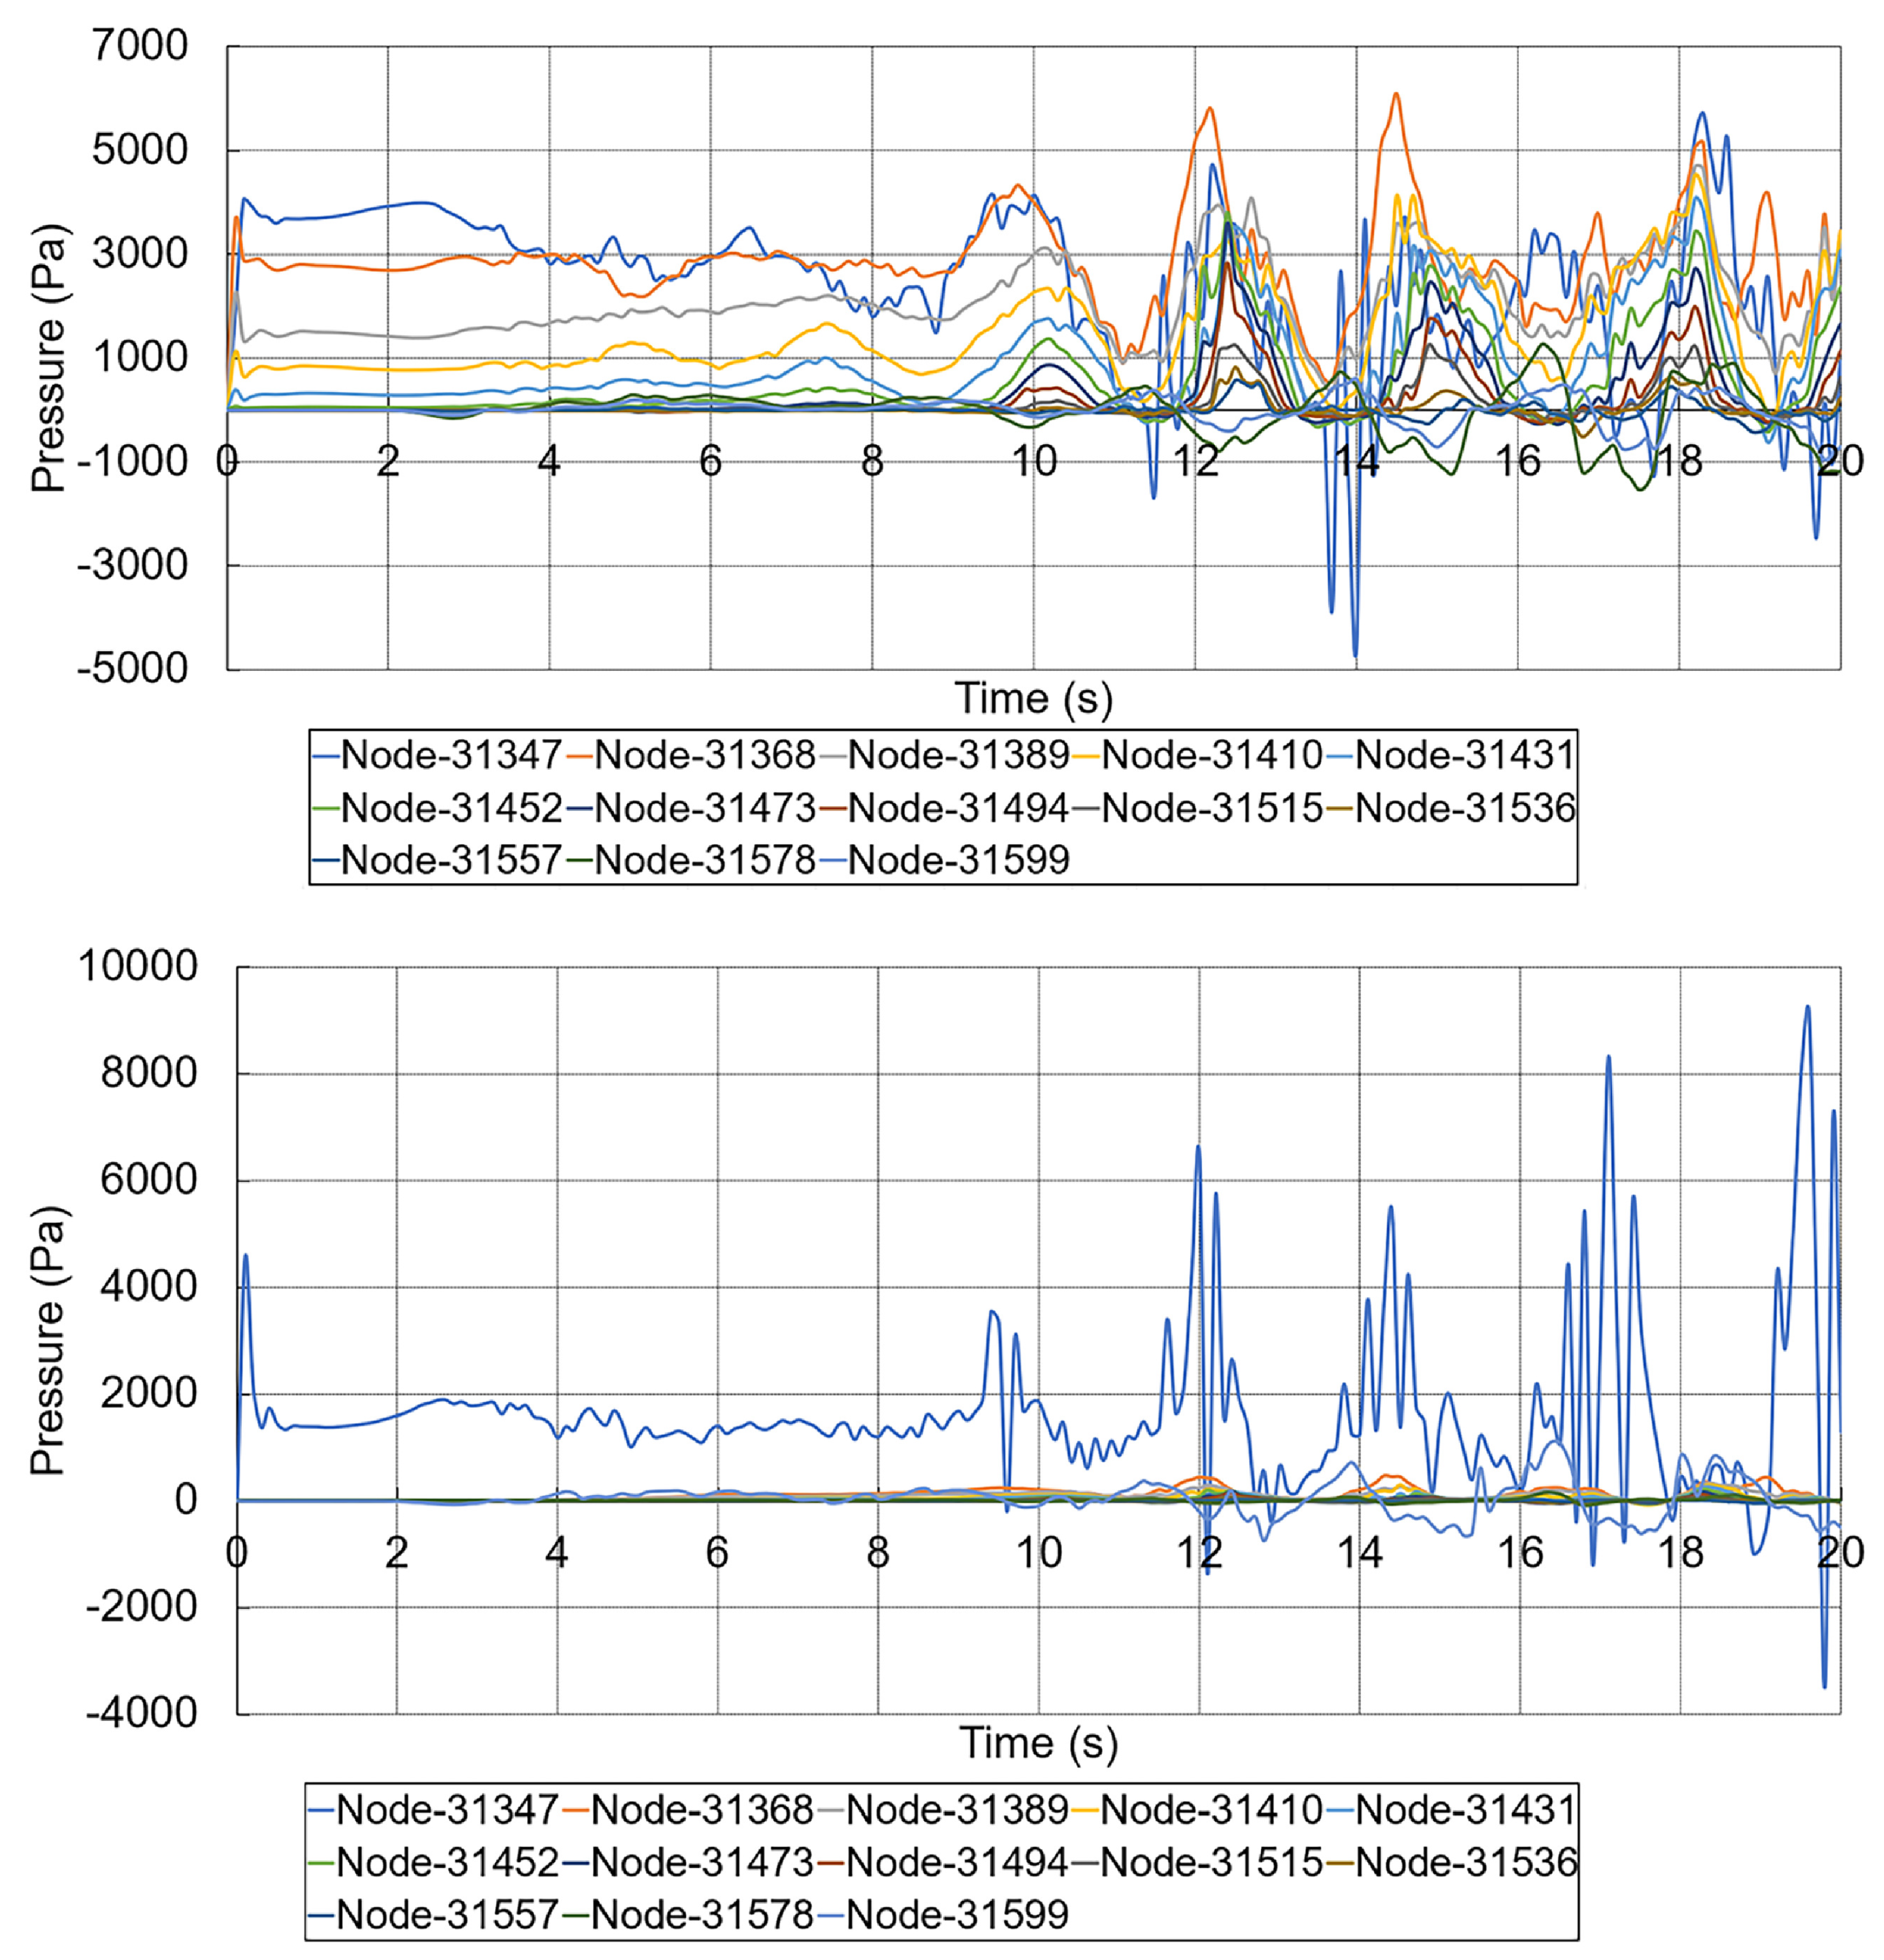
The normal contact pressure (Pa, pascal) in the X-direction and Z-direction is computed at the impact interface.
Figure 16 presents the historical data generated by the target wave
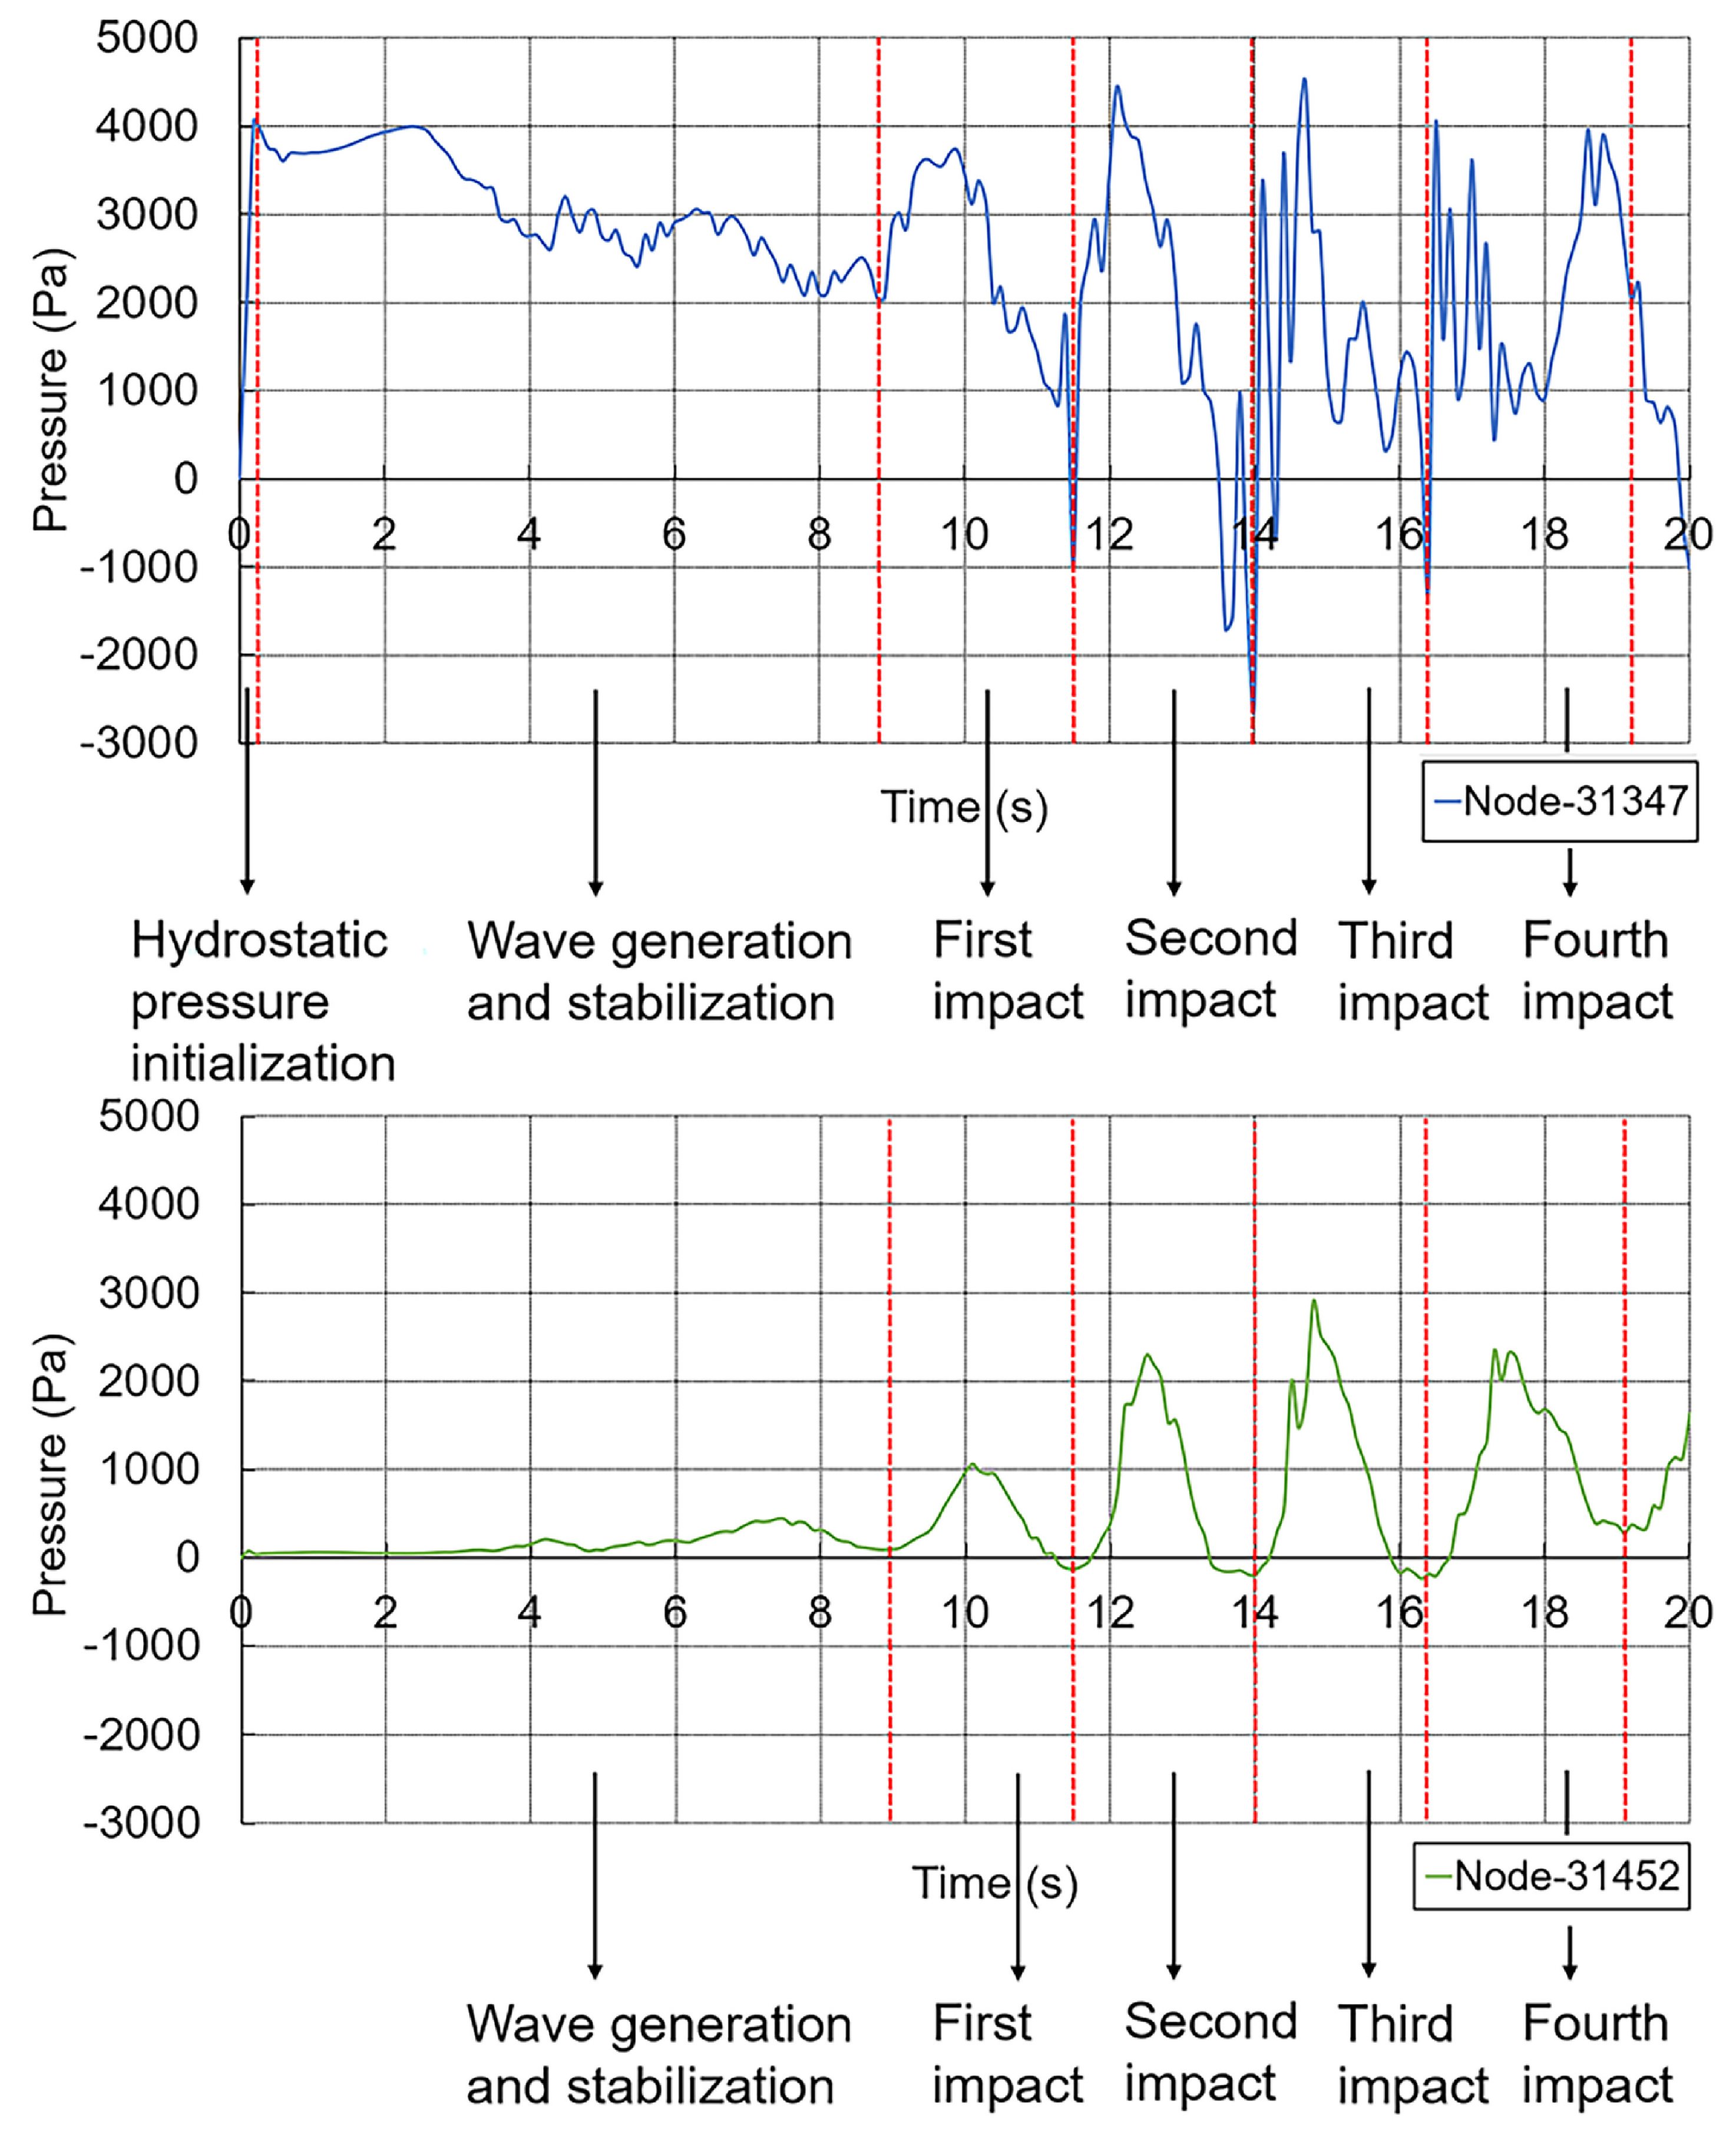
. The pressure calculation is about nodes on the impact face of the target. Due to geometric symmetry, the figure shows the pressure data only on one side. It is important to note that the nodes 31347, 31368, 31389 and 31410 are initially submerged in water, and the nodes above node 31431 can be considered to be above the still water level.
Taking the example of the bottom node and a node that is initially in a position above the free surface, we can easily distinguish between the different phases of the impact based on the load data. The bottom node, as it is submerged in water, undergoes a rapid initial hydrostatic pressure phase at the beginning of the simulation, with pressure values that correspond to the draft depth of the structure. Then, the wavemaker starts the movement and the generated waves become gradually stabilized, which is the wave generation and stabilization phase. Next, the impacts follow. The structure experienced a total of four impacts in the simulated time. In contrast, hydrostatic pressure initialization is not required for the node located above the free surface, which undergoes the same four impacts after the wave has stabilized. The different impact phases of these two nodes are indicated in
Figure 17.
According to the mechanical characteristics of the structure, the peak value of the impact pressure in the X-direction is 4783.337 Pa on node 31368. And in the Z-direction, only the bottom node 31347 is subjected to high pressure loads, the peak value is 5741.385 Pa. This is due to the posture changes of the structure. In contrast to the average wave height of 0.496 m for wave
, the measured average wave height for wave
is 0.880 m. Therefore, the peak value of the impact pressure in the X-direction of the wave
is 6091.363 Pa on node 31368, and the peak value of the impact pressure in the Z-direction is 9122.550 Pa, always on the bottom node 31347.
Figure 18 presents the data related to wave
.
The measured parameters of target waves and the corresponding X-direction and Z-direction impact pressure data are given in
Table 4.
Cross-comparing these data, in this case of a floating and movable structure, the wave loads are not only affected by the wave height. A longer wavelength does not result in higher waves loads due to smaller water flows in a longer period. Of course, the effect of the wave height is obvious, as a major factor affecting the wave loads compared to the wavelength.
The load calculation in this model is based on the contact algorithm of the penalty method, so it is crucial for the stiffness factor between the target structure and the fluids to be appropriate. Two criteria are used to determine the stiffness factor value: least possible penetration of the fluid into the structure, the conformity between the hydrostatic pressure on the bottom node of the structure and its draft depth. These two criteria are respected by all impact simulations.
6. Discussion
In this study, the ALE formulation is used to conduct modeling of a numerical wave flume. Linear waves are generated using a piston-type wavemaker, and damping zones are integrated to minimize the effect of reflected waves on the target wave profile. A number of wave generations are performed and the error rate of the wave heights is within acceptable limits, thus validating the potential of the ALE method for realizing different water wave phenomena. The ALE method is an effective means to study the FSI problems, an elastic structure is coupled and placed in the numerical wave flume for wave impact simulations. Two criteria for the determination of the stiffness factor are proposed. The corresponding wave loads are first computed, and the posture changes of the structure are presented. The load data and the dependence on the corresponding wave parameters are discussed, noting that wavelength affects the wave loads and that wave height acts as a major parameter affecting the impact calculation. Based on wave impact simulation, the intensity as well as the frequency of cyclic loading on the structure under different sea states can be determined in order to perform fatigue behavior studies on materials.
In comparison with other related ALE simulations, the constructed models provide a more realistic representation of physical scenarios, such as the consideration of buoyancy and initial position of the structure. The position of the wavemaker is set not too close to the left boundary, which may result in computational instability. The selection of material models is based on a comparison of different equations of state after simulation. The sizes of fluid elements, structure elements and wavemaker elements are all chosen appropriately to minimize computational resources while taking into account the quality of the simulated waves.
Although this study starts with the simulation of the basic linear waves, the model based on ALE formulation adopts the Navier–Stokes equations as the governing equations of the fluid, so that the studied water wave problem can be easily extended to a viscous, rotational flow. Implantation of different types of wavemakers in the model is simple and it allows for extending the study to that in deep or shallow water conditions. The model is also applicable for studying nonlinear waves and can be used to generate common Stokes waves, cnoidal waves and Solitary waves. Dimensioning the numerical wave flume based on the characteristics of the target wave will enhance the applicability and accuracy of the model. Similarly, it is possible to apply the model for a structure with elastoplastic properties, or with failure criteria. In addition to load calculations on structures, it can also be employed to study the structure’s motion behaviors.
