Abstract
Numerical simulation of metal forming processes is finding increasingly wide applications in advanced industry for the optimization of material processing conditions and prediction of process parameters, finally delivering a reduction of production costs. This work presents a comparison between simulation results of radial shear rolling (RSR) of VT3-1 titanium alloy (Ti-Al-Mo-Cr-Fe-Si) and results of experimental RSR at 1060 °C, 980 °C, and 900 °C in one, three, and five passes, respectively. The digital model (DM) demonstrates a high convergence of the calculation results (calculation error of less than 5%) with the actual geometric parameters of the experimental bars, their surface temperature, and rolling time during the experiment, which indicates a good potential for its application in the selection of deformation modes. Based on the simulation and experimental data, the conditions providing for the formation of differently sized grains in the bar cross-section have been identified. All of the as-rolled bars exhibit a gradient distribution of macrostructure grain size number (GSN), from the smallest one at the bar surface (2–4) to the greatest one in the center (4–6). The macrostructure GSN correlates with the workpiece temperature, which is the highest in the axial zone of the bars, and with the experimentally observed high plastic strain figures in the surface layers. It was found that, depending on the temperature conditions and reduction ratio per pass, any minor change in the values of process parameters can lead to the formation of macrostructures with different grain size numbers.
1. Introduction
Titanium and titanium-based alloys have wide industry applications due to their high strength, ductility, and corrosion-resistant properties, combined with low density [1,2,3]. Those materials are used in the production of critical components in the aircraft, shipbuilding, and automotive industries [4].
An efficient industrial technology of two-phase titanium alloy round cross-sectional bars is radial shear rolling (RSR) [5]. In the modern classification of metal forming processes, radial shear rolling (RSR) is defined as a special case of stationary screw rolling of solid workpieces by rolls with special calibration using a three-roll mill in the range of large feed angles (18° and more). Due to friction forces, the cylindrical workpiece is rolled between three work rolls, which form a deformation zone. During the rolling process, the workpiece moves along a helical trajectory, and it simultaneously decreases in the radial direction and lengthens in the axial direction.
RSR is characterized by the formation of high values of accumulated degree of deformation in the surface layers. However, the nonuniform temperature distribution in the deformation zone complicates the production of semi-finished titanium alloy products with the required level of mechanical properties (without anisotropy) [6,7]. The mechanical properties of those materials are quite sensitive to the temperature conditions developed during deformation treatment. The latter is accounted for by the α→β polymorphic transformation occurring in a relatively narrow temperature range (~960–1000 °C). Hence, achieving the preset structure and phase composition of the alloy requires specific temperature conditions of deformation and subsequent heat treatment, as well as cooling rate control [8,9,10].
The macro- and microstructure of the two-phase alloys depend significantly on the deformation conditions, and this also affects their mechanical properties and performance [10]. Furthermore, there are findings that cooling rate exerts a great effect on the microstructure formation due to the polymorphic transformation, which occurs with decreasing temperature, structural distortions resulting from deformation, and diffusion processes [8,10,11,12]. Thus, the production of semi-finished products with the desired properties requires the correct choice of RSR modes along with the control of temperature and other deformation parameters.
Nowadays, simulation of metal forming processes finds widespread use for finding the optimal deformation conditions, testing various process parameters, analysis of stress–strain state, and simulation of structure and phase composition. Earlier [13], simulation of RSR process of screw profile allowed choosing the optimal rolling process route for the preset product shape and stress–strain state. Application of finite element simulation to studying the effect of the stress–strain state and flow pattern in the deformation zone of aluminum sheet layers during cladding was described [14]. The possibility of testing new industrial techniques by means of a simulation was demonstrated [15], and a new method of fabricating hollow shafts was suggested and tested via a finite element simulation. Data on grain size and metal structure evolution during hot deformation were obtained by simulation in the study [16]. A study of cross-wedge rolling process [17] allowed for improving the digital model (DM) of the process by adjusting existing data on the material properties in the temperature range of deformation, which resulted in a higher accuracy of predicting the location and size of defects. Ta D.X. et al. [18] carried out finite element simulation of combined processing of titanium alloy Ti–6Al–4V, including RSR and rotary forging (RF). It was shown that the distribution of plastic deformation after RSR had a pronounced gradient character, with maximum values at the near-surface layers of the workpiece and minimum values in the center. Due to this, subsequent rotary forging led to a significant increase in the uniformity of the deformation mode. Skripalenko et al. [19] compared the results of digital simulation and experimental RSR of Ti–6Al–4V alloy. It was confirmed that varying the kinematic and deformation parameters of radial shear rolling allowed regulating the thickness of the peripheral fine-grained layer and the diameter of the central coarse-grained layer of rolled workpieces. In the study [20], the problem was set to identify the relationship between the parameters of the stress–strain state, hardness, and grain structure for the titanium alloy Ti–6Al–4V. For this purpose, a comparison between parameters of experimentally obtained bars and the simulation of the RSR process in the DEFORM program was made. Although the above results show the simulation of the RSR of titanium alloys has not been studied in detail at the moment, the current work does not consider the verification of the models and comparison of them with experimental data.
Alloy VT3-1 (Ti-Al-Mo-Cr-Fe-Si) is an α + β alloy, is widely used as a structural material in many industries, and has a useful set of mechanical and operational properties. This alloy is one of the most common and popular alloy grades and is designed to operate at a temperature range of 400–450 °C. Complex alloying provides higher strength and heat resistance in comparison with alloy VT6. However, studies of the RSR of the titanium alloy VT3-1 are significantly limited.
Simulation results make it possible to create digital models and digital twins (DT) of rolling processes that allow predicting process parameters and results and, hence, significantly reduce production costs [21]. To develop a digital model and improve its accuracy, it is necessary to study the influence of process parameters and different deformation modes, which requires conducting a large scope of experiments. Higher accuracy of simulation results will reduce the cost of experiments and will make the analysis of experimental results faster and easier [22]. Furthermore, a verified digital model delivers process data, the retrieval of which is either quite complicated or even impossible under actual experimental conditions [23]. Thus, the accurate digital model not only improves the efficiency of rolling parameter optimization but can also serve as a basis for further development of an intelligent production program for RSR of titanium alloys and process control.
The aim of this work is to carry out a numerical simulation of RSR process for a titanium alloy and to verify the digital model obtained by comparing it with experimental results. Based on the data on experimental rolling of the deformable VT3-1 titanium alloy (Ti-Al-Mo-Cr-Fe-Si) in different modes, the digital model was developed, and model verification was carried out. The model can be used in the future for the design of semi-finished product rolling technologies with the required temperature, deformation, and rate modes. Additionally, the objective is to find the relationship between the distribution of temperature, deformation, and structural parameters of titanium bar after RSR, such as grain size number (GSN), size, and morphology of the α-phase.
2. Materials and Methods
2.1. Experimental Procedure
Experimental rolling was carried out using a MISiS-130T three-roll RSR mill, the appearance of which is shown in Figure 1a. The mill has work rolls with a diameter of 266 mm set to the feed angle β = 18° and the toe angle δ = 10° (Figure 1b). The bar temperature at the deformation zone entrance and exit was monitored with Kelvin RXR-PRO 1600 pyrometers.
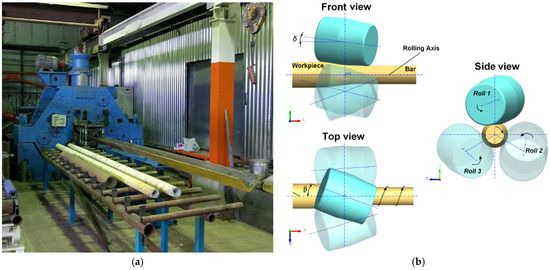
Figure 1.
(a) Three-roll RSR mill and (b) schematic diagram of RSR process.
The initial workpieces were cylindrical bars made of the VT3-1 alloy (Ti-6.8Al-3.6Mo-1.4Cr-0.3Fe-0.25Si, wt.%), 95 mm in diameter and 425 ± 5 mm in length.
The RSR process was carried out to a final diameter of 60 mm at three heating temperatures chosen in accordance with the available data on the VT3-1 alloy phase composition for different temperature ranges. The polymorphic transformation temperature range was identified by means of dilatometric analysis and was equal to 963–1017 °C. Rolling in the β-phase range was carried out at 1060 °C in one pass (Mode 1). Deformation in the polymorphic transformation temperature range was carried out at 980 °C, the number of passes being increased to three (Mode 2). The third workpiece was deformed at 900 °C, which is below the polymorphic transformation temperature range, in five passes (Mode 3). With decreasing the heating degree, the number of passes was increased due to the growth of material deformation resistance. A more detailed description of experimental rolling process was reported in an earlier study [24].
The final diameter of the bars was measured four times, and the average diameter and out-of-roundness were calculated. The latter parameter was calculated using Equation (1) as follows:
where Dmax is the maximum bar diameter (mm) and Dmin is the minimum bar diameter (mm).
2.2. Macrostructure and Microstructure Analysis
After rolling, back-end defect zones and templates for macro- and microstructural analysis were cut from the front and back ends of the bars in accordance with the scheme in Figure 2. Ground and polished samples were etched in a 1HF + 3HNO3 + 6H2O solution.
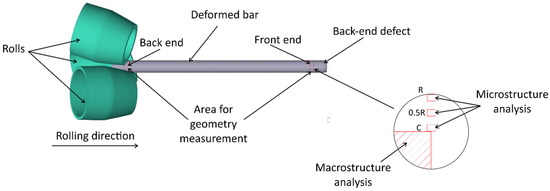
Figure 2.
Schematic representation of sampling locations for geometry measurements and macrostructure and microstructure analysis.
The grain size number (GSN) of the macrostructures was measured by visually comparing the experimentally obtained macrostructures with the 10-point reference scale, as per GOST 25492-85 standard (titanium and titanium alloys rolled bars) specifications) [25].
The microstructure of the bar was examined in the cross-section in three zones (radius R, middle of radius 0.5R, and center C) using optical microscopy under a Carl Zeiss Axio Lab.A1 microscope. The thickness of the α-plates and the volume fractions of the α- and β-phases in the same zones were determined using the ImageJ software v1.54g.
2.3. FEM Simulation
RSR process was simulated using the finite elements method (FEM) with the QForm 3Dv11 software. The 3D models of the rolls and workpieces were designed in the SolidWorks v20 CAD system. The roll and workpiece positions are shown in Figure 3a. The shapes of the workpieces and tools were set fully identical to the experimental ones. The rolls were hollowed for simulation time-saving (Figure 3a).
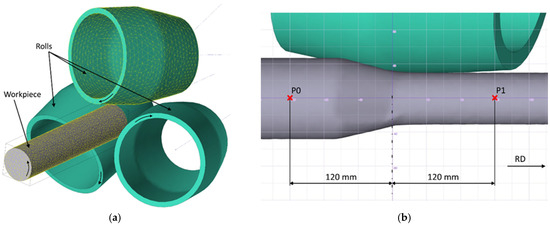
Figure 3.
(a) 3D model of deformation zone and (b) scheme of temperature recording points.
The verification criteria were the bar surface temperatures at the entrance and exit of the deformation zone, the machine working time of rolling, the dimensions of the final bar (diameter and length), and the shape and dimensions of the back-end defect zone. The criteria were chosen in accordance with their significance and the possibility of either in-process measurements or post-experiment measurements of actual bar dimensions. For comparison against the experimental data, the bar temperature was measured at distance of 120 mm from the roll gorge at both sides of the deformation zone (the points P0 and P1 in Figure 3b).
The calculation accuracy of the simulation largely depends on the completeness of the model input data. For a higher calculation accuracy of the bar temperature field, the heat capacities and heat conductivities of the workpiece (VT3-1 alloy) and the tool (40Cr steel) were set in a tabulated function form in the temperature range of 25–1200 °C (Figure 4). Thermophysical properties of the VT3-1 alloy were obtained using calculations in JMatPro v7.0 program for a given chemical composition [26]. The same data on 40Cr steel were used from the QForm program database.
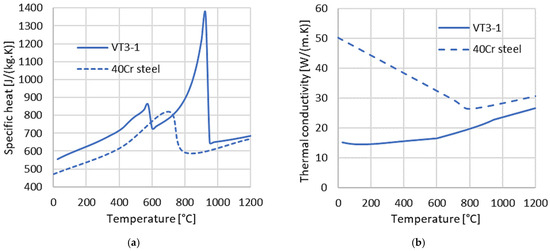
Figure 4.
Thermophysical properties of VT3-1 and 40Cr alloys as a function of temperature: (a) specific heat and (b) thermal conductivity.
The heat exchange in the tool–workpiece contact zone was taken into account using the non-steady-state heat conductivity equation (Equation (2)):
where k is the heat conductivity coefficient, W/(m·K); T is the temperature field, K; qG is the internal heat source power, W/m3; is the Laplacian operator; is the density, kg/m3; and c is the heat capacity, J/(kg·K).
Convective heat exchange between the workpiece and the air is described by the Newton–Richman law (Equation (3)):
where h is the heat exchange coefficient, W/(m2·K); T1 is the workpiece temperature, K; and Tc is the ambient temperature, K.
Radiative heat exchange is described by the following formula (Equation (4)):
where ε is the real body blackness (emissivity factor), which is defined as the ratio between the radiative capacities of the body and the absolutely black body at the same temperature. is the Stefan–Boltzmann constant.
The stresses and strains in the material are calculated on the basis of the rheological properties of the workpiece material. The yield stress σs depends on the strain temperature T, the strain rate , and the strain degree ε and can be described as follows (Equation (5)):
For the alloy studied, σs are set for strain rates of 0.01 /s, 1 /s, and 10 1/s and temperatures of 900 °C, 1000 °C, and 1100 °C (Figure 5).
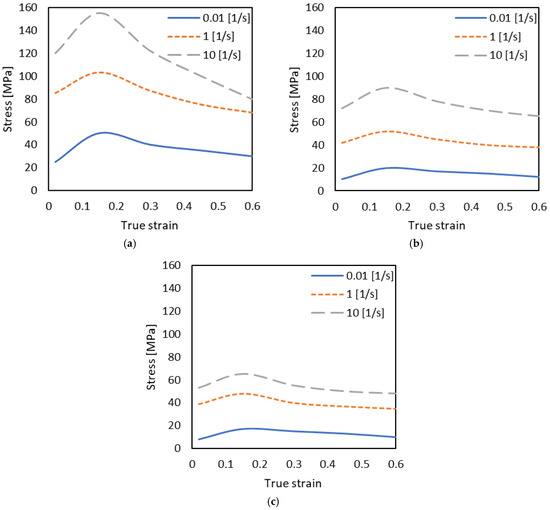
Figure 5.
Stress–strain curves of the VT3-1 alloy at different temperatures and strain rates: (a) 900 °C; (b) 1000 °C; (c) 1100 °C.
The main parameters of the model are summarized in Table 1.

Table 1.
Main parameters of FE model.
The friction factor was calculated for the rolling time equivalent to the experimental one.
More accurate calculation of simulation parameters in the deformation zone requires setting finite element mesh adaptation parameters. The “Adaptation Factor” parameter a shows the required reduction of the maximum calculated finite element size for setting the maximum element size of the FE mesh. The “Minimum Adaptation” parameter amin allows further reduction of the maximum finite element size.
The accumulated strain is calculated in QForm using Equation (6):
where is the strain rate intensity; n is the calculation time step number; and is the calculation time step.
When the simulation is completed, the temperature field of the stress–strain state and the geometrical parameters of the bar are analyzed.
3. Results and Discussion
3.1. Model Verification
To check the correctness of the model, the following main process parameters were compared: bar geometry (diameter, length, and ovality), back-end defect shape change, rolling time, and process temperature.
3.1.1. Geometry
A distinctive feature of bars rolled in screw mills is the formation of back-end defects, which are irregularly shaped cavities at the bar ends. Digital model verification included a comparison between the dimensions and shape of the back-end defects for bars rolled in different experimental modes (Figure 6). The depth of the back-end defects obtained as a result of simulation was 35 mm and 40 mm after rolling at 1060 °C and 980 °C, respectively. The respective parameters obtained in the experiment differed but slightly, i.e., 34 mm for Mode 1 and 40 mm for Mode 2. The clear visual similarity of the shape and curvature of the back-end defects suggests correct workpiece shape change simulation.
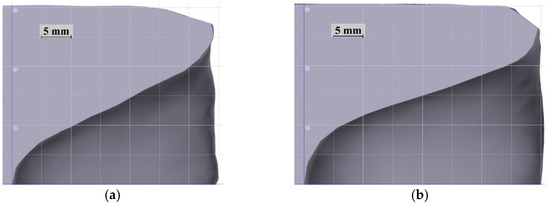
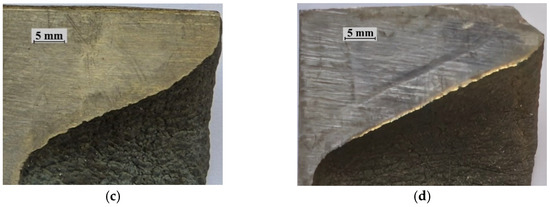
Figure 6.
Appearance of back-end defects at rolled bar front end: (a) simulation, Mode 1; (b) simulation, Mode 2; (c) experiment, Mode 1; (d) experiment, Mode 2.
Figure 7a shows the front-end (f.e.) and back-end (b.e.) bar diameters averaged over all the process modes. The average diameter for experimental rolling varied in a range of 60.01 mm to 60.57 mm, while the difference between the front and back bar end diameters ranged from 0.12 mm to 0.37 mm. The simulated average diameter varied in a range of 60.35 mm to 61.02 mm; the absolute difference between the front and back bar end diameters was 0.17 mm. In relative units, the difference between the simulated and experimental data is within 1%.
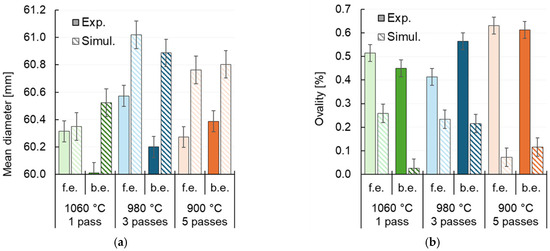
Figure 7.
(a) Mean diameter and (b) ovality at front end (f.e.) and back end (b.e.) of bars after RSR.
The simulated out-of-roundness of the bars is within 0.25%, and the experimental one is no more than 0.65% (Figure 7b). The tool is simulated as an absolutely rigid body, i.e., any deviation from the nominal diameter and out-of-roundness can only be attributed to mesh geometry imperfection, roll profile, or acceptable error in the settings of rolling parameters. The experimental out-of-roundness of the bars is close to the simulated one for any rolling mode, suggesting that the geometrical accuracy does not depend on rolling temperature or reduction mode, but only on roll adjustment and equipment system stiffness.
Experimental and simulated bar lengths after each pass are summarized in Table 2. The greatest length deviation from the experimental data was observed during five-pass RSR simulation (6.3%), probably originating from the total error accumulated during the multi-pass rolling simulation.

Table 2.
Comparison between simulated and experimental bar lengths.
3.1.2. Time
Another model accuracy criterion is rolling time. Table 3 presents experimental and simulated time data. Rolling times for short and long workpieces can differ by several folds; hence, comparison should be carried out both by the absolute and relative difference. The maximum absolute rolling time difference is 0.76 s for the last pass of Mode 2; the overall rolling time is ~15–16 s. Thus, the relative difference between the simulated and experimental rolling time for this mode is within 4.73%. For all the other modes, the relative error is within 2.5%. It should be noted that during simulation of multi-pass rolling, the error can be accumulated along the bar length, which can also affect rolling time. Therefore, these parameters should be considered together.

Table 3.
Comparison between simulated and experimental rolling time.
3.1.3. Temperature
Temperature is one of the most important parameters of hot deformation of titanium alloys, which affects their structure and properties. For verification of simulation results, comparative curves of bar surface temperature at the exit of the deformation zone (see point P1 in Figure 3b) were plotted (last pass, Figure 8). It can be seen that the bar temperature remains stable at the exit of the deformation zone. According to the experimental data obtained with the infrared pyrometer, a slight decrease in temperature is observed at the process beginning, which is especially noticeable for Mode 1. This is due to the bar front end being colder than the main body of the bar because of more intensive cooling. It can also be noted that slight fluctuations in temperature readings are observed during measurements. This can be attributable to the presence of scale on the surface of the bars and the helicoidal nature of the bar movement during the deformation process. The scale is formed more intensively and has a greater layer thickness with increasing heating temperature. Indeed, it can be seen that these fluctuations decrease with decreasing temperature.
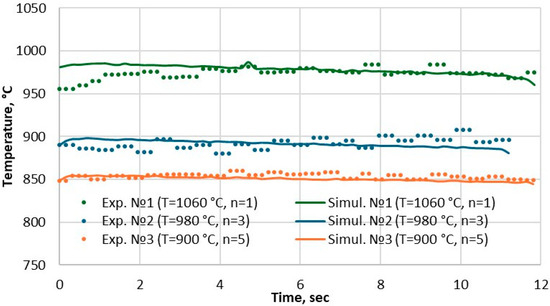
Figure 8.
Experimental and simulation surface temperature of the bar at the exit of the deformation zone (last pass).
Table 4 summarizes the absolute and relative error, as compared with the simulated data. The maximum deviation is within 28 °C (or 3%) for Mode 1. The results of the comparison of the surface temperature of the deformed bar at the exit of the deformation zone reflect the high accuracy of predicting the thermal state of the bar. This suggests that the digital model can be relied upon to analyze the thermal state of the workpiece with a high degree of reliability.

Table 4.
Absolute and relative error of bar surface temperature.
The diagram (Figure 9) presents a comparison between the average bar surface temperature at the exit of the deformation zone for each pass, from the experimentally measured and the respective simulated data, as well as the relative error. The average temperature error is within 1% for all passes.
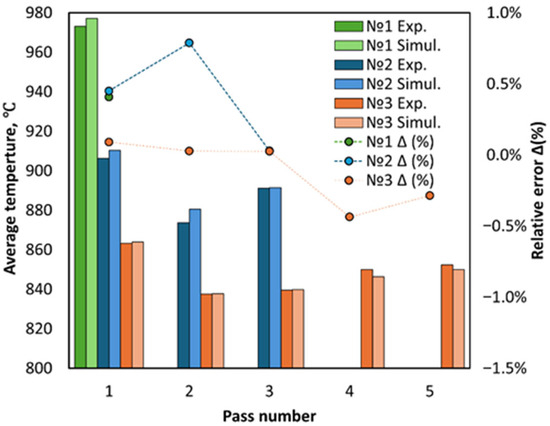
Figure 9.
Experimental and simulation average bar surface temperature at the exit of the deformation zone and its relative error Δ for each pass.
Thus, the model developed herein shows a good convergence with the experimental data with respect to all the selected comparison criteria. The relative errors of all the model parameters are within the acceptable limits, suggesting correctness of the digital model.
3.2. Influence of RSR Parameters on Formation of Macro- and Microstructure
Presented below is an analysis of the effect of the RSR temperature and strain parameters on the formation of the macrostructure and microstructure in the VT3-1 alloy. The initial workpiece had a uniform macrostructure with a GSN of 5 (Figure 10a). The as-rolled bars had a gradient distribution of macrostructure grain size number in the cross-section, from the greatest GSN in the axial zone to the smallest one at the surface. This macrostructure distribution is typical for RSR processes and is accounted for by specific stress–strain state and temperature field in the bar cross-section [23,27]. For example, at RSR at 1060 °C in one pass, the macrostructure is formed with GSN equal to 6 in the 0.35R central zone of bar (Figure 10b). The macrostructure with GSN of 4 is observed in the surface layer up to 0.74R. The rest of the bar volume has macrostructure with GSN of 5.
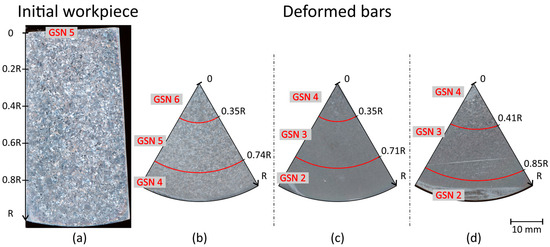
Figure 10.
Macrostructure and grain size numbers (GSN) of (a) initial workpiece and deformed bars: (b) Mode №1 (T = 1060 °C, n = 1); (c) Mode №2 (T = 980 °C, n = 3); (d) Mode №3 (T = 900 °C, n = 5).
The cross-sections of the bars deformed at 980 °C and 900 °C exhibit three zones, the GSN of which grows from 2 at the surface to 4 in the axial zone (Figure 10c,d).
Figure 11 shows optical microstructure images of the initial workpiece and RSR deformed bars. The initial microstructure is characterized as lamellar type and contains coarse equiaxed β-phase grains with α-phase edgings. Inside the grains, variously oriented colonies are observed, consisting of α-phase plates formed as a result of polymorphic transformation during cooling from the β-region.
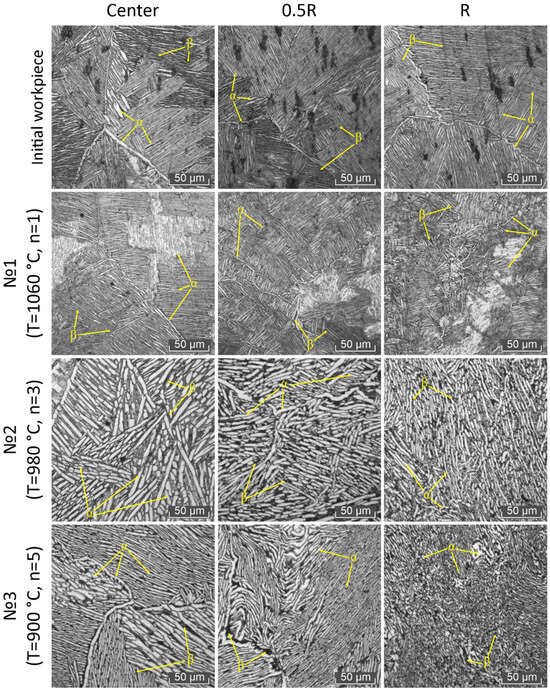
Figure 11.
Optical microstructure images of initial workpiece and RSR-processed bars.
The common microstructural features of all the RSR-deformed bars are cross-sectional nonuniformity and α-phase morphology evolution from the surface to the center. In the surface layer, the α-phase crystals are severely deformed, and so are the intergrain layers. While approaching the axial zone of the bars, the α-phase plates become less deformed, and the α-phase edgings acquire regular shapes. The central zone of the bars rolled in Mode 1 has a lamellar structure, typical of deformation in the β-phase temperature region. The structure of Mode 2 rolled bars is transient (equiaxed with elongated α-phase). This structure is typical of heating to within the β-phase region with deformation ending in the α + β region. It can be assumed that the temperature in the axial zone of the bars rolled in Mode 2 reached a region above the range of polymorphic transformation as a result of deformation heating. For Mode 3, the microstructure of the axial zone is mixed, exhibiting discrete α-phase areas, the structure of which is close to that of the initial workpiece. One can hypothesize that at this rolling mode, low values of elongation ratio per pass are insufficient to change the initial workpiece microstructure in the axial zone.
Figure 12 shows quantitative data for the structural constituents.
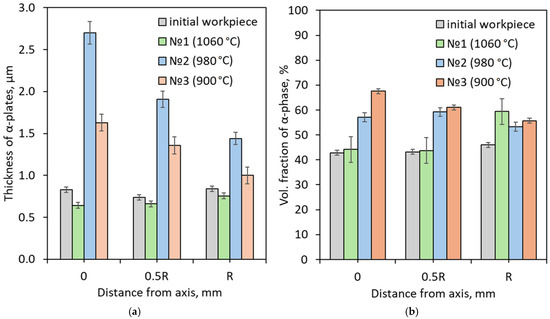
Figure 12.
(a) Average α-phase plate thickness and (b) α-phase volume fraction of initial workpiece and RSR-processed bars.
The bars deformed in Modes 2 and 3 exhibit a decrease in the thickness of the α-phase plates from 2.7 and 1.6 μm at the axis, 1.9 and 1.4 μm in the middle of the bar radius, to 1.4 and 1.0 μm at the surface, respectively. Rolling in Mode 3 produced thinner and more deformed α-phase plates in the surface zone where the deformation temperature was the lowest. The bar rolled in Mode 1 exhibits a slight growth in the size of the above structural constituents in the direction from the center to the surface, attributable to a decrease in the bar surface temperature to below the β-phase region. The volume fraction of the α-phase (42–46%) and the thickness of the α-phase plates (0.74–0.84 μm) in the initial workpiece remain substantially the same in the entire bar cross-section, which is typical of the homogeneous structure observed. The same α-phase volume fraction in the zone between the bar axis and the middle of the bar radius is retained after RSR in one pass, which also corresponds to the β-phase temperature range. The volume fraction of the α-phase increases to 59.4% at the surface. On the contrary, the bars rolled in three and five passes exhibit a decrease in the α-phase volume fraction while moving from the bar center (57–67%) to the surface (53–55%).
Thus, reduction of the RSR temperature to below the β-phase region produces thicker, distorted, and fragmented α-phase plates and leads to a certain increase in the α-phase volume fraction.
3.3. Simulation and Experimental Results
Based on the simulation and experimental results, the relationship between the bar structure and the temperature and deformation parameters of RSR was analyzed. As follows from the simulation data, during RSR, the temperature in the axial zone of the workpieces increases insignificantly (Figure 13). The deformation heating ranges from 3 to 10 °C, and this value is greater the higher the deformation degree and the lower the rolling temperature. However, the temperature of the central bar zones for the first two passes in Mode 2 is above the polymorphic transformation temperature, as confirmed by the microstructural data.
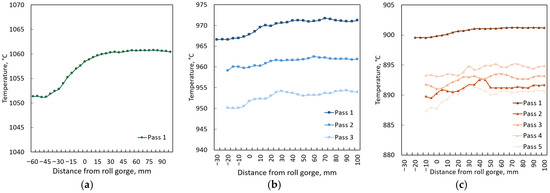
Figure 13.
Change in central bar zone temperature in deformation zone: (a) Mode №1 (T = 1060 °C, n = 1); (b) Mode №2 (T = 980 °C, n = 3); (c) Mode №3 (T = 900 °C, n = 5).
Figure 14 shows simulation data on the plastic strain at different distances from the bar axis and macrostructure GSN distribution (percentage of cross-sectional area occupied) for finite-diameter bars. The plastic strain grows from the bar center to the surface. With an increase in the number of rolling passes and a decrease in the process temperature, the plastic strain increases from ~1.5 to ~2.7 in the center and from ~4.75 to ~7.75 at the surface. However, the GSN of the structure exhibits a correlating decrease while moving from the bar center to the surface. The bar temperature also decreases from the center to the surface (Figure 15). After the end of rolling, the axial bar zone temperature corresponds to the β-phase region only for Mode 1. The bars rolled in three and five passes have temperatures below the polymorphic transformation point after deformation.

Figure 14.
Distribution of plastic strain over bar cross-section after rolling and GSN area: (a) Mode 1 (T = 1060 °C, n = 1); (b) Mode 2 (T = 980 °C, n = 3); (c) Mode 3 (T = 900 °C, n = 5).

Figure 15.
Distribution of temperature over bar cross-section after rolling and GSN area: (a) Mode 1 (T = 1060 °C, n = 1); (b) Mode 2 (T = 980 °C, n = 3); (c) Mode 3 (T = 900 °C, n = 5).
High plastic strains combined with lower temperatures at the bar surfaces favor intense structure refinement. The data suggest that there is a minimum reduction of bar per pass and a total elongation ratio that are required for axial zone structure modification. For RSR at Mode 1 with the greatest elongation ratio per pass and a high rolling temperature, only slight structural changes are observed in 45% of area, while 55% of the micro- and macrostructure in the axial zone area is substantially the same as in the initial workpiece. After one-pass rolling in the β-phase temperature region, the structure with GSN of 4 corresponds to the 940–970 °C range and a plastic strain equal to ~4–5. In the central zone, the structure with a GSN of 6 was formed at 980–1000 °C and plastic strain up to ~1.5.
Deformation with average elongation ratio in the polymorphic transformation region provides for the transformation of 90% of the structural constituents. As a result of three-pass RSR, the axial zone occupying only 9% of the overall area has a macrostructure with GSN of 4 produced at 930 °C–945 °C and a plastic strain of within 2. A macrostructure with GSN of 3 is observed after rolling at 915–930 °C and a plastic strain of 2 to 4. Heating to 880–900 °C and a plastic strain of 4 to 7 produced a macrostructure with GSN of 2 in the surface layer.
For Mode 3, the following conditions for the formation of different GSN are observed: GSN = 4 for T = 865 °C–880 °C and ; GSN = 3 for T = 840–865 °C and ; GSN = 2 for T = 825–840 °C and . Despite the higher strains and lower rolling temperatures, this example suggests that the small reduction per pass is insufficient to change the structure of the central zone, as indicated by the greater area (30% of the cross-section) occupied by the macrostructure with GSN of 4.
Thus, the conditions required for the formation of macrostructures with the same GSN can vary significantly depending on the workpiece heating temperature before rolling and the number of rolling passes. RSR mode with average redaction per pass and workpiece heating to within the α + β region is optimal from the viewpoint of achieving a more profound structure modification.
4. Conclusions
Numerical analysis of radial shear rolling process for VT3-1 titanium alloy (Ti-Al-Mo-Cr-Fe-Si) was carried out using the finite element method.
- 1.
- The model was verified by comparison against the experimental data with respect to the geometry, rolling time, and temperature parameters. The model proved sufficient accuracy of the main parameters (the calculation error is within 5%).
- 2.
- Experimental bars were produced by RSR at three modes with different rolling temperatures and number of passes (reduction per pass). The conditions of macrostructure and microstructure formation in the bars were thoroughly analyzed. The common features of the microstructure for all the RSR-deformed bars are cross-sectional nonuniformity and evolution of the α-phase morphology from the bar surface to the center. Reduction of the RSR temperature to below the β-phase region produces thicker, distorted, and fragmented α-phase plates and leads to a certain increase in the α-phase volume fraction.
- 3.
- New data on the correlation of deformation and thermal conditions of RSR and the structural parameters of the VT3-1 alloy (macrostructure grain size number distribution and α-phase) were obtained. High plastic strains combined with lower temperatures at the bar surfaces favor intense structure refinement. The data suggest that there is a minimum reduction of bar per pass and a total elongation ratio that are required for axial zone structure modification.
- 4.
- The conditions required for the formation of macrostructures with the same GSN can vary significantly depending on the workpiece heating temperature before rolling and the number of rolling passes. RSR mode with average reduction per pass and workpiece heating to within the α + β region is optimal from the viewpoint of achieving a more profound structure modification.
- 5.
- Analysis of the structure and RSR process parameters determined temperature and deformation modes required for the formation of different types of structures. The model can be used for selecting optimal deformation conditions and predicting rolling process results. Also, it can serve as a basis for further development of an intelligent production program for RSR of titanium alloys and process control.
Author Contributions
Conceptualization, A.M.A.A. and Y.G.; data curation, T.K. and D.D.; formal analysis, N.L. and A.K.; investigation, A.M.A.A., Y.G. and A.K.; methodology, Y.G. and T.K.; supervision, A.M.A.A. and Y.G.; validation, A.K., N.L. and D.D.; visualization, A.K. and T.K.; writing—original draft, A.M.A.A., A.K. and Y.G.; writing—review and editing, T.K., Y.G. and A.M.A.A.; funding acquisition, N.L. All authors have read and agreed to the published version of the manuscript.
Funding
This work was financially supported by the Moscow Polytechnic University within the framework of the grant named after Pyotr Kapitsa.
Data Availability Statement
The data presented in this study are available upon request from the corresponding author.
Conflicts of Interest
The authors declare no conflicts of interest.
References
- Bratukhin, A.G. Application of weldable titanium alloys in the Russian aviation industry. Weld. Int. 1997, 11, 902–905. [Google Scholar] [CrossRef]
- CheeChulin, B.B.; Ushkov, S.S.; Razuvaeva, I.N.; Goldfain, V.V. Titanium Alloys in Mechanical Engineering; Ermakov, S.S., Ed.; Mashinostroenie: Leningra, Russia, 1977; 248p, Available online: http://libarch.nmu.org.ua/handle/GenofondUA/71213 (accessed on 15 July 2025). (In Russian)
- Lütjering, G.; Williams, J.C. Titanium, 2nd ed.; Springer: Berlin/Heidelberg, Germany, 2007. [Google Scholar] [CrossRef]
- Veiga, C.; Davim, J.P.; Loureiro, A.J.R. Properties and applications of titanium alloys: A brief review. Rev. Adv. Mater. Sci. 2012, 32, 133–148. Available online: https://www.academia.edu/download/110830617/05_23212_veiga.pdf (accessed on 15 July 2025).
- Negodin, D.A.; Galkin, S.P.; Kharitonov, E.A.; Karpov, B.V.; Kharkovsky, D.N.; Dubovitskaya, I.A.; Patrin, P.V. Testing of the Technology of Radial-Shear Rolling and Predesigning Selection of Rolling Minimills for the Adaptable Production of Titanium Rods with Small Cross Sections Under the Conditions of the “CHMP” JSC. Metallurgist 2019, 62, 1133–1143. [Google Scholar] [CrossRef]
- Kin, T.Y.; Gamin, Y.V.; Galkin, S.P.; Skugorev, A.V. Numerical simulation of workpiece temperature field during radial shear rolling of biomedical Co-Cr-Mo alloy. Model. Simul. Mater. Sci. Eng. 2023, 31, 065002. [Google Scholar] [CrossRef]
- Naydenkin, E.V.; Mishin, I.P.; Ratochka, I.V.; Lykova, O.; Manisheva, A.I. Influence of Radial Shear Rolling Regimes on the Homogeneity of Structural-Phase State, Mechanical Properties and Fatigue of near β Titanium Alloy. Mater. Sci. Forum 2021, 1016, 1024–1030. [Google Scholar] [CrossRef]
- Egorova, Y.B.; Davydenko, L.V.; Chibisova, E.V.; Chelpanov, A.V.; Karataeva, E.S. Prediction of mechanical properties of VT6 titanium alloy rods with different structure types. Light Alloy Technol. 2022, 30–40. (In Russian) [Google Scholar] [CrossRef]
- Egorova, Y.B.; Mamonov, I.M.; Davydenko, L.V. The Study of the Complex Mechanical Properties of Rolled Bars of VT6 Alloy as a Function of Chemical Composition and Structure Type. Russ. Internet J. Ind. Eng. 2019, 7, 44–49. [Google Scholar] [CrossRef][Green Version]
- Aleksandrov, V.K.; Anoshkin, N.F.; Belozerov, A.P.; Bochvar, G.A.; Brun, M.Y.; Gelman, A.A.; Danilkin, V.A.; Dyakonov, Y.A.; Evmenov, O.P.; Ermanyuk, M.Z. Semi-Finished Products from Titanium Alloys; VILS: Moscow, Russia, 1996. (In Russian) [Google Scholar]
- Borisova, E.A.; Bochvar, G.A.; Brun, M.Y.; Glazunov, S.G. Metallography of Titanium Alloys; Metallurgy: Moscow, Russia, 1980. (In Russian) [Google Scholar]
- Sieniawski, J.; Ziaja, W.; Kubiak, K.; Motyka, K.K.A.M. Microstructure and Mechanical Properties of High Strength Two-Phase Titanium Alloys. In Titanium Alloys-Advances in Properties Control; BoD—Books on Demand: Norderstedt, Germany, 2013. [Google Scholar] [CrossRef]
- Lezhnev, S.; Naizabekov, A.; Tolkushkin, A.; Panin, E.; Kuis, D.; Arbuz, A.; Tsyba, P.; Shyraeva, E. Choosing the Design of a Radial-Shear Rolling Mill for Obtaining a Screw Profile. Modelling 2024, 5, 1101–1115. [Google Scholar] [CrossRef]
- Koshmin, A.; Zinoviev, A.; Cherkasov, S.; Mahmoud Alhaj Ali, A.; Tsydenov, K.; Churyumov, A. Finite Element Modeling and Experimental Verification of a New Aluminum Al-2%Cu-2%Mn Alloy Hot Cladding by Flat Rolling. Metals 2024, 14, 852. [Google Scholar] [CrossRef]
- Zhang, S.; Shu, X.; Wang, J.; Li, Z.; Xu, H.; Xia, Y.; Pater, Z.; Tomczak, J.; Bulzak, T. The Mechanism of Forming Hollow Shafts with Constant Wall Thickness by Three-Roll Skew Rolling. Metals 2024, 14, 702. [Google Scholar] [CrossRef]
- Lin, J.; Dean, T. Modelling of microstructure evolution in hot forming using unified constitutive equations. J. Mater. Process. Technol. 2005, 167, 354–362. [Google Scholar] [CrossRef]
- Pater, Z. A new approach to numerical modeling of material fracture in cross wedge rolled parts. J. Mater. Res. Technol. 2025, 37, 687–699. [Google Scholar] [CrossRef]
- Xuan, T.D.; Sheremetyev, V.A.; Kudryashova, A.A.; Galkin, S.P.; Andreev, V.A.; Prokoshkin, S.D.; Brailovski, V. Influence of the combined radial shear rolling and rotary forging on the deformation mode of the small-diameter rod billet made of titanium alloys. Russ. J. Non-Ferr. Met. 2020, 61, 271–279. [Google Scholar] [CrossRef]
- Skripalenko, M.M.; Karpov, B.V.; Rogachev, S.O.; Kaputkina, L.M.; Romantsev, B.A.; Skripalenko, M.N.; Huy, T.B.; Fadeev, V.A.; Danilin, A.V.; Gladkov, Y.A. Simulation of the Kinematic Condition of Radial Shear Rolling and Estimation of Its Influence on a Titanium Billet Microstructure. Materials 2022, 15, 7980. [Google Scholar] [CrossRef] [PubMed]
- Skripalenko, M.M.; Galkin, S.P.; Karpov, B.V.; Romantsev, B.A.; Kaputkina, L.M.; Danilin, A.V.; Skripalenko, M.N.; Patrin, P.V. Forming Features and Properties of Titanium Alloy Billets After Radial-Shear Rolling. Materials 2019, 12, 3179. [Google Scholar] [CrossRef] [PubMed]
- Zhang, Y.; Wang, W.; Zhang, H.; Li, H.; Liu, C.; Du, X. Vibration monitoring and analysis of strip rolling mill based on the digital twin model. Int. J. Adv. Manuf. Technol. 2022, 122, 3667–3681. [Google Scholar] [CrossRef]
- Prokhorov, A.; Lysachev, M.; Borovkov, A. Digital Twin. Analysis, Trends, World Experience; OOO AlliancePrint: Moscow, Russia, 2020. (In Russian) [Google Scholar]
- Ozhmegov, K.; Kawalek, A.; Naizabekov, A.; Panin, E.; Lutchenko, N.; Sultanbekov, S.; Magzhanov, M.; Arbuz, A. The Effect of Radial-Shear Rolling Deformation Processing on the Structure and Properties of Zr-2.5Nb Alloy. Materials 2023, 16, 3873. [Google Scholar] [CrossRef] [PubMed]
- Mahmoud Alhaj Ali, A.; Gamin, Y.V.; Khakimova, A.N.; Kin, T.Y.; Galkin, S.P. Influence of temperature of radial-shear rolling on the structure of VT3-1 alloy. Metallurgist 2025, 69, 252–263. [Google Scholar] [CrossRef]
- GOST 26492-85; Titanium and Titanium Alloys Rolled Bars. Specifications. Rosstandart: Moscow, Russia, 1985.
- Saunders, N.; Guo, U.K.Z.; Li, X.; Miodownik, A.P.; Schillé, J.-P. Using JMatPro to model materials properties and behavior. JOM 2003, 55, 60–65. [Google Scholar] [CrossRef]
- Galkin, S.P.; Kin, T.Y.; Gamin, Y.V.; Aleshchenko, A.S.; Karpov, B.V. Review of scientific-applied research and industrial application of radial shear rolling technology. CIS Iron Steel Rev. 2024, 27, 35–47. [Google Scholar] [CrossRef]
Disclaimer/Publisher’s Note: The statements, opinions and data contained in all publications are solely those of the individual author(s) and contributor(s) and not of MDPI and/or the editor(s). MDPI and/or the editor(s) disclaim responsibility for any injury to people or property resulting from any ideas, methods, instructions or products referred to in the content. |
© 2025 by the authors. Licensee MDPI, Basel, Switzerland. This article is an open access article distributed under the terms and conditions of the Creative Commons Attribution (CC BY) license (https://creativecommons.org/licenses/by/4.0/).