Article

Grain Size- and Temperature-Dependent Phonon-Mediated Heat Transport in the Solid Electrolyte Interphase: A First-Principles Study

by
Arjun S. Kulathuvayal
and
Yanqing Su
*
School of Aerospace and Mechanical Engineering, University of Oklahoma, Norman, OK 73019, USA
*
Author to whom correspondence should be addressed.
Modelling 2025, 6(3), 89; https://doi.org/10.3390/modelling6030089
Submission received: 28 June 2025 / Revised: 3 August 2025 / Accepted: 18 August 2025 / Published: 23 August 2025

Abstract

The solid electrolyte interphase (SEI) is a passive layer, typically a few hundred angstroms thick, that forms on the electrode surface in the first few battery cycles when the electrode is in contact with the electrolyte in lithium-metal batteries. Composed of a combination of lithium salts and organic compounds, the SEI plays a critical role in battery performance, serving as a channel for Li-ion shuttling. Its structure typically comprises an inorganic component-rich sublayer near the electrode and an outer organic component-rich sublayer. Understanding heat transport through the SEI is crucial for improving battery pack safety, particularly since the Li-ion diffusion coefficient exhibits an exponential temperature dependence. This study employs first-principles calculations to investigate phonon-mediated temperature-dependent lattice thermal conductivity across the inorganic components of the SEI, including, LiF, Li2O, Li2S, Li2CO3, and LiOH. This study is also extended to the dependence of the grain size on thermal conductivity, considering the mosaic-structured nature of the SEI.

1. Introduction

The increasing demand for drones and electric vehicles (EVs) underscores the need to enhance the reliability of Li-ion batteries (LIBs), particularly in mitigating thermal runaway events while optimizing for high energy density. A high energy density necessitates compact packing within the LIB, which increases the risk of internal short-circuiting primarily due to the formation of lithium dendrites on the electrode surfaces. These needle-shaped nanostructures typically form on anodes during the long-term cycling of the battery. The formation and growth of dendrites are strongly influenced by a very thin complex layer known as the solid electrolyte interphase (SEI), which forms on the electrode surface when the electrode is in contact with the electrolyte [1]. The SEI serves as a protective layer specifically for anodes, and it prevents the tunneling of electrons from the anode to the electrolyte while permitting Li-ion shuttling. Given its strategic position within a battery, the SEI also acts as a medium for transporting Joule heat generated within the electrolyte and electrode during battery cycling. This role becomes particularly significant when the temperature gradient influences the dendrite growth mechanism [2].
The concept of the SEI was first introduced by Peled [3] in 1979. In subsequent years, revised and promising multilayered SEI models were proposed, with significant advances made in the late twentieth century [4,5]. The most accepted SEI model has a bilayered mosaic structure. This mosaic-type interphase forms when the lithium electrode is in contact with the liquid electrolyte, which is composed of organic solvents and lithium salts. The lower reduction potential of electrolytes compared to that of the electrode facilitates the instantaneous reduction of lithium and electrolyte species. Then, the insoluble products formed from the redox reactions between active lithium ions and the anionic species of electrolytes deposit on the metallic anode surface, forming the SEI [6]. This reaction occurs during the first full cycle and can reduce the capacity of the battery pack by up to 10% due to its consumption of active Li and electrolyte ions [7]. Morphologically, the average thickness of this interphase ranges from 10 to a few hundred nanometers [8]. When the structure is meticulously assessed, the SEI can be modeled as a bilayered, multicomponent structure, with organic components predominantly found near the electrolyte and inorganic components located closer to the electrode. The organic species most commonly reported within the SEI include ROLi, RCOOLi, ROCOLi, RCOO2Li, and ROCO2Li (R = alkyl groups), while the inorganic components predominantly consist of LiF, Li2O, LiOH, Li2CO3, and Li2S [9]. However, there remains ambiguity regarding the structure of the inorganic layer within the SEI. One model suggests that this layer has a grain-like structure, where Li ions can diffuse through both the inorganic grains and grain boundaries between them [10]. In contrast, another perspective posits that the inorganic sublayer forms a single, structured sublayer, with ion diffusion occurring through a knock-off mechanism [11]. Regarding ion and electronic transport, the organic layer hinders Li-ion diffusion to some extent. In contrast, studies suggest that Li-ion migration is faster in the inorganic layer, especially through grain boundaries than through grains. Meanwhile, the elevated electronic bandgap reported for inorganic components hinders electronic tunneling from the anode material to the electrolyte. This phenomenon intuitively benefits the battery pack by preventing further reactions between the electrode material and the electrolyte.
In recent decades, extensive research has been conducted on the SEI to explain its morphology, surface chemistry, lithium-ion diffusion dynamics, dendrite evolution, and aging mechanisms [12]. Together, these studies underscore the crucial role of the SEI in enhancing the reliability and energy density of lithium-ion batteries. A wide range of studies have been conducted on the thermophysical properties of SEI components to improve the design of the SEI. In the experimental realm, Petibon et al. [13] conducted a temperature sensitivity analysis of the impedance of cell components, electrodes, electrolytes, and their interfaces, using impedance spectroscopy. Their findings indicated that both interfacial and bulk impedances decrease significantly with an increasing temperature. Some similar studies have suggested that an SEI formed at low temperatures results in a stable morphology with low impedance, while at higher temperatures, SEI components can reorganize to form a stable structure [6,14,15]. Furthermore, a morphological change of the SEI with respect to temperature has also been reported in some studies. For example, a study by Kim et al. [16] using SEM and energy-dispersive spectroscopy reported a variation in SEI morphology with temperature, particularly a thickening of the interphase at elevated temperatures. Similarly, there are many studies that claim that the effect of temperature on the morphology of lithium deposition spots is related to the efficiency of lithium cycling [17,18]. Another important study by [19] demonstrated that localized temperature fluctuations in the SEI can induce significant growth of lithium metals due to the enhanced surface exchange current in the associated region. This study also pointed out that, while a uniformly applied elevated temperature can suppress dendrite growth by diffusional smoothing, localized hotspots accelerate dendrite formation in associated regions [20]. When evaluating the aforementioned studies alongside other literature surveys, it became evident that research specifically addressing heat transport in the SEI remains limited. The importance of such a study is underscored by the fact that Li-ion transport through the SEI is directly influenced by activation energy, which is inherently temperature-dependent. This further reiterates the critical need to understand the response of temperature to the thermal conductivity of the SEI [21].
Given the focus of this study on the thermal conductivity of SEI components, we also observed a limited number of molecular dynamics (MD)-based studies addressing this topic [22]. However, the accuracy of MD-derived results critically depends on the choice of empirical potential models, which can vary because of differences in the theoretical treatment of atomic interactions. To avoid these ambiguities, this study adopted a first-principles approach, which eliminates the reliance on empirical results and provides a more robust theoretical overview.
Despite growing interest, studies employing first-principles calculations to explore the thermal conductivity of SEI components remain sparse. Existing studies often overlook the polycrystalline nature of SEI components and their grain boundary interactions with other diverse lithium salts present in the SEI.
In this work, we calculate the thermal conductivity governed by phonons for SEI components using harmonic and third-order anharmonic force constants (FCs) obtained from first-principles calculations, covering a temperature range of 150 to 1000 K, which is typically reported as the battery operating range [23]. Furthermore, first-principles methods offer exceptional accuracy in reproducing experimentally consistent phonon dispersion data for lithium salts, as evidenced in previous studies [24,25,26,27].
Our analysis focuses on five commonly reported inorganic SEI components: LiF, Li2O, Li2S, Li2CO3, and LiOH. Among these, the thermal conductivity of LiF is well documented, with consistent data reported in various experimental and theoretical studies [28,29,30,31]. In contrast, temperature-dependent thermal conductivity data for the other common SEI inorganic components remain unavailable, particularly when first-principles phonon-based methodologies are used. This study aims to address this gap by providing a comprehensive analysis of the thermal conductivity of these materials, accounting for heat transport through Umklapp phonon scattering, as well as the influence of grain boundaries via phonon–grain boundary scattering. These findings offer valuable insights into the thermophysical behavior of SEI components, particularly in light of the polycrystalline nature of the SEI.
This article is organized as follows: Section 2 details the crystallographic characteristics and computational methodologies employed in this study. Section 3 presents an in-depth discussion of the aspects of phonon dispersion. Finally, Section 4 concludes with a summary of the key findings and their significance in the operational environments of Li-metal batteries.

2. Materials and Methods

This study collects the geometric structures of LiF, Li2O, Li2S, Li2CO3, and LiOH from Materials Project with the lowest ‘energy above the hull’ using API. Of the five components, LiF, Li2O, and Li2S have cubic crystal systems; LiOH has a tetragonal crystal system; and Li2CO3 has a monoclinic crystal system [32]. When magnetic properties are assessed, all of the aforementioned lithium salts are found to be diamagnetic at the simulation temperature.
In general, the presence of a magnetic dipole or multipole order affects thermal conductivity through its interaction with phonons [33]. Given the non-magnetic behavior of the components, we omit such phonon–magnetic dipole coupling in our calculations. Similarly, all the aforementioned components are well-established wide-bandgap materials; therefore, electron–phonon scattering is also neglected in this study [34,35,36,37].
The Vienna Ab-initio Simulation Package (VASP) (version 6.2.1) is used to perform density functional theory (DFT) calculations to relax the systems and extract interatomic forces. The conventional unit cells of the SEI components are optimized using a Monkhorst–Pack k-point mesh, specifically defined for each material. The corresponding k-points used in the Brillouin zone are summarized in Table S1. Likewise, the plane-wave cutoff energies used for each component are also provided in Table S2. In this study, we compare the performance of three commonly u sed DFT exchange–correlation functionals: (1) the Local Density Approximation (LDA), (2) the Generalized Gradient Approximation in the Perdew–Burke–Ernzerhof form (GGA-PBE), and (3) the revised Perdew–Burke–Ernzerhof form for solids (GGA-PBEsol). The LDA and GGA-PBE are widely used benchmark functionals for thermal property predictions. The GGA-PBEsol is chosen in particular due to its known accuracy in reproducing the experimental lattice parameters and phonon properties of solids. The geometry optimization of all the components is carried out, with the convergence criteria for the energy and force being 10 6 eV and 0.01 eV/Å, respectively. The geometric information with the lattice constant is listed in Table 1, obtained after complete lattice relaxation using the aforementioned exchange–correlation functionals and settings. An illustration of the lattice structures of the SEI components used in this work is presented in Figure 1a–e in the specified order.

Phonon Dispersion and Thermal Conductivity

Phonon thermal conduction is usually dissipated mainly by its scattering with other phonons, electrons, impurities, defects, and grain boundaries. Given the wider electronic bandgaps reported in LiF, Li2O, Li2S, Li2CO3, and LiOH, we assume that the electronic contribution to thermal conductivity is negligible. Furthermore, we assume the presence of pristine crystal structures in this study; hence, the contributions of impurity scattering are not considered. In addition to this, we omit the scattering contribution of other quasi-particles such as polarons and excitons due to the less pronounced coupling with phonons in these materials [38,39,40]. Consequently, heat transport in these materials is assumed to be predominantly governed by phonons. In this work, we also account for the grain boundary-rich structure of the SEI, thereby incorporating the influence of the grain boundary scattering of phonons and its contribution to thermal conductivity.
This study employs standard phonon transport theory, where key phonon properties, including the frequency, group velocity, mean free path, and relaxation time, are calculated using second-order harmonic and third-order anharmonic FCs. A thermal conductivity analysis is carried out in the ShengBTE (version 1.5.1) framework, which is efficient in calculating the lattice thermal conductivity of wide-bandgap crystalline solids [24,41]. The Born effective charge and dielectric constant are included to account for the nonanalytic behavior of the potential energy surface in the Brillouin zone due to Coulombic interactions and are given in Table S3. The second-order FCs and third-order FCs for this computation are generated using the Phonopy and Thirdorder.py (version 1.1.3) frameworks, respectively [42,43]. The force convergence criterion is set to −0.01 eV/Å to calculate the second-order harmonic and third-order anharmonic interatomic FCs with an exchange–correlation functional suitable for the respective calculations, as described in Section 3. All phonon calculations described here are carried out in 2 × 2 × 2 supercells after a convergence test is carried out on supercells of various sizes. The K-point mesh and the plane-wave cutoff energy are selected based on the crystal system and the type of elements present in the system, which are given in Tables S1 and S2. Density functional perturbation theory is used to extract second-order FCs. For third-order FCs, the finite displacement approach is used with an atomic displacement of 0.01 Å from the equilibrium position and with a closest neighbor cutoff distance of 3 Å. Using dynamic FC matrices of the second and third order, the phonon relaxation times and the thermal conductivity tensor are calculated using Fermi’s golden rule in conjunction with the iterative solution of the Boltzmann Transport Equation (BTE). Using the BTE, the phonon scattering rates are calculated, where the accuracy essentially depends on the number of sampling points in the first Brillouin zone, which is also given in Table S1 [44]. Combining the BTE and Fourier’s law [45,46], the phonon lattice thermal conductivity tensor can be calculated as
κ α β = 1 3 Σ C v , λ v λ α v λ β τ λ p
where λ = ( q , v ) denotes the phonon mode with polarization v and wave vector q, C v , λ is the volumetric specific heat, v λ α and v λ β are the α and β components of the phonon group velocity vector v λ , and τ λ p is the phonon relaxation time [47]. Here, the phonon volumetric specific heat can be obtained using Bose–Einstein statistics and the phonon relaxation time from Matthiessen’s rule [46,47]. Through an iterative process using Equation (1), the thermal conductivity tensor can be solved from the full solution of the linearized phonon Boltzmann equation [48]. We use system-specific K-space meshes for each system after convergence tests to solve the BTE.
In general, the total phonon scattering rate (inverse of the phonon relaxation time) in a crystalline system can be calculated using Equation (2) [49]:
τ t o t 1 = τ p p 1 + τ b 1 + τ d 1 + τ i 1
where τ p p 1 , τ b 1 , τ d 1 , and τ i 1 represent the scattering rates due to phonon–phonon (Umklapp) scattering, phonon–boundary scattering, phonon–defect scattering, and phonon–isotope scattering, respectively. In this study, the temperature-dependent lattice thermal conductivity in SEI grains is calculated by considering only Umklapp phonon scattering and is then compared with the results that include phonon–grain boundary scattering, accounting for the grain–structured characteristics of the SEI. Since ShengBTE does not explicitly account for boundary scattering, we modify the code such that the relaxation time governed by boundary scattering is T b = L | v λ | , where L is the characteristic length, i.e, the grain size, and v λ is the phonon group velocity vector for the respective mode. Now, τ λ p can be written as the sum of the Umklapp scattering rate ( τ p p 1 ) and the boundary scattering rate as
τ λ p = 1 τ p p 1 + T b 1 = 1 τ p p 1 + | v λ | L
Therefore, the lattice thermal conductivity is evaluated for grain sizes ranging from L = 2 nm to 10 nm, with increments of 2 nm, to capture the influence of grain boundary scattering on heat transport. It is important to note that Equation (3) assumes perfectly diffusive grain boundary scattering, which simplifies the boundary interactions by neglecting the possibility of partial specularity. In real polycrystalline materials, phonon scattering at grain boundaries may exhibit partially specular behavior depending on the phonon wavelength, boundary structure, and surface roughness. Additionally, the model does not account for Kapitza resistance, which can become significant at low temperatures due to phonon mismatch across grains. These simplifications may introduce discrepancies between the calculated and experimental values, particularly in a low-temperature regime [46].

3. Results and Discussion

This section presents a detailed analysis of the phonon band structure, mode-resolved phonon dispersion, and their respective contributions to the lattice thermal conductivity. Furthermore, this study examines the influence of phonon grain boundary scattering on thermal conductivity and the variability in thermal conductivity resulting from the selection of DFT exchange–correlation functionals. To simulate the effects of grain boundary scattering, the grain size L in Equation (2), ranging from 2 nm to 10 nm in 2 nm increments, is considered for all components. This range corresponds to the typical grain size observed in SEI components [8]. Furthermore, here, we also examine the anisotropy in thermal conductivity observed specifically in LiOH and Li2CO3, which provides insights into the directional dependencies of heat transport.
  • LiF: LiF is a stable component of the SEI that forms from the decomposition of salts such as LiPF6 and LiTFSI (lithium bis(trifluoromethanesulfonyl)imide), additives such as fluoroethylene carbonate, or reactions involving trace HF. The exceptional stability of LiF has been widely utilized to develop durable artificial interphases due to its ability to form highly stable interfaces with electrolytes. LiF is also well known for its tolerance to temperature. For that reason, its presence in the SEI improves the high-temperature cycling performance of the battery [50,51].
This study further examines the key thermal characteristics of LiF through a phonon dispersion analysis. From the phonon dispersion spectrum given in Figure 2a, it is determined that the notable divergence between the longitudinal optical (LO) and transverse optical (TO) phonon branches at the Gamma point supports the ionic crystalline nature of LiF. However, at non-Gamma points, the LO–TO bandgap is absent due to the negligible cation/anion mass ratio (≈0.365). The phonon frequency range in the system is observed to be between 0 and 17.5 THz. In particular, the state density of Li atoms is concentrated in the higher frequency range of 7–17.5 THz, reflecting their lower mass compared to F atoms, whose state phonon density lies in the range of 2.5–12 THz. Furthermore, the absence of imaginary frequencies at both Gamma and non-Gamma points confirms the dynamic stability of the system and the optimum supercell configuration chosen for this calculation.
Upon examining the contribution of each phonon mode to thermal conductivity, as shown in Figure 2b, it becomes evident that the optical modes contribute approximately 45%, while the acoustic branches account for about 55%. Within the acoustic phonons, transverse acoustic (TA) modes contribute more than longitudinal acoustic (LA) modes, as reflected in the steeper slope of the TA branches, indicating higher group velocities. The higher density of states associated with F atoms in both the LA and TA branches suggests that defects in F atoms may lead to greater variations in thermal conductivity than defects in Li atoms. Although Li atoms predominantly influence the optic phonons, they contribute only about 45% to the cumulative conductivity. However, the significance of the acoustic modes (mainly populated by F atoms), which account for 55% of the thermal conductivity, remains crucial. In short, defects associated with Li atoms, which predominantly control the optical phonons, may introduce variations in the thermal conductivity of LiF, but their effect is less pronounced than that of defects associated with F atoms.
The phase space of three-phonon scattering in LiF is shown in Figure 2c, with the corresponding scattering rate and phonon lifetime presented in Figure 2d and Figure 2e, respectively. Scattering remains minimal in the low-frequency regime, where an elevated phase space is available, compared to the higher frequency range that spans from 12 to 17.5 THz. This reinforces the earlier observation that heat transport in LiF is primarily facilitated by acoustic rather than optical phonons.
A numerical fit of the temperature-dependent cumulative thermal conductivity (Figure 2e) reveals a dependence of 1 / T 1.11 on the temperature range of 150 to 1000 K, which closely aligns with predictions from kinetic theory [52]. As the system approaches the Debye temperature, Umklapp scattering becomes the predominant phonon scattering mechanism, particularly given that the perfect crystal model with zero defects leads to asymptotic thermal conductivity when the temperature increases. The thermal conductivity at room temperature, calculated using the LDA functional, is found to be 13.01 W / ( m . K ) , which is close to both experimental and computational studies, as summarized in Table 2.
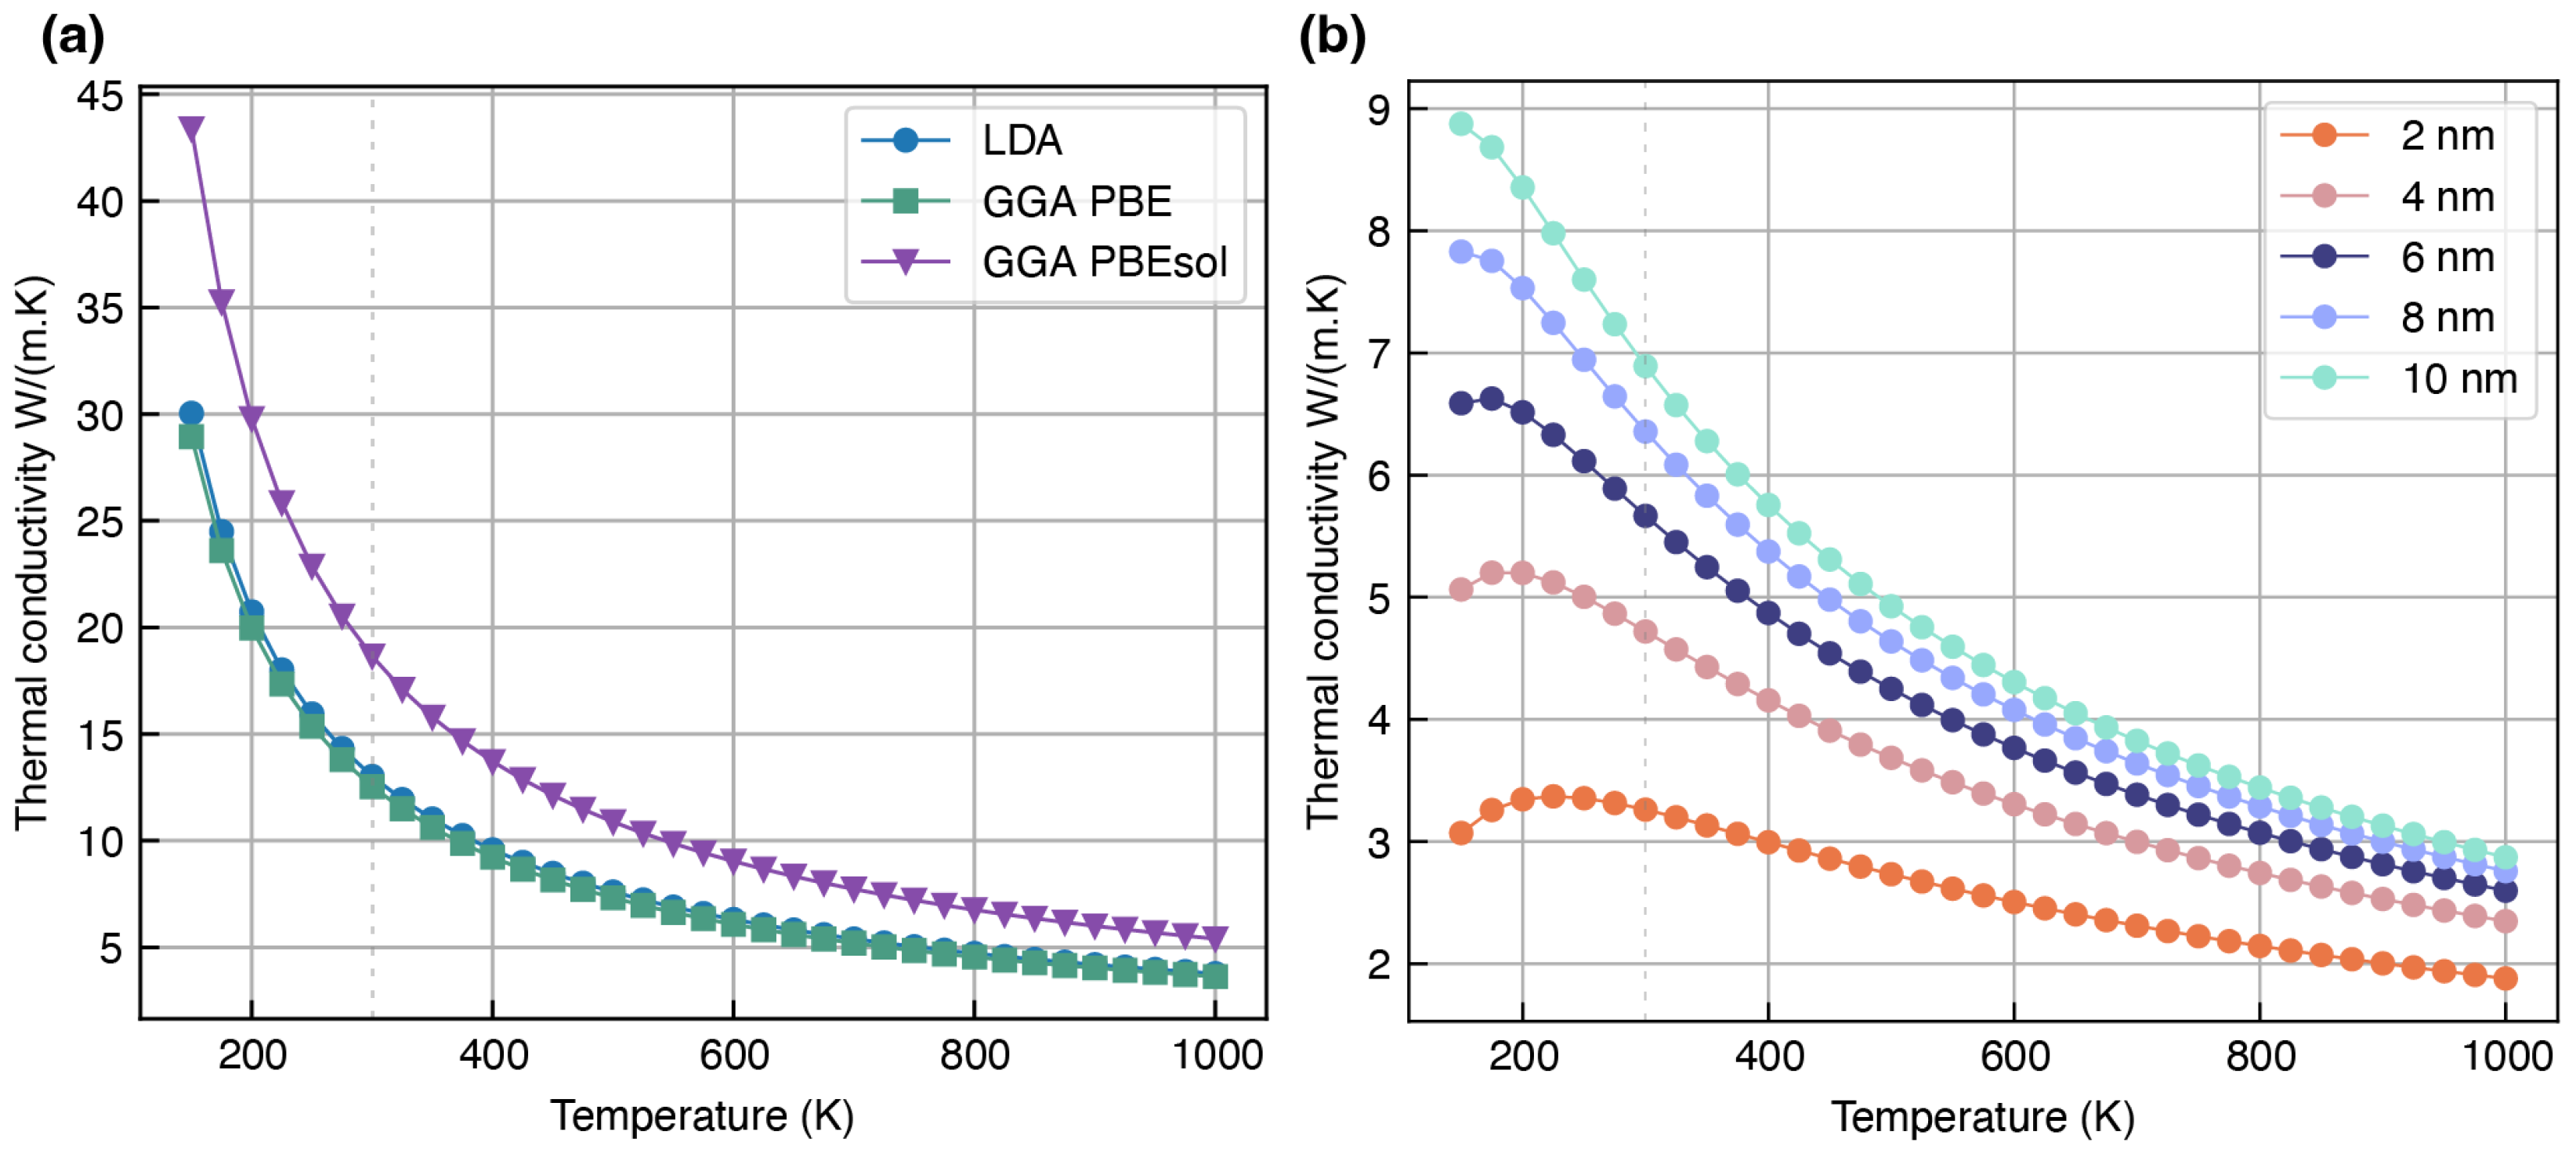
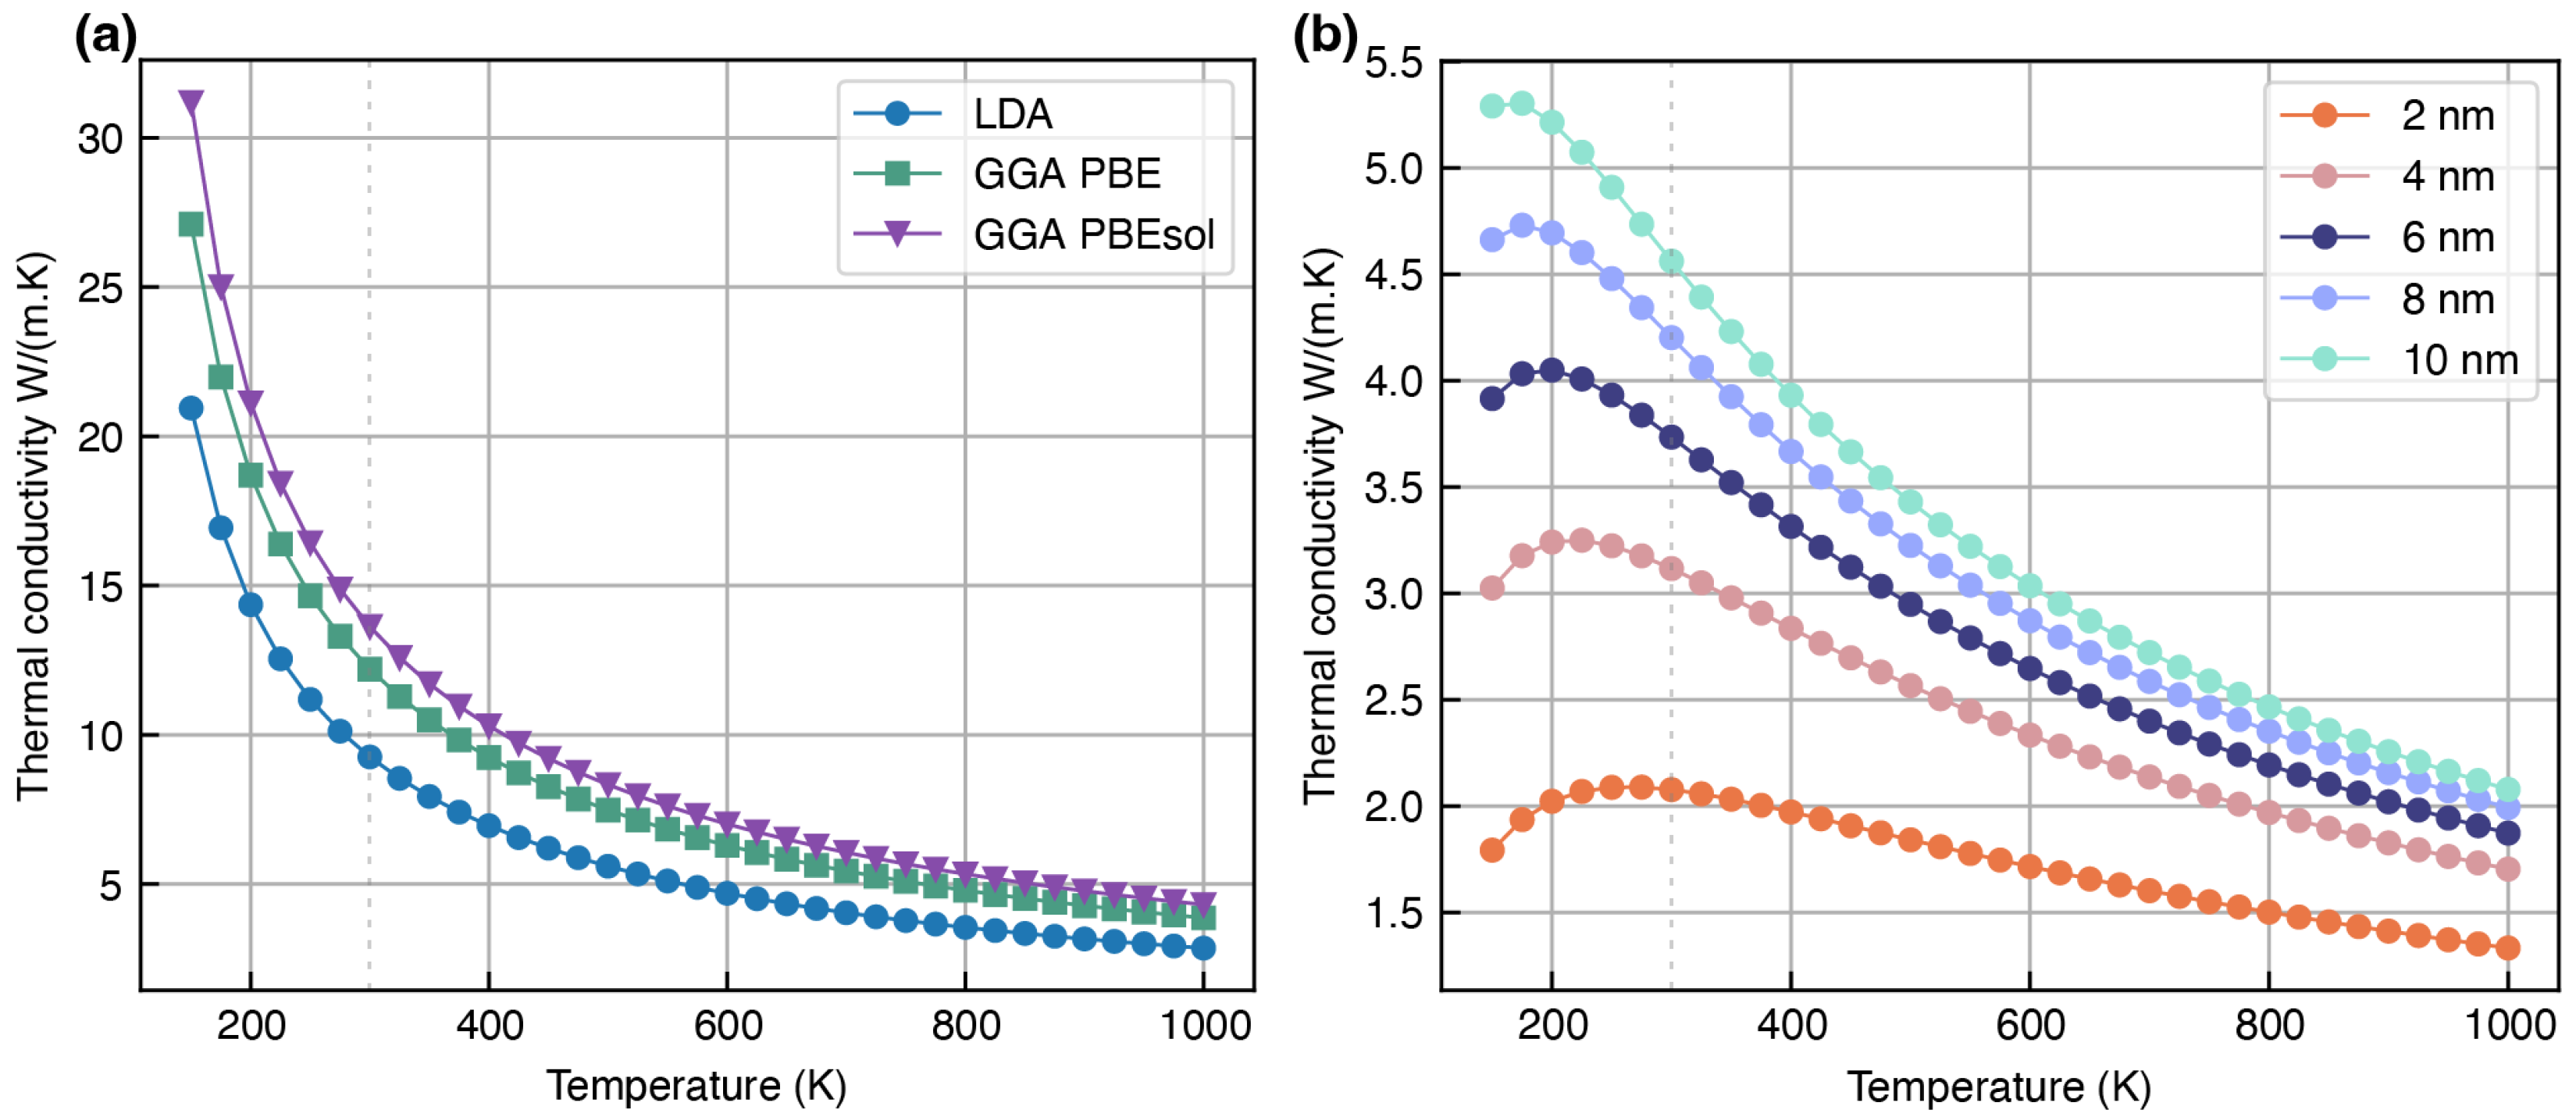
The influence of the choice of the DFT exchange–correlation functional on the thermal conductivity of LiF is illustrated in Figure 3a. Among the functionals considered, the LDA demonstrates the closest agreement with the experimental data, suggesting its accuracy in this context. Among the other two functionals considered here, the PBE functional also provides reasonably close estimates, while the PBEsol functional significantly overestimates thermal conductivity, with deviations being approximately 4 units higher than the actual values.
Figure 3b depicts the effects of grain boundary scattering on the thermal conductivity of LiF, calculated using Equation (3). In the graph of the thermal conductivity temperature response for grain sizes of 2 nm up to 10 nm, it can be seen that the grain boundary effect is dominant in the low-temperature regime and becomes less pronounced when the temperature increases. This is expected from the boundary scattering effect, which is prominent at low temperatures and gradually decreases due to the increased contribution of phonon–phonon scattering at higher temperatures. Furthermore, at 300 K, including grain boundary effects reduces the thermal conductivity on average by approximately 58% compared to the thermal conductivity governed by Umklapp phonon scattering.
  • Li2O: This study considers the face-centered cubic structure of Li2O (mp-1960), as illustrated in Figure 1b, which is reportedly stable under ambient pressure [53]. In this configuration, each Li atom is surrounded by a tetrahedral arrangement of O atoms. Li2O is a commonly reported SEI component that forms when low-voltage anodes come into contact with solid or liquid electrolytes containing oxygen [54]. With a high bandgap of 7–8 eV, Li2O exhibits strong insulating characteristics, effectively preventing any significant electron–electrolyte interaction [55]. This also suggests that heat transport in this material is predominantly governed by phonon scattering, with very minimal contribution from electron-mediated processes due to the limited availability of free charge carriers.
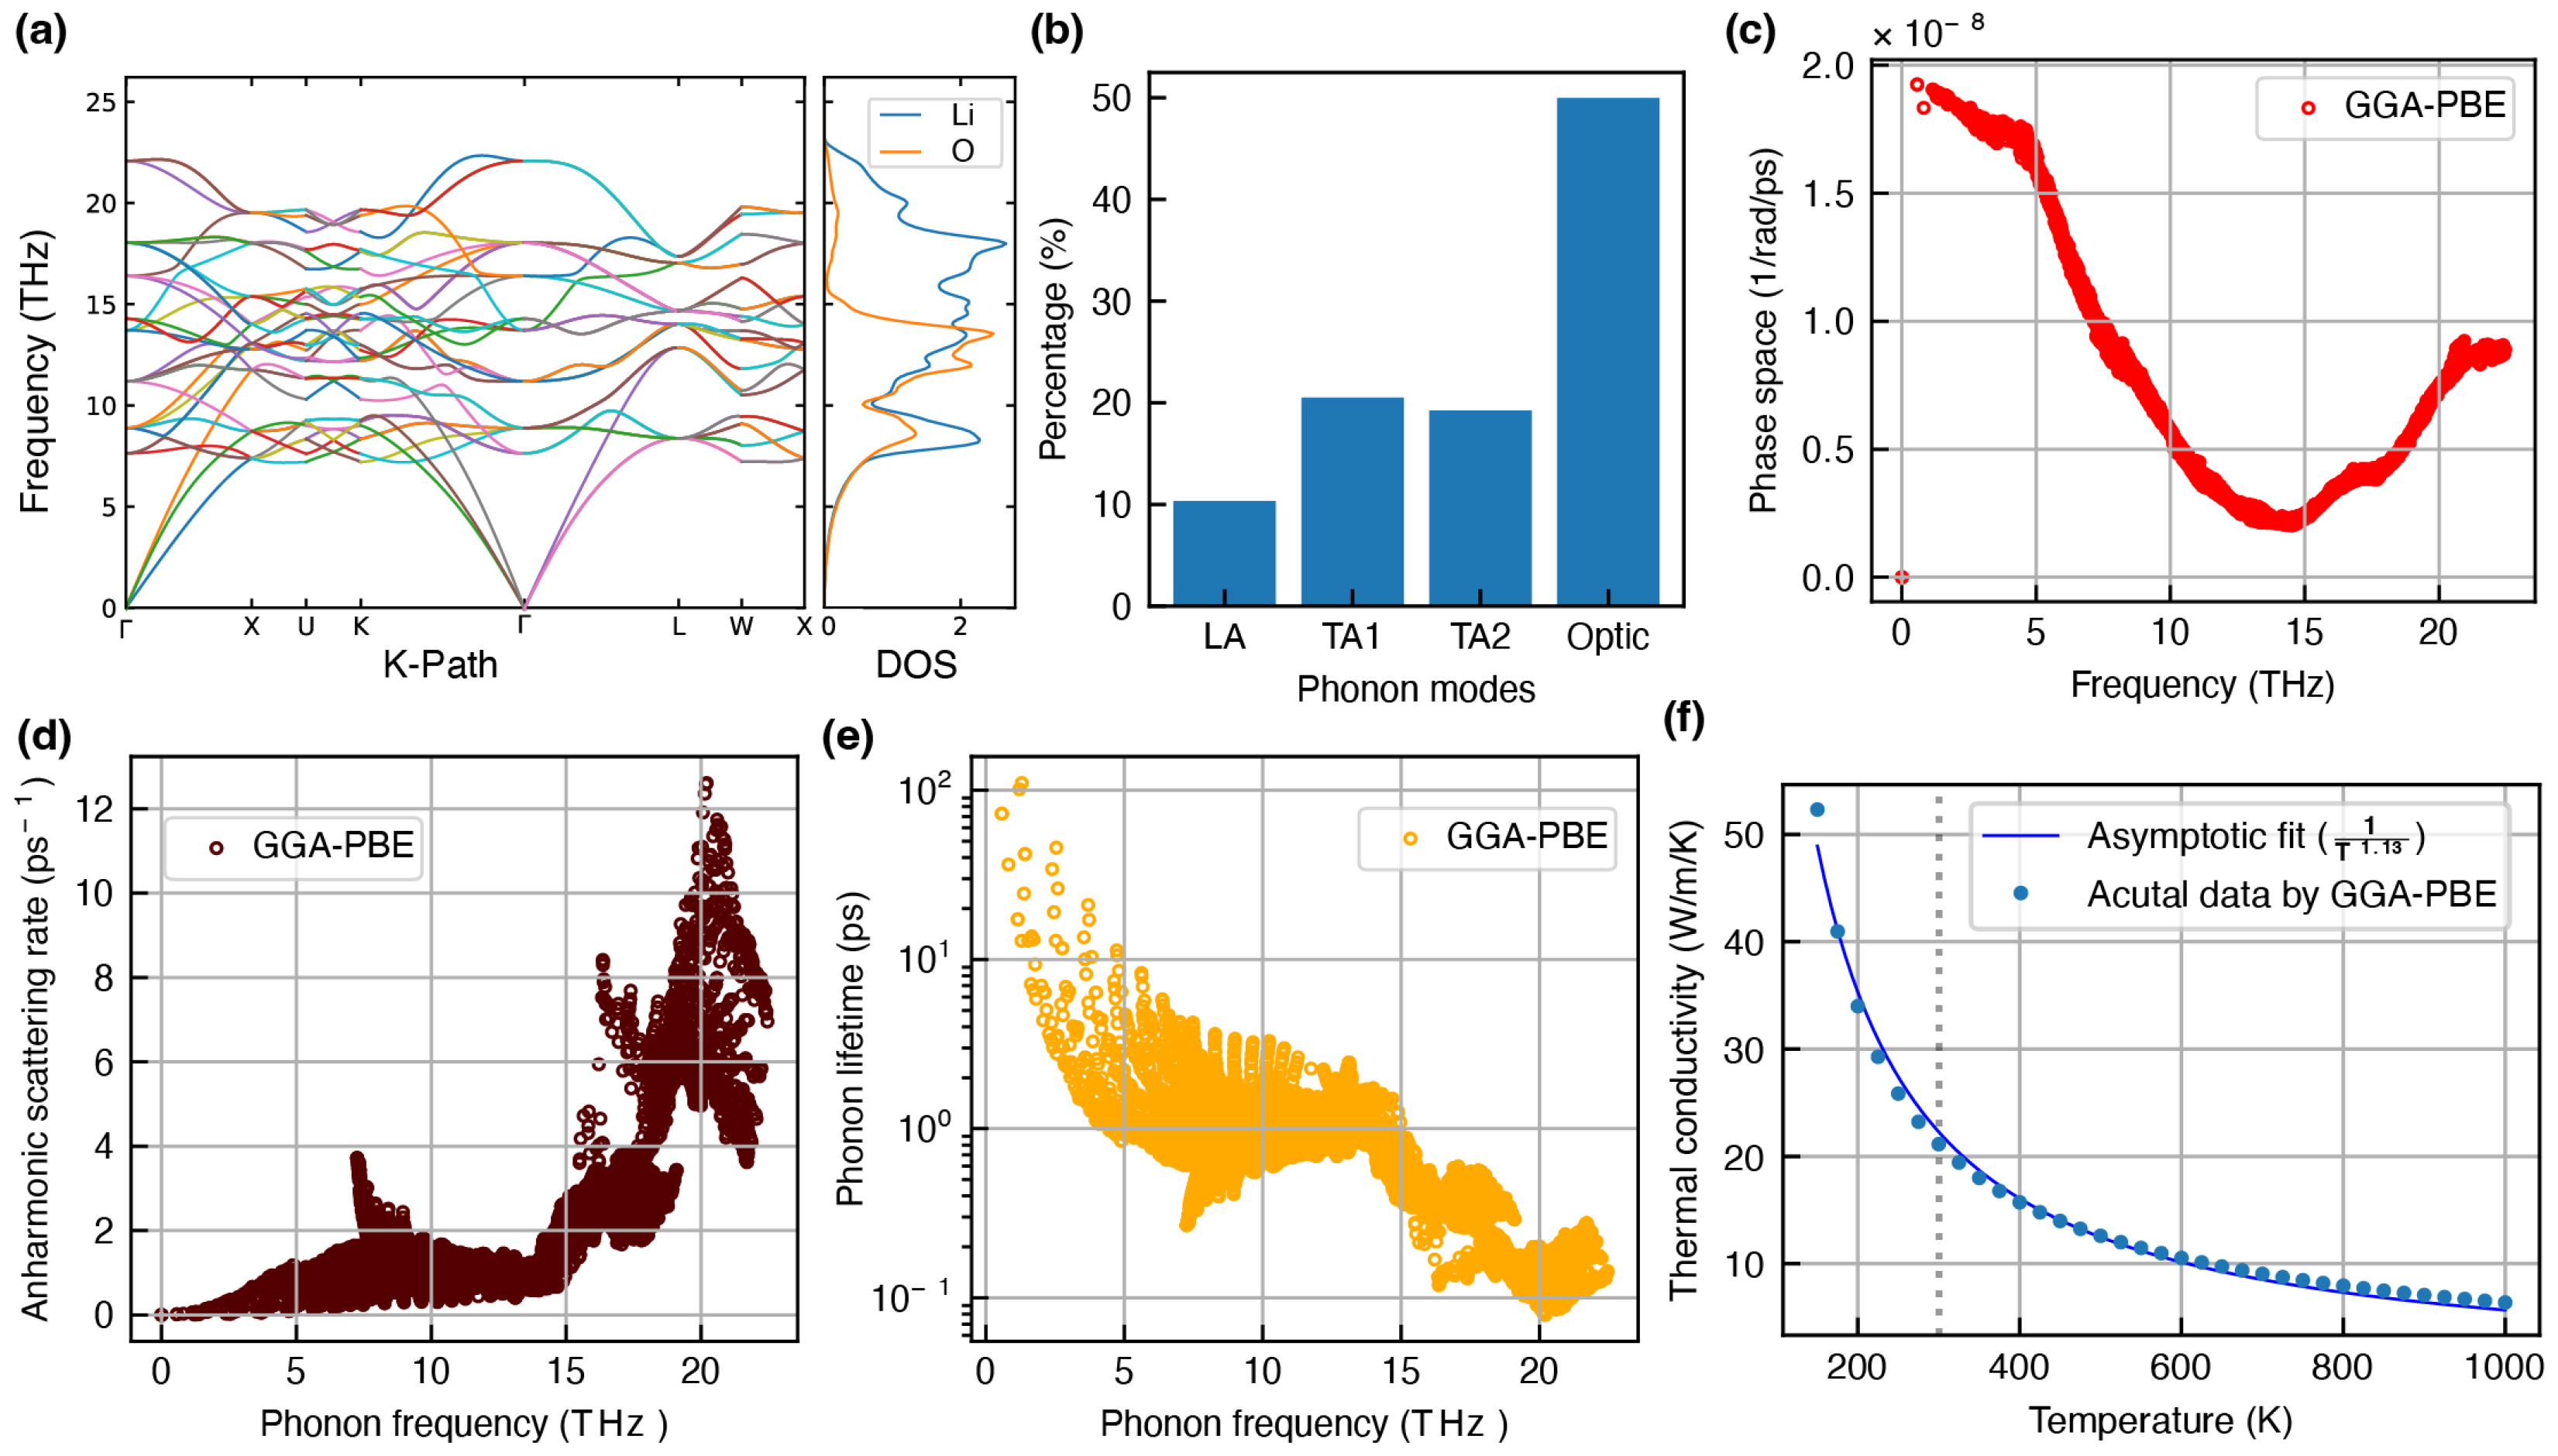
The dispersion of phonons along high-symmetry points in the conventional unit cell of Li2O is presented in Figure 4a. In the dispersion spectrum, phonon frequencies are observed in the 0–24 THz range. The splitting of the LO and TO branches at the Γ point reflects the characteristic ionic nature of Li2O. The projected phonon density of the states reveals that low-frequency modes are primarily associated with heavier O atoms, while lighter Li atoms dominate higher-frequency modes (>15 THz). This observation underscores the sensitivity of thermal conductivity to the density and distribution of O atoms within the crystal lattice.
The contribution of various branches of phonons to thermal conductivity is illustrated in Figure 4b, highlighting the significant role of optical modes in heat transport. This further suggests that the group velocity of optical modes cannot be neglected in Li2O, contrary to the behavior often observed in other materials with a higher bandgap. The effect of acoustic phonon modes on thermal conductivity can be understood from the three-phonon scattering phase space. This phase space, shown in Figure 4c, indicates a greater availability of scattering channels at lower frequencies for acoustic modes. This results in fewer scattering events and longer phonon lifetimes, particularly for acoustic modes, as shown in Figure 4d and Figure 4e, respectively. Consequently, acoustic phonons also contribute approximately 51% of the total thermal conductivity, which is equivalent to the contribution of optic phonons, emphasizing their equally crucial role in heat transport through Li2O.
The thermal conductivity curve shown in Figure 4f exhibits an asymptotic trend with an increasing temperature due to significant Umklapp scattering, and a power law fit reveals a dependence of 1 / T 1.13 for the temperature range 150 to 1000 K, as expected from kinetic theory [52]. The room-temperature thermal conductivity, calculated using the GGA-PBE functional, is found to be 21.13 W / ( m · K ) , which is well in agreement with the values reported in both experimental and computational studies, as summarized in Table 2.
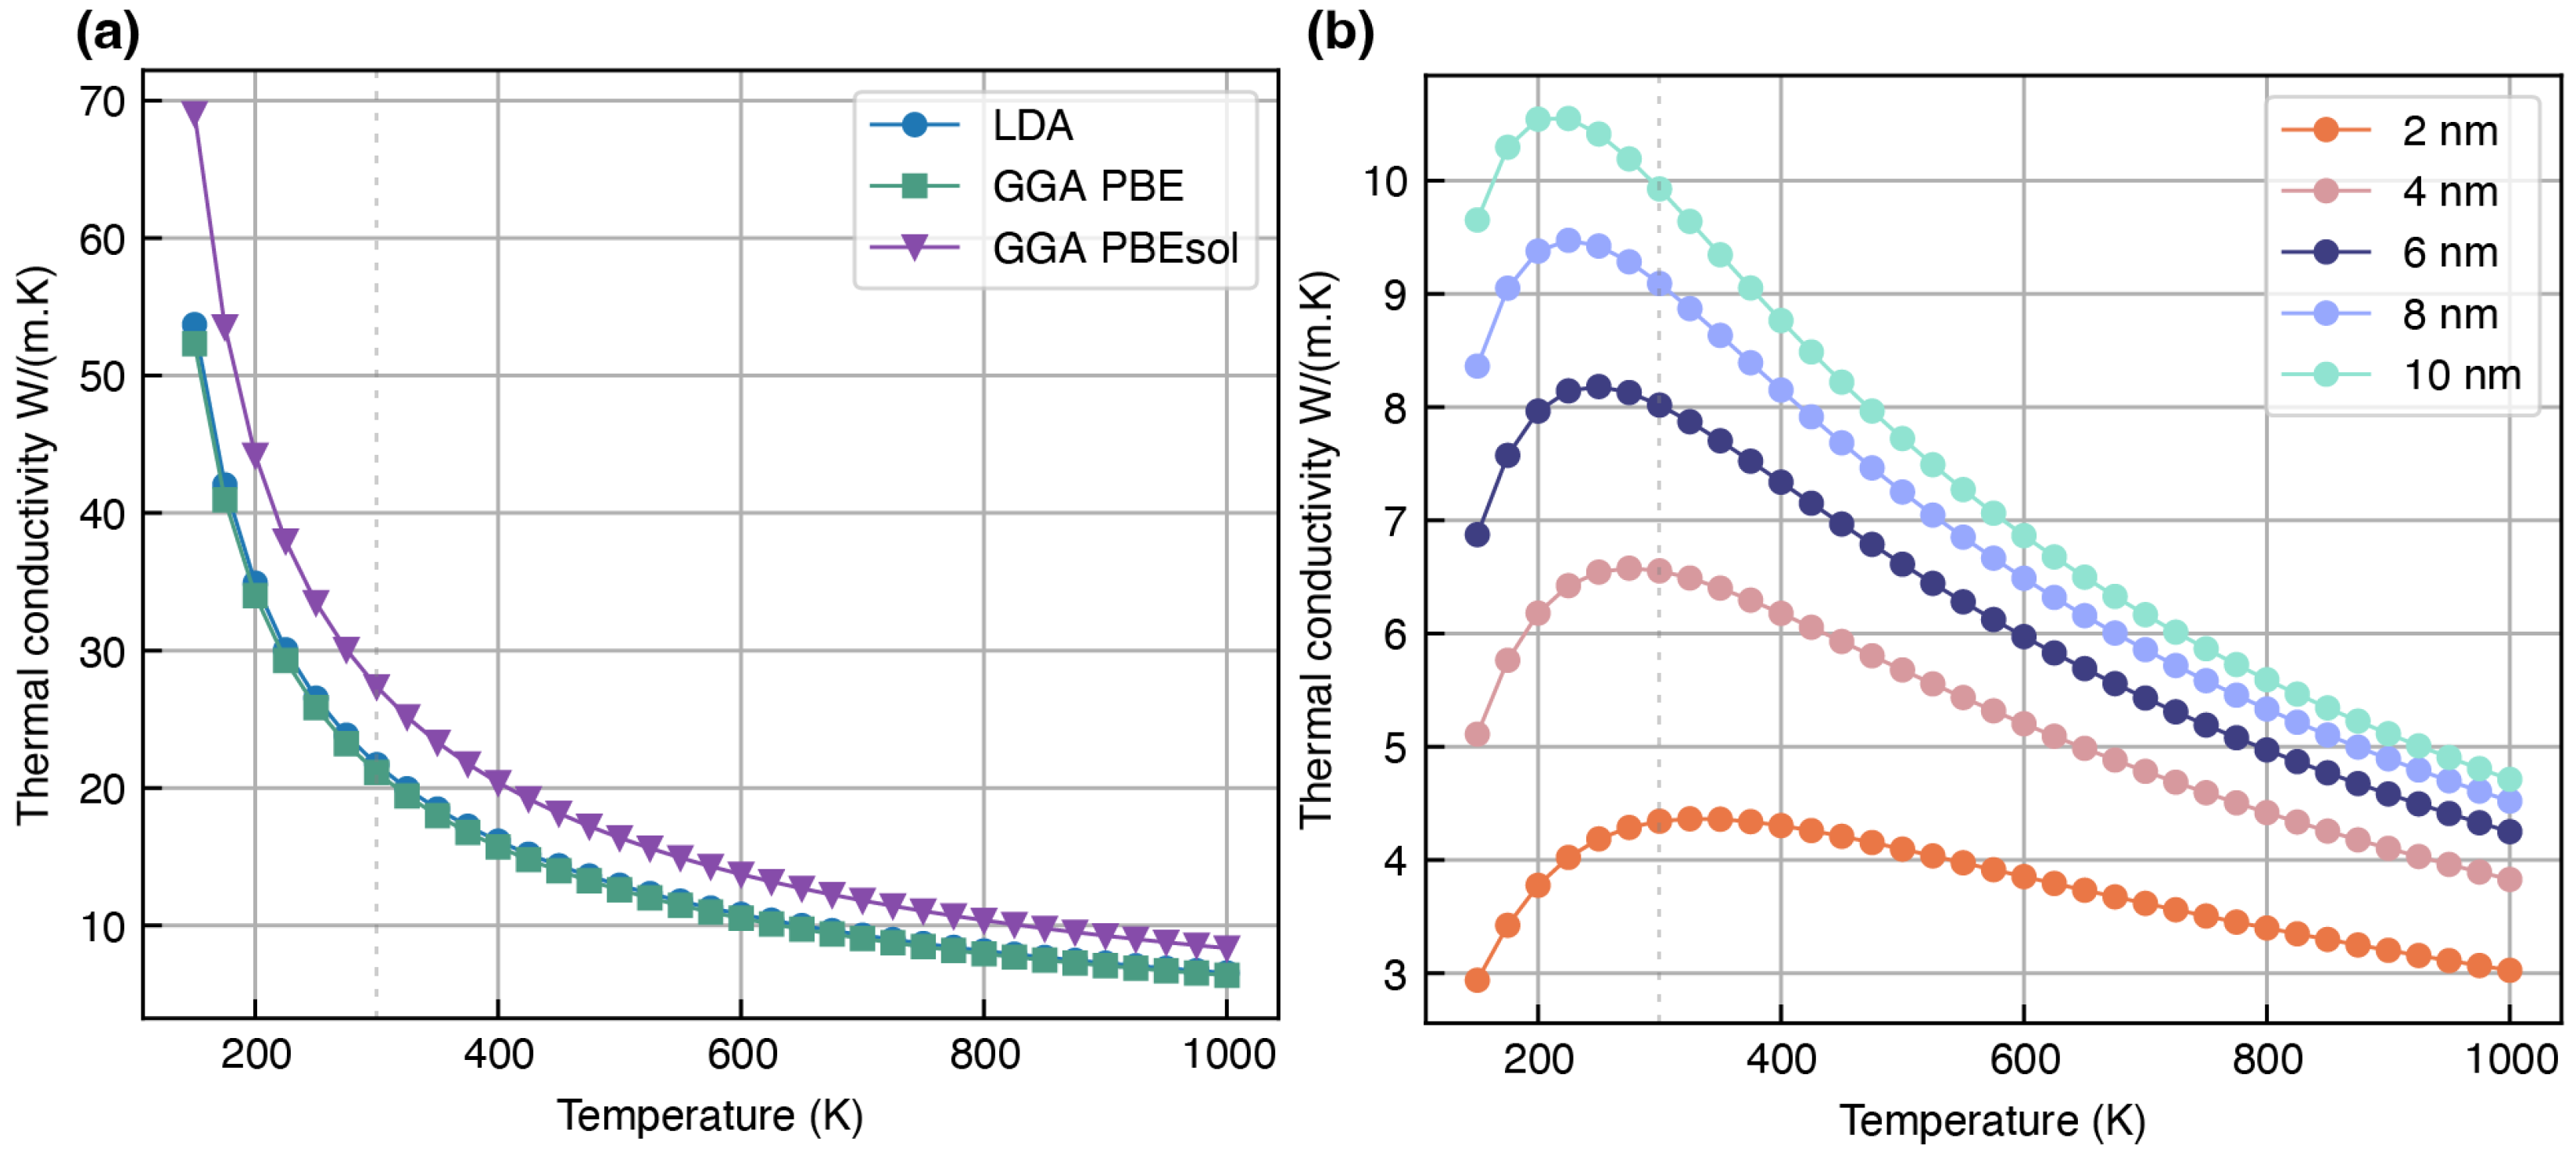
When comparing the thermal conductivity calculations using the LDA, GGA-PBEsol, and GGA-PBE functionals, it was found that the GGA-PBE-based calculations produce results that closely align with the experimental results, while the GGA-PBEsol overestimates the thermal conductivity by approximately 7 W / ( m · K ) , as shown in Figure 5a. It was also observed that the LDA functional produced results closely matching those obtained from the GGA-PBE functional, indicating its potential as a reliable alternative.
To investigate the influence of grain boundary effects, additional calculations were performed using the GGA-PBE functional, varying the size of the slabs used in the simulation. The results in Figure 5b indicate that grain boundary dependence is mainly pronounced at lower temperatures, where phonon boundary scattering becomes significant. Compared to SEI grains where lattice thermal conductivity is computed considering only Umklapp phonon scattering, the inclusion of grain boundary effects results in a significant reduction in thermal conductivity. At 300 K, thermal conductivity decreases by ≈64%. Furthermore, a clear trend of an exponentially proportional increase in thermal conductivity is observed with an increasing grain size, signifying the influence of boundary scattering on heat transport properties.
  • Li2S: The presence of Li2S is confirmed in the SEI mainly when the electrolyte has polysulfide compounds of the argyrodite family [56]. Recent studies suggest that Li2S is also a promising candidate in the SEI for stable dendrite-free cycling [57,58]. This study employs the FCC structure of Li2S (Figure 1c) for phonon simulations, which shares a similar crystal structure to Li2O.
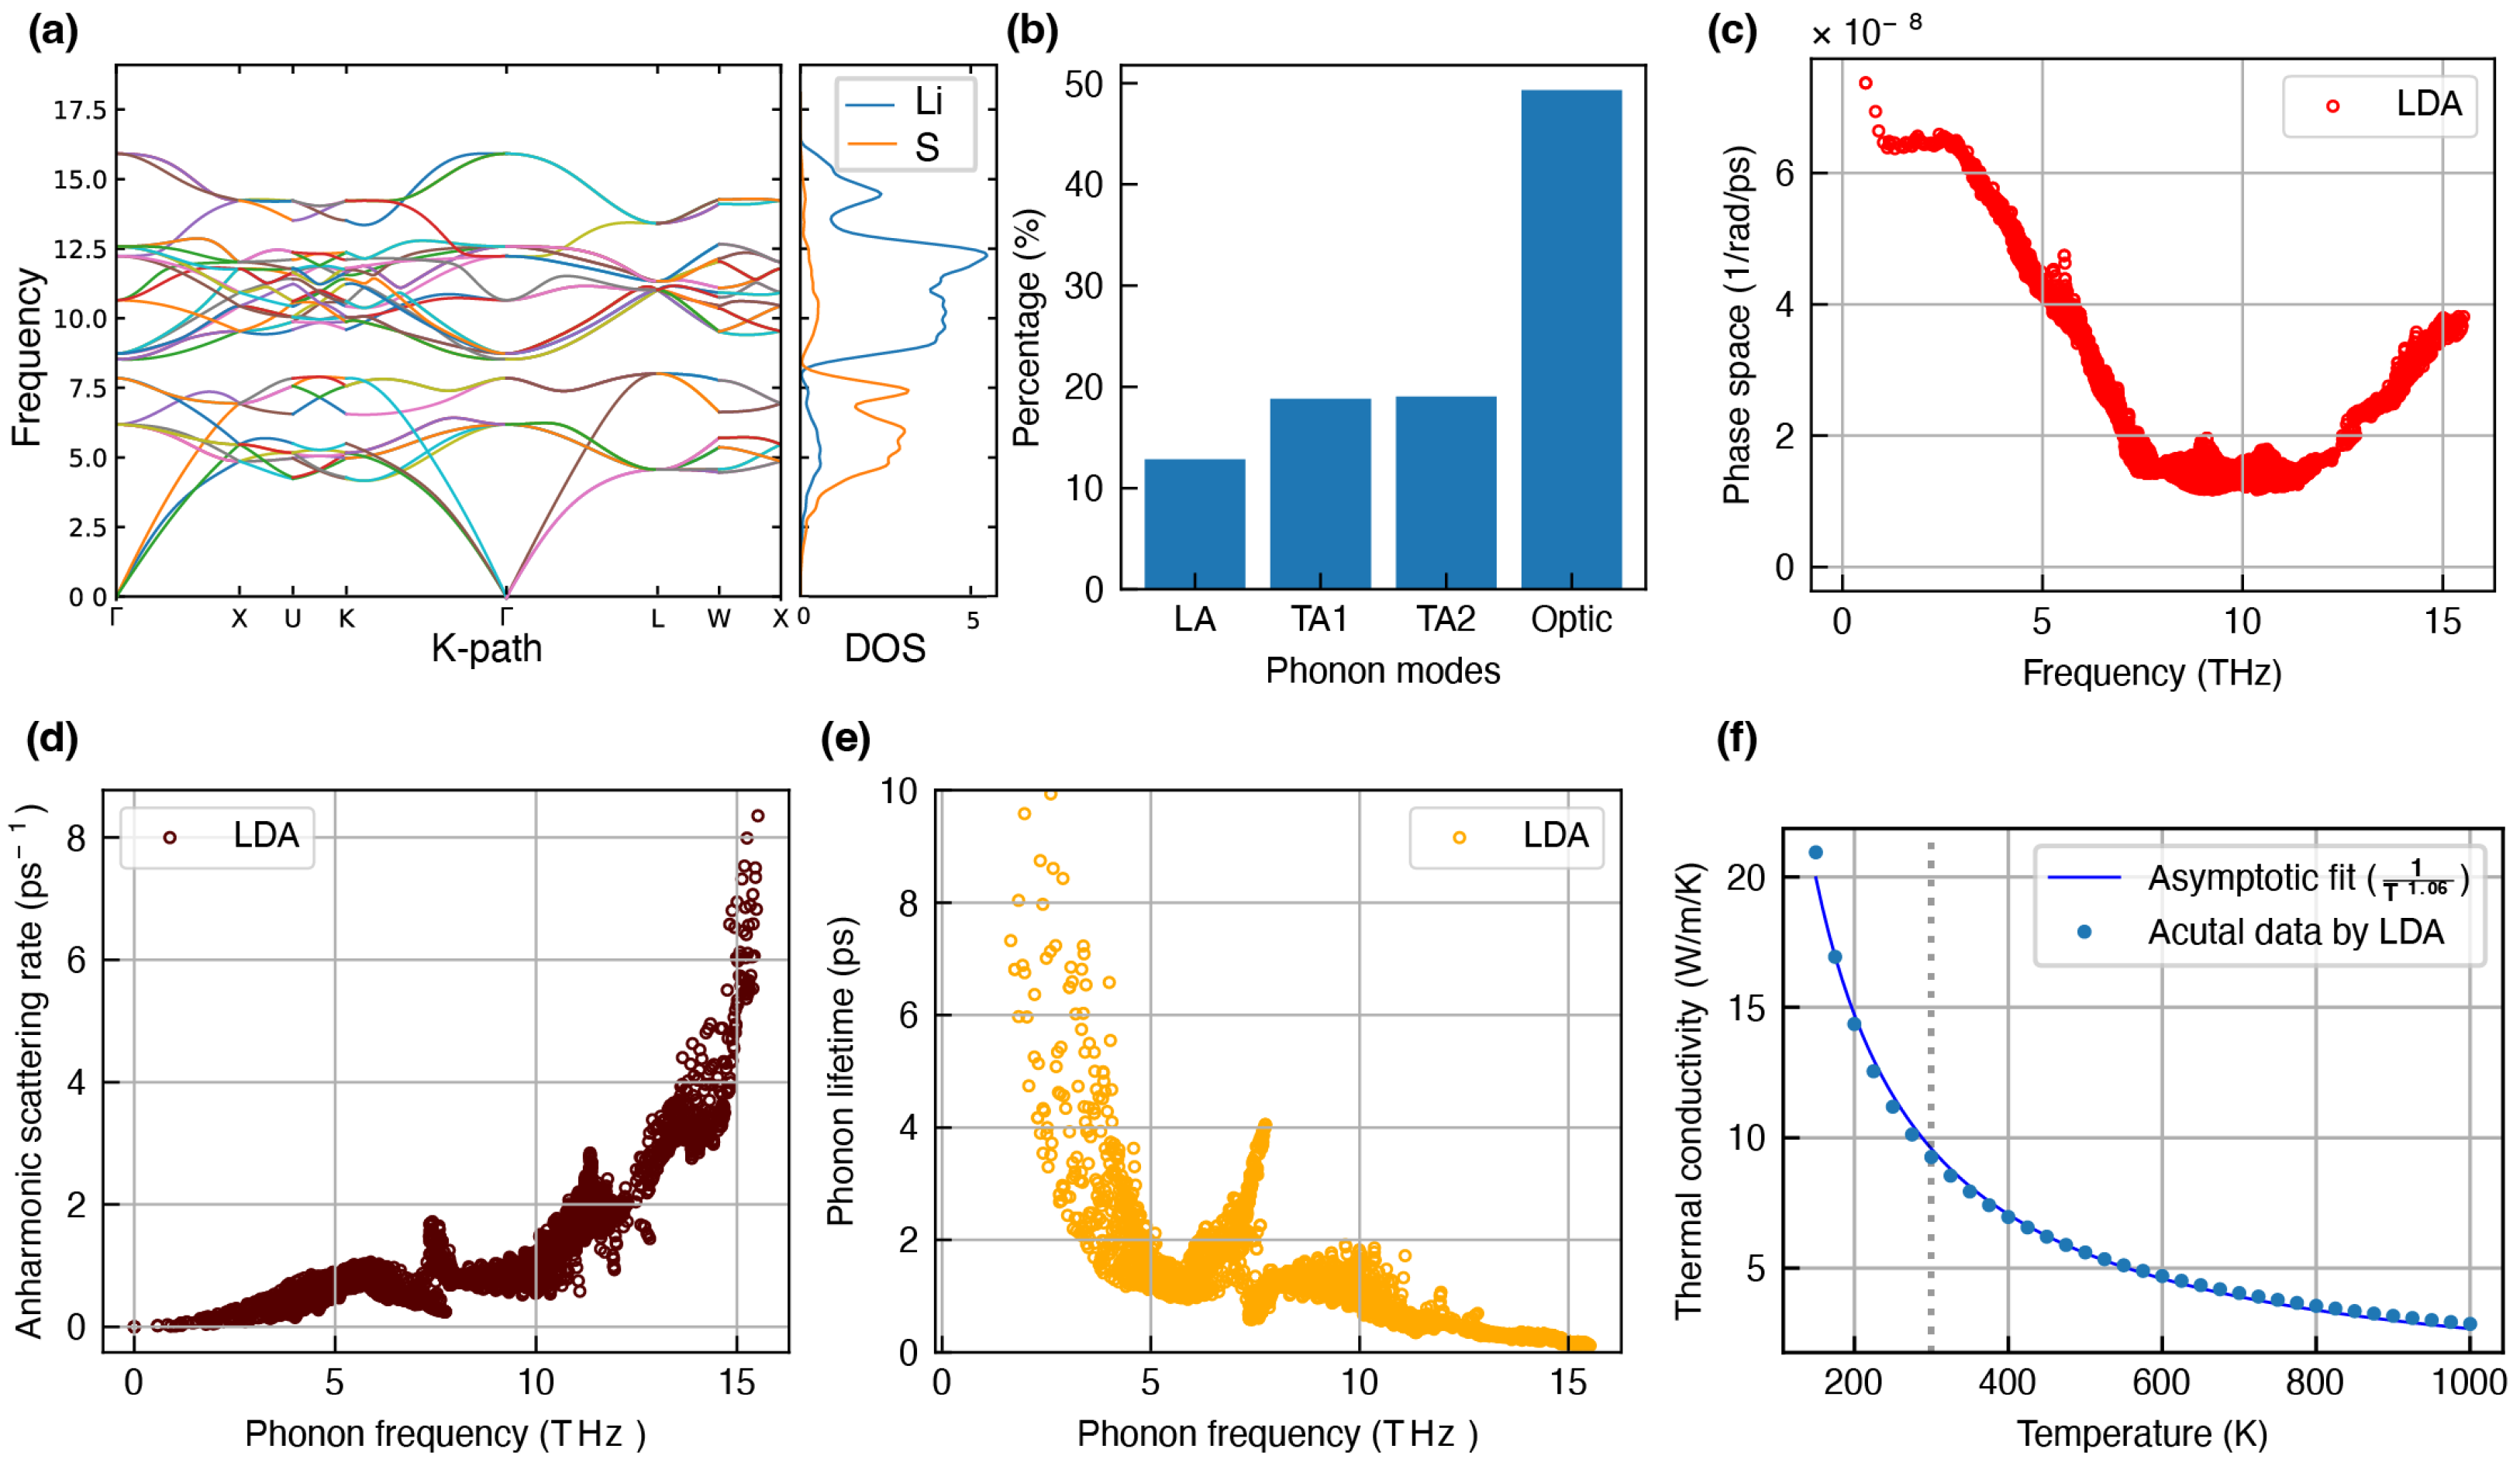
The theoretical electronic bandgap of Li2S has been reported to range from 3.3 to 5.1 eV, classifying it as an electronic insulator with minimal electronic conduction due to the low concentration of electron polarons [59]. With wide electronic bandgap characteristics, heat transport in Li2S is assumed to be carried out mainly through phonon scattering. In the phonon dispersion spectrum presented in Figure 6a, it can be seen that the frequency of phonons ranges from 0 to 16 THz. The mass difference between Li and S atoms is evident in the spectrum, as the optical band is contributed to mainly by Li, and the acoustic band is mainly contributed to by the S atom. The Li atom especially lies in the higher-frequency optical bands that span 8 to 16 THz, whereas the lower part of the optic modes mostly comes from S atoms.
When assessing the contributions of individual phonon modes to thermal conductivity (Figure 6b), it can be seen that the optic modes contribute equivalently to the acoustic modes to the total thermal conductivity. Within the acoustic modes, the highest contribution comes from the TA modes when compared to the LA modes. The lower scattering rate (Figure 6c), and, hence, the elevated lifetime of phonons in the lower-frequency regime, explains the dominance of acoustic modes in thermal conductivity. Meanwhile, a larger optic bandwidth and dispersion result in more channels in the phase space at a higher frequency range, as shown in Figure 6c, which then results in strong acoustic phonon scattering (hence the shorter lifetime) and subsequently reduces the thermal conductivity, as depicted in Figure 6d–f. The temperature-dependent thermal conductivity of Li2S, shown in Figure 6d, exhibits a typical asymptotic trend with temperature. As the temperature increases, the power law fit with the fit parameter 1 / T C yields a value of 1 / T 1.06 , which is in close agreement with predictions from kinetic theory [52].
Figure 7a depicts a comparative analysis of temperature-dependent lattice thermal conductivity using the LDA, GGA-PBE, and GGA-PBEsol functionals, which reveals that all three produce closely aligned results. Notably, among them, the LDA functional demonstrates a closer agreement with the experimental and simulation data. Using the LDA functional, we also analyze the effects of the grain boundary on thermal conductivity, as shown in Figure 7b. The results suggest that grain boundary effects are more pronounced in the lower-temperature regime, with an average decrease in the thermal conductivity values of almost 60%. The graph also shows that the grain size is exponentially proportional to the thermal conductivity of the lattice.
  • Li2CO3: The presence of Li2CO3 reported in the SEI formed from the reduction of organic carbonate solvents, such as ethylene carbonate and propylene carbonates [1]. Fast Li-ion transport kinetics is one of the notable phenomena reported in SEI layers rich with Li2CO3 [60]. Although it is a good ionic conductor, Li2CO3 is known for its poor stability, leading to a dynamically evolving and porous SEI, especially with Li-metal electrodes [61]. Since the temperature dependence of the ionic conductivity of Li2CO3 is well known, the following discussion of its thermal transport properties provides valuable insights into the temperature-dependent Li-ion transport profile [62,63].
Here, we used monoclinic Li2CO3 with the C 2 / c space group from the Materials Project repository with id mp-3054 and the structure illustrated in Figure 1d. The lattice information for this system is briefly described in Table 1. The atomic arrangement in Li2CO3 forms a three-dimensional network, where the LiO4 tetrahedron and the CO3 groups are interconnected. This structural configuration plays a crucial role in maintaining the overall stability of the lattice.
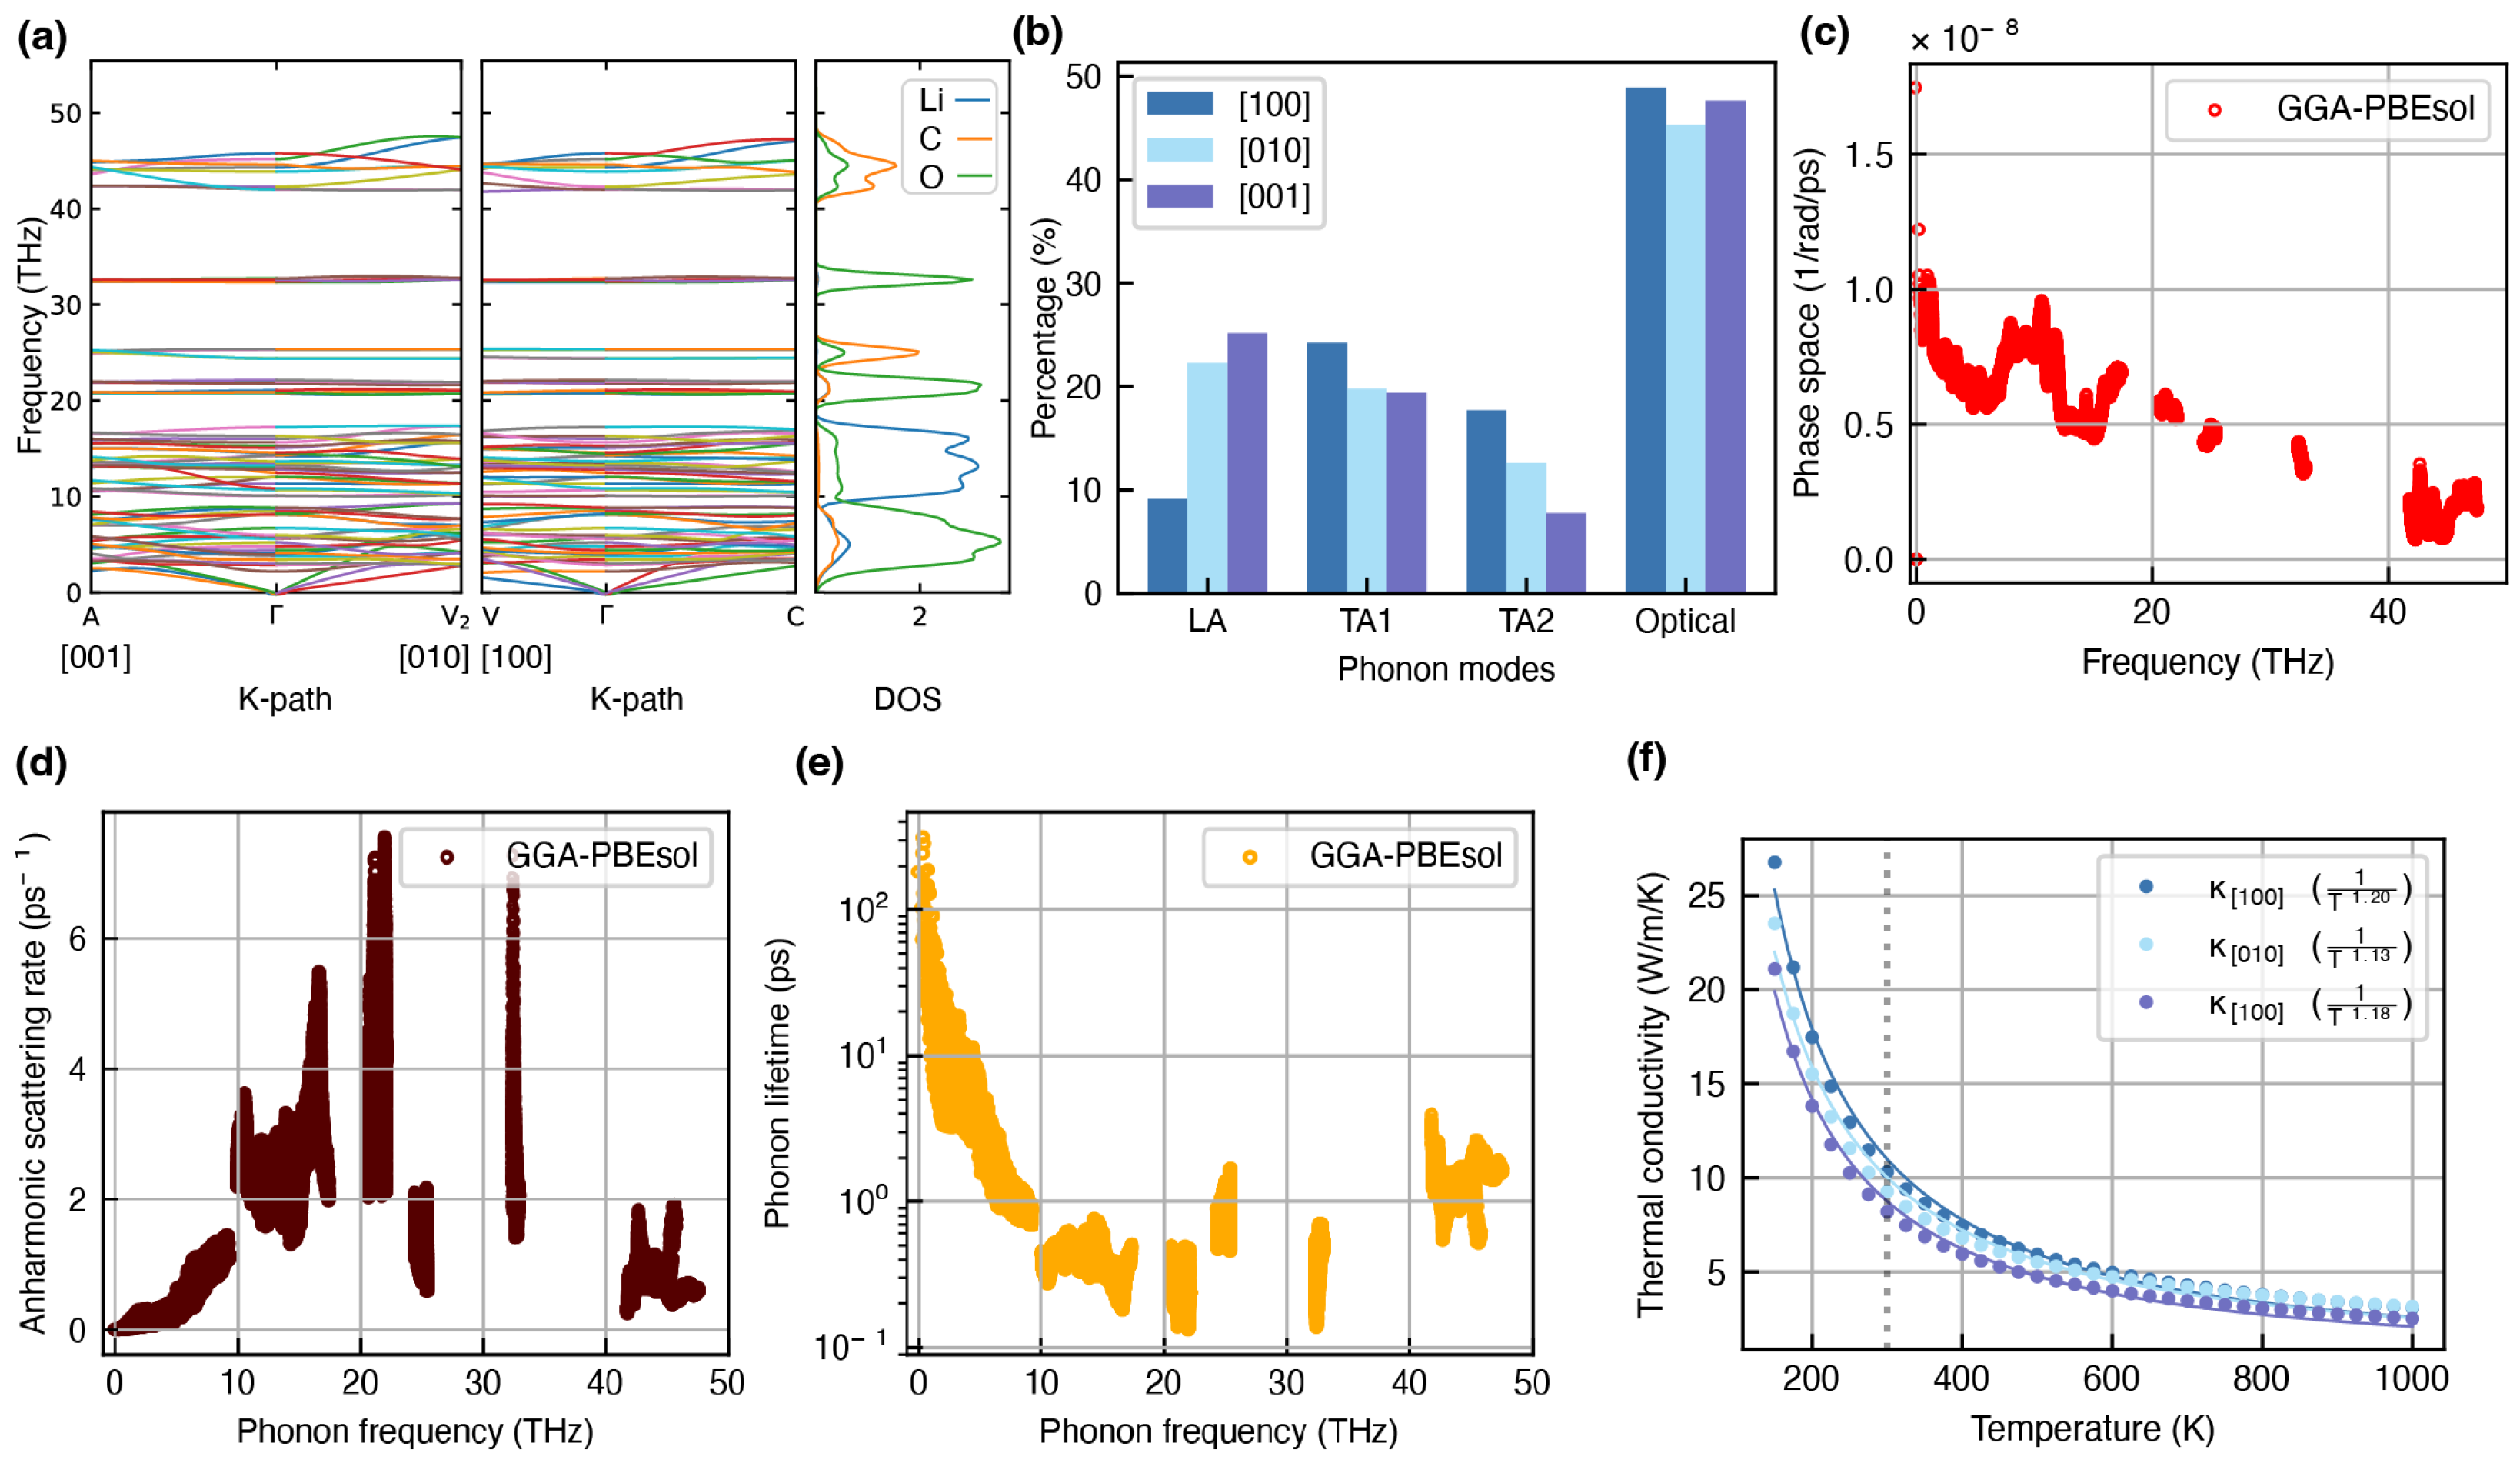
When analyzing the phonon dispersion spectrum of Li2CO3 shown in Figure 8a, it is found that the asymmetry of the lattice results in distinct group velocities for phonon modes along the three crystallographic directions [100], [010], and [001]. As illustrated in Figure S1, the group velocities also vary across these directions, highlighting the anisotropic nature of phonon transport. This directional dependence arises from the underlying lattice dynamics, is governed by the elastic moduli tensors, and reflects the variation in vibrational behavior along different crystallographic axes [64].
The frequency of phonons in Li2CO3 varies from 0 to 45 THz , with the density of states for the acoustic modes predominantly contributed to by oxygen atoms. In contrast, carbon and lithium atoms contribute primarily to the optical modes. That being said, a distinct sharp peak in the phonon density of states, arising from oxygen atoms, is observed at 22 THz and 33 THz within the optical band spectrum. This suggests that oxygen atoms, or associated vacancy defects, play a significant role in influencing the thermal properties of Li2CO3. Furthermore, the absence of an optical–acoustic bandgap results in an enhanced interaction between acoustic and optical phonons. This interaction is more likely to have a significant impact on the thermal transport properties of Li2CO3.
Figure 8b depicts the individual contributions of phonon modes to the thermal conductivity of the lattice at 300 K. Prima facie, it is evident that there exists a direction dependence in the contribution to all three phonon modes. For example, in the acoustic mode, the direction [001] exhibits the lowest group velocity when compared to the other modes, which implies a reduced contribution to the overall thermal conductivity along this direction, and this can also be seen in Figure 8f at 300 K. Similarly, within the acoustic mode itself, the group velocity along the [100] direction is the highest, particularly in the TA1 and TA2 modes. This results in a greater contribution to the thermal conductivity along the [100] direction, which is especially evident in the low-temperature range, which includes room temperature, as shown in Figure 8f. Similarly, when analyzing the contribution of the optical band to thermal conductivity at 300 K, it can also be seen that the contribution of the phonon mode to thermal conductivity in the [100] direction is the highest, owing to the higher group velocity in this direction. In general, the influence of the optical mode is comparatively less pronounced in the low-temperature thermal response.
The asymptotic nature of the thermal conductivity curves with respect to temperature can be understood from the three-phonon scattering phase space, along with the corresponding phonon scattering rate and lifetime, as illustrated in Figure 8c–e, respectively. The expanded phase space in the low-frequency regime and a reduced scattering rate lead to an extended phonon lifetime, contributing to higher thermal conductivity at low temperatures. However, when phonon frequencies are moved to higher frequencies, primarily associated with optical phonons, where the phase space becomes more constrained, it results in increased phonon scattering and a shorter lifetime, ultimately leading to lower thermal conductivity in the high-temperature regime.
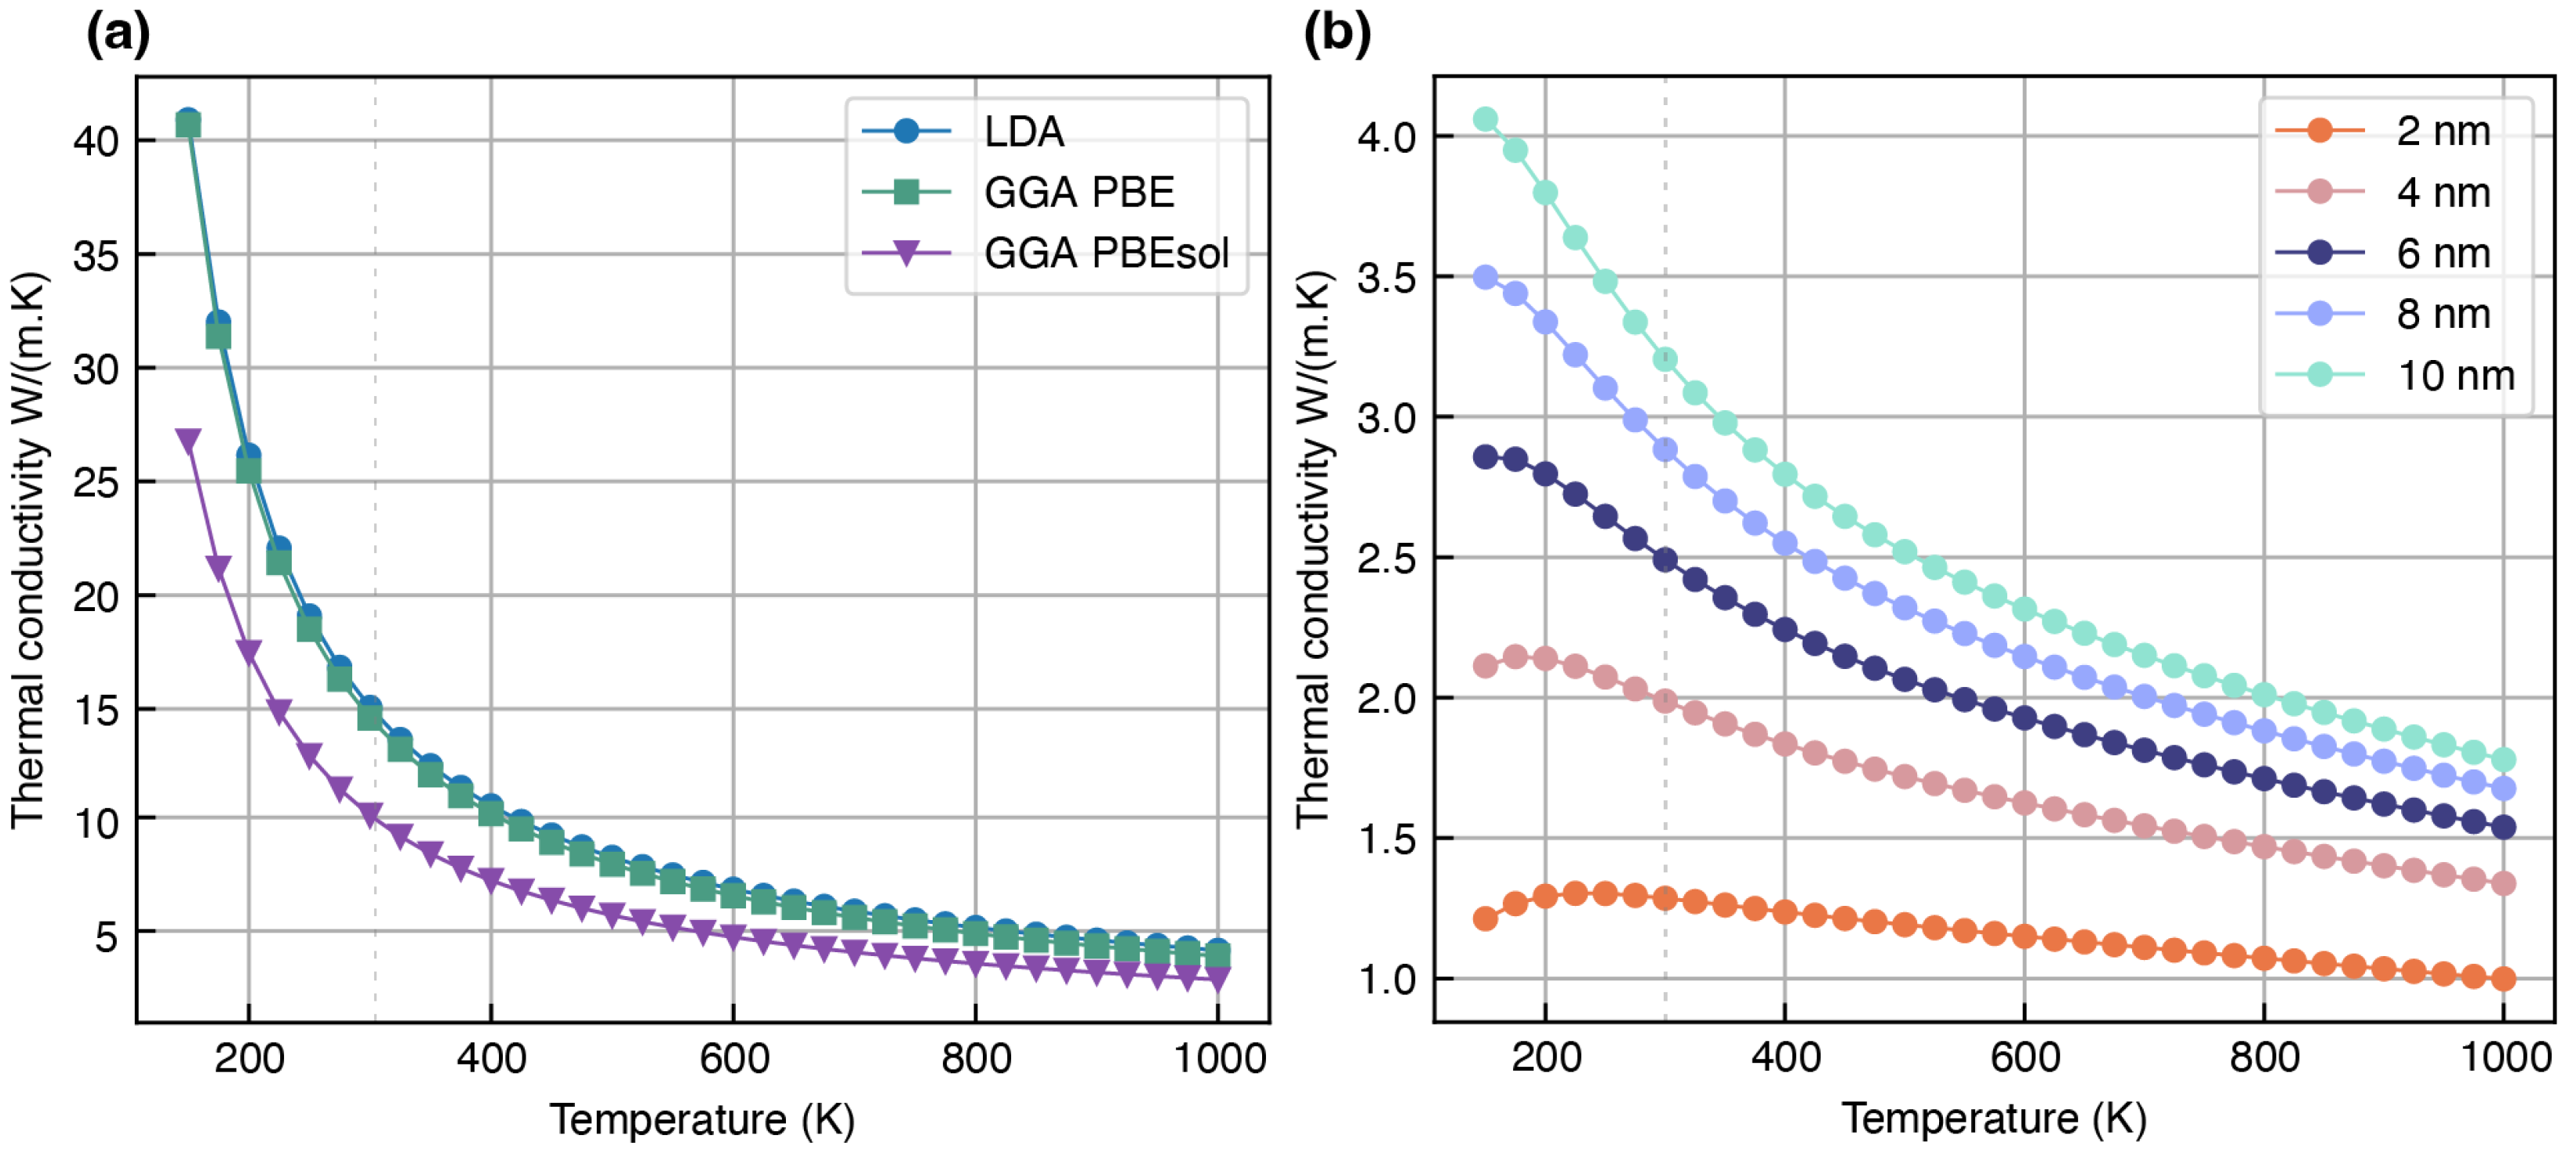
In Figure 9a, this study compares the cumulative thermal conductivity of the Li2CO3 lattice calculated using three different DFT exchange–correlation functionals: the LDA, GGA-PBE, and GGA-PBEsol. The cumulative thermal conductivity at 300 K is the lowest when using the GGA-PBEsol functional, with a value of 9.29 W / ( m · K ) , when compared to the other two functionals. In contrast, experimental studies reported room-temperature thermal conductivity values of approximately 2.60 W / ( m · K ) and 2.75 W / ( m · K ) [65,66]. These studies also mentioned the presence of grain agglomeration in the experimental samples. Considering this, the significant reduction in thermal conductivity due to grain boundary scattering—discussed in the following paragraph—helps reconcile the discrepancy between the experimental measurements and DFT-predicted values.
The impact of grain boundaries on thermal conductivity is illustrated in Figure 9b. The thermal conductivity increases with an increasing grain size, consistent with phonon–boundary scattering theory [67]. Also, at lower temperatures, phonon–boundary scattering dominates heat transport, significantly reducing thermal conductivity in fine-grained materials. With an increasing temperature, other scattering mechanisms (for example, phonon–phonon interactions) begin to play a more dominant role, thus diminishing the relative influence of grain boundaries on thermal transport [68]. In particular, when grain boundary effects are taken into account, the thermal conductivity at 300 K decreases by approximately 78% compared to the heat transport through Umklapp phonon scattering. For a representative grain size of 6 nm, the cumulative thermal conductivity of the calculated lattice is closely aligned with the experimental values reported in previous studies [65,66]. This agreement strongly supports the validity of incorporating grain boundary scattering into the DFT-based model and resolves the discrepancies between the simulated and experimental thermal conductivities.
  • LiOH: Earlier studies attributed the presence of LiOH in the SEI to water contamination [69,70]. However, more recent research suggests that LiOH forms naturally during SEI development [71,72]. Some studies reported that LiOH reduces battery efficiency by compositional transformation in the SEI from lithium ethylene dicarbonate to lithium ethylene monocarbonate, ultimately leading to capacity depletion [73]. Furthermore, when LiOH is part of the SEI, it is generally less conductive than other inorganic species, such as LiF, ultimately reducing the efficiency of the battery pack [74]. Despite its poisoning nature, LiOH can contribute to the stability of the SEI layer and can also undergo further reactions, especially in the presence of other components, such as hydrofluoric acid from the electrolyte, leading to the formation of more stable compounds such as LiF [75].
This study used an anhydrous form of LiOH with a tetragonal crystal system of the space group P4/nmm. The structure was obtained from the Materials Project repository with ID mp-23856, with the structure illustrated in Figure 1e. In this structure, lithium is in tetrahedral coordination with oxygen atoms, and oxygen atoms are coordinated to two lithium atoms and two oxygen atoms in a hydroxide group.
The phonon dispersion spectrum, shown in Figure 10a, reveals that the LiOH phonon frequencies range from 0 to 22 THz. The relatively heavier oxygen atoms predominantly contribute to the density of states for the acoustic and low-frequency optical modes. In contrast, the lighter lithium and hydrogen atoms primarily contribute to the high-frequency optical modes. Furthermore, a gap between the acoustic and optical modes is observed in the 4 to 5 THz frequency range, which is a typical characteristic of ionic crystals. Furthermore, the optic bands are relatively flatter, resulting in a lesser contribution of optic phonons to thermal conductivity, as seen in Figure 10b. Meanwhile, acoustic phonon branches show steeper slopes and, hence, a higher group velocity, contributing more to thermal conductivity. Figure 10a,b also show that both LA and TA phonons exhibit crystallographic direction-dependent group velocities, thus demonstrating variable mode contributions to the thermal conductivity—a behavior also observed in optical phonons. This directional dependence arises from the asymmetric nature of the crystal lattice with a lamellar structure, where atomic masses and interatomic forces vary with the crystallographic direction. Such an asymmetry also influences the phonon dispersion relations, leading to variations in group velocities along different crystallographic directions. For LiOH, this strong anisotropy is mainly attributed to the lamellar structure, which exhibits significantly increased resistance to normal heat flow in the lamellar plane direction [76]. Also, as illustrated in Figure 10, the group velocities vary across crystallographic directions, highlighting the anisotropic nature of phonon transport.
When examining the three-phonon scattering phase space of LiOH (Figure 10a), a proportional decrease in the available scattering channels with respect to frequency can be observed. This is likely due to the phonon dispersion in lower-symmetry systems, such as LiOH, leading to a broader distribution of phonon branches. This broadening reduces the number of phonon degeneracies and limits the number of allowed three-phonon interactions. The subsequent effects of this can also be seen in the anharmonic scattering rate and its corresponding phonon lifetime, as visualized in Figure 10a and Figure 10b, respectively. The scattering rate plot clearly reveals strong anharmonicity at higher frequencies, particularly in the 15 to 24 THz range. Furthermore, the presence of stronger anharmonicity in this structure does not necessarily expand the three-phonon phase space but rather redistributes the scattering probabilities.
The end results of the scattering can be seen in the thermal conductivity of the lattice as a function of temperature. The strong anisotropy in phonon propagation, resulting from the lower-symmetry lattice, reduces the involvement of optical modes due to anisotropic effects. This leads to a smoother decrease in the phase space, ultimately causing significant anisotropy in the thermal conductivity of the lattice, as shown in Figure 10f. In this figure, the three thermal conductivity curves exhibit a trend of 1 / T , with the specific exponents detailed in the inset. This behavior aligns with the predictions of kinetic theory [52], where thermal conductivity inversely depends on the temperature. At 300 K, the thermal conductivity follows the trend of κ [ 010 ] > κ [ 100 ] > κ [ 001 ] . In the literature, it has been reported that LiOH has experimental thermal conductivity values of 0.69 W / ( m · K ) and 1.69 W / ( m · K ) [77,78]. However, we observed that such studies did not account for the anisotropic nature or grain size dependence of thermal conductivity. As a result, the experimentally reported values may vary due to sample orientation and may decrease further due to the presence of fine-grain boundaries within the sample.
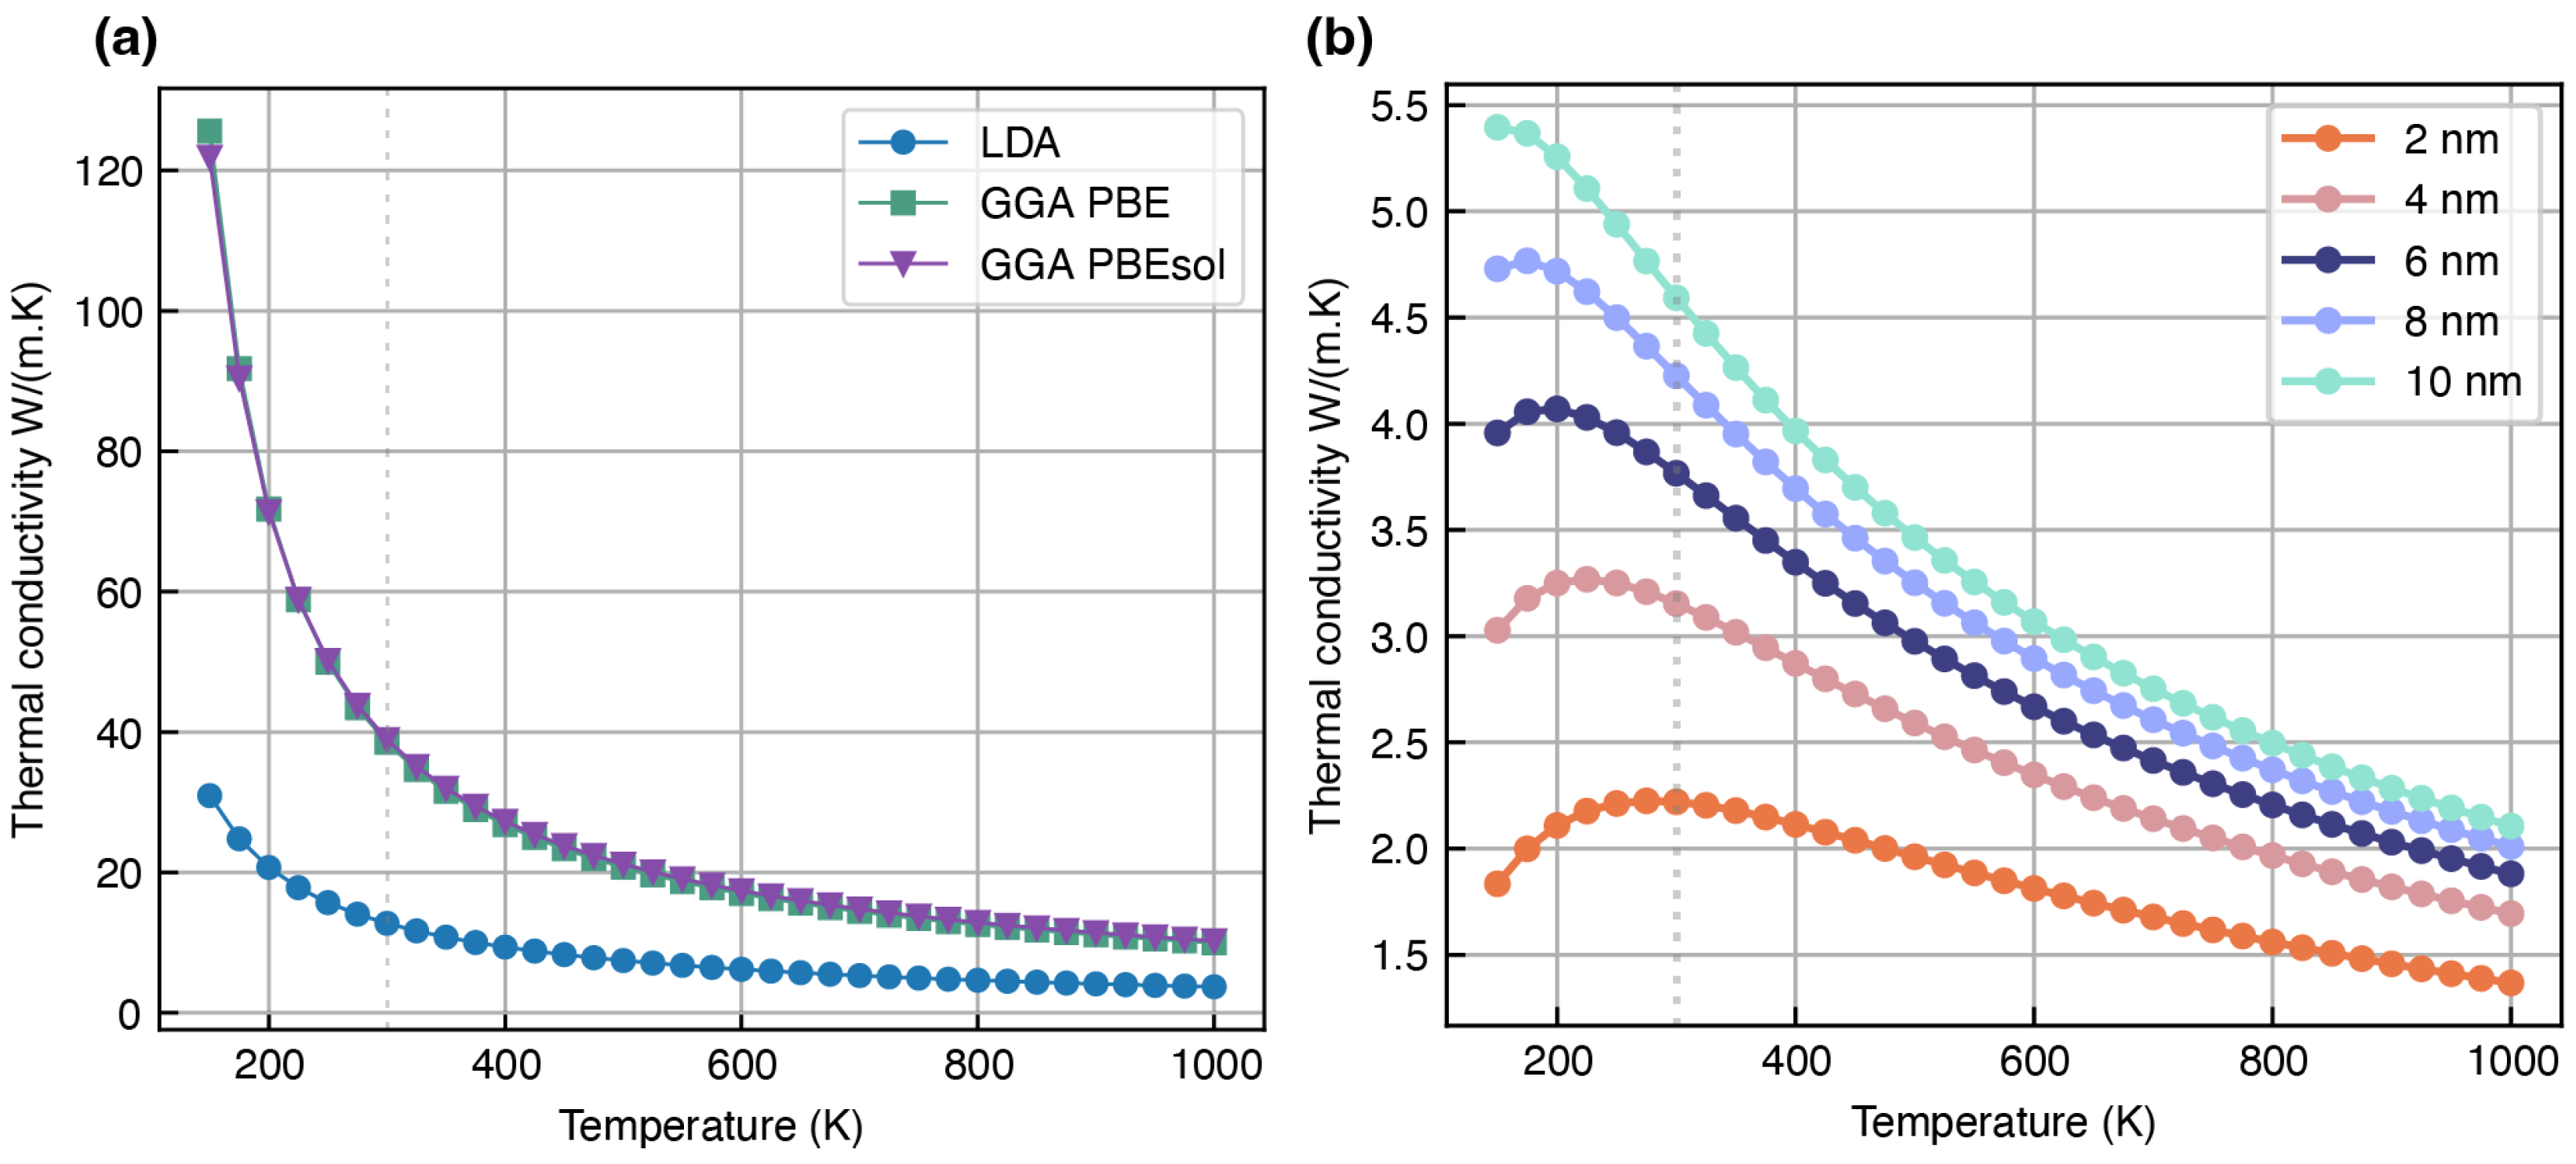
In addition to the exchange–correlation functional LDA, which is discussed above because of its better agreement with the lower values reported experimentally, this study also compares the thermal conductivity predictions obtained using the GGA-PBE and GGA-PBEsol functionals. The results, presented in Figure 11a, indicate that the GGA-PBE and GGA-PBEsol produce similar values but tend to overestimate thermal conductivity, for example, by approximately 13 units at 300 K.
Using the LDA functional, we also estimated the effects of the grain boundary on the cumulative thermal conductivity in LiOH. Figure 11b shows the thermal conductivity for a grain size ranging from 2 nm to 10 nm. The influence of the grain boundaries, introducing an additional boundary phonon scattering term, is particularly significant in the low-temperature regime, as seen in Figure 11b. Moreover, the increases in thermal conductivity with the grain size follow a trend closely resembling an exponentially proportional relationship. In addition, the incorporation of grain boundary effects results in a substantial reduction in thermal conductivity; for example, values at 300 K decrease by approximately 78% compared to thermal conductivity through Umklapp phonon scattering.

Overestimation of Lattice Thermal Conductivity

The room-temperature lattice thermal conductivities of all the SEI components discussed above are summarized in Table 2. For comparison, literature-reported experimental and computational values are also included. In this table, it can be observed that the computational simulations overestimate the thermal conductivity values compared to the experimental measurements for the SEI components, namely, Li2O, Li2CO3, and LiOH.
Although this discrepancy is less pronounced for LiF, it is significantly observable across the other components. For example, previously reported DFT and MD simulations of Li2O yield thermal conductivity values notably higher than those obtained experimentally. In this study, a similar overestimation is also observed for the DFT-calculated values for Li2CO3 and LiOH. This suggests that first-principles predictions, while useful, may not fully capture all scattering mechanisms in these materials. Molecular dynamics simulations represent a valuable direction for future work with fine-tuned interatomic potentials to incorporate anharmonic effects and defect-induced phonon scattering more explicitly, potentially narrowing the gap between theoretical and experimental results.
Table 2. Lattice thermal conductivity of SEI components at 300 K calculated using only Umklapp phonon scattering with the LDA, GGA-PBE, and GGA-PBEsol functionals. Experimental values from the literature are included for a comparison.
Components κ Present WorkTheoreticalExperimental
(mp-id) W / ( m · K ) LDAGGA-PBEGGA-PBEsol
LiF (mp-1138) κ 13.0112.5418.6513.48 a [24],
13.6 b [28],
14.8 c [29],
14.59 d [25]
14.09 [30],
16.5 [31],
13.2 [79],
15.5 [79]
Li2O (mp-1960) κ 21.7021.1420.8920 e [80],
22.38 f [81]
15.52 [82]
Li2S (mp-1153) κ 9.4212.9013.0211.96 i [81],
6 j [83]
N.A
Li2CO3 * (mp-3054) κ c u m . 12.0311.449.26N.A.2.60 [65],
2.75 [66]
κ [ 100 ] 15.0714.6010.32N.A.
κ [ 010 ] 9.8411.429.27N.A.
κ [ 001 ] 11.218.318.21N.A.
LiOH * (mp-23856) κ c u m . 10.6532.7235.20N.A.0.69 [77],
1.69 [78,84]
κ [ 100 ] 12.7838.5338.94N.A.
κ [ 010 ] 15.3940.7448.00N.A.
κ [ 001 ] 3.7818.9118.66N.A.
[*] Exhibits anisotropy in thermal conductivity. [a, d, f, i, j] Density functional theory. [b] Numerical approach through Callaway–Holland model using empirical data. [c] CALPHAD-based prediction. [e] Non-equilibrium molecular dynamics.
Given the strong grain size dependence of the thermal conductivity demonstrated in this study, it can be reasonably inferred that the experimental samples used in previous studies may have had grain-rich microstructures. For example, well-segregated grain structures have been reported during the laboratory-grade synthesis of Li2O, which also contributes to lowering the sintering temperatures of ceramic systems [85]. Similarly, for Li2CO3, studies have shown that the particle size of the crystals varies depending on the precipitation method employed during synthesis, where homogeneous precipitation typically yields smaller particles than heterogeneous precipitation under similar conditions [86,87]. Moreover, a study by Wang et al. [66], which is also used here for a comparison, confirms the presence of distinct grain boundary phases in the samples investigated therein.
For LiOH, we compared the experimental findings reported by Yang et al. [77], Wang et al. [78], and Li et al. [84]. All three studies consistently reported the presence of fine-grained microstructures and significant particle agglomeration, as confirmed by SEM analyses. In this context, the grain size dependence of thermal conductivity observed in this study, characterized by an exponential decrease in conductivity with a decreasing grain size further substantiates the validity of our DFT-predicted thermal conductivity, which explicitly incorporates phonon scattering at grain boundaries.

4. Conclusions

Based on the notion of the direct relation of Li-ion diffusion coefficients with temperature and the influence of temperature gradients on Li-dendrite formation in Li-metal electrodes, this study investigates the temperature-dependent lattice thermal conductivity of the five most common SEI components using a phonon dispersion analysis [19,20,21]. Among the components analyzed, it is found that Li2CO3 exhibits the lowest thermal conductivity of 9.26 W / m · K , while Li2O shows the highest (21.14 W / m · K ) when only Umklapp phonon scattering is considered as a phonon transport mechanism at 300 K.
To incorporate the grain-structured style of the SEI components, the grain size-dependent variation in thermal conductivity is also studied here by including phonon boundary scattering. Typical SEI components are reported to have a grain size between 2 nm and 100 nm, and smaller grain sizes favor faster Li-ion diffusion [88,89]. Taking this into account, this work also calculates the variation in thermal conductivity for grain sizes ranging from 2 nm to 10 nm with a step size of 2 nm. At 300 K, the thermal conductivity of the lattice with the lowest grain size of 2 nm studied here follows the trend of Li2CO3 (1.28 W / m · K ) < Li2S (2.07 W / m · K ) < LiOH (2.22 W / m · K ) < LiF (3.26 W / m · K ) < Li2O (4.34 W / m · K ). It is also observed that the thermal conductivity of all components increases exponentially with respect to the grain size at a temperature range of 150 to 1000 K.
The observed anisotropy in the thermal conductivity of the lattice of Li2CO3 and LiOH arises mainly from their lower structural symmetry compared to the cubic-structured compounds LiF, Li2O, and Li2S. This effect is well reflected in the phase space of three-phonon scattering, where, in cubic systems, the phase space initially decreases and then increases with the frequency of the phonon, while in tetragonal and monoclinic systems corresponding to Li2CO3 and LiOH, it exhibits a more gradual and continuous decline. The high symmetry of cubic structures leads to isotropic phonon dispersions, resulting in more uniform phonon group velocities and a broader distribution of allowed scattering channels. In contrast, the lower symmetry of Li2CO3 and LiOH induces anisotropic phonon dispersion, directly contributing to their directional dependence on thermal conductivity.
These findings offer important insights for the design and engineering of artificial SEI layers in lithium-metal batteries. The significant reduction in thermal conductivity observed for nanocrystalline regimes (grain sizes < 10 nm) suggests that tailoring the grain boundary density could be an effective strategy for modulating local heat dissipation. Since temperature gradients can accelerate lithium-dendrite growth, engineering SEI layers with controlled thermal transport properties through the optimal grain size, morphology, and crystal orientation could help mitigate dendritic propagation and improve battery safety. Moreover, materials such as Li2CO3 and Li2S, which exhibit inherently lower thermal conductivity, may be more effective as components in artificial SEI layers aimed at minimizing localized heating.

Supplementary Materials

The following supporting information can be downloaded at: https://www.mdpi.com/article/10.3390/modelling6030089/s1.

Author Contributions

A.S.K.: Data curation (equal); Formal analysis (equal); Investigation (equal); Methodology (equal); Software (equal); Validation (equal); Visualization (equal); Writing—original draft (equal). Y.S.: Funding acquisition; Project administration; Resources; Supervision; review & editing; (equal). All authors have read and agreed to the published version of the manuscript.

Funding

This work used Bridges-2 at the Pittsburgh Supercomputing Center through MAT220034 allocation from the Advanced Cyber infrastructure Coordination Ecosystem: Services & Support (ACCESS) program, which is supported by National Science Foundation grants #2138259, #2138286, #2138307, #2137603, and #2138296. The support and resources from the Center for High-Performance Computing at the University of Utah and are gratefully acknowledged.

Acknowledgments

We thank the Department of Energy’s Office of Energy Efficiency and Renewable Energy for sponsoring the computational resources from National Renewable Energy Laboratory used in this work. Any opinions, findings, conclusions, or recommendations expressed in this material are those of the author(s) and do not necessarily reflect the views of the National Science Foundation.

Conflicts of Interest

The authors declare no conflicts of interest.

References

  1. Adenusi, H.; Chass, G.A.; Passerini, S.; Tian, K.V.; Chen, G. Lithium Batteries and the Solid Electrolyte Interphase (SEI)—Progress and Outlook. Adv. Energy Mater. 2023, 13, 2203307. [Google Scholar] [CrossRef]
  2. Yan, H.H.; Bie, Y.H.; Cui, X.Y.; Xiong, G.P.; Chen, L. A computational investigation of thermal effect on lithium dendrite growth. Energy Convers. Manag. 2018, 161, 193–204. [Google Scholar] [CrossRef]
  3. Peled, E. The Electrochemical Behavior of Alkali and Alkaline Earth Metals in Nonaqueous Battery Systems—The Solid Electrolyte Interphase Model. J. Electrochem. Soc. 1979, 126, 2047. [Google Scholar] [CrossRef]
  4. Aurbach, D.; Markovsky, B.; Levi, M.D.; Levi, E.; Schechter, A.; Moshkovich, M.; Cohen, Y. New insights into the interactions between electrode materials and electrolyte solutions for advanced nonaqueous batteries. J. Power Sources 1999, 81–82, 95–111. [Google Scholar] [CrossRef]
  5. Peled, E.; Golodnitsky, D.; Ardel, G. Advanced Model for Solid Electrolyte Interphase Electrodes in Liquid and Polymer Electrolytes. J. Electrochem. Soc. 1997, 144, L208. [Google Scholar] [CrossRef]
  6. Cheng, X.B.; Zhang, R.; Zhao, C.Z.; Wei, F.; Zhang, J.G.; Zhang, Q. A Review of Solid Electrolyte Interphases on Lithium Metal Anode. Adv. Sci. 2016, 3, 1500213. [Google Scholar] [CrossRef]
  7. Patil, A.; Patil, V.; Wook Shin, D.; Choi, J.W.; Paik, D.S.; Yoon, S.J. Issue and challenges facing rechargeable thin film lithium batteries. Mater. Res. Bull. 2008, 43, 1913–1942. [Google Scholar] [CrossRef]
  8. Wang, A.; Kadam, S.; Li, H.; Shi, S.; Qi, Y. Review on modeling of the anode solid electrolyte interphase (SEI) for lithium-ion batteries. npj Comput. Mater. 2018, 4, 15. [Google Scholar] [CrossRef]
  9. Kulathuvayal, A.S.; Su, Y. Ionic Transport through the Solid Electrolyte Interphase in Lithium-Ion Batteries: A Review from First-Principles Perspectives. ACS Appl. Energy Mater. 2023, 6, 5628–5645. [Google Scholar] [CrossRef]
  10. Cresce, A.v.; Russell, S.M.; Baker, D.R.; Gaskell, K.J.; Xu, K. In Situ and Quantitative Characterization of Solid Electrolyte Interphases. Nano Lett. 2014, 14, 1405–1412. [Google Scholar] [CrossRef] [PubMed]
  11. Shi, S.; Lu, P.; Liu, Z.; Qi, Y.; Hector, L.G., Jr.; Li, H.; Harris, S.J. Direct Calculation of Li-Ion Transport in the Solid Electrolyte Interphase. J. Am. Chem. Soc. 2012, 134, 15476–15487. [Google Scholar] [CrossRef] [PubMed]
  12. Peled, E.; Menkin, S. SEI: Past, present and future. J. Electrochem. Soc. 2017, 164, A1703. [Google Scholar] [CrossRef]
  13. Petibon, R.; Sinha, N.N.; Burns, J.C.; Aiken, C.P.; Ye, H.; VanElzen, C.M.; Jain, G.; Trussler, S.; Dahn, J.R. Comparative study of electrolyte additives using electrochemical impedance spectroscopy on symmetric cells. J. Power Sources 2014, 251, 187–194. [Google Scholar] [CrossRef]
  14. Ishikawa, M.; Tasaka, Y.; Yoshimoto, N.; Morita, M. Optimization of physicochemical characteristics of a lithium anode interface for high-efficiency cycling: An effect of electrolyte temperature. J. Power Sources 2001, 97–98, 262–264. [Google Scholar] [CrossRef]
  15. Edström, K.; Andersson, A.M.; Bishop, A.; Fransson, L.; Lindgren, J.; Hussénius, A. Carbon electrode morphology and thermal stability of the passivation layer. J. Power Sources 2001, 97–98, 87–91. [Google Scholar] [CrossRef]
  16. Kim, H.; Lee, J.T.; Yushin, G. High temperature stabilization of lithium–sulfur cells with carbon nanotube current collector. J. Power Sources 2013, 226, 256–265. [Google Scholar] [CrossRef]
  17. Ota, H.; Wang, X.; Yasukawa, E. Characterization of Lithium Electrode in Lithium Imides/Ethylene Carbonate, and Cyclic Ether Electrolytes: I. Surface Morphology and Lithium Cycling Efficiency. J. Electrochem. Soc. 2004, 151, A427. [Google Scholar] [CrossRef]
  18. Mogi, R.; Inaba, M.; Jeong, S.K.; Iriyama, Y.; Abe, T.; Ogumi, Z. Effects of Some Organic Additives on Lithium Deposition in Propylene Carbonate. J. Electrochem. Soc. 2002, 149, A1578. [Google Scholar] [CrossRef]
  19. Zhu, Y.; Xie, J.; Pei, A.; Liu, B.; Wu, Y.; Lin, D.; Li, J.; Wang, H.; Chen, H.; Xu, J.; et al. Fast lithium growth and short circuit induced by localized-temperature hotspots in lithium batteries. Nat. Commun. 2019, 10, 2067. [Google Scholar] [CrossRef]
  20. Liu, W.; Liu, P.; Mitlin, D. Review of Emerging Concepts in SEI Analysis and Artificial SEI Membranes for Lithium, Sodium, and Potassium Metal Battery Anodes. Adv. Energy Mater. 2020, 10, 2002297. [Google Scholar] [CrossRef]
  21. Wu, H.; Jia, H.; Wang, C.; Zhang, J.G.; Xu, W. Recent Progress in Understanding Solid Electrolyte Interphase on Lithium Metal Anodes. Adv. Energy Mater. 2021, 11, 2003092. [Google Scholar] [CrossRef]
  22. Liu, J.; Fan, L.W. Atomistic insights into the thermal transport properties of inorganic components of solid electrolyte interphase (SEI) in lithium-ion batteries. Int. J. Heat Mass Transf. 2024, 221, 125069. [Google Scholar] [CrossRef]
  23. Ma, S.; Jiang, M.; Tao, P.; Song, C.; Wu, J.; Wang, J.; Deng, T.; Shang, W. Temperature effect and thermal impact in lithium-ion batteries: A review. Prog. Nat. Sci. Mater. Int. 2018, 28, 653–666. [Google Scholar] [CrossRef]
  24. Liang, T.; Chen, W.Q.; Hu, C.E.; Chen, X.R.; Chen, Q.F. Lattice dynamics and thermal conductivity of lithium fluoride via first-principles calculations. Solid State Commun. 2018, 272, 28–32. [Google Scholar] [CrossRef]
  25. Lindsay, L. Isotope scattering and phonon thermal conductivity in light atom compounds: LiH and LiF. Phys. Rev. B 2016, 94, 174304. [Google Scholar] [CrossRef]
  26. Jones, R.E.; Ward, D.K. Estimates of crystalline LiF thermal conductivity at high temperature and pressure by a Green-Kubo method. Phys. Rev. B 2016, 94, 014309. [Google Scholar] [CrossRef]
  27. Wang, J.; Deng, M.; Chen, Y.; Liu, X.; Ke, W.; Li, D.; Dai, W.; He, K. Structural, elastic, electronic and optical properties of lithium halides (LiF, LiCl, LiBr, and LiI): First-principle calculations. Mater. Chem. Phys. 2020, 244, 122733. [Google Scholar] [CrossRef]
  28. Singh, B.K.; Roy, M.K.; Menon, V.J.; Sood, K.C. Effects of dispersion, correction term, and isotopes on the thermal conductivity of LiF crystal. Phys. Rev. B 2003, 67, 014302. [Google Scholar] [CrossRef]
  29. Gheribi, A.E.; Chartrand, P. Application of the CALPHAD method to predict the thermal conductivity in dielectric and semiconductor crystals. Calphad 2012, 39, 70–79. [Google Scholar] [CrossRef]
  30. A. V Petrov, N.S.T.; Logachev, Y.A. Temperature dependence of the thermal conductivity of alkali metal halides at elevated temperatures. Fiz. Tverd. Tela 1974, 65–70. [Google Scholar] [CrossRef]
  31. Basiev, T.T.; Konyushkin, V.A.; Kuznetsov, S.V.; Osiko, V.V.; Popov, P.A.; Fedorov, P.P. Thermal conductivity of γ-irradiated LiF single crystals. Tech. Phys. Lett. 2008, 34, 702–704. [Google Scholar] [CrossRef]
  32. Zemann, J. Crystal Structures, 2nd ed.; Wyckoff, R.W.G., Ed.; Interseience Publishers: New York, NY, USA; London, UK; Sydney, Australia, 1963. [Google Scholar] [CrossRef]
  33. Nakamura, H.; Machida, M. First-principles calculation study on phonon thermal conductivity of thorium and plutonium dioxides: Intrinsic anharmonic phonon-phonon and extrinsic grain-boundary–phonon scattering effects. J. Nucl. Mater. 2019, 519, 45–51. [Google Scholar] [CrossRef]
  34. Lin, Y.X.; Liu, Z.; Leung, K.; Chen, L.Q.; Lu, P.; Qi, Y. Connecting the irreversible capacity loss in Li-ion batteries with the electronic insulating properties of solid electrolyte interphase (SEI) components. J. Power Sources 2016, 309, 221–230. [Google Scholar] [CrossRef]
  35. Mikajlo, E.A.; Nixon, K.L.; Coleman, V.A.; Ford, M.J. The electronic band structure of Li2O:testing theoretical predictions using electron momentumspectroscopy. J. Phys. Condens. Matter 2002, 14, 3587. [Google Scholar] [CrossRef]
  36. Feng, M.; Pan, J.; Qi, Y. Impact of Electronic Properties of Grain Boundaries on the Solid Electrolyte Interphases (SEIs) in Li-ion Batteries. J. Phys. Chem. C 2021, 125, 15821–15829. [Google Scholar] [CrossRef]
  37. Duan, Y.; Sorescu, D.C. Density functional theory studies of the structural, electronic, and phonon properties of Li2O and Li2CO3: Application to CO2 capture reaction. Phys. Rev. B 2009, 79, 014301. [Google Scholar] [CrossRef]
  38. Stoneham, A. Theory of Defects in Solids: Electronic Structure of Defects in Insulators and Semiconductors; Oxford classic texts in the physical sciences; Clarendon Press: Oxford, UK, 2001. [Google Scholar]
  39. Baer, Y.; Schoenes, J. Electronic structure and optical properties of lithium compounds. J. Phys. C Solid State Phys. 1979, 12, 4481–4491. [Google Scholar] [CrossRef]
  40. Bersuker, I.B. The Jahn–Teller Effect; Cambridge University Press: Cambridge, UK, 2006. [Google Scholar] [CrossRef]
  41. Li, W.; Carrete, J.; A. Katcho, N.; Mingo, N. ShengBTE: A solver of the Boltzmann transport equation for phonons. Comput. Phys. Commun. 2014, 185, 1747–1758. [Google Scholar] [CrossRef]
  42. Togo, A.; Chaput, L.; Tadano, T.; Tanaka, I. Implementation strategies in phonopy and phono3py. J. Phys. Condens. Matter 2023, 35, 353001. [Google Scholar] [CrossRef]
  43. Togo, A. First-principles Phonon Calculations with Phonopy and Phono3py. J. Phys. Soc. Jpn. 2023, 92, 012001. [Google Scholar] [CrossRef]
  44. Chaput, L. Direct Solution to the Linearized Phonon Boltzmann Equation. Phys. Rev. Lett. 2013, 110, 265506. [Google Scholar] [CrossRef]
  45. Srivastava, G.P. The Physics of Phonons; Taylor & Francis: Oxford, UK, 2022. [Google Scholar] [CrossRef]
  46. Ziman, J. Electrons and Phonons: The Theory of Transport Phenomena in Solids; International series of monographs on physics; OUP Oxford: Oxford, UK, 2001. [Google Scholar]
  47. Tong, Z.; Li, S.; Ruan, X.; Bao, H. Comprehensive first-principles analysis of phonon thermal conductivity and electron-phonon coupling in different metals. Phys. Rev. B 2019, 100, 144306. [Google Scholar] [CrossRef]
  48. Togo, A.; Chaput, L.; Tadano, T.; Tanaka, I. Distributions of phonon lifetimes in Brillouin zones. Phys. Rev. B 2015, 91, 094306. [Google Scholar] [CrossRef]
  49. Tritt, T. Thermal Conductivity: Theory, Properties, and Applications; Physics of Solids and Liquids; Springer: New York, NY, USA, 2004; ISBN 978-0-306-48327-1. [Google Scholar] [CrossRef]
  50. Tan, J.; Matz, J.; Dong, P.; Shen, J.; Ye, M. A Growing Appreciation for the Role of LiF in the Solid Electrolyte Interphase. Adv. Energy Mater. 2021, 11, 2100046. [Google Scholar] [CrossRef]
  51. Ko, J.; Yoon, Y.S. Recent progress in LiF materials for safe lithium metal anode of rechargeable batteries: Is LiF the key to commercializing Li metal batteries? Ceram. Int. 2019, 45, 30–49. [Google Scholar] [CrossRef]
  52. Cahill, D.G.; Watson, S.K.; Pohl, R.O. Lower limit to the thermal conductivity of disordered crystals. Phys. Rev. B 1992, 46, 6131–6140. [Google Scholar] [CrossRef]
  53. Goel, P.; Choudhury, N.; Chaplot, S.L. Superionic behavior of lithium oxide Li2O: A lattice dynamics and molecular dynamics study. Phys. Rev. B 2004, 70, 174307. [Google Scholar] [CrossRef]
  54. Richards, W.D.; Miara, L.J.; Wang, Y.; Kim, J.C.; Ceder, G. Interface Stability in Solid-State Batteries. Chem. Mater. 2016, 28, 266–273. [Google Scholar] [CrossRef]
  55. Lorger, S.; Usiskin, R.; Maier, J. Transport and Charge Carrier Chemistry in Lithium Oxide. J. Electrochem. Soc. 2019, 166, A2215. [Google Scholar] [CrossRef]
  56. Aktekin, B.; Riegger, L.M.; Otto, S.K.; Fuchs, T.; Henss, A.; Janek, J. SEI growth on Lithium metal anodes in solid-state batteries quantified with coulometric titration time analysis. Nat. Commun. 2023, 14, 6946. [Google Scholar] [CrossRef]
  57. Liu, F.; Wang, L.; Zhang, Z.; Shi, P.; Feng, Y.; Yao, Y.; Ye, S.; Wang, H.; Wu, X.; Yu, Y. A Mixed Lithium-Ion Conductive Li2S/Li2Se Protection Layer for Stable Lithium Metal Anode. Adv. Funct. Mater. 2020, 30, 2001607. [Google Scholar] [CrossRef]
  58. Li, G.; Gao, Y.; He, X.; Huang, Q.; Chen, S.; Kim, S.H.; Wang, D. Organosulfide-plasticized solid-electrolyte interphase layer enables stable lithium metal anodes for long-cycle lithium-sulfur batteries. Nat. Commun. 2017, 8, 850. [Google Scholar] [CrossRef] [PubMed]
  59. Kim, B.S.D.H.; Lee, M.S.B.; Park, K.Y.; Kang, K. First-principles Study on the Charge Transport Mechanism of Lithium Sulfide (Li2S) in Lithium-Sulfur Batteries. Chem. Asian J. 2016, 11, 1288–1292. [Google Scholar] [CrossRef]
  60. Wu, D.; He, J.; Liu, J.; Wu, M.; Qi, S.; Wang, H.; Huang, J.; Li, F.; Tang, D.; Ma, J. Li2CO3/LiF-Rich Heterostructured Solid Electrolyte Interphase with Superior Lithiophilic and Li+-Transferred Characteristics via Adjusting Electrolyte Additives. Adv. Energy Mater. 2022, 12, 2200337. [Google Scholar] [CrossRef]
  61. Han, B.; Zhang, Z.; Zou, Y.; Xu, K.; Xu, G.; Wang, H.; Meng, H.; Deng, Y.; Li, J.; Gu, M. Poor Stability of Li2CO3 in the Solid Electrolyte Interphase of a Lithium-Metal Anode Revealed by Cryo-Electron Microscopy. Adv. Mater. 2021, 33, 2100404. [Google Scholar] [CrossRef] [PubMed]
  62. Zhang, Y.C.; Tagawa, H.; Asakura, S.; Mizusaki, J.; Narita, H. Solid-state electrochemical CO2 sensor by coupling lithium ion conductor (Li2CO3-Li3PO4-Asl2O3) with oxide ion-electron mixed conductor (La0.9Sr0.1MnO3). Solid State Ionics 1997, 100, 275–281. [Google Scholar] [CrossRef]
  63. Weng, S.; Zhang, X.; Yang, G.; Zhang, S.; Ma, B.; Liu, Q.; Liu, Y.; Peng, C.; Chen, H.; Yu, H.; et al. Temperature-dependent interphase formation and Li+ transport in lithium metal batteries. Nat. Commun. 2023, 14, 4474. [Google Scholar] [CrossRef]
  64. Shang, S.-L.; Hector, L.G.; Shi, S.; Qi, Y.; Wang, Y.; Liu, Z.-K. Lattice dynamics, thermodynamics and elastic properties of monoclinic Li2CO3 from density functional theory. Acta Mater. 2012, 60, 5204–5216. [Google Scholar] [CrossRef]
  65. Verdier, D.; Ferrière, A.; Falcoz, Q.; Siros, F.; Couturier, R. Experimentation of a High Temperature Thermal Energy Storage Prototype Using Phase Change Materials for the Thermal Protection of a Pressurized Air Solar Receiver. Energy Procedia 2014, 49, 1044–1053. [Google Scholar] [CrossRef]
  66. Wang, Y.; Li, S.; Wu, N.; Jia, Q.; Hoke, T.; Shi, L.; Li, Y.; Chen, X. Thermal properties and lattice anharmonicity of Li-ion conducting garnet solid electrolyte Li6.5La3Zr1.5Ta0.5O12. J. Mater. Chem. A 2024, 12, 18248–18257. [Google Scholar] [CrossRef]
  67. Spiteri, D.; Anaya, J.; Kuball, M. The effects of grain size and grain boundary characteristics on the thermal conductivity of nanocrystalline diamond. J. Appl. Phys. 2016, 119, 085102. [Google Scholar] [CrossRef]
  68. Wang, X.; Yang, Y.; Zhu, L. Effect of grain sizes and shapes on phonon thermal conductivity of bulk thermoelectric materials. J. Appl. Phys. 2011, 110, 024312. [Google Scholar] [CrossRef]
  69. Fujieda, T.; Xia, Y.; Koike, S.; Shikano, M.; Sakai, T. Effect of acid on passivation of a copper electrode in LiCF3SO3/propylene carbonate in underpotential region. J. Power Sources 1999, 83, 186–192. [Google Scholar] [CrossRef]
  70. Kanamura, K.; Tamura, H.; Takehara, Z.i. XPS analysis of a lithium surface immersed in propylene carbonate solution containing various salts. J. Electroanal. Chem. 1992, 333, 127–142. [Google Scholar] [CrossRef]
  71. Li, Z.; Ganapathy, S.; Xu, Y.; Heringa, J.R.; Zhu, Q.; Chen, W.; Wagemaker, M. Understanding the electrochemical formation and decomposition of Li2O2 and LiOH with operando X-ray diffraction. Chem. Mater. 2017, 29, 1577–1586. [Google Scholar] [CrossRef] [PubMed]
  72. Morigaki, K.i.; Ohta, A. Analysis of the surface of lithium in organic electrolyte by atomic force microscopy, Fourier transform infrared spectroscopy and scanning auger electron microscopy. J. Power Sources 1998, 76, 159–166. [Google Scholar] [CrossRef]
  73. Zhao, Z.; Ye, W.; Zhang, F.; Pan, Y.; Zhuo, Z.; Zou, F.; Xu, X.; Sang, X.; Song, W.; Zhao, Y.; et al. Revealing the effect of LiOH on forming a SEI using a Co magnetic “probe”. Chem. Sci. 2023, 14, 12219–12230. [Google Scholar] [CrossRef]
  74. Ma, X.X.; Shen, X.; Chen, X.; Fu, Z.H.; Yao, N.; Zhang, R.; Zhang, Q. The Origin of Fast Lithium-Ion Transport in the Inorganic Solid Electrolyte Interphase on Lithium Metal Anodes. Small Struct. 2022, 3, 2200071. [Google Scholar] [CrossRef]
  75. Lu, M.; Cheng, H.; Yang, Y. A comparison of solid electrolyte interphase (SEI) on the artificial graphite anode of the aged and cycled commercial lithium ion cells. Electrochim. Acta 2008, 53, 3539–3546. [Google Scholar] [CrossRef]
  76. Achchaq, F.; Moon, S.C.; Legros, P. Unlocking the power of LiOH: Key to next-generation ultra-compact thermal energy storage systems. Heliyon 2024, 10, e33992. [Google Scholar] [CrossRef]
  77. Yang, X.; Li, S.; Zhao, J.; Wang, X.; Huang, H.; Wang, Y.; Deng, L. Development of lithium hydroxide-metal organic framework-derived porous carbon composite materials for efficient low temperature thermal energy storage. Microporous Mesoporous Mater. 2021, 328, 111455. [Google Scholar] [CrossRef]
  78. Wang, Y.; Gu, J.; Li, X.; Zhu, Y.; Hu, H.; Liu, H.; Luo, G.; Yao, H. Boosted Thermal Storage Performance of LiOH·H2O by Carbon Nanotubes Isolated Multilayered Graphene Oxide Frames. Adv. Mater. Sci. Eng. 2022, 2022, 3109178. [Google Scholar] [CrossRef]
  79. Elhadj, S.; Matthews, M.J.; Yang, S.T.; Cooke, D.J.; Stolken, J.S.; Vignes, R.M.; Draggoo, V.G.; Bisson, S.E. Determination of the intrinsic temperature dependent thermal conductivity from analysis of surface temperature of laser irradiated materials. Appl. Phys. Lett. 2010, 96, 071110. [Google Scholar] [CrossRef]
  80. Lu, H.; Murphy, S.T.; Rushton, M.J.D.; Parfitt, D.C.; Grimes, R.W. Thermal conductivity and the isotope effect in Li2O. Fusion Eng. Des. 2012, 87, 1834–1838. [Google Scholar] [CrossRef]
  81. Yuan, X.; Zhao, Y.; Sun, Y.; Ni, J.; Dai, Z. Influence of quartic anharmonicity on lattice dynamics and thermal transport properties of 16 antifluorite structures. Phys. Rev. B 2024, 110, 014304. [Google Scholar] [CrossRef]
  82. Dodd, J.; Baker, L.; Kennedy, P.; Challender, R.; Coast, G. The Use of Lithium Oxide as the Breeder in Fusion Reactors. 1989. Available online: http://inis.iaea.org/search/search.aspx?orig_q=RN:21038114 (accessed on 1 March 2025).
  83. Zhou, Y.; Xiong, S.; Zhang, X.; Volz, S.; Hu, M. Thermal transport crossover from crystalline to partial-crystalline partial-liquid state. Nat. Commun. 2018, 9, 4712. [Google Scholar] [CrossRef]
  84. Li, S.; Huang, H.; Li, J.; Kobayashi, N.; Osaka, Y.; He, Z.; Yuan, H. The effect of 3D carbon nanoadditives on lithium hydroxide monohydrate based composite materials for highly efficient low temperature thermochemical heat storage. RSC Adv. 2018, 8, 8199–8208. [Google Scholar] [CrossRef]
  85. Wu, B.; Yi, R.; Xu, Y.; Gao, P.; Bi, Y.; Novák, L.; Liu, Z.; Hu, E.; Wang, N.; Rijssenbeek, J.; et al. Unusual Li2O sublimation promotes single-crystal growth and sintering. Nat. Energy 2025, 10, 605–615. [Google Scholar] [CrossRef]
  86. Han, B.; Anwar U., I.; Haq, R.; Louhi-Kultanen, M. Lithium carbonate precipitation by homogeneous and heterogeneous reactive crystallization. Hydrometallurgy 2020, 195, 105386. [Google Scholar] [CrossRef]
  87. Chen, C.; Liu, P.; Lu, C. Synthesis and characterization of nano-sized ZnO powders by direct precipitation method. Chem. Eng. J. 2008, 144, 509–513. [Google Scholar] [CrossRef]
  88. Tomboc, G.M.; Wang, Y.; Wang, H.; Li, J.; Lee, K. Sn-based metal oxides and sulfides anode materials for Na ion battery. Energy Storage Mater. 2021, 39, 21–44. [Google Scholar] [CrossRef]
  89. Zheng, L.; Li, G.; Zhang, J. Grain boundaries boost the prelithiation capability of the Li2CO3 cathode additives for high-energy-density lithium-ion batteries. Chem. Eng. J. 2023, 475, 146285. [Google Scholar] [CrossRef]
Figure 1. Unitcells of (a) LiF, (b) Li2O, (c) Li2S, (d) LiOH, and (e) Li2CO3.
Modelling 06 00089 g001
Figure 2. (a) Phonon dispersion curves and corresponding phonon density of states for LiF. (be) Phonon mode contributions to lattice thermal conductivity, three-phonon scattering phase space as a function of frequency, anharmonic phonon scattering rates versus frequency, and phonon lifetimes versus frequency at 300 K. (f) Temperature-dependent lattice thermal conductivity curves of LiF for the temperature range 150–1000 K.
Modelling 06 00089 g002
Figure 3. (a) Exchange–correlation functional and (b) grain boundary effects (for grain size L = 2 nm up to 10 nm) on thermal conductivity curves in LiF. Dashed vertical line corresponds to 300 K.
Modelling 06 00089 g003
Figure 4. (a) Phonon dispersion curves and corresponding phonon density of states for Li2O. (be) Phonon mode contributions to lattice thermal conductivity, three-phonon scattering phase space as a function of frequency, anharmonic phonon scattering rates versus frequency, and phonon lifetimes versus frequency at 300 K. (f) Temperature-dependent lattice thermal conductivity curves of Li2O for the temperature range 150–1000 K.
Modelling 06 00089 g004
Figure 5. (a) Exchange–correlation functional and grain boundary effects (for grain size L = 2 nm up to 10 nm) (b) on thermal conductivity curves in Li2O.
Modelling 06 00089 g005
Figure 6. (a) Phonon dispersion curves and corresponding phonon density of states for Li2O. (be) Phonon mode contributions to the lattice thermal conductivity, three-phonon scattering phase space as a function of frequency, anharmonic phonon scattering rates versus frequency, and phonon lifetimes versus frequency at 300 K. (f) Temperature-dependent lattice thermal conductivity curves of Li2S for the temperature range 150–1000 K.
Modelling 06 00089 g006
Figure 7. (a) Exchange–correlation functional and grain boundary effects (for grain size L = 2 nm up to 10 nm) (b) on thermal conductivity curves in Li2S.
Modelling 06 00089 g007
Figure 8. (a) Phonon dispersion curves and corresponding phonon density of states for Li2CO3. (be) Phonon mode contributions to the lattice thermal conductivity, three-phonon scattering phase space as a function of frequency, anharmonic phonon scattering rates versus frequency, and phonon lifetimes versus frequency at 300 K. (f) Temperature-dependent lattice thermal conductivity curves of Li2CO3 for the temperature range 150–1000 K.
Modelling 06 00089 g008
Figure 9. (a) Exchange–correlation functional and grain boundary effects (for grain size L = 2 nm up to 10 nm) (b) on thermal conductivity curves in Li2CO3.
Modelling 06 00089 g009
Figure 10. (a) Phonon dispersion curves and corresponding phonon density of states for LiOH. (be) Phonon mode contributions to the lattice thermal conductivity, three-phonon scattering phase space as a function of frequency, anharmonic phonon scattering rates versus frequency, and phonon lifetimes versus frequency at 300 K. (f) Temperature-dependent lattice thermal conductivity curves of LiOH for the temperature range 150–1000 K.
Modelling 06 00089 g010
Figure 11. (a) Exchange–correlation functional and grain boundary effects (for grain size L = 2 nm up to 10 nm) (b) on thermal conductivity curves in LiOH.
Modelling 06 00089 g011
Table 1. Structural information of frequently reported inorganic components in the SEI for Li-metal anode calculated using the LDA, GGA-PBE, and GGA-PBEsol.
Components *a (Å)b (Å)c (Å) α  (°) β  (°) γ  (°)Lattice Volume ( Å 3 )
LiF (mp-1138)3.90, 4.08, 4.003.90, 4.08, 4.003.90, 4.08, 4.0090, 90, 9090, 90, 9090, 90, 9059.55, 60.09, 64.17
Li2O (mp-1960)4.50, 4.65, 4.584.50, 4.65, 4.584.50, 4.65, 4.5890, 90, 9090, 90, 9090, 90, 9091.14, 100.78, 96.37
Li2S (mp-1153)5.56, 5.67, 5.655.56, 5.67, 5.655.56, 5.67, 5.6590, 90, 9090, 90, 9090, 90, 90172.49, 182.32, 181.23
Li2CO3 (mp-3054)8.22, 8.28, 8.314.94, 4.96, 4.985.89, 6.07, 6.1190, 90, 90113.56, 113.74, 113.9490, 90, 90219.66, 228.89, 231.85
LiOH (mp-23856)4.81, 4.93, 4.944.81, 4.93, 4.944.32, 4.27, 4.3290, 90, 9090, 90, 9090, 90, 90100.04, 104.09, 105.69
[*] The Materials Project ID is given in parentheses.
Disclaimer/Publisher’s Note: The statements, opinions and data contained in all publications are solely those of the individual author(s) and contributor(s) and not of MDPI and/or the editor(s). MDPI and/or the editor(s) disclaim responsibility for any injury to people or property resulting from any ideas, methods, instructions or products referred to in the content.