Article

Effects of Sidewall Gas Blowing and Slag Layer on Flow and Tracer Transport in a Single-Strand Tundish

1
College of Materials Science and Engineering, Taiyuan University of Technology, Taiyuan 030024, China
2
Key Laboratory for Ecological Metallurgy of MultiMetallic Mineral (Ministry of Education), School of Metallurgy, Northeastern University, Shenyang 110819, China
3
College of Mechanical Engineering, Taiyuan University of Technology, Taiyuan 030024, China
4
College of Architecture and Arts, Taiyuan University of Technology, Taiyuan 030024, China
*
Authors to whom correspondence should be addressed.
Modelling 2025, 6(3), 87; https://doi.org/10.3390/modelling6030087 (registering DOI)
Submission received: 29 July 2025 / Revised: 16 August 2025 / Accepted: 19 August 2025 / Published: 21 August 2025

Abstract

A novel right-sidewall gas blowing method is proposed to improve the flow behavior in a single-strand tundish. Despite advances in tundish flow control, the impact of slag layers and sidewall gas injection on flow dynamics and tracer transport remains underexplored. This study combines 1:3.57 scale water model experiments and Compuational Fluid Dynamics (CFD) simulations to investigate the effects of gas injection heights (50 mm and 100 mm) on flow structure, mixing efficiency, and slag layer interactions. Particle Image Velocimetry (PIV) and the stimulus-response method are used for quantitative validation. Results show that sidewall gas blowing suppresses short-circuit flow, increases average residence time by up to 37%, and reduces dead zone volume by up to 19%. The 50 mm blowing height induces stronger surface turbulence, while the 100 mm height improves flow uniformity. The presence of a slag layer significantly dampens surface fluctuations and alters vortex formation. These findings fill a critical research gap in tundish metallurgy and offer a practical reference for optimizing gas blowing strategies in industrial applications.

1. Introduction

The tundish, located between the ladle and the caster, plays an important role in connecting and buffering the continuous casting process [1,2,3,4]. It is critical for the flow, mixing uniformity, and removal of inclusions in molten steel [5]. Tundish slag, as a key functional material in the metallurgical process, directly influences the flow behavior of molten steel and the stability of the liquid surface [6,7,8,9,10]. By regulating the slag/steel interfacial tension, suppressing turbulent slag entrapment, and optimizing the temperature field distribution, slag significantly enhances the inclusion removal efficiency and ensures smooth operation of the continuous casting process [11,12,13]. However, the full effectiveness of slag depends heavily on the tundish flow field structure, and gas injection is one of the main methods currently used to optimize this flow field. In tundish metallurgy, gas injection can optimize the internal flow structure, making it an effective means to improve steel cleanliness and casting billet quality [14,15,16,17,18,19].
Common gas injection methods include microbubble metallurgy and gas curtain technologies. The former relies on the turbulent energy generated by the high-speed injection of molten steel to fragment argon gas, forming numerous microbubbles. This enhances the capture of fine inclusions and helps suppress slag eye formation [20,21,22]. The latter alters the molten steel flow field by creating a gas curtain [23,24,25,26,27,28,29,30,31,32,33], facilitating the migration and removal of inclusions while providing a simple structure and strong flow distribution function [34,35,36,37]. Existing research has shown that gas curtains effectively optimize the flow field, improve temperature distribution, and enhance the upward migration of inclusions [23,24,25]. However, the larger bubbles formed may limit the capture efficiency of fine inclusions and could induce slag entrainment and liquid surface fluctuations [27]. These limitations have prompted researchers to explore new gas injection methods. To overcome the limitations of traditional methods, recent studies have attempted direct gas injection into the sidewall region of the metallurgical reactor [38,39,40]. Neves et al. [41] proposed a sidewall gas injection scheme based on a gas curtain configuration. Their study compared the internal flow behavior in the tundish under three conditions: no gas injection, bottom gas curtain only, and a combination of bottom gas curtain with additional sidewall gas injection. The results showed that gas injection along the tundish walls enhanced the effect of the main curtain by promoting the flotation of inclusions, especially in the regions adjacent to the inclined walls between the curtain and the sidewalls. Wang et al. [42] identified strong short-circuit flow and a stagnant zone near the outlet in a bare tundish. To address this, they proposed a direct sidewall gas blowing method. Their findings demonstrated that this approach could effectively improve the overall flow pattern. Among the tested configurations, right-sidewall blowing was more effective than front-wall injection in reducing the area of the stagnant zone near the outlet, thereby improving flow field in this region of the bare tundish. However, most of the existing research has focused on numerical simulations and lacks experimental verification, with insufficient exploration of the effects of the slag layer.
It is important to note that, whether traditional or novel, the mechanisms by which gas injection technologies affect the flow field and liquid surface stability need to be accurately characterized through experimental means. Water model experiments are an important tool for studying tundish flow behavior. These experiments often involve image analysis of dye solutions [43,44,45,46], Residence Time Distribution (RTD) curves of saltwater solutions [47,48], and measurement of flow fields using Laser Doppler Anemometry (LDA) [49,50] or Particle Image Velocimetry (PIV) [4,34,51,52,53,54]. However, existing studies typically neglect the actual presence of the slag layer above the molten steel, simulating the steel-liquid interface as an exposed free surface. The disturbance effects of gas injection technologies on the slag/steel interface cannot be accurately assessed, which undermines confidence in their industrial applicability. Several studies attempted to use oil layers to simulate the slag entrainment phenomena under unsteady casting conditions [55,56,57,58] and the slag eye structures induced by gas injection methods [27,28,29,30,33]. Chatterjee et al. [29,30,33] investigated the influence of argon injection through the ladle shroud on slag eye formation in a tundish using both physical and mathematical models. They proposed an empirical formula that relates the slag eye area to several parameters, including gas flow rate, melt depth, slag layer thickness, and melt properties. Wang et al. [27] studied the effect of varying the gas flow rate in a gas curtain system on the steel-slag interface. Their findings identified six distinct stages of interfacial behavior: calm interface, interface oscillation (the gas flow rate is zero), interface curving upward, bared slag layer, slag droplet breakup, and slag entrapment. Although these studies have provided systematic insights into the mechanisms of slag eye formation, the flow velocity distribution beneath the slag/steel interface under gas injection conditions, especially when a slag eye is present, remains poorly characterized [59].
In response to the above issues, this study proposes and explores a novel gas injection method for the right sidewall of a single-strand bare tundish. A 1:3.57 scaled water model is employed to evaluate three gas injection schemes: (1) a reference case with no gas injection, (2) sidewall injection at a height of 50 mm with a gas flow rate of 2.5 L/min, and (3) sidewall injection at a height of 100 mm with the same gas flow rate. A systematic analysis of the evolution of flow behavior inside the tundish before and after gas injection is conducted using Particle Image Velocimetry (PIV), the “stimulus-response” method, and CFD simulations. Additionally, the flow field characteristics and slag eye formation mechanisms are further investigated under simulated slag layer conditions. This study aims to clarify the influence of sidewall gas injection height on tundish flow structures, mixing behavior, and interfacial stability, while further revealing the interaction between gas flow and the slag layer. The findings provide fundamental insights for enhancing inclusion removal efficiency, improving tundish flow control, and supporting the industrial implementation of optimized gas injection technologies under realistic metallurgical environments.

2. Models and Methods

2.1. Physical Model

This study combines both physical and numerical simulations. In the physical model, the tundish water model adopted the same design and dimensions as that used by Wang et al. [42]. The model was constructed from acrylic at a geometric scale ratio of 1:3.57 to ensure Froude number similarity between the prototype and the model. The structural dimensions of the tundish and the specific layout of the gas injection holes are shown in Figure 1. The key parameters used in the experiment are shown in Table 1.

2.2. Mathematical Model

In the numerical simulation, the STAR-CCM+ 13.04 software [60] was used to calculate the bare tundish and the sidewall gas blowing conditions, with specific details available in [42,61,62]. In STAR-CCM+ software, its polyhedral meshing technique offers 3 to 10 times higher computational efficiency than traditional tetrahedral meshing, while maintaining comparable accuracy. In addition, the flexibility of mesh refinement in complex geometries improves simulation precision, which is particularly important when modeling intricate flow phenomena.
In the CFD model, a general form of the transport equation (proposed by Patankar [63]) is expressed as follows:
ρ ϕ t + ρ u ϕ x = x Γ ϕ , eff ϕ x + S ϕ
where ϕ represents the solved variables, such as velocity, concentration, turbulent kinetic energy, turbulent dissipation rate, etc. ρ is the density. u is the velocity vector. t is the time. Γϕ,eff is the effective diffusion coefficient and Sϕ is the source term. The source term is not considered and set as zero in this study.
The bare tundish calculation employed a single-phase flow model, using the Realizable k-ε two-layer turbulence model (RKE-2L) [64,65] to describe the turbulence phenomena within the tundish. For the sidewall gas blowing conditions, an Euler-Euler two-phase flow model was used, with the liquid phase (water) treated as the continuous phase and the gas phase (air) as the discrete phase. The continuous phase used the Realizable k-ε two-layer model, while the discrete phase used the Issa turbulence response model.
Inter-phase interactions were modeled using a continuous-discrete topological structure, with interface forces including drag, lift, virtual mass, and turbulence dissipation. The lift model was set as a constant method with a lift coefficient of −0.05, and the drag model followed the Tomiyama method [66]. The Tomiyama model, which accounts for lateral lift, is particularly suited for large, deformable bubbles in the ellipsoidal and spherical cap regimes. In our previous research [42], this model demonstrated good agreement between numerical results and experimental observations. Therefore, it was selected in this study for modeling the drag force. All simulations neglected heat transfer effects and assumed no chemical reactions occurred within the tundish.
Additionally, the passive scalar transport method was used to model the tracer transport. A virtual tracer was introduced to trace the fluid path. The tracer has no physical properties and is passively transported with the water flow [67,68]. As shown in Figure 2, the computational domain used a polyhedral mesh, with local mesh refinement near the gas injection region. All numerical settings and parameter configurations were consistent with those reported in our previous study [42]. In our prior research [42], the RTD curves obtained from numerical simulations and water model experiments were used to validate the CFD model. The simulation results were highly consistent with the physical experiments, with the deviation between the two RTD curves being less than 5%.
In this study, polyhedral meshes were employed for the simulation, with local mesh refinement applied to critical regions such as the ladle shroud, outlet nozzle, and gas injection holes, as illustrated in Figure 2. A mesh independent study was performed in our previous study [42], simulations using mesh counts of 300,787 and 850,919 were compared with experimental results, showing good agreement in both cases. To ensure the accuracy of the present computations, a total of 850,919 mesh cells was adopted. The validation of this CFD model was also performed in [42], and the details will be presented in Section 3.2.

2.3. Experimental Method

This study conducts a systematic comparative analysis between the bare tundish and the sidewall gas blowing scheme. In the sidewall gas blowing experimental setup, gas is injected into the right sidewall of the tundish, with injection holes positioned 50 mm and 100 mm above the bottom of the tundish. The gas flow rate is set to 2.5 L/min, as shown in Table 2.
To gain a deeper understanding of the internal flow field characteristics of the tundish, this study integrates the “stimulus-response” method and Particle Image Velocimetry (PIV) technology in the water model experiments to systematically investigate the evolution of the flow field. The “stimulus-response” method involves injecting a saturated potassium chloride solution as a tracer through the ladel shroud of the tundish into the water model. Concentration variations are recorded at different time points at the tundish outlet, and the RTD analysis method [61] is used to evaluate the flow path, residence time, and mixing efficiency of the fluid inside the tundish. An 85 mL saltwater (saturated potassium chloride solution) tracer is used in the experiment to explore the changes in the macroscopic flow field inside the tundish under the sidewall gas blowing scheme. PIV technology is used to measure the instantaneous velocity field distribution inside the tundish. The specific PIV measurement area in this experiment is shown in Figure 1. The combined use of these two techniques allows for the examination of both global mixing behavior and local transient velocity features of the flow field [54]. This enhances the comprehensiveness and accuracy of the experimental data and provides reliable experimental support for the subsequent construction and validation of the CFD model.
To investigate the impact of the slag layer on the internal flow field of the tundish, liquid silicone oil is used to simulate the slag layer under actual operating conditions. The dynamic viscosity of the silicone oil used is 0.096 Pa·s. Based on the research of Ling et al. [57,69], which suggests an industrial tundish slag layer thickness of approximately 50 mm, and considering the scale ratio of this study’s water model, the slag layer thickness is set to 10 mm. In the experiment, the liquid level height in the bare tundish is 280 mm, while in the case with the oil layer, the total height of the water and oil layers in the tundish is 290 mm. Using PIV technology, the flow field structure in the region above the outlet is analyzed, and the area of the slag eye at the liquid surface under different experimental conditions is compared and statistically analyzed to assess the impact of the slag layer on the flow field structure and liquid surface stability.

3. Results

3.1. Bubble Behavior

Figure 3 illustrates the bubble behavior under the two gas injection modes studied in the water model experiment (Schemes 2 and 3). Gas is injected from the right sidewall of the tundish, forming an ascending bubble flow under the action of buoyancy. These bubbles first undergo initial fragmentation, splitting into smaller bubbles during their ascent. As the bubbles continue to rise, the smaller bubbles collide and aggregate, gradually merging. Finally, near the liquid surface, the bubbles form larger bubble clusters.

3.2. Comparison Between PIV Results and CFD Velocity Vectors

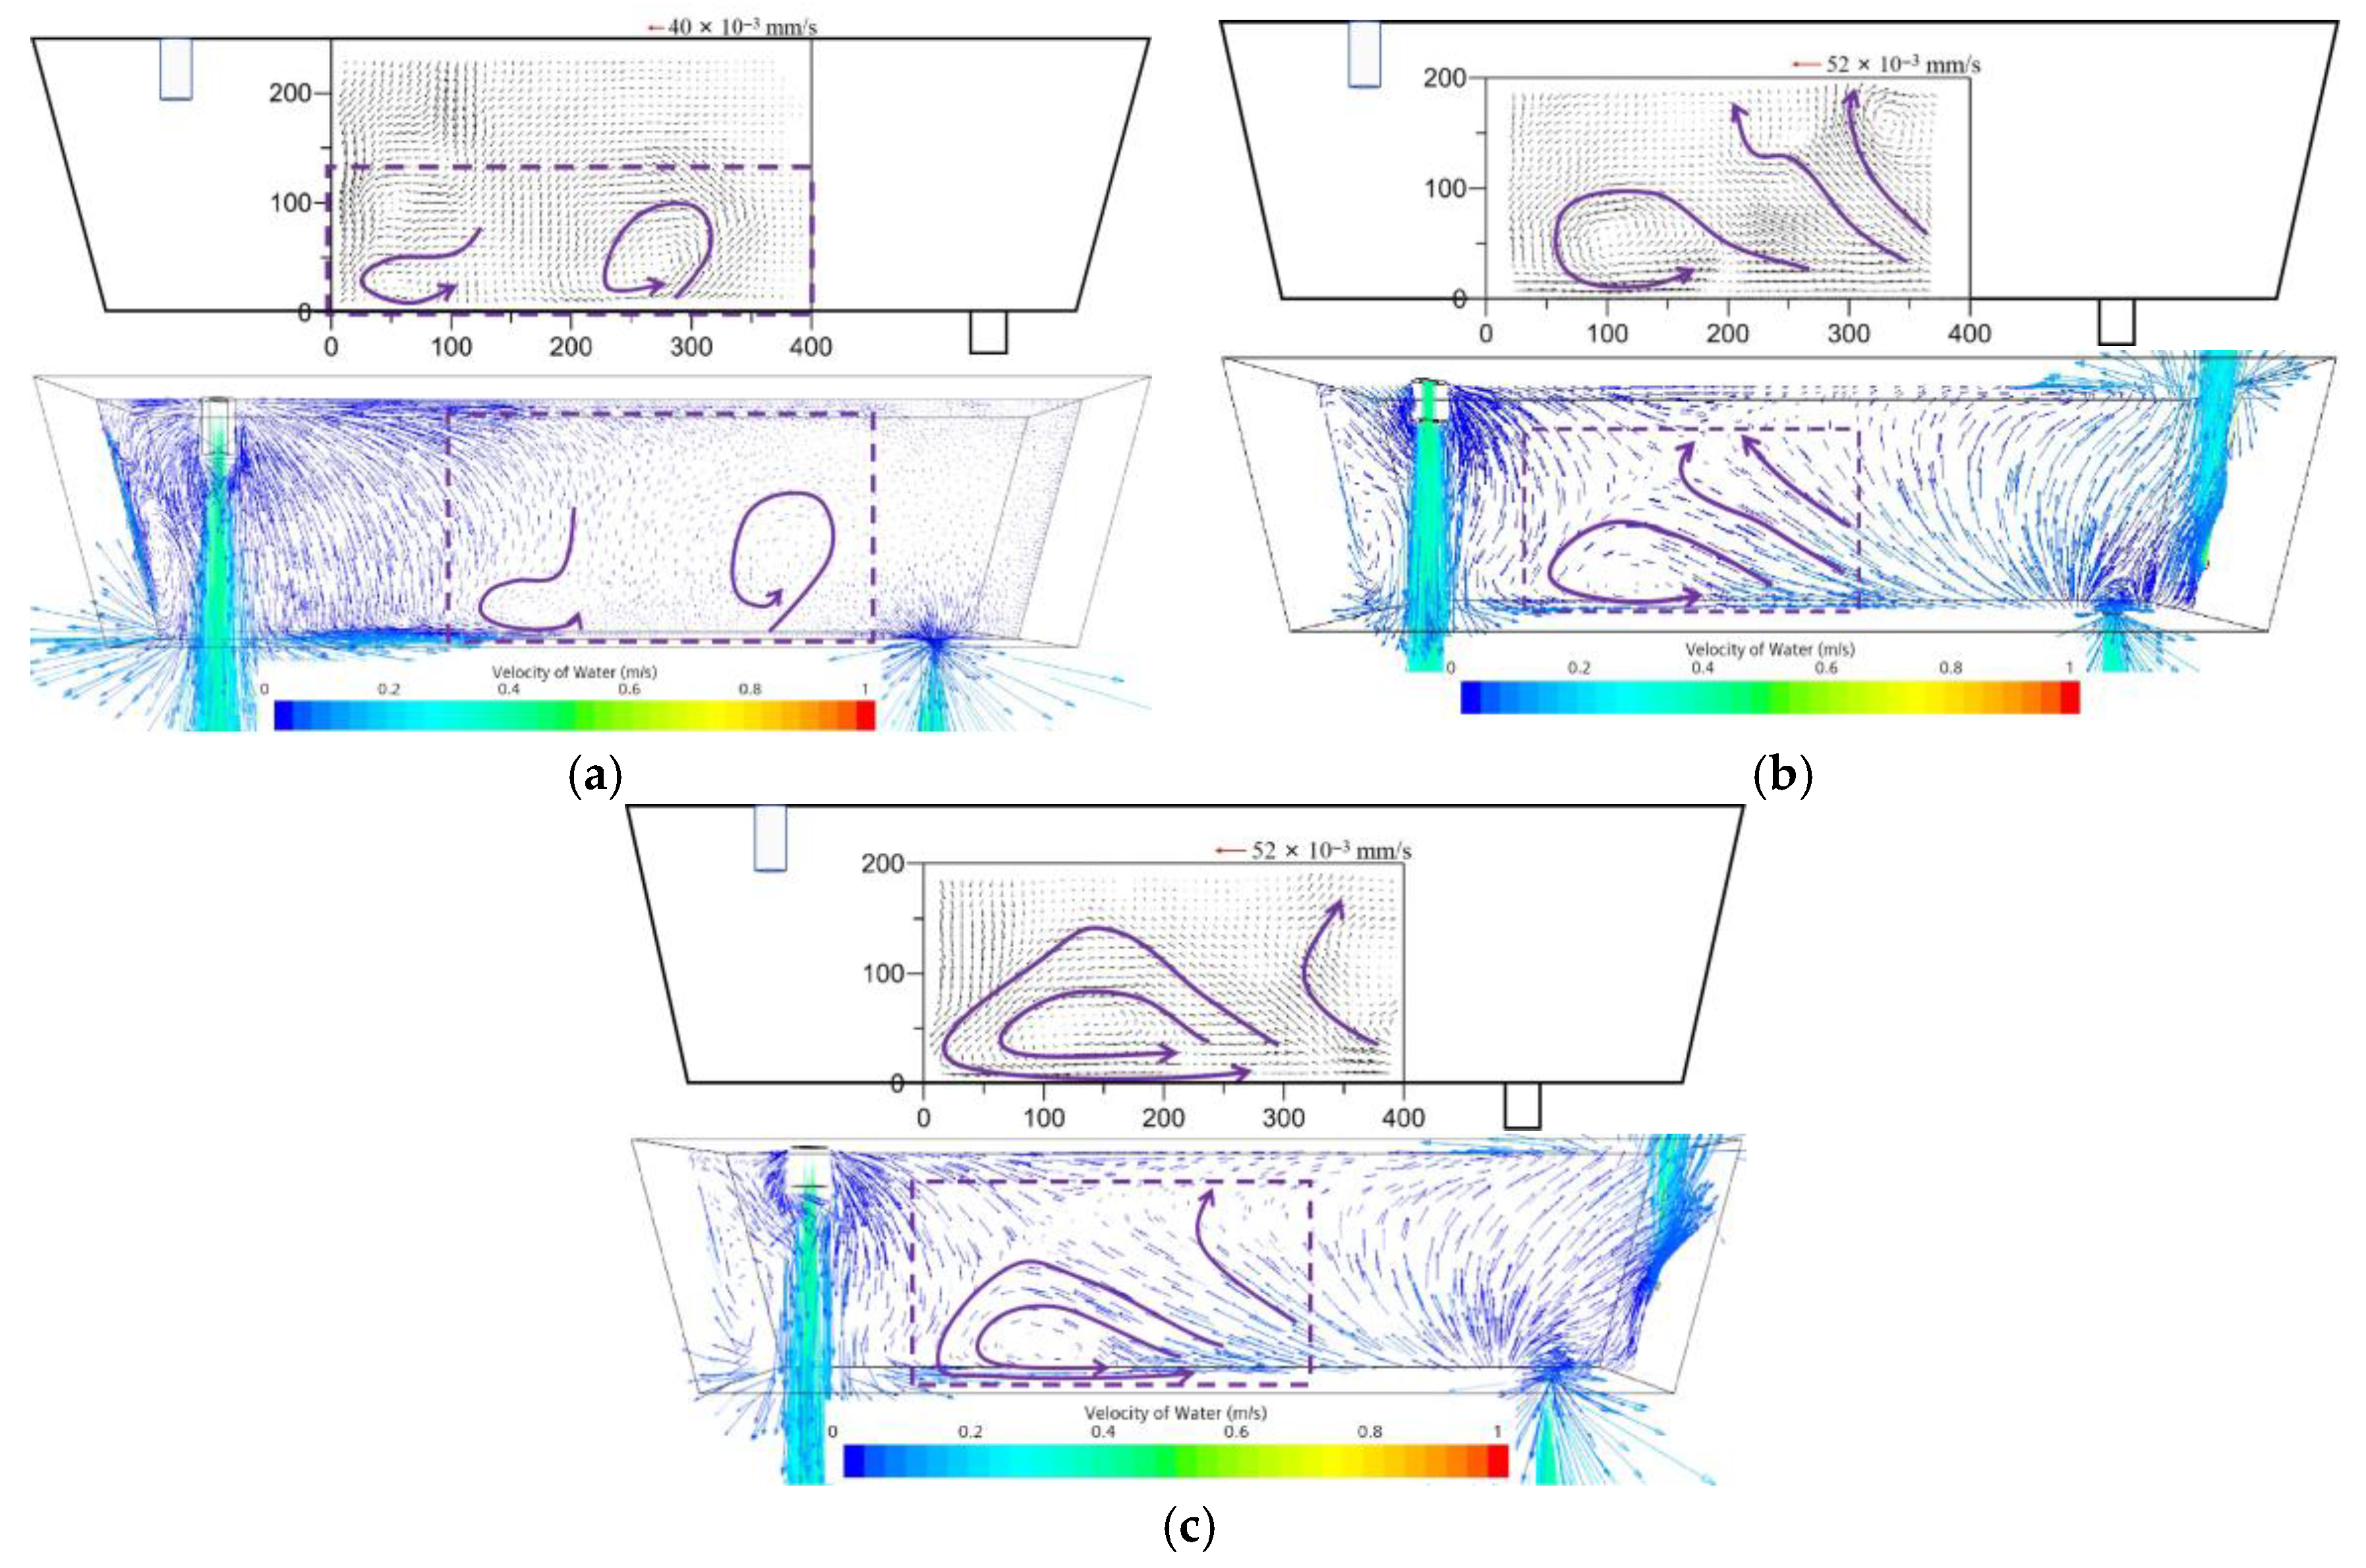
Figure 4 shows the comparison of the velocity vector fields obtained from PIV experiments and CFD simulations under three different conditions. Figure 4a–c correspond to Scheme 1 (bare tundish), Scheme 2 (sidewall gas blowing height of 50 mm), and Scheme 3 (sidewall gas blowing height of 100 mm), respectively. In the flow field of the bare tundish shown in Figure 4a, a distinct recirculation structure is observed near the long nozzle side. This phenomenon also appears in the study of tundish flow behavior by Odenthal et al. [50], indicating its generality. In contrast, Figure 4b,c show that sidewall gas blowing significantly affects the overall flow field structure inside the tundish. The originally localized recirculation zone expands into a large-scale counterclockwise vortex with a larger coverage area and more stable structure. Additionally, strong flow streams can be seen rising along the sidewall and transporting towards the liquid surface, significantly enhancing the flow intensity in the upper region, which helps to promote the upward migration and removal of inclusions. Further comparison of the flow field structures at the two different blowing heights reveals that as the blowing height increases from 50 mm to 100 mm, the vortex structure significantly enlarges and takes on a clearer triangular shape. Velocity analysis of the region shows that as the blowing height increases, the maximum flow velocity in the vortex zone rises from 0.11 m/s to 0.15 m/s, indicating that raising the blowing position helps enhance the intensity and range of the vortex.
A comprehensive comparison of the PIV experimental and CFD simulated velocity vector fields shows that the speed magnitude and flow pattern in the measurement area are highly consistent in both cases. This demonstrates that the constructed CFD model has good accuracy and reliability, effectively reflecting the internal flow characteristics of the tundish under different gas injection conditions.

3.3. Passive Scalar Transport Process

Figure 5 shows the passive scalar transport process inside the tundish under three different conditions. Five key time points are selected for comparison in each condition, corresponding to: (1) the time at which the passive scalar first reaches the bottom of the tundish; (2) the time at which the passive scalar develops two main propagation paths; (3) the time at which the passive scalar fills the left side region; (4) the time at which the passive scalar reaches the tundish outlet; (5) the time at which the passive scalar fully diffuses throughout the entire tundish.
From Figure 5a, it can be seen that in the bare tundish, the passive scalar first reaches the bottom of the tundish at 0.8 s, and then splits into two main propagation paths: Path 1 moves along the left sidewall of the tundish, then develops into a double-helix horseshoe vortex path in the central region of the tundish. Path 2 follows the bottom wall of the tundish. The passive scalar mainly develops along these two paths and at 18.548 s, it has filled the left side region. Some of the passive scalar begins to move along the horseshoe vortex structure towards the outlet side, forming a more distinct circulating flow pattern. At 53.168 s, the passive scalar traveling along Path 2 (short-circuit flow) reaches the tundish outlet region and starts to discharge. Meanwhile, the passive scalar traveling along the horseshoe vortex path converges into a continuous flow in the central region, advancing towards the right side and ultimately forming a clockwise rotating vortex structure on the right side, discharging through the outlet. It is important to note that due to the low flow velocity in the region above the outlet of the bare tundish, the mixing efficiency in this area is poor, and the passive scalar does not fully mix in this area until 346.370 s, indicating that this area is a typical low-velocity stagnation zone within the tundish. The presence of such a zone may negatively impact the inclusion removal efficiency.
From Figure 5b,c it can be seen that the tracer transport paths inside the tundish are similar under both sidewall blowing schemes. Whether with right-side gas injection (Schemes 2 and 3) or in the bare tundish (Scheme 1), the time required for the tracer to reach the bottom of the tundish is nearly identical (0.80 s). Furthermore, there is little change in the tracer flow pattern between the long nozzle and the left sidewall. During the transport, the tracer moves towards the outlet along the front and back walls. The gas injection into the right sidewall changes the original flow field, forming several larger vortices in the outlet region. The vortices near the middle of the tundish rotate clockwise, while the stronger vortices near the outlet sidewall rotate counterclockwise. When the tracer reaches the right side region, it first moves along the clockwise vortex towards the outlet. However, during this process, some of the tracer is directly entrained near the outlet sidewall and begins to travel along the counterclockwise vortex towards the outlet. When the two opposing vortices converge above the outlet, a downward flow is formed and flows out of the outlet. After raising the injection height, the transport path of the tracer inside the tundish does not change significantly, but the coverage area of the vortices generated by the gas injection expands. At the 50 mm injection height (Scheme 2), the vortices are mainly concentrated above the tundish outlet, whereas at the higher injection height, the vortex area gradually expands towards the inlet. When gas injection is at 50 mm (Scheme 2), the tracer diffuses throughout the entire tundish in 37.448 s. When the injection height is increased to 100 mm (Scheme 3), the tracer takes 38.648 s to completely diffuse, a 3.2% increase compared to Scheme 2. The time for tracer transport and mixing in both right-side blowing schemes is reduced by 89.2% and 88.8%, respectively, compared to Scheme 1 (346.368 s). Therefore, the agitation effect of right-side gas blowing can significantly accelerate the tracer transport and mixing inside the tundish, but increasing the blowing height slows down this process.

3.4. The Streamline and Passive Scalar Transport Process of Each Scheme

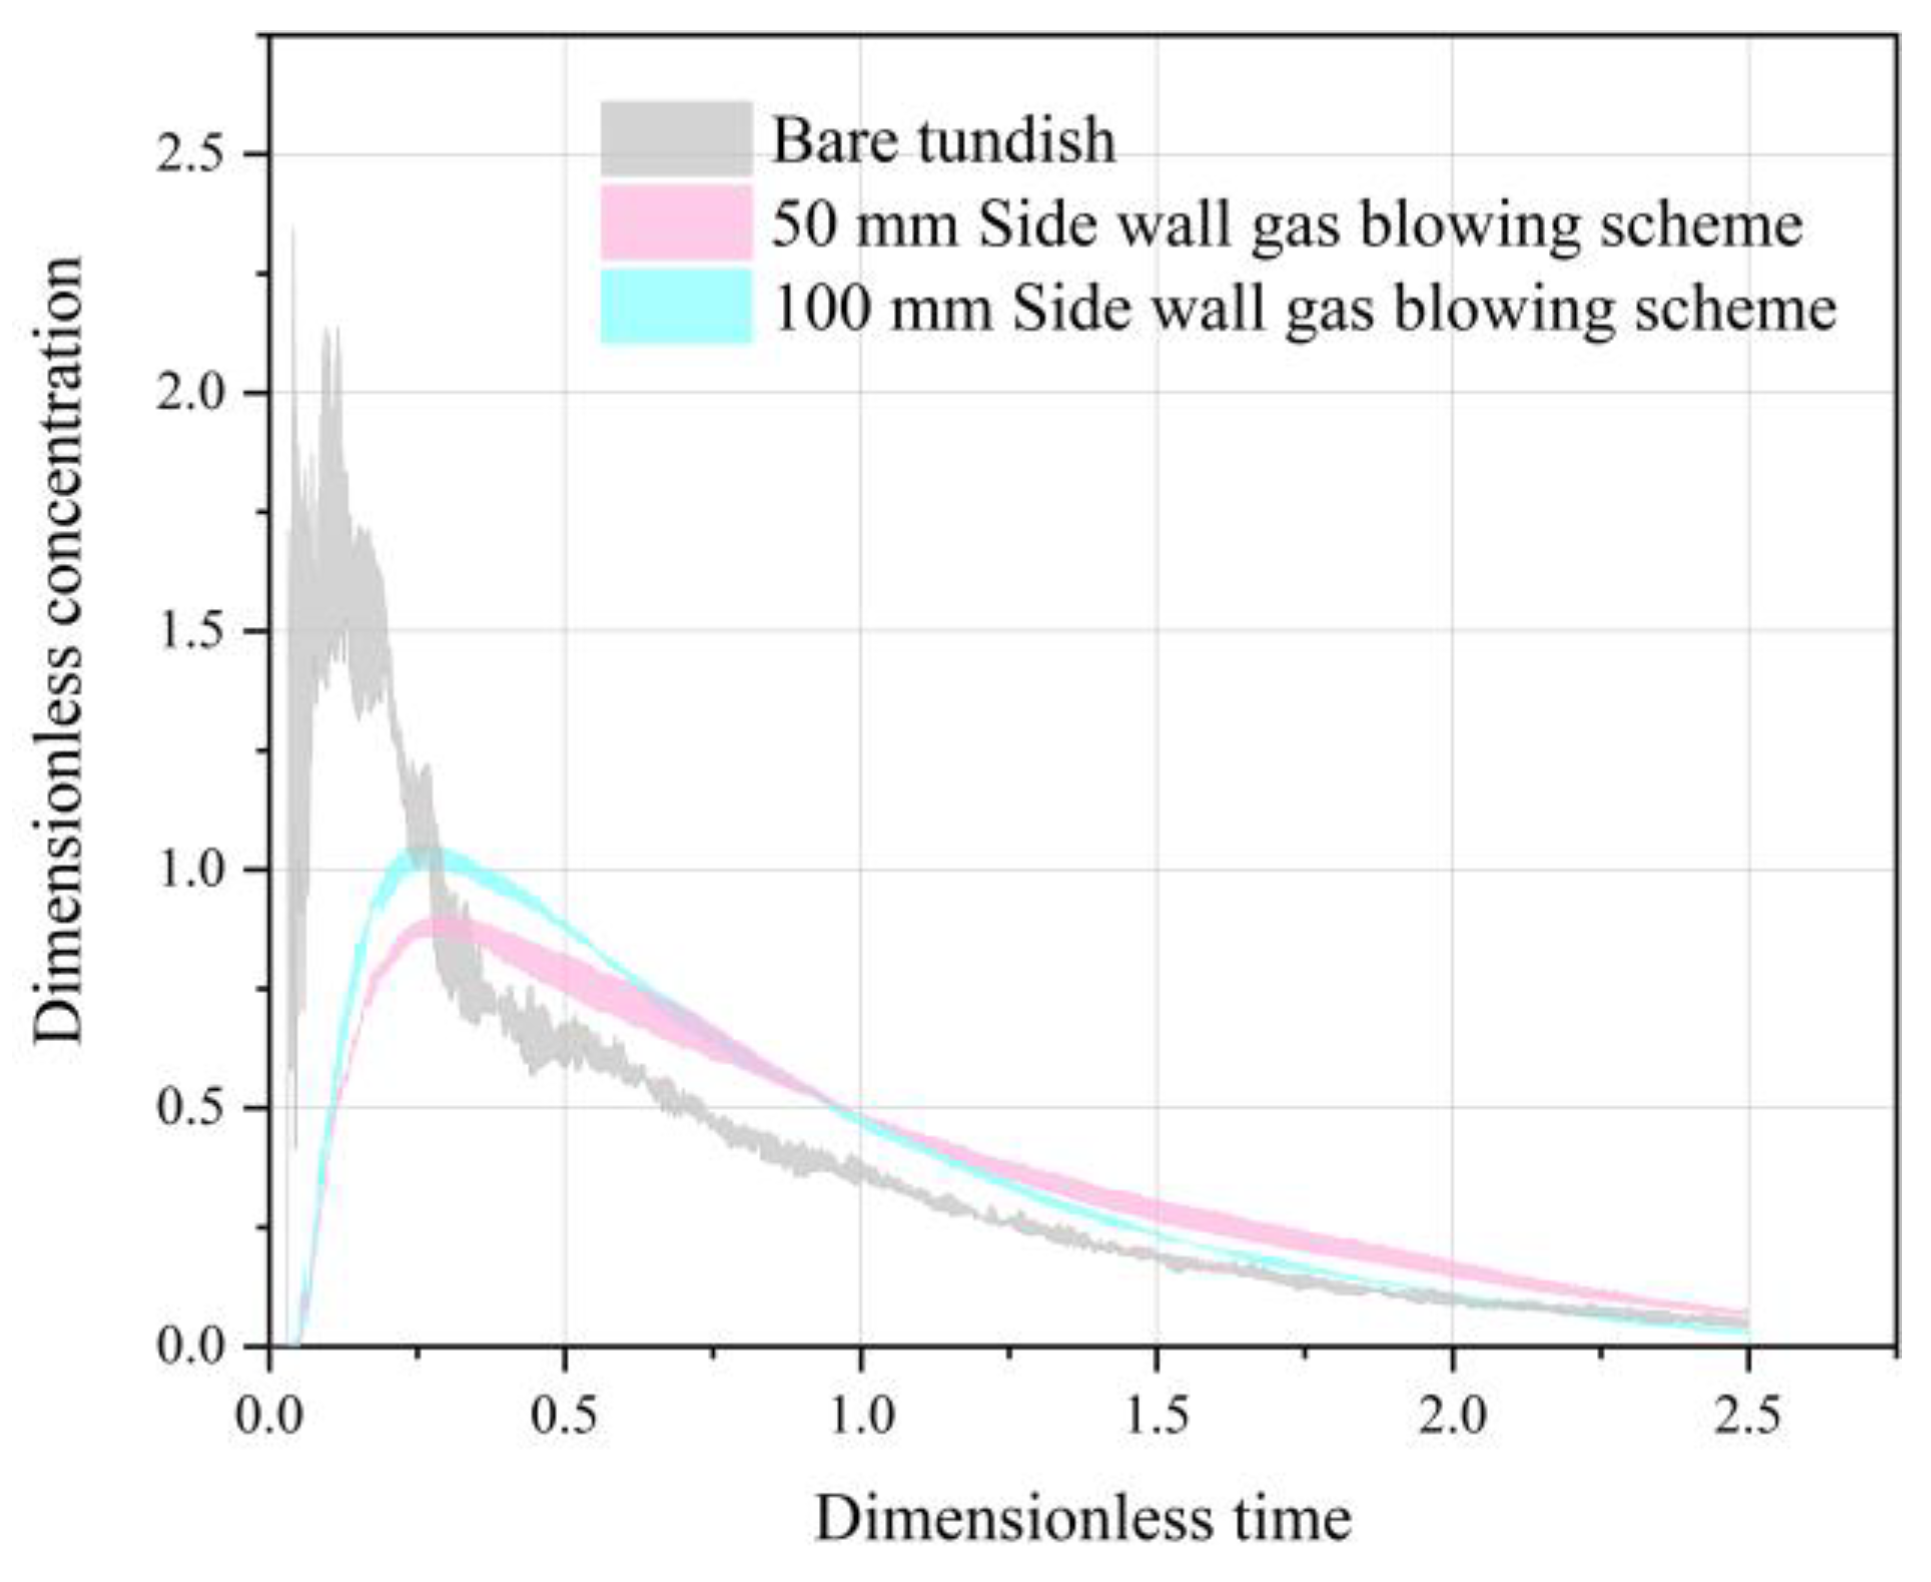
Figure 6 presents a comparison of the Residence Time Distribution (RTD) curves for the bare tundish, sidewall gas blowing at 50 mm, and sidewall gas blowing at 100 mm, while Table 3 lists the key characteristic parameters of the corresponding RTD curves. Compared to the bare tundish, sidewall gas blowing significantly improves the flow mixing behavior inside the tundish. However, as shown in Section 3.3 of the numerical simulation, the tracer transport and mixing efficiency decrease as the injection height increases.
First, from the RTD curves, it is evident that for the sidewall gas injection conditions, the curve shifts to the right, with the initial response times delayed by approximately 10 s (Scheme 2) and 12 s (Scheme 3), indicating that the tracer undergoes a more complete flow path before reaching the outlet. Secondly, compared to Scheme 1 (41.00 s), the peak times of the RTD curves in Schemes 2 and 3 are delayed by 137.50 s and 109.00 s, respectively, with the maximum peak concentrations significantly decreasing from 2.24 to 0.88 and 1.05, corresponding to attenuation magnitudes of 60.71% and 53.13%. This phenomenon indicates that the gas blowing effectively suppresses the formation of short-circuit flows, preventing the tracer from quickly exiting the system in large amounts, thus improving the uniformity of fluid distribution within the tundish. Further analysis shows that the average residence times in Schemes 2 and 3 increase to 525.48 s and 464.00 s, respectively, extending by 141.48 s (36.84%) and 80.00 s (20.83%) compared to Scheme 1 (384.00 s), indicating that the overall retention capacity of the tracer within the system has been enhanced, which facilitates further development of the mixing process. Additionally, under the sidewall gas injection conditions, the dead zone volume fraction within the tundish significantly decreases, from 43.53% in Scheme 1 to 24.70% (Scheme 2) and 29.63% (Scheme 3), with reductions of 18.83% and 13.90%, respectively. This further confirms that sidewall gas blowing not only weakens the dominant role of short-circuit flow but also effectively compresses the volume of low-velocity regions, increasing the proportion of the effective flow area.
In summary, sidewall gas blowing significantly optimizes the flow structure inside the tundish, showing excellent performance in enhancing fluid mixing, extending residence time, and eliminating dead zones and short-circuit flows.

3.5. Influence of Slag Layer on the Flow Field in the Tundish

3.5.1. Statistical Results of Slag Eye Area

Figure 7 presents the statistical results of the slag eye area at the liquid surface under two different sidewall gas blowing conditions. It can be observed that a distinct slag eye region forms at the liquid surface in both gas injection schemes. Specifically, as the blowing height increases from 50 mm to 100 mm, the slag eye area decreases from 11.02% to 9.26%, with a reduction of 1.76%. This change can be attributed to the higher gas injection position, which shortens the bubble residence path inside the tundish. As a result, the bubble flow development is insufficient, leading to reduced liquid surface disturbance, thereby decreasing the slag eye area.

3.5.2. Analysis of Flow Field in the Tundish Without Slag Layer

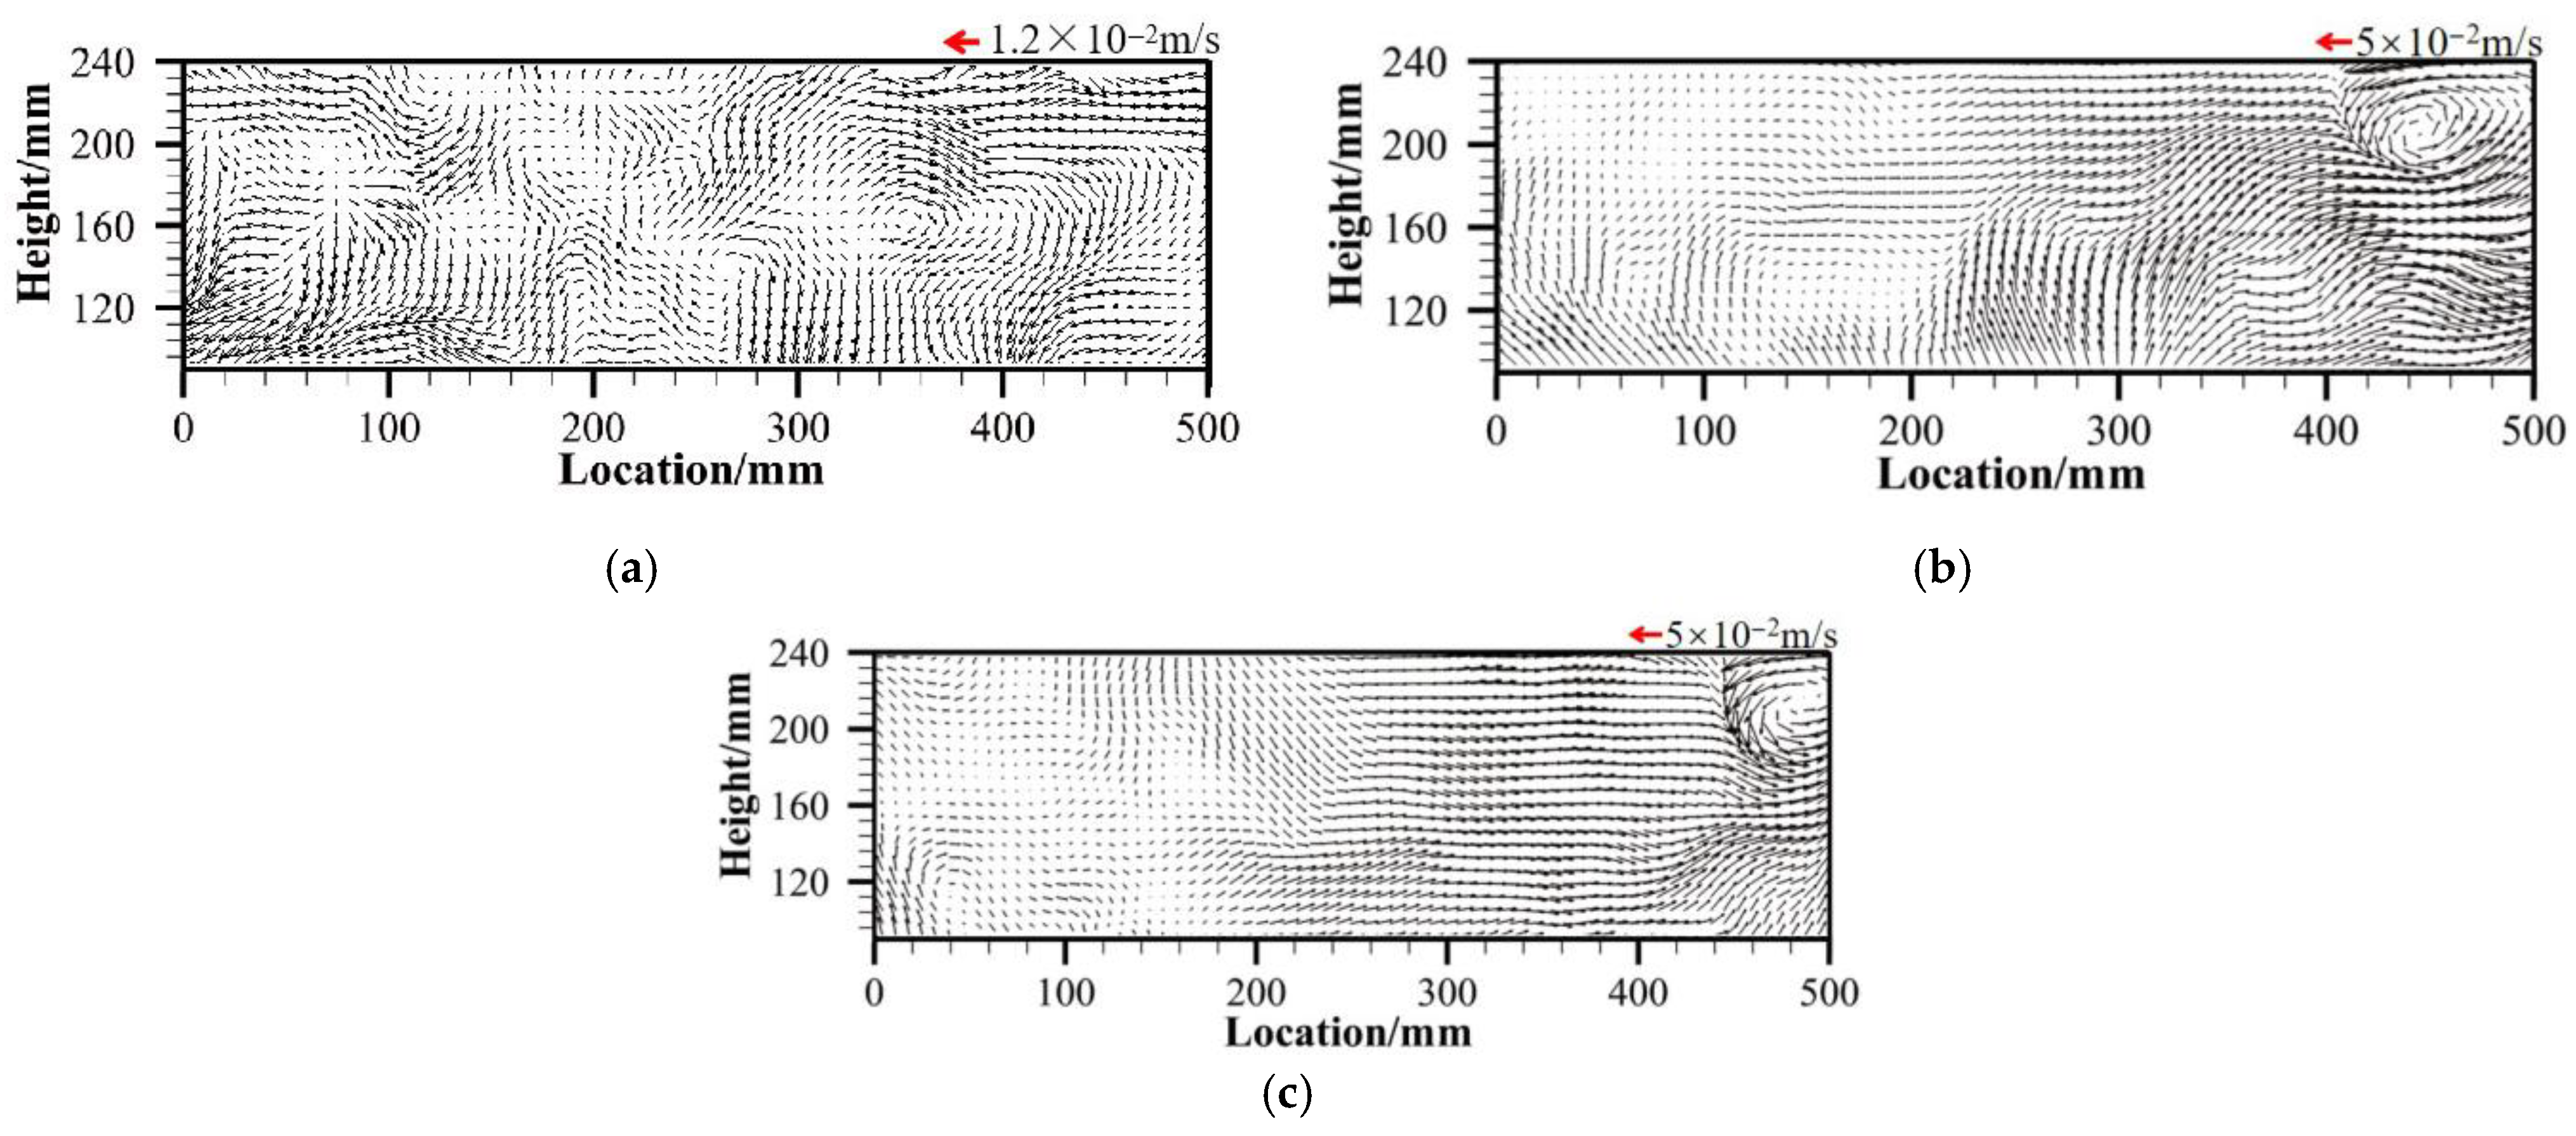
Figure 8 shows the velocity field distribution below the liquid surface in the tundish under three different conditions (Schemes 1–3) with no oil layer. For the bare tundish (Scheme 1, shown in Figure 8a), the overall fluid velocity is relatively low, with the maximum velocity only reaching 1.2 × 10⁻² m/s. In the region near the liquid surface (Y-direction 215–240 mm), significant fluid fluctuations are observed, with clear upward flow characteristics. Near the right sidewall, the flow direction gradually shifts to the horizontal. In the area near the long nozzle, a distinct downward flow is observed, indicating strong localized flow disturbances.
In contrast, under the right-sidewall gas blowing conditions (Schemes 2 and 3 shown in Figure 8b,c), the fluid velocity increases significantly, reaching a maximum of 5 × 10⁻² m/s. Both gas injection conditions form clear vortex structures in the region above the outlet (upper right corner of the velocity field diagram). When the gas flow rate remains constant, increasing the gas injection height leads to a reduction in the vortex size and a weakening of the flow intensity in its surrounding region. Specifically, at a blowing height of 50 mm (Scheme 2), significant upward flow is observed in some areas of the tundish, while the rest of the areas mainly exhibit horizontal flow. As the blowing height increases to 100 mm (Scheme 3), the vortex range slightly decreases, the surrounding flow velocity weakens, but the overall velocity field distribution becomes more uniform, helping to improve the consistency of the flow field.
In summary, right-sidewall gas blowing effectively activates the previously low-speed or stagnant flow regions above the tundish outlet, significantly enhancing the flow activity in this region, thus optimizing the overall flow field structure.

3.5.3. Analysis of Flow Field in the Tundish with Slag Layer

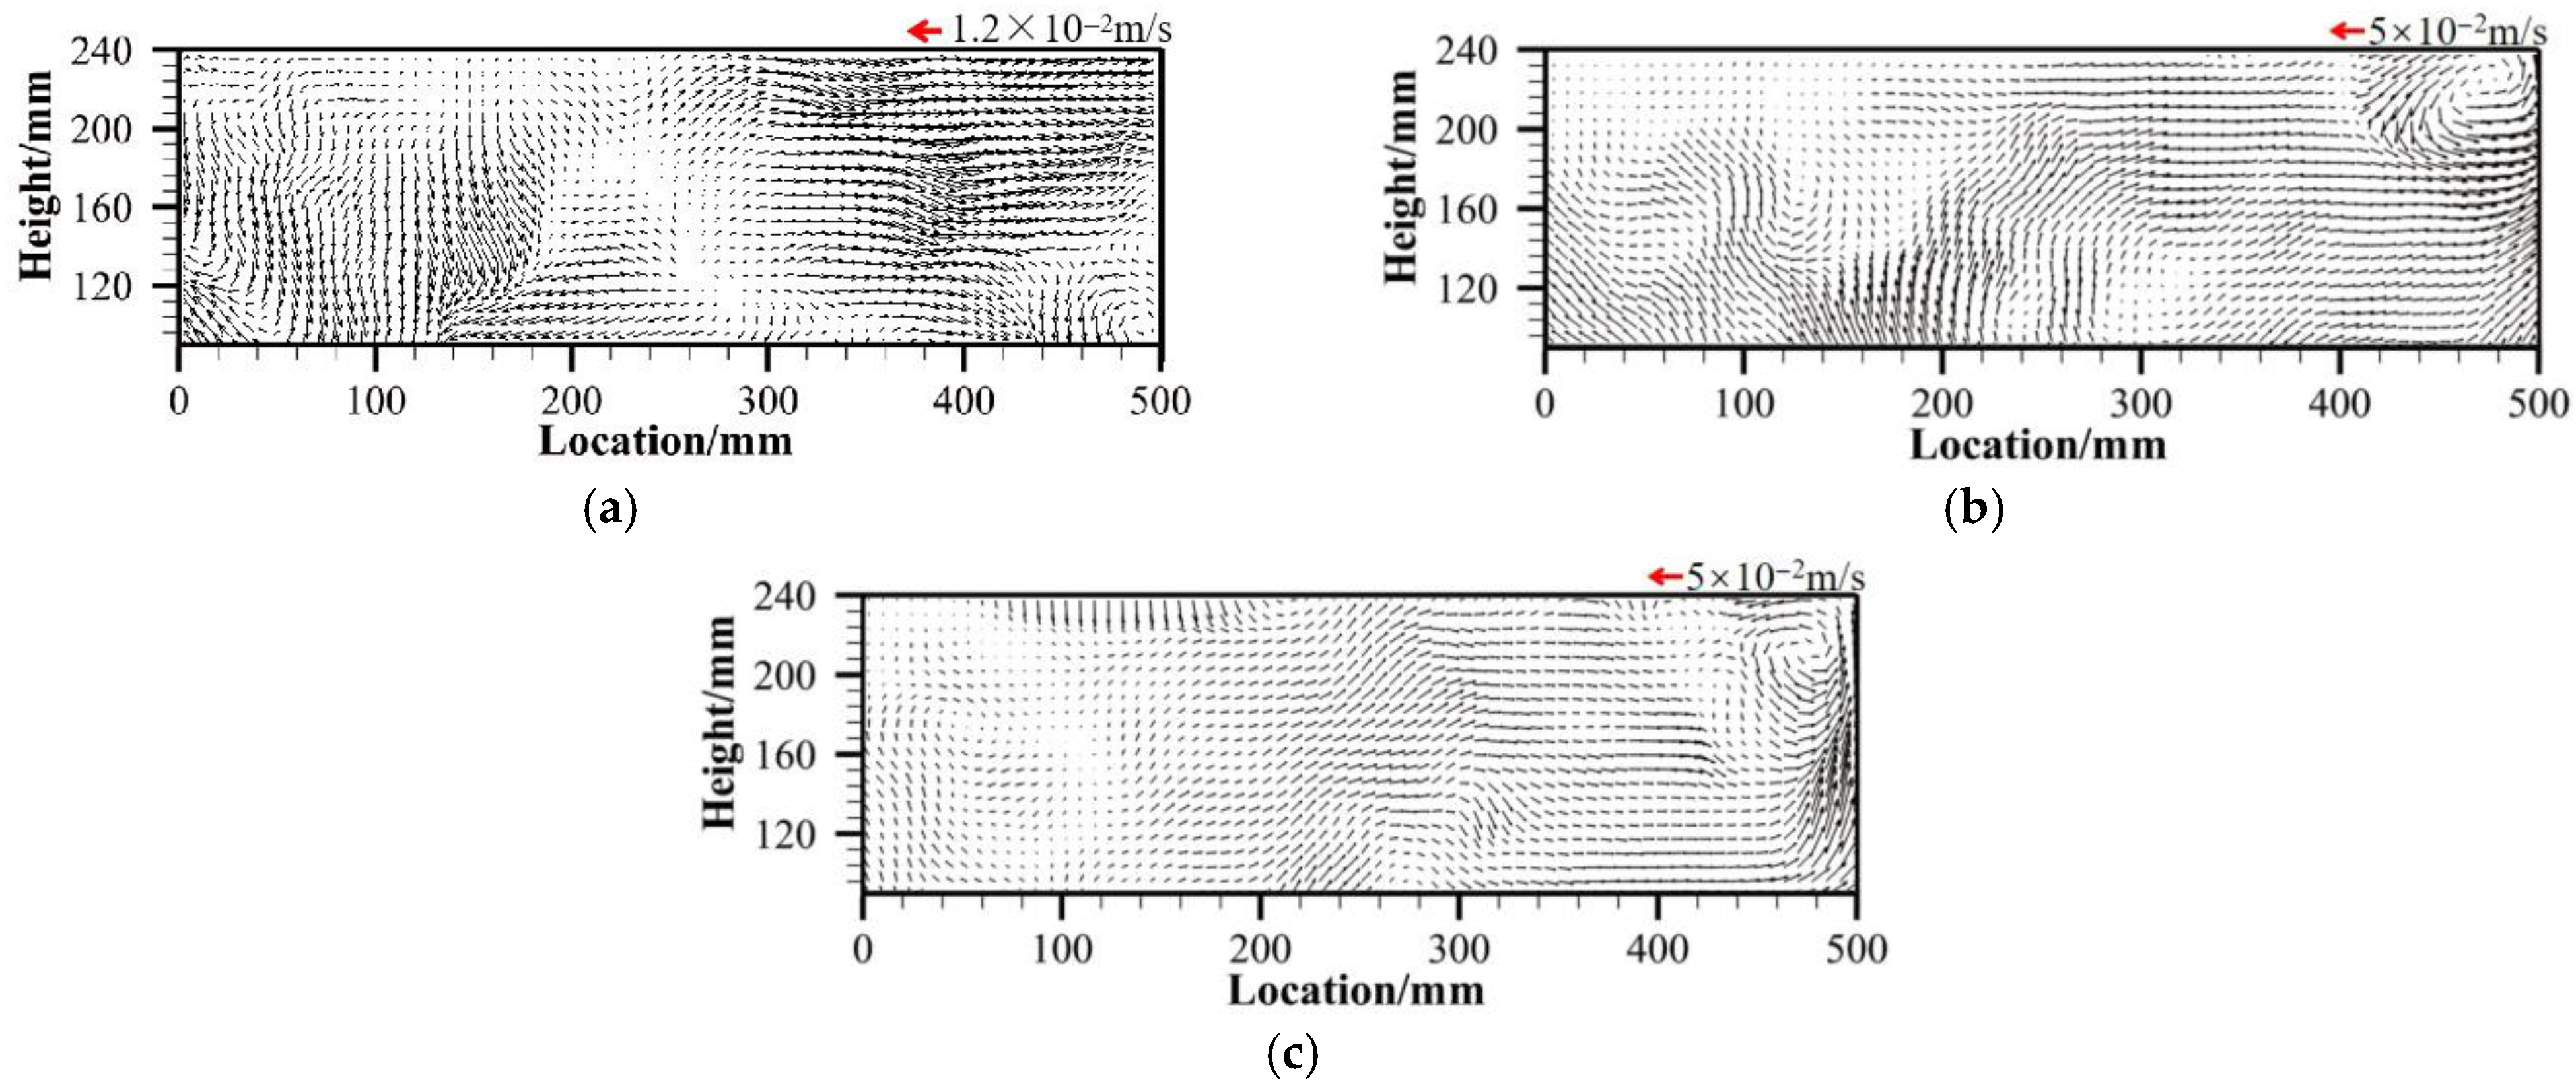
Figure 9 shows the velocity field distribution below the liquid surface in the tundish under three different conditions (Schemes 1–3) with the presence of a slag layer. Overall, the presence of the oil slag layer significantly alters the internal flow characteristics of the tundish.
Under the oil layer condition, for the bare tundish (Scheme 1, shown in Figure 8a), the liquid surface fluctuations are significantly reduced, and the flow pattern of the fluid near the liquid surface changes from vertical disturbances to predominantly horizontal flow, especially in the X-direction beyond 400 mm, where the horizontal flow is further enhanced. The overall fluid velocity is higher than that under the no-oil-layer condition. Near the long nozzle region, the strong downward flow that originally existed disappears and is replaced by stable horizontal flow, with the fluid being transported towards the inlet region. Near the right sidewall, except for a large vortex structure in the lower right corner, no distinct vortices are formed in the other regions. When the horizontal distance exceeds 300 mm, the overall flow exhibits predominant horizontal movement. Near 600 mm, the fluid begins to split into two streams: one moves slowly towards the liquid surface, while the other is directed by the vortex towards the bottom of the tundish. As shown in the figure, the upward transport trend is weak, and the bottom transport is more prominent. In summary, the introduction of the oil layer reshapes the internal flow field of the tundish, shifting the flow pattern from being dominated by vertical disturbances to being dominated by horizontal flow, significantly weakening the upward tendency and vortex strength of the fluid.
Further analysis from Figure 9b,c shows that under the oil layer condition, the velocity distribution inside the tundish is more uniform compared to the bare tundish (Scheme 1), and the flow field structure is relatively stable. Compared to Scheme 1, both Scheme 2 and Scheme 3 induce some degree of vortex structures in the region above the outlet, but these vortices are significantly constrained by the oil layer, and the overall disturbance range is smaller than in the corresponding conditions without an oil layer. As the blowing height increases from 50 mm (Scheme 2) to 100 mm (Scheme 3), the upward flow tendency weakens further, and the overall flow velocity decreases. Compared to the no-oil-layer condition, the upward flow induced by bubbles in Scheme 2 is significantly weakened, while the horizontal flow is enhanced, indicating that the oil layer has a certain suppressive effect on vertical disturbances. In Scheme 3, the overall changes in the flow field are smaller, predominantly exhibiting horizontal flow, with minimal vertical movement. Additionally, the stronger vortex structure that existed above the outlet is also significantly suppressed under the oil layer condition. Regardless of the blowing height, the size of the vortex and the surrounding flow velocity in this region are significantly reduced compared to the bare tundish and the no-oil-layer gas injection conditions, indicating that the oil layer effectively weakens the local disturbances induced by right-sidewall gas blowing and reduces the fluid response intensity in that region.

3.6. Short Discussion on Future Work

To further strengthen the applicability and depth of the present research, this section briefly discusses its limitations, outlines potential directions for future work, and highlights its broader significance for industrial practice.
The present study did not include high-temperature numerical simulations, which are essential for capturing flow behavior under realistic casting conditions. Future validation will therefore require the integration of high-temperature CFD modeling and industrial-scale measurements to enhance the generalizability of the findings.
In addition, based on the current framework, further investigations may focus on other key factors affecting tundish hydrodynamics. For instance, the effects of gas nozzle arrangement and variations in injection flow rate could be systematically evaluated, particularly in relation to their coupled impact on thermal fields and the movement of non-metallic inclusions.
Since the present simulations were conducted under steady-state conditions, future work should also address transient casting scenarios. In particular, the effectiveness of the proposed sidewall gas injection strategy could be assessed in terms of its potential to enhance surface stability, promote flow homogenization, and facilitate the removal of large-sized inclusions under dynamic operational conditions.
Overall, this study focuses on the effects of the slag layer and sidewall gas injection on the internal flow behavior of the tundish. The findings provide both theoretical insights and experimental support for optimizing gas injection strategies in practical steelmaking operations.

4. Conclusions

(1)
The right-sidewall gas blowing technology significantly improves the overall flow structure of the tundish. In the bare tundish, a typical low-speed stagnation zone exists in the region above the outlet. After the application of sidewall gas blowing, this region forms a stable large-scale counterclockwise rotating vortex, effectively promoting fluid movement in this region and significantly reducing the size of the stagnation zone. Additionally, the PIV experimental results from the water model and CFD simulations are highly consistent, validating the accuracy and applicability of the constructed numerical model. Sidewall blowing enhances the fluid flow rising from the wall to the liquid surface, extending the fluid migration path within the tundish and increasing the possibility of inclusion flotation and removal.
(2)
Sidewall gas blowing significantly improves the mixing performance of the tundish. Compared to the bare tundish, the average residence time increases to 525.48 s (+37%) and 464.00 s (+20.8%), while the dead zone volume fraction decreases to 24.70% (−18.83%) and 29.63% (−13.90%), respectively. At the same time, the RTD peak concentration decreases by 60.71%. These results indicate that the sidewall gas blowing scheme effectively suppresses the formation of short-circuit flows, expands the effective flow area, and significantly improves the mixing uniformity within the system.
(3)
The blowing height and slag layer conditions jointly influence the internal flow field structure of the tundish. The 50 mm gas injection height more easily induces strong vortices and upward flow, facilitating rapid fluid mixing and reducing the tracer mixing time by 89.2% compared to the bare tundish. However, the 100 mm injection height, although slightly reducing the mixing rate (mixing time reduced by 88.8%), improves the uniformity of the velocity distribution in the flow field. Furthermore, the presence of the slag layer has a significant suppressive effect on the gas blowing disturbances, weakening the upward flow induced by bubbles, resulting in a weakened vortex structure, reduced flow velocity, and a shift in the flow pattern from vertical disturbances to predominantly horizontal flow.

Author Contributions

Conceptualization, J.W. and C.C.; methodology, J.W., C.C., K.Y., T.W. and Y.Z.; software, T.W., M.G. and Y.Z.; validation, Y.H., J.L., H.W. and X.Z.; formal analysis, Y.Z., T.W. and M.G.; investigation, Y.H., J.L., H.W., X.Z. and T.W.; resources, J.W., C.C. and K.Y.; data curation, T.W., M.G., Y.H., H.W., X.Z. and Y.Z.; writing—original draft preparation, Y.Z., T.W. and M.G.; writing—review and editing, Y.Z., T.W., M.G. and C.C.; visualization, Y.Z., T.W., M.G. and J.L.; supervision, J.W., K.Y. and C.C.; project administration, C.C. and J.W.; funding acquisition, J.W., M.G. and H.W. All authors have read and agreed to the published version of the manuscript.

Funding

The authors are grateful to the financial support of the Applied Fundamental Research Programs of Shanxi Province (202403021222046); the Graduate Innovation Project of Shanxi Province (2024KY277) and the Undergraduate Innovation and Entrepreneurship Training Program of Shanxi Province (20250176).

Data Availability Statement

Data are contained within the article.

Acknowledgments

The comments from the reviewers are appreciated as they helped to improve this manuscript.

Conflicts of Interest

The authors declare no conflicts of interest.

References

  1. Szekely, J.; Ilegbusi, O.J. The Physical and Mathematical Modeling of Tundish Operations; Springer: New York, NY, USA, 1989; pp. 34–52. [Google Scholar]
  2. Sahai, Y. Tundish Technology for Clean Steel Production; World Scientific Publisher: Singapore, 2007; pp. 8–12. [Google Scholar]
  3. Mazumdar, D.; Guthrie, R.I.L. The Physical and Mathematical Modelling of Continuous Casting Tundish Systems. ISIJ Int. 1999, 39, 524–547. [Google Scholar] [CrossRef]
  4. Chattopadhyay, K.; Isac, M.; Guthrie, R.I.L. Physical and mathematical modelling of steelmaking tundish operations: A review of the last decade (1999–2009). ISIJ Int. 2010, 50, 331–348. [Google Scholar] [CrossRef]
  5. Chen, C.; Cheng, G.G.; Yang, H.K.; Hou, Z.B. Physical modeling of fluid flow characteristics in a delta shaped, four-strand continuous casting tundish with different flow control devices. Adv. Mater. Res. 2011, 284, 1071–1079. [Google Scholar] [CrossRef]
  6. Holappa, L.; Kekkonen, M.; Louhenkilpi, S.; Hagemann, R.; Schroder, C.; Scheller, P. Active tundish slag. Steel Res. Int. 2013, 84, 638–648. [Google Scholar] [CrossRef]
  7. Cao, J.Q.; Li, Y.; Lin, W.M.; Che, J.L.; Zhou, F.; Tan, Y.F.; Li, D.L.; Dang, J.; Chen, C. Assessment of Inclusion Removal Ability in Refining Slags Containing Ce2O3. Crystals 2023, 13, 202. [Google Scholar] [CrossRef]
  8. Chen, H.L.; Liu, Z.T.; Li, F.C.; Lyu, B.; Chen, W.; Zhang, L.F. Numerical simulation on multiphase flow and slag entrainment during casting start of a slab continuous casting tundish. Metall. Mater. Trans. B 2023, 54, 2048–2065. [Google Scholar] [CrossRef]
  9. Wang, J.C.; Liu, Z.T.; Chen, W.; Chen, H.L.; Zhang, L.F. Numerical simulation on the multiphase flow and reoxidation of the molten steel in a two-strand tundish during ladle change. Int. J. Miner. Metall. Mater. 2024, 31, 1540–1553. [Google Scholar] [CrossRef]
  10. Morales, R.D.; Garcia-Hernandez, S.; Barreto, J.J.; Ceballos-Huertal, A.; Calderon-Ramos, I.; Gutierrez, E. Multiphase Flow Modeling of Slag Entrainment During Ladle Change-Over Operation. Metall. Mater. Trans. B 2016, 47, 2595–2606. [Google Scholar] [CrossRef]
  11. Solhed, H.; Jonsson, L.; Jönsson, P. A theoretical and experimental study of continuous-casting tundishes focusing on slag-steel interaction. Metall. Mater. Trans. B 2002, 33, 173–185. [Google Scholar] [CrossRef]
  12. Solhed, H.; Jonsson, L.; Jönsson, P. Modelling of the steel/slag interface in a continuous casting tundish. Steel Res. Int. 2008, 79, 348–357. [Google Scholar] [CrossRef]
  13. Zhang, J.S.; Qin, B.M.; Liu, Y.H.; Li, Q.H.; Zuo, X.T.; Wang, C.; Yang, S.F.; Liu, Q. Multiphase flow inside a four-strand continuous casting tundish using three types of ladle shrouds. J. Iron Steel Res. Int. 2023, 30, 1171–1181. [Google Scholar] [CrossRef]
  14. Satish Kumar, D.; Rajendra, T.; Rrasad, R.; Sarkar, A.; Ranjan, M. Forced flotation of inclusions in tundish. Ironmak. Steelmak. 2009, 36, 470–475. [Google Scholar] [CrossRef]
  15. Mukherjee, S.; Mazumdar, D. Physical and Mathematical Modeling of Argon Flow and Distribution Around a Ladle Shroud-Collector Nozzle (LS-CN) Assembly. Metall. Mater. Trans. B 2022, 53, 2600–2617. [Google Scholar] [CrossRef]
  16. Xin, Z.; Cui, H.; Li, T.; Tang, G.; Zhu, Y.; Yan, J.; Li, J. Numerical Simulation of Inclusion Removal by Bubble Injection in the Submerged Nozzle with Swirling Flow. Metall. Mater. Trans. B 2022, 53, 2570–2586. [Google Scholar] [CrossRef]
  17. Qin, X.F.; Cheng, C.G.; Li, Y.; Wu, W.L.; Jin, Y. Effect of coarse aggregate content on bubble formation behavior in corundum permeable brick for tundish. Steel Res. Int. 2023, 94, 2200915. [Google Scholar] [CrossRef]
  18. Qin, X.F.; Cheng, C.G.; Li, Y.; Wu, W.L.; Chen, H.; Zhao, C.F.; Jin, Y. Numerical simulation on gas–liquid multiphase flow behavior under coupling effects of annular gas curtain and swirling flow at tundish upper nozzle. J. Iron Steel Res. Int. 2024, 31, 2693–2709. [Google Scholar] [CrossRef]
  19. Li, Y.; Li, Y.; Cheng, C.G.; Liu, J.G.; Wu, W.L.; Chen, D.L. Theory of movement behavior of argon bubbles in upper nozzle of tundish during argon blowing process. Metall. Mater. Trans. B 2023, 54, 3568–3578. [Google Scholar] [CrossRef]
  20. Chang, S.; Zou, Z.S.; Liu, J.H.; Isac, M.; Cao, X.K.E.; Su, X.F.; Guthrie, R.I.L. Study on the slag-metal interfacial behavior under the impact of bubbles in different sizes. Powder Technol. 2021, 387, 125–135. [Google Scholar] [CrossRef]
  21. Chang, S.; Zou, Z.; Li, B.; Isac, M.; Guthrie, R.I.L. Modeling Inclusion Removal when Using Micro-bubble Swarm in a Full-Scale Tundish with an Impact Pad. Metall. Mater. Trans. B 2022, 53, 526–536. [Google Scholar] [CrossRef]
  22. Chang, S.; Song, H.; Liu, Z.; Zou, Z.; Shao, L.; Li, B. Experimental Study on Bubble Entrainment by a Free Fall Jet in an Argon-Filled Continuous Casting Tundish. Steel Res. Int. 2023, 94, 2200287. [Google Scholar] [CrossRef]
  23. Ramos-Banderas, A.; Morales, R.D.; García-Demedices, L.; Díaz-Cruz, M. Mathematical Simulation and Modeling of Steel Flow with Gas Bubbling in Trough Type Tundishes. ISIJ Int. 2003, 43, 653–662. [Google Scholar] [CrossRef]
  24. Vargas-Zamora, A.; Palafox-Ramos, J.; Morales, R.D.; Díaz-Cruz, M.; Barreto-Sandoval, J.J. Inertial and buoyancy driven water flows under gas bubbling and thermal stratification conditions in a tundish model. Metall. Mater. Trans. B 2004, 35, 247–257. [Google Scholar] [CrossRef]
  25. Ramos-Banderas, A.; Morales, R.D.; Barreto, J.J.; Solorio-Diza, G. Modelling study of inclusions removal by bubble flotation in the tundish. Steel Res. Int. 2006, 77, 325–335. [Google Scholar] [CrossRef]
  26. Zhong, L.; Li, L.; Wang, B.; Jiang, M.; Zhu, L.; Zhang, L.; Chen, R. Water Modeling Experiments of Argon Bubbling Curtain in a Slab Continuous Casting Tundish. Steel Res. Int. 2006, 77, 103–106. [Google Scholar] [CrossRef]
  27. Wang, J.; Zhu, M.Y.; Zhou, H.B.; Wang, Y. Fluid flow and interfacial phenomenon of slag and metal in continuous casting tundish with argon blowing. J. Iron Steel Res. Int. 2008, 15, 26–31. [Google Scholar] [CrossRef]
  28. Chattopadhyay, K.; Isac, M.; Guthrie, R.I.L. Physical and Mathematical Modelling of Inert Gas Shrouding in a Tundish. ISIJ Int. 2011, 51, 573–580. [Google Scholar] [CrossRef]
  29. Chatterjee, S.; Chattopadhyay, K. Formation of Slag ‘eye’ in an Inert Gas Shrouded Tundish. ISIJ Int. 2015, 55, 1416–1424. [Google Scholar] [CrossRef]
  30. Chatterjee, S.; Chattopadhyay, K. Physical Modeling of Slag ‘Eye’ in an Inert Gas-Shrouded Tundish Using Dimensional Analysis. Metall. Mater. Trans. B 2016, 47, 508–521. [Google Scholar] [CrossRef]
  31. Cwudziński, A. Hydrodynamic effects created by argon stirring liquid steel in a one-strand tundish. Ironmak. Steelmak. 2017, 45, 528–536. [Google Scholar] [CrossRef]
  32. Cwudziński, A. Numerical and Physical Modeling of Liquid Steel Flow Structure for One Strand Tundish with Modern System of Argon Injection. Steel Res. Int. 2017, 88, 1600484. [Google Scholar] [CrossRef]
  33. Chatterjee, S.; Li, D.; Chattopadhyay, K. Modeling of Liquid Steel/Slag/Argon Gas Multiphase Flow During Tundish Open Eye Formation in a Two-Strand Tundish. Metall. Mater. Trans. B 2018, 49, 756–766. [Google Scholar] [CrossRef]
  34. Song, J.T.; Chen, C.; Guo, Z.J.; Geng, M.J.; Rong, Z.R.; Wang, T.Y.; Wang, J.; E, D.; Fan, J.P.; Sun, Y.H. Analysis of Flow Field, Temperature, and Inclusion Evolution in a 12-Strand Tundish During Ladle Changeover Process. Metall. Mater. Trans. B 2025, 56, 2700–2714. [Google Scholar] [CrossRef]
  35. Quan, Q.; Zhang, Z.X.; Qu, T.P.; Li, X.L.; Tian, J.; Wang, D.Y. Physical and numerical investigation on fluid flow and inclusion removal behavior in a single-strand tundish. J. Iron Steel Res. Int. 2023, 30, 1182–1198. [Google Scholar] [CrossRef]
  36. Wang, J.; Liu, W.; Yang, S.; Zuo, X.T.; Zhao, L.; Li, J.S. Effect of tundish impact zone optimization on inclusion removal in steel: Industrial and simulation studies. Metall. Mater. Trans. B 2024, 55, 808–820. [Google Scholar] [CrossRef]
  37. Qin, B.M.; Zhang, J.S.; Yang, C.H.; Yang, S.F.; Liu, Q. Study on influencing factors and their combined effects on multiphase behavior in tundish pouring zone. Metall. Mater. Trans. B 2025, 56, 1176–1191. [Google Scholar] [CrossRef]
  38. Hu, J.Y.; Yang, S.L.; Wang, H. VOF study of mesoscale bubble flow dynamics in the side-blown gas–liquid two-phase reactor. Chem. Eng. J. 2024, 480, 147983. [Google Scholar] [CrossRef]
  39. Wan, Z.H.; Yang, S.L.; Kong, D.S.; Li, D.B.; Hu, J.H.; Wang, H. Numerical investigation of sinusoidal pulsating gas intake to intensify the gas-slag momentum transfer in the top-blown smelting furnace. Int. J. Miner. Metall. Mater. 2024, 31, 301–314. [Google Scholar] [CrossRef]
  40. Fang, W.F.; Wan, Z.H.; Hu, Z.H.; Wang, Y.F.; Shi, P.H.; Huang, J.D.; Zhong, L.H.; Li, M.Z. Gas–slag–matte multiphase flow and bubble dynamics in an industrial side-blown smelting furnace. Phys. Fluids 2025, 37, 083356. [Google Scholar] [CrossRef]
  41. Neves, L.; Tavares, R.P. Analysis of the mathematical model of the gas bubbling curtain injection on the bottom and the walls of a continuous casting tundish. Ironmak. Steelmak. 2017, 44, 559–567. [Google Scholar] [CrossRef]
  42. Wang, T.Y.; Wang, J.; Chen, C.; Chen, L.; Geng, M.J.; Song, J.T.; Fan, J.P.; Lin, W.M. Physical and numerical study on right side and front side gas blowing at walls in a single-strand tundish. Steel Res. Int. 2024, 95, 2400037. [Google Scholar] [CrossRef]
  43. Liu, J.; Zhou, P.; Zuo, X.; Wu, D.; Wu, D. Optimization of the Liquid Steel Flow Behavior in the Tundish through Water Model Experiment, Numerical Simulation and Industrial Trial. Metals 2022, 12, 1480. [Google Scholar] [CrossRef]
  44. Cwudziński, A.; Pieprzyca, J.; Merder, T. Numerical and Physical Modeling of Liquid Steel Asymmetric Behavior during Non-Isothermal Conditions in a Two-Strand Slab Tundish—“Butterfly Effect”. Materials 2023, 16, 6920. [Google Scholar] [CrossRef]
  45. Walek, J.; Tkadlečková, M.; Velička, M.; Machů, M.; Cupek, J.; Huczala, T.; Cibulka, J.; Růžička, J.; Michalek, K. Physical Experiments and Numerical Simulations of the Influence of Turbulence Inhibitors and the Position of Ladle Shroud on the Steel Flow in an Asymmetric Five-Strand Tundish. Metals 2023, 13, 1821. [Google Scholar] [CrossRef]
  46. Geng, M.J.; Wang, T.Y.; Chen, C. Assessment of the Volume Effect and Application of an Improved Tracer in Physical Model of a Single-Strand Bare Tundish. Metall. Mater. Trans. B 2024, 55, 4121–4131. [Google Scholar] [CrossRef]
  47. Yue, Q.; Li, Y.; Wang, Z.M.; Sun, B.C.; Wang, X.Z. Analysis model of internal residence time distribution for fluid flow in a multi-strand continuous casting tundish. J. Iron Steel Res. Int. 2024, 31, 2186–2195. [Google Scholar] [CrossRef]
  48. Ding, C.Y.; Lei, H.; Zhang, H.; Xiao, Y.Y.; Zhao, Y.; Zou, Z.S. New understanding on relationship between rtd curve and inclusion behavior in the tundish. Metall. Mater. Trans. B 2024, 55, 2224–2239. [Google Scholar] [CrossRef]
  49. Odenthal, H.J.; Bölling, R.; Pfeifer, H.; Holzhauser, J.F.; Wahlers, F.J. Mechanism of fluid flow in a continuous casting tundish with different turbo-stoppers. Steel Res. 2001, 72, 466–476. [Google Scholar] [CrossRef]
  50. Odenthal, H.J.; Javurek, M.; Kirschen, M. CFD benchmark for a single strand tundish (part I). Steel Res. Int. 2009, 80, 264–274. [Google Scholar] [CrossRef]
  51. Alkishriwi, N.; Meinke, M.; Schröder, W.; Braun, A.; Pfeifer, H. Large-eddy simulations and particle-image velocimetry measurements of tundish flow. Steel Res. Int. 2006, 77, 565–575. [Google Scholar] [CrossRef]
  52. Cwudziński, A. Numerical and Physical Modeling of Liquid Steel Active Flow in Tundish with Subflux Turbulence Controller and Dam. Steel Res. Int. 2013, 85, 902–917. [Google Scholar] [CrossRef]
  53. Huang, J.; Yuan, Z.; Shi, S.; Wang, B.; Liu, C. Flow Characteristics for Two-Strand Tundish in Continuous Slab Casting Using PIV. Metals 2019, 9, 239. [Google Scholar] [CrossRef]
  54. Mohammadi, A.; Nili-Ahmadabadi, M.; Mohammadi, S.; Joulaei, A.; Ha, M.Y. Optimizing flow patterns and residence time in a two-strand steelmaking tundish via PIV and tracer-based flow detection. Metall. Res. Technol. 2025, 122, 203. [Google Scholar] [CrossRef]
  55. Zhang, H.; Fang, Q.; Deng, S.Y.; Liu, C.; Ni, H.W. Multiphase flow in a five-strand tundish using trumpet ladle shroud during steady-state casting and ladle change-over. Steel Res. Int. 2019, 90, 1800497. [Google Scholar] [CrossRef]
  56. Liu, Z.Q.; Yao, Y.C.; Wang, N.; Yang, J.; Xu, G.D.; Li, B.K. Physical and Numerical Simulations on the Unsteady Three-Phase Flow in a Continuous Casting Tundish During Ladle Changeover Process. Metall. Mater. Trans. B 2025, 56, 1982–1993. [Google Scholar] [CrossRef]
  57. Ling, H.T.; Xu, R.; Wang, H.J.; Chang, L.Z.; Qiu, S.T. Multiphase flow behavior in a single-strand continuous casting tundish during ladle change. ISIJ Int. 2020, 60, 499–508. [Google Scholar] [CrossRef]
  58. Zhang, Z.X.; Wang, H.; Qu, T.P.; Wang, D.Y.; Li, X.L.; Hu, S.Y.; Tian, J.; Zhou, X.Z.; Yang, Z.H. Numerical investigation on transient flow and inclusion removal behavior in tundish during ladle change process. Steel Res. Int. 2024, 95, 2400471. [Google Scholar] [CrossRef]
  59. Wang, T.Y.; Chen, C.; Tao, X.; Wang, J.; Geng, M.J.; Song, J.T.; Li, L.B.; Fan, J.P.; Lin, W.M. Impact of slag layer on macroscopic flow inside tundish and velocity near slag-steel interface. Chin. J. Process Eng. 2024, 24, 1058–1069. [Google Scholar] [CrossRef]
  60. Siemens PLM. STAR-CCM + User Guide, version 16.06; Siemens PLM Software Inc.: Munich, Germany, 2021.
  61. Fan, J.P.; Li, Y.Q.; Chen, C.; Ouyang, X.; Wang, T.Y.; Lin, W.M. Effect of Uniform and Non-Uniform Increasing Casting Flow Rate on Dispersion and Outflow Percentage of Tracers in Four Strand Tundishes under Strand Blockage Conditions. Metals 2022, 12, 1016. [Google Scholar] [CrossRef]
  62. Song, J.T.; Luo, Y.Z.; Li, Y.Q.; Guo, Z.J.; Wang, T.Y.; Geng, M.J.; Lin, W.M.; Fan, J.P.; Chen, C. Comparison of Fluid Flow and Tracer Dispersion in Four-Strand Tundish under Fewer Strand Casting and Sudden Blockage of Strand Conditions. Metals 2024, 14, 571. [Google Scholar] [CrossRef]
  63. Patankar, S.V. Numerical Heat Transfer and Fluid Flow; Hemispere Publ. Corp.: New York, NY, USA, 1980; p. 16. [Google Scholar]
  64. Shih, T.H.; Liou, W.W.; Shabbir, A.; Yang, Z.; Zhu, J. A new k-ϵ eddy viscosity model for high reynolds number turbulent flows. Comput. Fluids 1995, 24, 227–238. [Google Scholar] [CrossRef]
  65. Rodi, W. Experience with two-layer models combining the k-epsilon model with a one-equation model near the wall. In Proceedings of the 29th Aerospace Sciences Meeting, Reno, NV, USA, 1–10 January 1991; ARC: Columbus, OH, USA, 1991; p. 216. [Google Scholar] [CrossRef]
  66. Tomiyama, A.; Tamai, H.; Zun, I.; Hosokawa, I. Transverse migration of single bubbles in simple shear flows. Chem. Eng. Sci. 2002, 57, 1849–1858. [Google Scholar] [CrossRef]
  67. Ouyang, X.; Lin, W.M.; Luo, Y.Z.; Zhang, Y.X.; Fan, J.P.; Chen, C.; Cheng, G.G. Effect of Salt Tracer Dosages on the Mixing Process in the Water Model of a Single Snorkel Refining Furnace. Metals 2022, 12, 1948. [Google Scholar] [CrossRef]
  68. Xu, Z.; Ouyang, X.; Chen, C.; Li, Y.; Wang, T.; Ren, R.; Yang, M.; Zhao, Y.; Xue, L.; Wang, J. Numerical Simulation of the Density Effect on the Macroscopic Transport Process of Tracer in the Ruhrstahl-Heraeus (RH) Vacuum Degasser. Sustainability 2024, 16, 3923. [Google Scholar] [CrossRef]
  69. Xu, R.; Ling, H.T.; Wang, H.J.; Chang, L.Z.; Qiu, S.T. Investigation on the effects of ladle change operation and tundish cover powder on steel cleanliness in a continuous casting tundish. Steel Res. Int. 2021, 92, 2100072. [Google Scholar] [CrossRef]
Figure 1. Single-strand tundish without flow control devices.
Modelling 06 00087 g001
Figure 2. Mesh configuration: (a) Front view; (b) Side view.
Modelling 06 00087 g002
Figure 3. Diagram of bubble behavior in tundish.
Modelling 06 00087 g003
Figure 4. Comparison of vector results of PIV results and CFD results with: (a) Bare tundish; (b) Side wall gas blowing scheme at 50 mm; (c) Side wall gas blowing scheme at 100 mm.
Modelling 06 00087 g004
Figure 5. Streamline figure of tracer transport processes: (a) Bare tundish; (b) Side wall gas blowing scheme at 50 mm; (c) Side wall gas blowing scheme at 100 mm.
Modelling 06 00087 g005
Figure 6. Comparison of RTD Curves between Gas Injection and Bare Schemes.
Modelling 06 00087 g006
Figure 7. Pictures of the slag eye in the water model: (a) Side wall gas blowing scheme at 50 mm; (b) Side wall gas blowing scheme at 100 mm.
Modelling 06 00087 g007
Figure 8. Velocity field below the liquid surface (without slag layer): (a) Scheme 1; (b) Scheme 2; (c) Scheme 3.
Modelling 06 00087 g008
Figure 9. Velocity field below the liquid surface (with slag layer): (a) Scheme 1; (b) Scheme 2; (c) Scheme 3.
Modelling 06 00087 g009
Table 1. Water model parameter.
ParametersWater ModelIndustrial Tundish
Volumetric flowrate nozzle [L/min]9.3224
Diameter of the outlet nozzle [mm]2589.25
Depth of liquid [mm]2801000
Diameter of the shroud [mm]2278.54
Immerse of shroud depth [mm]44157.08
Table 2. Experimental schemes.
SchemesOrifice Height/mmGas Blowing Flow Rate/(L·min−1)
Scheme 1 (Bare tundish)--
Scheme 2 502.5
Scheme 3 1002.5
Table 3. Characteristic Parameters of Average RTD Curves.
SchemesResponse Time/sThe Time of Maximum Peak Concentration/sMaximum Peak Con-CentrationMean Residence Time/sDead Zone Volume Fraction/%
Scheme 1 19.0041.002.24384.0043.53
Scheme 2 29.00178.500.88525.4824.70
Scheme 3 31.00150.001.05464.0029.63
Disclaimer/Publisher’s Note: The statements, opinions and data contained in all publications are solely those of the individual author(s) and contributor(s) and not of MDPI and/or the editor(s). MDPI and/or the editor(s) disclaim responsibility for any injury to people or property resulting from any ideas, methods, instructions or products referred to in the content.