Article

Equivalent Porous Medium (EPM) Modeling of Karst Features for Slope Stability Analysis in Karst-Prone Weak Rock Masses

1
Department of Earth Resources Engineering, Faculty of Engineering, Kyushu University, Fukuoka 819-0395, Japan
2
Department of Mining, Materials and Petroleum Engineering, Jomo Kenyatta University of Agriculture and Technology, Nairobi P.O. Box 62000-0020, Kenya
3
Department of Geography, Earth Science, and Environment, School of Natural and Applied Science, University of Malawi, Zomba P.O. Box 280, Malawi
*
Author to whom correspondence should be addressed.
Modelling 2025, 6(3), 81; https://doi.org/10.3390/modelling6030081 (registering DOI)
Submission received: 10 June 2025 / Revised: 26 July 2025 / Accepted: 8 August 2025 / Published: 14 August 2025

Abstract

In weak carbonate rock masses, small-sized karst features ranging from greater than 2 cm to over 1 m in diameter can significantly compromise slope stability, yet they are often overlooked in traditional geotechnical models. This study employs the equivalent porous medium (EPM) approach to incorporate these small-sized voids into two-dimensional finite element slope stability analysis using RS2 software (Version 11.022). By treating the matrix of karst hollows as a porous continuum, we simulate the mechanical and hydraulic influence of their presence on pit slope performance. Results show that even small voids substantially reduce the factor of safety, with destabilization intensifying as void density and pore fluid infiltration increase. Distinct failure mechanisms—including circular sliding, localized subsidence due to cavity collapse, and rockfalls from intersecting shear planes—emerge from the simulations. The stress trajectories and yield elements highlight how minor voids influence the distribution and initiation of shear and tensile failures. These findings reveal that karst features previously considered negligible can be critical structural discontinuities that trigger failure. The EPM framework thus provides a computationally efficient and mechanistically sound means of modelling the cumulative impact of small-sized karst features, bridging a significant gap in geotechnical design for karst-prone weak rock slopes.

1. Introduction

Karstification is a widespread geological phenomenon that significantly complicates the geotechnical behavior of carbonate rock masses. In engineering design, karst-related defects present severe challenges to slope stability, particularly in open-pit mining and civil infrastructure projects. Weak carbonate rocks—such as chalks, coral limestones, and poorly lithified limestones—are especially vulnerable due to their low intact strength and susceptibility to dissolution. Karstification produces complex subsurface features, including voids, sinkholes, and irregular rock mass structures, collectively referred to as karst hollows. Although often small and irregular, these features can dramatically reduce the mechanical integrity of a rock slope and introduce high spatial variability that complicates both design and modeling.
While major karst caves and conduits have been extensively studied and are typically included in site investigation programs, small-sized karst features—defined here as cavities with diameters ranging from greater than 2 cm up to 1 m—are frequently overlooked. These minor defects are difficult to detect using conventional geophysical or drilling methods, largely due to the highly fractured and poorly recovered core samples in such weak rock formations [1,2]. Their random spatial distribution and variable geometry make it challenging to establish a reliable geotechnical model, increasing uncertainty in engineering design [3,4]. However, these small voids function analogously to interparticle pores in porous rock masses, introducing both mechanical discontinuities and preferential fluid flow paths that exacerbate weakening [5]. Their effect on rock mass strength is even more critical in the presence of water, where seepage and dissolution processes accelerate structural degradation and reduce effective shear resistance [6,7]. The presence of water, in addition to karst, further weakens the rock mass by promoting dissolution of carbonate minerals and altering the original structural characteristics, thereby diminishing mechanical properties [8,9,10]. The inherent variability of karst formations means that mining operations in such rock masses must contend with highly heterogeneous conditions, which transfer through the slope design process as uncertainties in the geotechnical model [11].
Analyzing rock slope stability in weak rock masses lacking well-developed joints requires explicit modeling of structural features that influence rock mass strength. Smaller karst features often develop in rocks such as chalk, weaker limestones, and unlithified carbonates, which lack the strength to span large cavities [12,13]. Ford and Ewers [14] define a karst cave as a solutional conduit or void large enough for turbulent water flow, typically greater than 5–16 mm in diameter. In carbonate terrains subject to tropical or coastal weathering regimes, such as the Vipingo coral limestone quarry in Kenya, the impact of small-sized karst features has been repeatedly observed in field failures. Instances of bench collapse, circular slips, and subsidence near slope toes have been linked to small, often coalescing hollows within the rock face [15]. Figure 1 illustrates typical karst features observed at Vipingo [16], as well as comparative examples from the Pulo di Molfetta site in southern Italy [17]. Such failures are difficult to predict using traditional methods, which often treat the rock mass as homogeneous or simplify discontinuities as deterministic planes or major voids only [18]. This oversight can result in inaccurate estimates of the factor of safety and an incomplete understanding of failure mechanisms.
Jele and Dunn [11] identified three types of geological uncertainty relevant to mining environments that must be considered in geotechnical design: geological uncertainty (errors in defining geological features and unforeseen conditions), parameter uncertainty (how well data represent reality), and model uncertainty (selection of analysis methods). In the weak, karst-prone rock masses, all three uncertainties are compounded and must be identified and quantified to ensure reliable slope stability analysis. Quantifying failure risk requires physical and numerical models capable of simulating both the mechanical and hydraulic consequences of karstification in a statistically and geomechanically realistic manner [19,20].
Over the past two decades, researchers have modeled the effects of voids and porous features within rock masses using discrete element methods (DEM), CT-based digital image processing, and stochastic modeling. For example, Zhang et al. [21] simulated porous rock specimens using UDEC’s grain-based model to assess the impact of hole density on mechanical behavior. Han et al. [22] employed FLAC3D and direct mapping techniques to derive the elastic properties of sandstone samples, while Hertel et al. [23] proposed an upscaling method for correlating digital porosities with whole-core CT scan data. However, these methods are often limited to laboratory sample-scale applications, require intensive data acquisition (e.g., high-resolution core logs or CT scans), and are computationally demanding [24].
Other studies have explored digital image processing and stochastic methods for larger-scale slope modeling. Zhang et al. [25] developed a stochastic model to simulate the occurrence of karst caves and incorporated it into a limit equilibrium slope stability analysis. However, such models typically assume void dimensions above a certain threshold (e.g., greater than 1 m in width), thereby excluding smaller features. The complexity of model setup and scarcity of reliable drillhole data in weak rock environments further limit their practical application.
Recent studies have examined various aspects of karst-related geotechnical issues. For example, Li et al. [26] conducted stability and deformation evolution analyses of karstified slopes subjected to underground mining, utilizing the Hoek–Brown failure criterion. Their findings underscore the critical impact of subsurface voids on slope stability, especially in mining contexts, and highlight the importance of understanding stratum instability zones and the role of numerical simulations in designing effective support systems. In tunnel engineering, Zou et al. [27] investigated the stability of tunnel roofs in karst regions using catastrophe theory, providing insights into instability prediction and emphasizing the adverse effects of cave size, water pressure, and rock elasticity. Sheng et al. [28] examined the bearing behavior of pile foundations in karst regions through physical model tests and finite element analysis, revealing that the height and span of karst caves significantly influence load-bearing capacity and necessitate careful design considerations.
Advanced numerical techniques such as hybrid cohesive phase-field models have recently emerged as powerful tools for simulating fracture initiation and propagation in brittle geomaterials with high spatial resolution [29]. However, their application to slope stability analysis in karst-affected terrains remains limited due to the structural variability of natural karst features and the high computational cost required to model numerous small, irregularly shaped voids. Additionally, such models often require custom implementations beyond the capabilities of most commercial geotechnical software. In contrast, the equivalent porous medium (EPM) approach offers a practical and computationally efficient alternative for simulating the bulk mechanical and hydraulic influence of distributed voids, particularly in weak carbonate rock masses where karst features range from a few centimeters to a meter in size. By treating these small-sized voids as a porous continuum, EPM enables upscaling of their destabilizing effects into slope-scale models, bridging the gap between field observation and numerical analysis.
Recently, machine learning-based approaches have shown strong potential for slope stability analysis by efficiently predicting the factor of safety or failure probability from large geotechnical datasets. For example, Aminpour et al. [30] trained surrogate ML models on over 120,000 Monte Carlo simulations to predict stability conditions with approximately 91% AUC while reducing computation time from months to hours. Zhang and Wei [31] applied Random Forest, XGBoost, and GBM to 188 real slope cases, finding GBM particularly accurate and faster than traditional finite-element runs. While these data-driven methods are powerful for classification and probabilistic forecasting, they remain model-free and generally insensitive to underlying physical mechanisms. In contrast, this study employs a physics-based equivalent porous medium (EPM) framework to mechanistically capture the impact of small-sized karst voids on slope stability, offering complementary insights where extensive monitoring data may not be available.
These studies collectively underscore the multifaceted challenges posed by karst formations in geotechnical engineering. Despite the availability of advanced modeling tools, there remains a need for comprehensive approaches that can effectively simulate the influence of small-sized karst features on slope stability. Most available solutions are designed for jointed or intact rock and require substantial customization to handle the distributed voids typical of karst-prone masses. A simpler, computationally efficient, and field-scale applicable solution is required, particularly one that can integrate observed field characteristics such as void density and distribution.
To address this need, this study applies the equivalent porous medium (EPM) approach within a finite element framework to represent the cumulative weakening effect of small-sized karst voids on slope stability. Traditionally used in hydrogeology, EPM modeling treats the rock mass as a homogenized porous medium with effective properties that account for distributed voids. This simplification allows for efficient finite element analysis while preserving the essential structural and hydraulic effects of karstification. By implementing the EPM framework in MATLAB version 9.11 (R2021b) and integrating it into the RS2 numerical analysis software, we aim to evaluate the mechanical influence of karst voids on slope stability in the Vipingo quarry setting.
The specific objectives of this study are to model the effect of distributed karst voids—ranging from greater than 2 cm to over 1 m in diameter—on the overall factor of safety of pit slopes; to analyze how varying void densities and the presence of seepage alter failure modes, stress fields, and yield patterns; and to assess the applicability of the EPM framework for modeling real-world slope instabilities in weak, karst-affected rock masses. Through this approach, the study seeks to provide a computationally practical yet mechanistically grounded method for incorporating karst-related features into slope design, thereby improving safety assessments in mining and civil engineering projects located in carbonate terrains.

1.1. Equivalent Porous Medium (EPM): Conceptualization and Modeling Framework

The equivalent porous medium (EPM) concept has traditionally been applied in hydrogeology and porous media mechanics to represent fractured or voided rock masses as homogenized continua with averaged properties. This approach enables efficient simulation of systems containing numerous irregular internal discontinuities, such as fractures or cavities, without the need to explicitly model each feature. While the EPM framework is well established in fluid flow modeling, its application to geotechnical slope stability analysis, particularly in karst-affected weak rock masses, remains limited. In this study, we extend the EPM concept to evaluate the cumulative mechanical effects of small-sized karst voids, typically ranging from 2 cm to 1 m in diameter, on pit slope performance.
A two-stage numerical modeling approach was adopted. In the first stage, a synthetic karst void matrix was generated in MATLAB, based on field-derived statistical distributions of cavity sizes and densities. The voids were modeled as simplified circular geometries to represent both isolated and ellipsoid cavities, ensuring compatibility with available meshing tools and geometric constraints in slope stability software. In the second stage, the generated EPM matrix was imported into RS2, a two-dimensional finite element modeling program by Rocscience Inc., where stability analyses were conducted under both dry and seepage boundary conditions. This integrated MATLAB–RS2 modeling framework allows for the simulation of the global weakening effects of distributed voids within a slope-scale model, providing a computationally efficient means to capture karst-induced instability without discretely modeling each cavity.
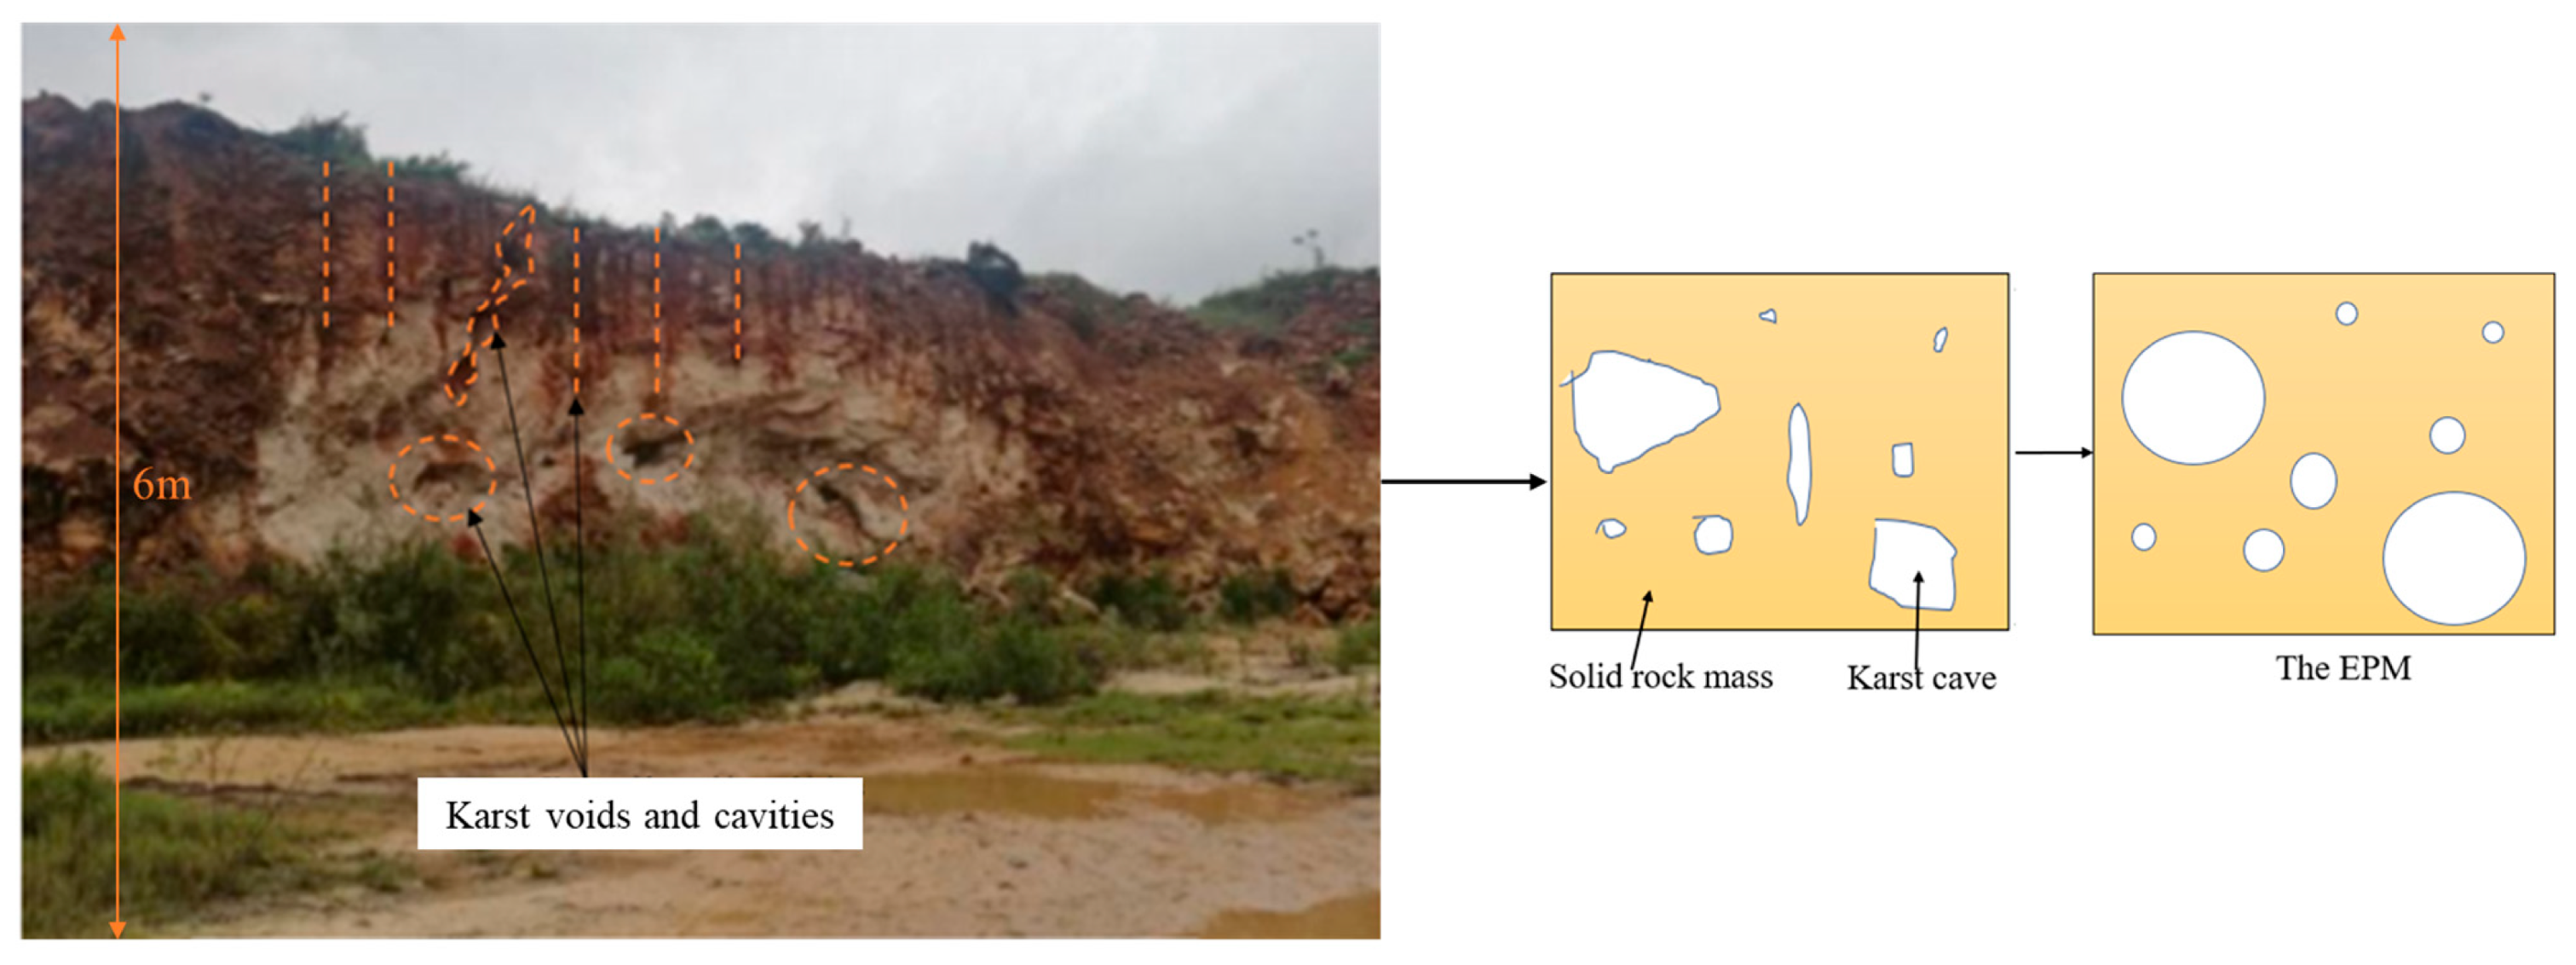
Karst cavities within weak carbonate rock masses exhibit varied and often irregular geometries, including approximately circular, elliptical, and angular forms, which are illustrated by the dashed lines in Figure 2. Accurately modeling the shape and area of such geological voids is challenging due to their structural complexity, poor core recovery, and sub-meter scale, which frequently renders them undetectable by geophysical methods. To address these limitations, this study adopts a simplified modeling strategy in which all cavities are represented as circular cross-sections generated in MATLAB. Ellipsoidal voids are approximated by clusters of interconnected circular hollows, facilitating geometric regularization and ensuring compatibility with finite element meshing requirements. The resulting void matrix is then transformed into an equivalent porous medium (EPM), providing a computationally efficient means of capturing the cumulative mechanical and hydraulic effects of distributed karst features. This approach is particularly effective in geotechnical contexts where discrete modeling is impractical, enabling realistic slope-scale simulations of karstified rock masses. Figure 2 illustrates the conversion of a mapped void distribution into a porous continuum suitable for numerical slope stability analysis.

1.2. Mathematical Representation of the EPM Using the Method of Slices

The EPM framework employed in this study is mathematically adapted from Bishop’s simplified method of slices [33] to account for the presence of voids within each slice. Consider a vertical cross-section through the slope, divided into slices of unit thickness perpendicular to the slope face. The total area of karst voids within a slice is expressed as a void density, d, defined as the ratio of the void area to the total area of the slice. This void density modifies the effective resisting area of the slice used in factor of safety (FoS) calculations. The modified FoS is thus computed using a reduced cross-sectional area that reflects the material loss due to karstification. This formulation enables the integration of small-sized structural heterogeneity into classical limit equilibrium frameworks. The generated EPM matrix—incorporating this statistical void representation—is modeled in MATLAB and subsequently exported into RS2 for numerical slope stability analysis. This integration allows for the spatial mapping of mechanical weakening, pore pressure propagation, and yield strain distribution in karst-affected weak rock slopes.
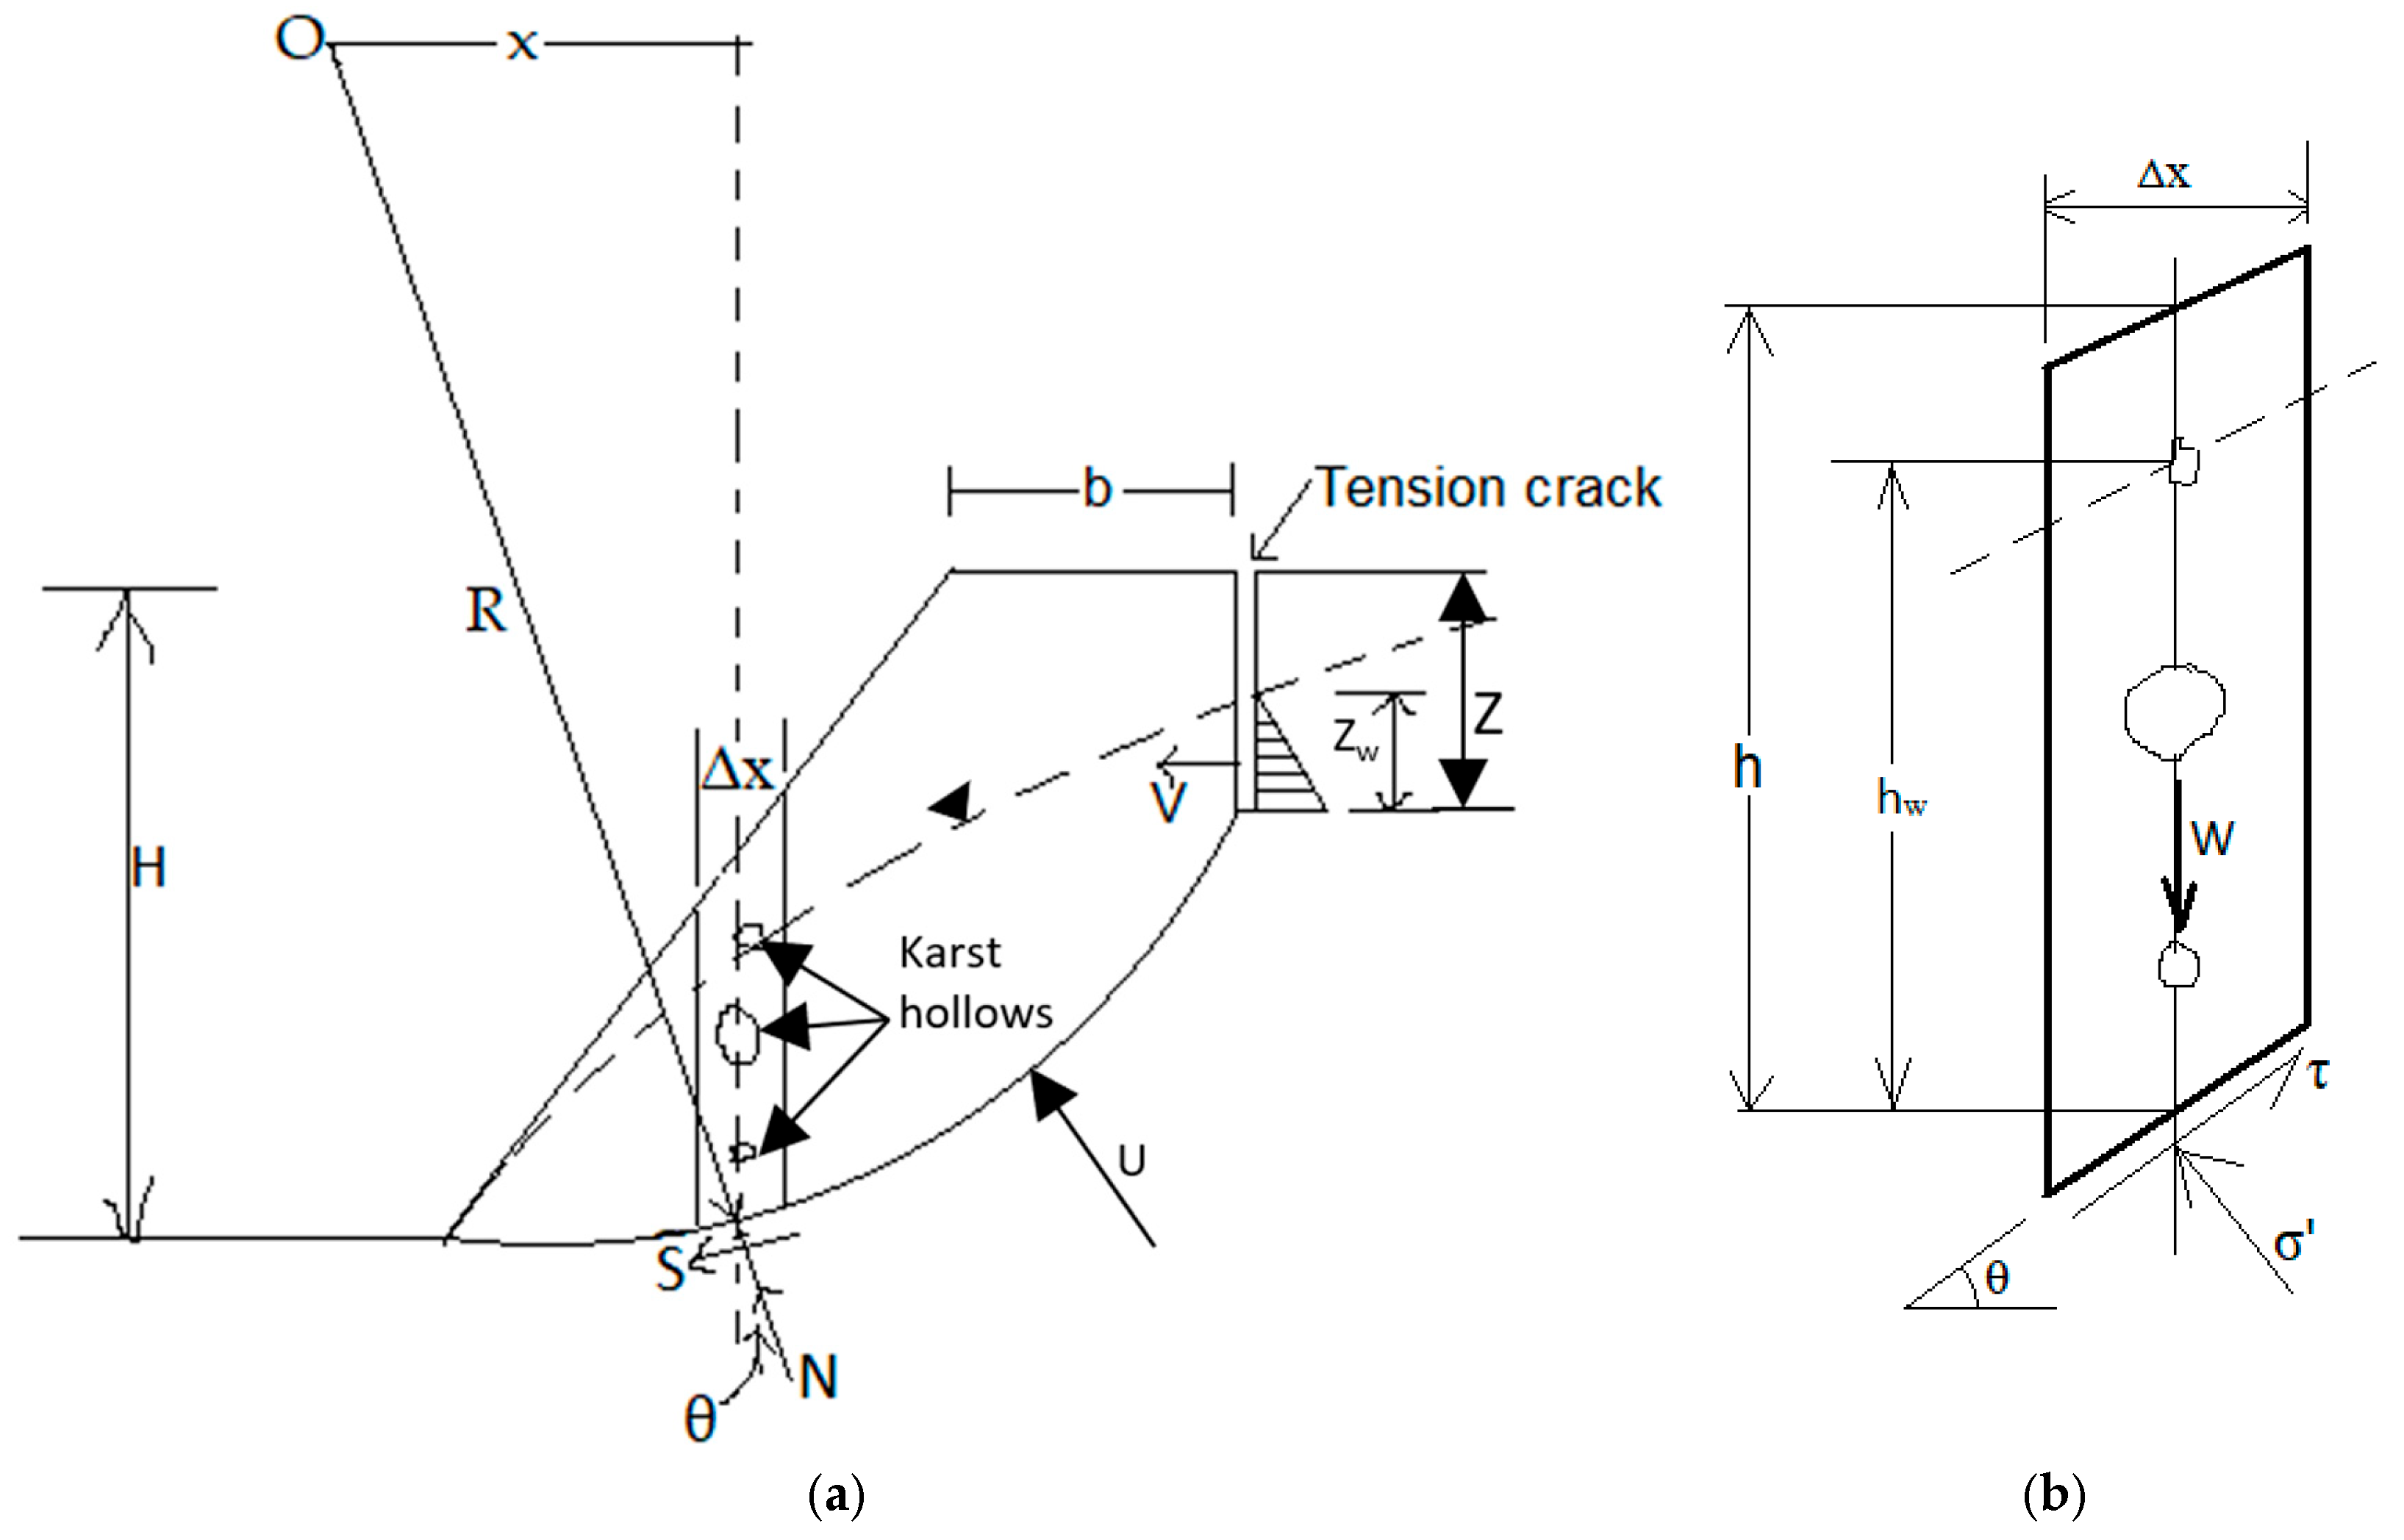
Figure 3 provides a schematic of the modified slice geometry used in this formulation. Consider a slice with unit thickness, taken perpendicular to the slope face. On a vertical section through the slope, the area of the sliding surface can be represented by the height of the surface, and the volume of the sliding block is represented by the cross-sectional area.
Definitions of terms from the slice;
  • O: center of rotation
  • x: distance of the slice from the center of rotation
  • Δx: slice width
  • R: radius of the critical circle
  • Z: depth of tension crack
  • Zw: height of water in the tension crack
  • H: height of slope face
  • h: height of the slice
  • θ: inclination of failure plane
  • W: weight of sliding mass = γr*Ab
  • N: total normal force acting on the base of the slice
  • S: shear force acting on the base of the slice
  • γr: density of rock; γw: density of water
  • σ: total normal stress acting at the bottom of the slice
  • τ: shear stress at the bottom of the slice
  • σ′: effective normal stress at the base of each slice
  • P: weight of water in the karst hollows
  • V: driving force due to water pressure in the tension crack
  • U: uplift force due to water pressure on the sliding surface
The factor of safety (FS) is expressed as a ratio of resisting forces to the driving forces (Equation (1)).
F S = R e s i s t i n g   f o r c e c o h e s i o n + n o r m a l   f o r c e D r i v i n g   f o r c e s h e a r   f o r c e   d u e   t o   b l o c k   w e i g h t
Based on the Mohr–Coulomb equation, the safety factor is the ratio of shear strength available to resist sliding to the shear stress required for equilibrium on the slip surface (Equation (2)).
s h e a r   s t r e n g t h   a v a i l a b l e   t o   r e s i s t   s l i d i n g c + σ t a n s h e a r   s t r e s s   r e q u i r e d   f o r   e q u i l i b r i u m   o n   s l i p   s u r f a c e τ = c . A + N . t a n S
where
  • c: cohesive strength of failure surface
  • : friction angle of the failure surface
  • A: area of sliding plane= slice length*unit slice width = l*Δx/cosθ
  • N: total normal force acting on the base of the slice = Wcosθ
  • S: shear force acting on the base of the slice
Effective normal stress acting on the base of each slice is given as the total normal stress less the uplift water force, driving water force, and pore water pressure (Equation (3)).
F S = [ c A + ( N U V P ) t a n ] τ
where
  • P = γw ∙ d ∙ Ab
  • V = 1/2 ∙ γw ∙ (Zw)2
  • U = ½ ∙ γw ∙ Zw ∙ A
  • τ-shear stress at the bottom of the slice
The shear stress is then expressed as in Equation (4):
τ = 1 F S · c A + N U V P t a n
Shear forces acting on the base of the slice.
S = τ l h
For equilibrium, the sliding moment = the resisting moment. Thus
W x = S R = τ h R
W x = h . R F S · c + N U V P t a n
h R W x · c + N U V P t a n R x = 1 s i n θ
F S = [ c A + ( W c o s θ U V s i n θ P ) t a n ] W s i n θ + V c o s θ + P
The preceding Equations (1)–(7) have been adapted from Bishop’s slip circle method [33]. The subsequent equations up to Equation (14) are a modification by the authors to accommodate the karst cavities in the slice.
For a slice with cavities and known hole density, d:
  • A′ = (1 − d)A: effective area of the sliding plane
  • D = void density = (Total hollow area)/(Slice area)
  • sub>∙ Ab′ = (1 − d)Ab: effective area of the sliding block
  • Ab = l ∙ h = h ∙ Δx/cosθ
The effective forces acting on the slice with karst hollows are:
  • U′ = 1/2 γwZwA′
  • V′ = 1/2 γw (Zw)2d
  • P′ = γwdAb
  • W′ = γrAb (1 − d)
The Factor of Safety then becomes:
F S = c A + [ W c o s θ U V s i n θ P ] t a n W s i n θ + V c o s θ + P
For a dry slope (U = V = P = 0):
F S = [ c A + W c o s θ t a n ] W s i n θ
Elements of the equation for Hoek–Brown material:
c i = 6 . a . m b ( s + m b . σ 3 n ) 1 1 2 1 + a 2 + a + 6 . a . m b ( s + m b . σ 3 n ) a 1
i = σ c i 1 + 2 . a s + 1 a m b . σ 3 n σ + m b . σ 3 n a 1 1 + a 2 + a 1 + 6 . a . m b s + m b . σ 3 n a 1 1 + a 2 + a
where
  • c i : instantaneous cohesion
  • i : instantaneous friction angle
  • σ 3 n : σ 3 m a x σ c i
  • a : 1 2 + 1 6 e G S I / 15 e 20 / 3
  • s : G S I 100 9 3 D
  • m b : m i . e x p G S I 100 28 14 D
  • GSI: Geological Strength Index
  • D: disturbance factor
The factor of Safety for a non-linear failure criterion becomes:
F S = c i A + [ W c o s θ U V s i n θ P ] t a n i W s i n θ + V c o s θ + P
For a dry slope:
F S = [ c i A + ( W c o s θ t a n i ] W s i n θ
These formulations enable the direct incorporation of small-sized karst voids and their spatial variability into both linear and non-linear slope stability analyses. By integrating void density into the classical and Hoek–Brown limit equilibrium frameworks, the proposed EPM-based approach provides a robust means of quantifying the mechanical weakening effects of distributed cavities. This methodology allows for more realistic simulation of slope behavior in karst-affected weak rock masses, ultimately improving the reliability of stability assessments. The following section details the application of this modeling framework to the Vipingo quarry case study, including parameter selection and model validation.

2. Materials and Methods

2.1. Study Area and Geological Context

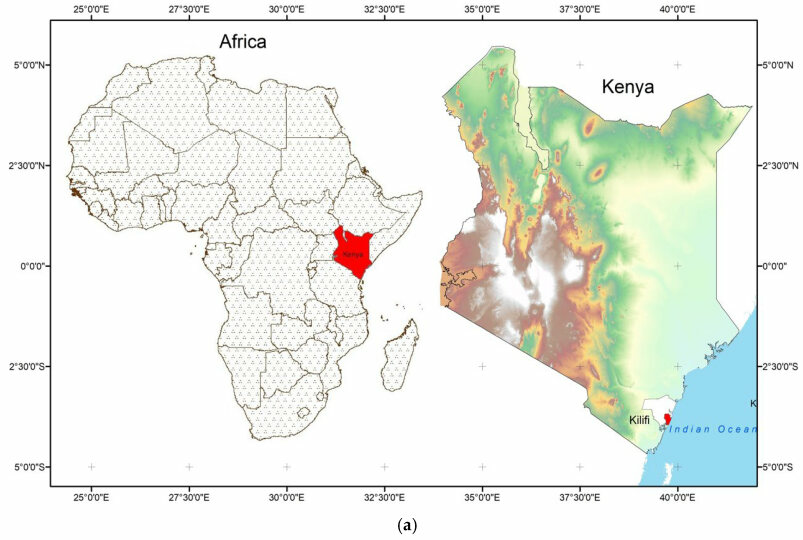
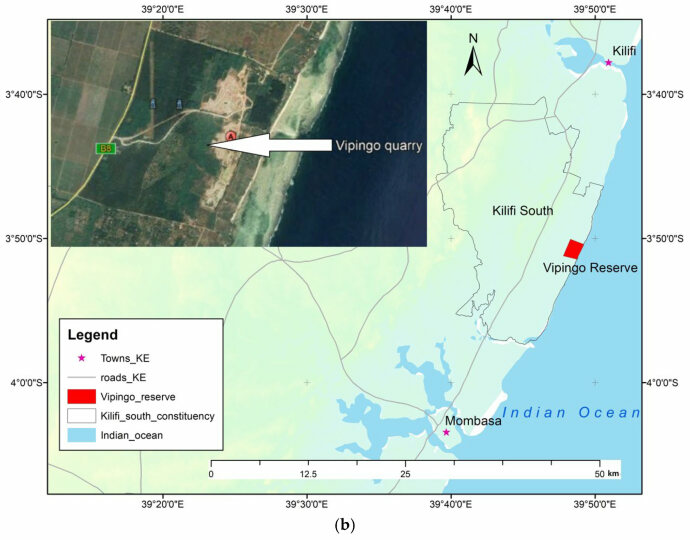
The study is based on field observations and geotechnical data collected from the Vipingo coral limestone quarry, located in the coastal region of Kenya. The site lies in southeast Kenya, within Kilifi County, between latitudes 2° and 4° south and longitudes 39°05′ and 40°14′ east. The quarry itself is situated between latitudes 3°50′03″ and 3°51′27″ south, and longitudes 39°47′47″ and 39°49′08″ east, parallel to the Indian Ocean shoreline. Limestone deposits extend approximately 180 km north-south along the coastal zone from the Tanzania border to the Malindi area, forming a 4–8 km wide band about 70 m thick, running parallel to the coast. Figure 4a shows the geographical location of the Vipingo limestone quarries and reserve land, which extends in a strip nearly 4 km long and about 2 km wide, parallel to and approximately 50 m from the shoreline (Figure 4b). The topography is generally flat at an elevation of 12–20 m above the groundwater level. Most of the area is underlain by coral limestone, a fossil coral reef acquired as a limestone reserve, and is covered by shallow but fertile soil. All rainwater drains naturally through the highly porous coral limestone to the sea.
The Vipingo coralline rock mass formation is of the Pleistocene age. Structurally, there is no distinct bedding or foliation, and joints are not well defined. The rock is visibly highly porous, with a total carbonate content of about 95%. High textural porosity is reflected in density values as low as 0.5 g/cm3 and an in situ average of around 1.5 g/cm3, which also allows for high free silica content. Silica content tends to increase downward toward the base of each coral unit and landward in the shore direction. As a consequence of reef-building mechanisms, which result in high porosity, there is a high content of entrapped silica, and together with aeolian free sands, this increases the variability of the limestone grade. Karstification is evident in some well-defined sections, resulting in distinct voiding and caving.

2.2. Generating the Equivalent Porous Medium

2.2.1. Karst Data Collection

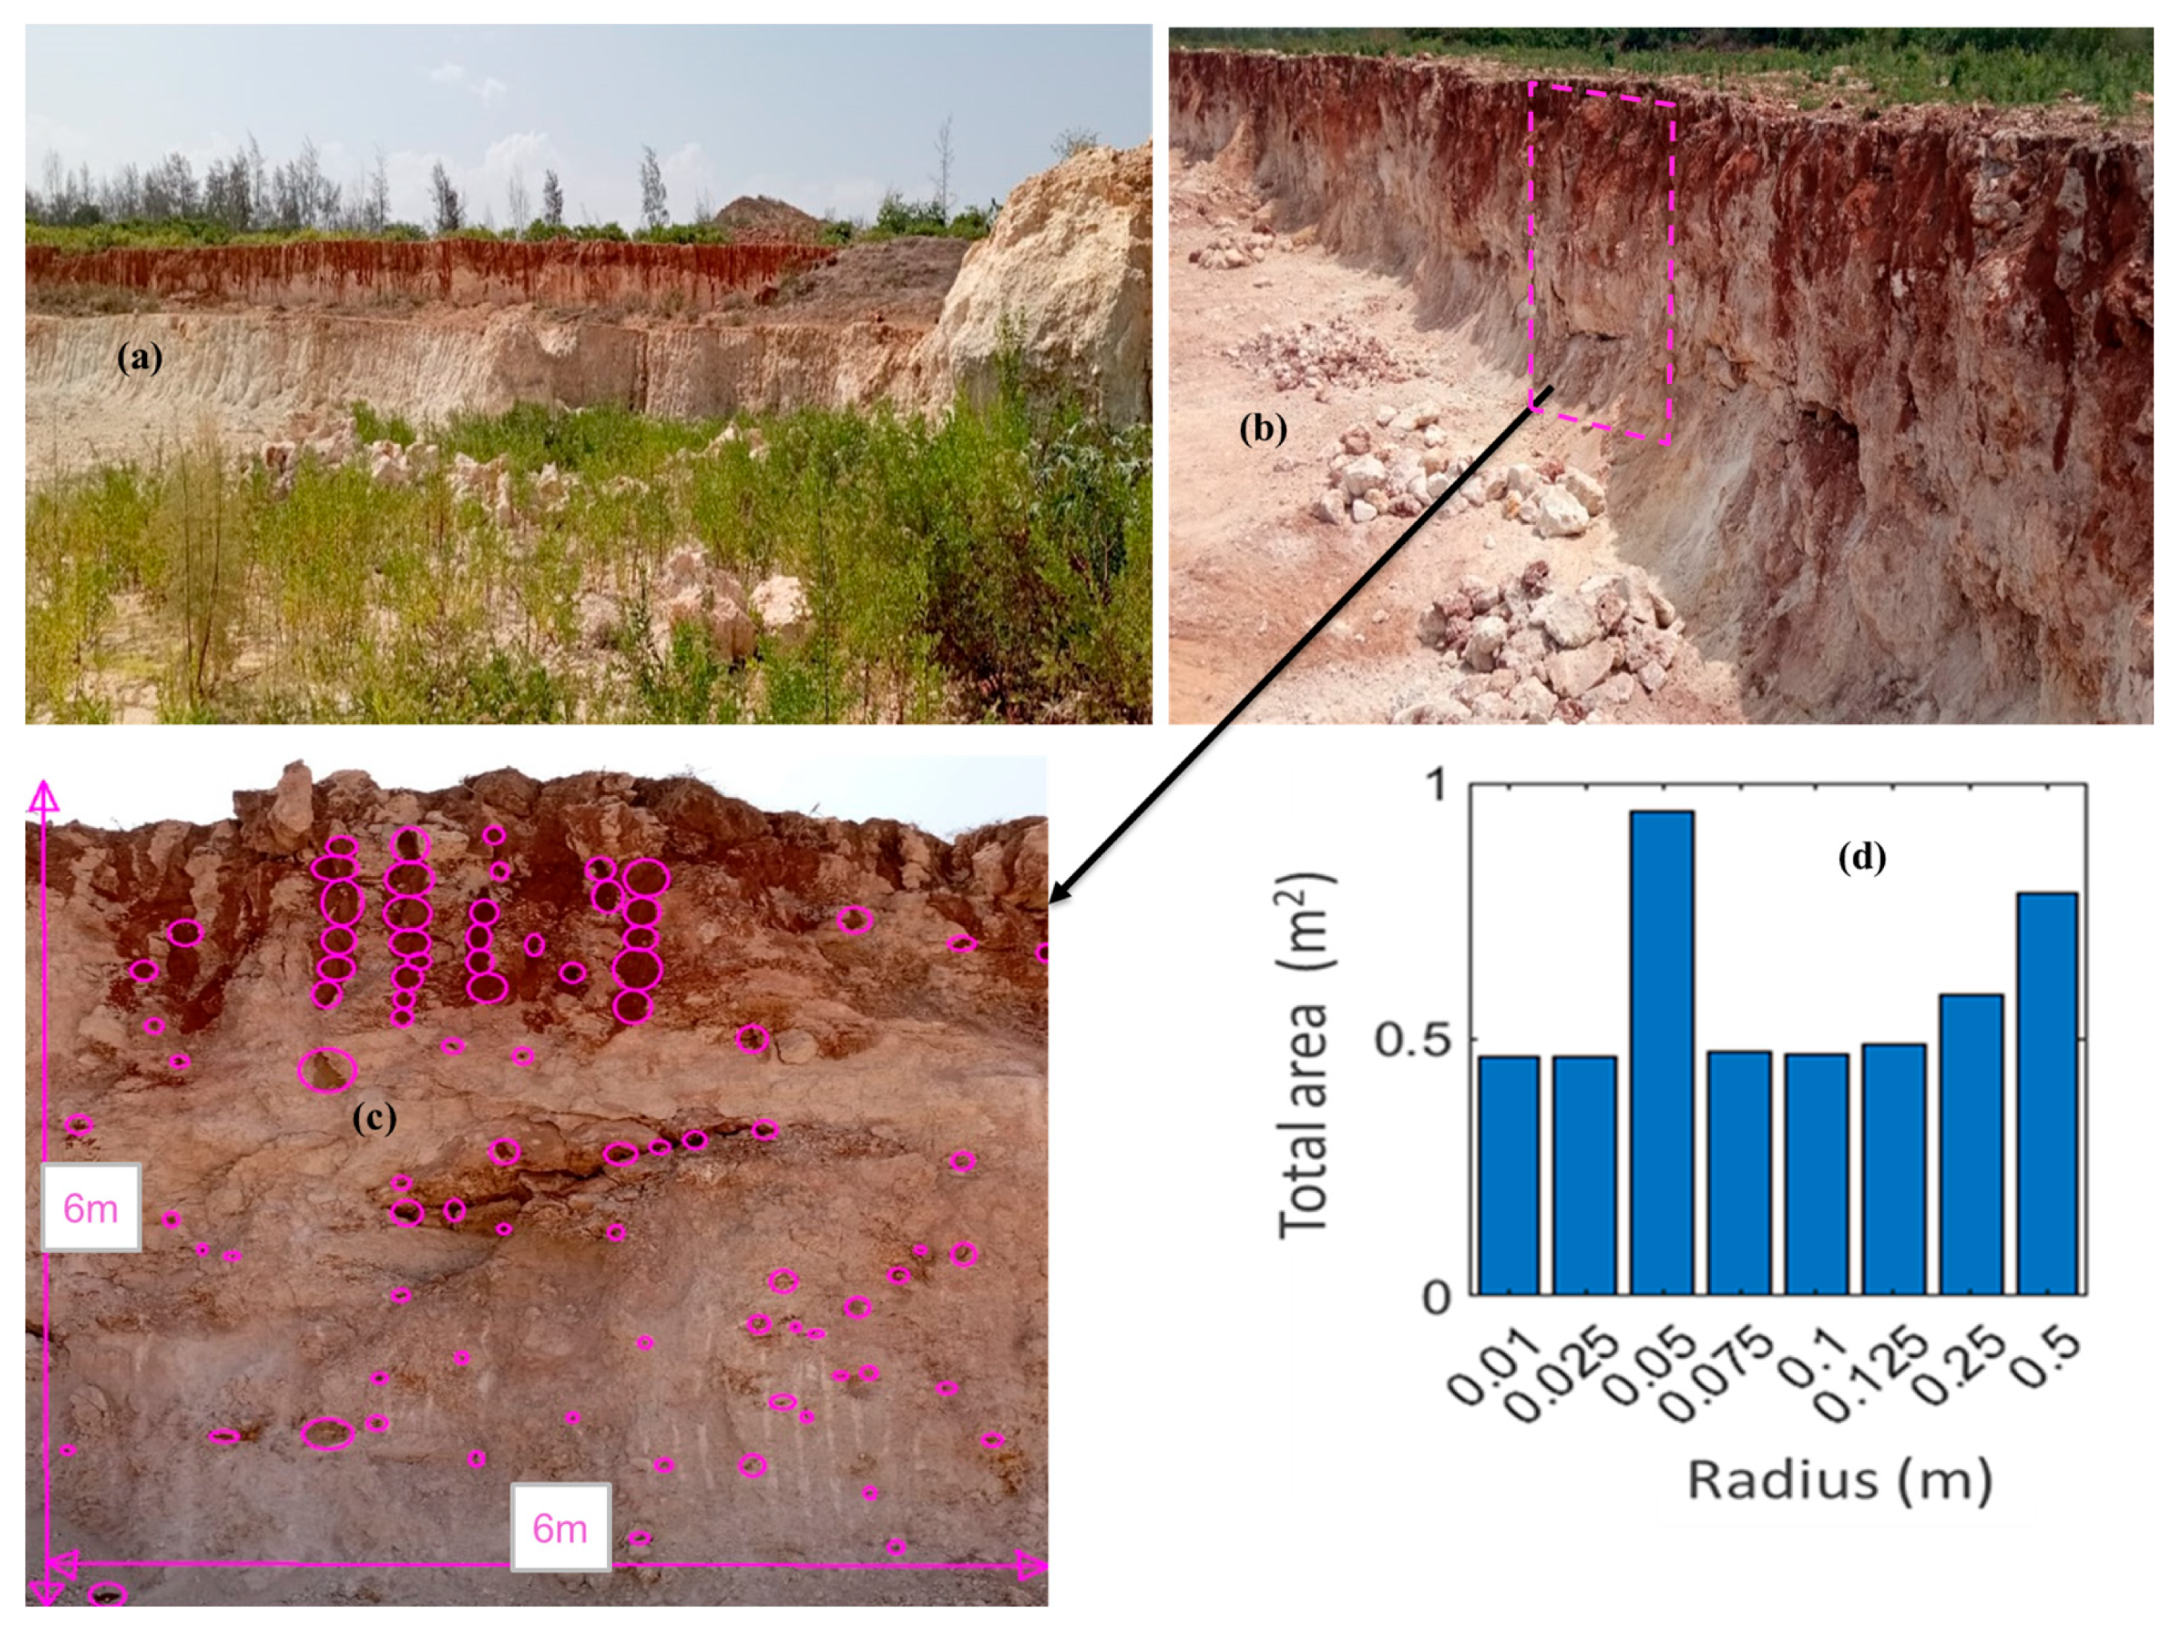
Field data used to characterize karst hollow distribution were obtained through direct observation of the exposed slope face, where the sizes and frequency of karst cavities were recorded. Such information is typically gathered during routine rock mass characterization and classification studies. A large section of the slope was considered for this exercise; Figure 5a,b represent one of the sampled slope portions, with dimensions of 6 m in height (bench height) and 6 m in width.
Karst hollow dimensions were measured using circular cross-sections to represent the equivalent area of each void. This approach is supported by Onyango [32] and Bishop [35] who compared various geometric representations for cavernous limestone porosity characterization and found that rectangles or ellipses offered the least margin of error, though their studies focused on large cave passages. In this study, the concern is with numerous small-sized karst hollows, where the width-to-height ratio is approximately 1 [36]. Elongated karst fissures are modeled as a series of near-circular sections, as modeling them as ellipses or rectangles would introduce greater error at this scale. The equivalent circle diameter is measured across the mid-section of each karst hollow.
The circles in Figure 5c visually represent the distribution of karst hollows, not their actual sizes. True cavity diameters and counts were recorded and used to compute the total area occupied by voids. A MATLAB-based parametric simulation was used to reflect the field-derived range of karst hollow sizes, from 1 cm to 0.5 m in radius. The simulation treated irregular karst features as discrete circular hollows, with elongated cavities modeled as interconnected circles. The script calculated the area of each cavity, grouped them by radius, and summed the total area per size class. These data were used to generate the bar plot in Figure 5d, showing the cumulative area contribution by cavity size. At the uppermost slope sections, traces of soil trapped in finer rock pores appear as elongated cavities but are represented as a series of joined hollows.
The equivalent porous medium is generated based on the density, d, and size distribution of the karst hollows. With the sampling area defined by length and width, the hole density is given by Equation (15).
d = T o t a l   a r e a   o f   k a r s t   h o l l o w s A r e a   o f   s u r f a c e   u n d e r   c o n s i d e r a t i o n = A h A s
The area covered by karst hollows was quantified for each representative diameter range, and the density was computed accordingly using Equation (15). Table 1 presents sample values of karst hollow density from different slope sections of similar dimensions, reflecting local variability in karstification along the slope face.

2.2.2. Generating the EPM Matrix in MATLAB

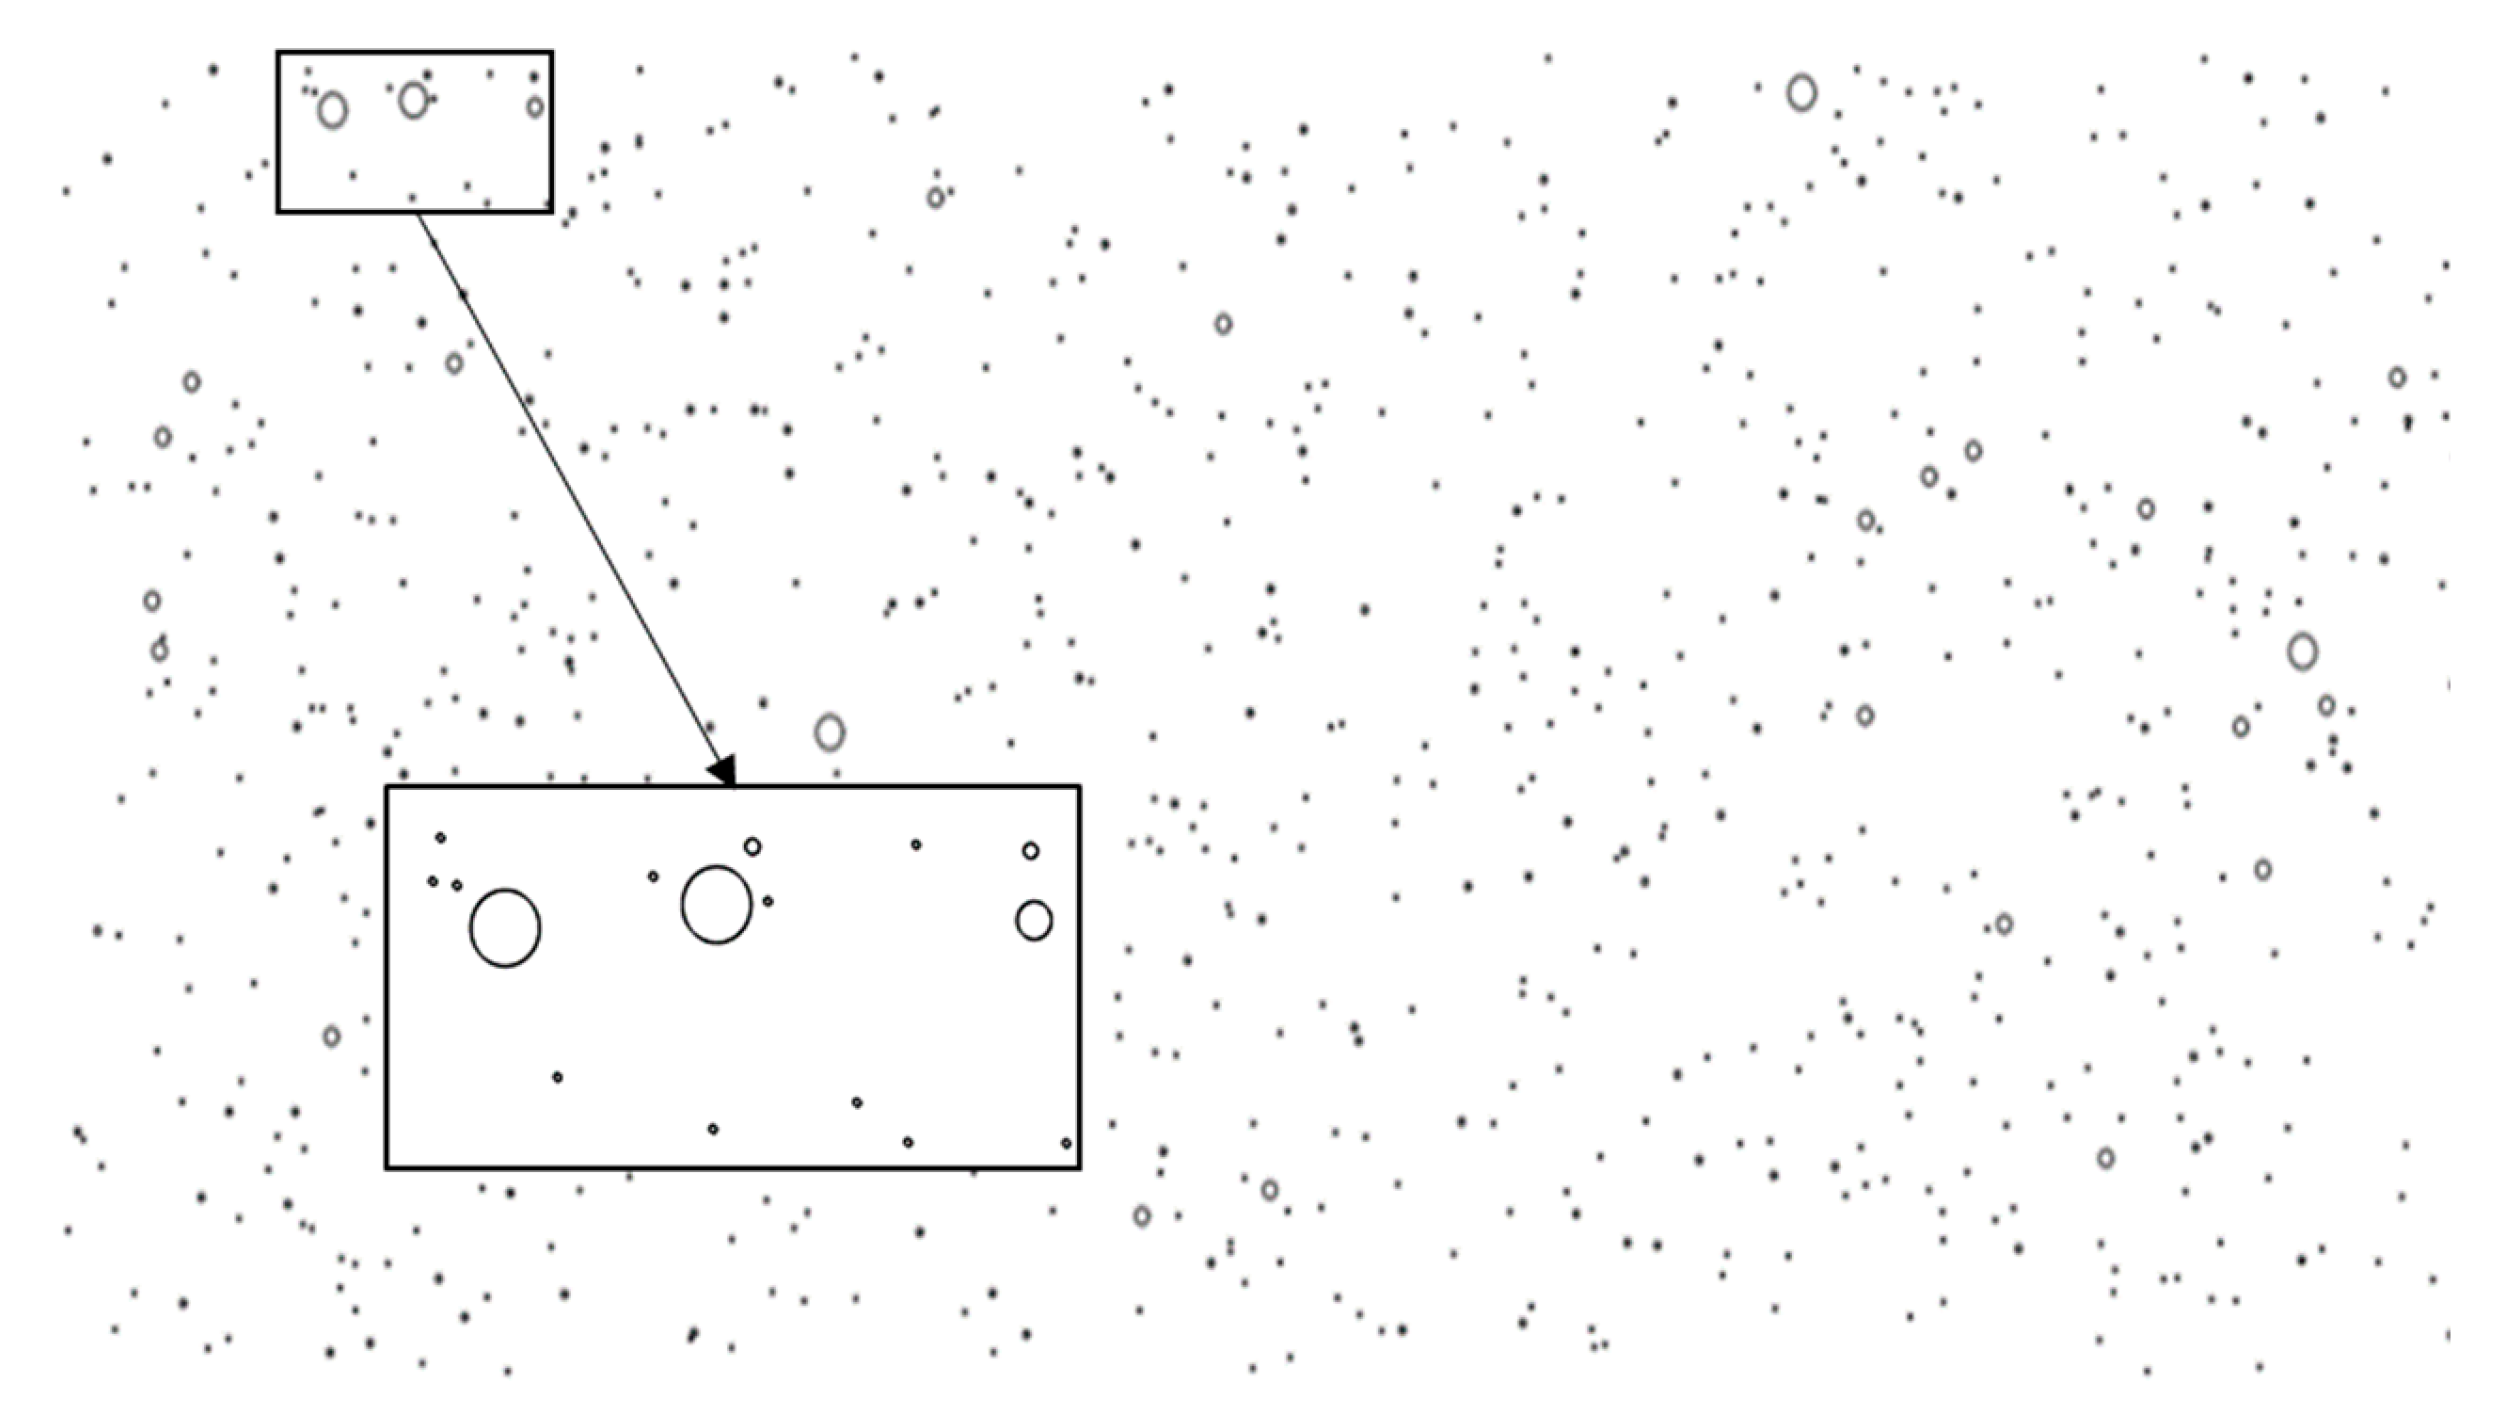
Karst voids were modeled as circular features with diameters randomly sampled from a predefined distribution derived from field data. A MATLAB script was developed to generate voids within a 2D matrix domain representing a slope section, randomly distribute void centers, and allow user-defined control of void density and size range. The 2D matrix geometry and material zones were then exported in a DXF-compatible format for input into RS2. MATLAB’s random number generator function, Bubblebath, was used to generate the equivalent geometry of the karst matrix. Input parameters included the external boundary dimensions, hole density, and hole size distribution. The script outputs the karst matrix (Figure 6) as a DXF file. The inset image shows a zoomed-in section of the circular geometries output in the DXF file.
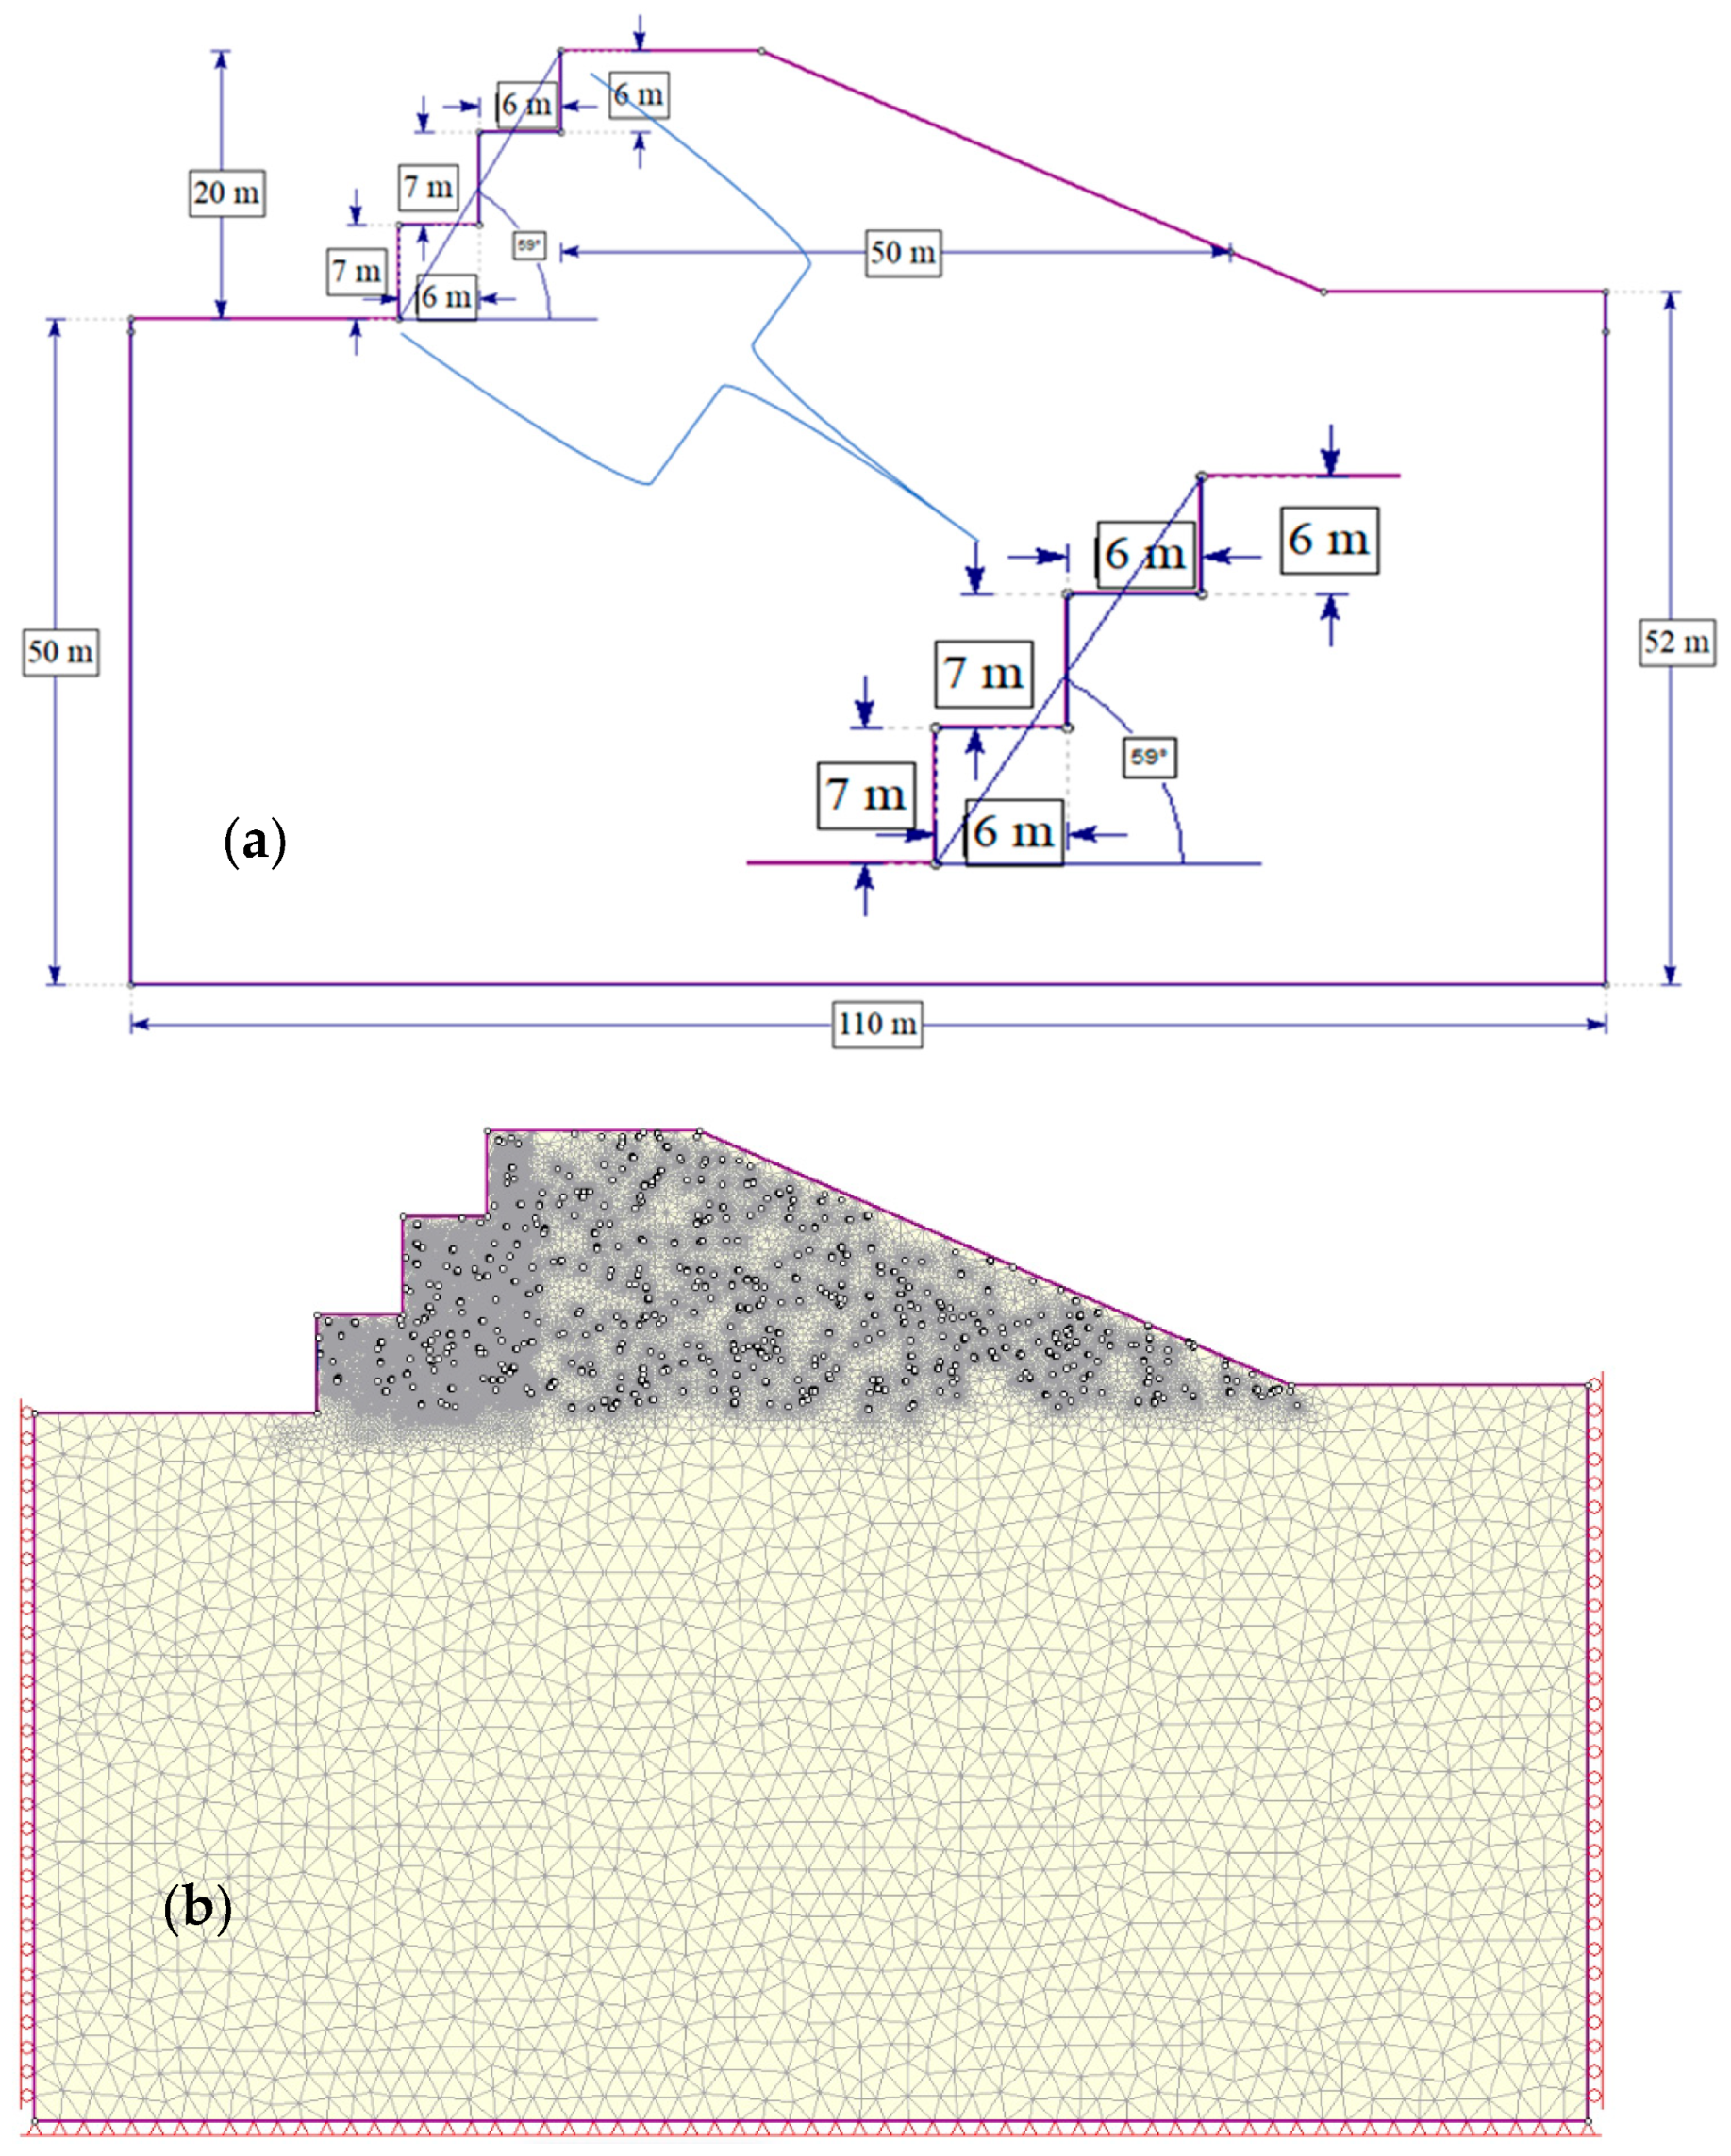
Once the DXF file of the slope matrix is generated, it is imported into RS2 software, where slope geometry and material boundaries are defined. RS2 interprets circular geometries by approximating them with multiple arc segments, resulting in a large number of vertices. This geometric complexity increases computational demand, particularly during mesh generation and solver iteration. To reduce model bulkiness while preserving mechanical fidelity, the geometry is simplified by reducing the number of vertices to approximately 5% of the original count (Figure 7 (inset)), leaving a cross-section that may not be perfectly circular but preserves the area, and thus the mechanical influence of the void. This simplification ensures that stress distribution and factor of safety remain within acceptable deviation from the fully resolved model. The following assumptions underpin the implementation of the EPM approach:
(i)
Major caves or large karst features have already been identified through prior mapping and are modeled explicitly if necessary;
(ii)
All voids are assumed to be unfilled (air-filled, with no internal support);
(iii)
The analysis focuses on the void area, not the precise shape, assuming that mechanical effects are area-dominant at the scale of interest.
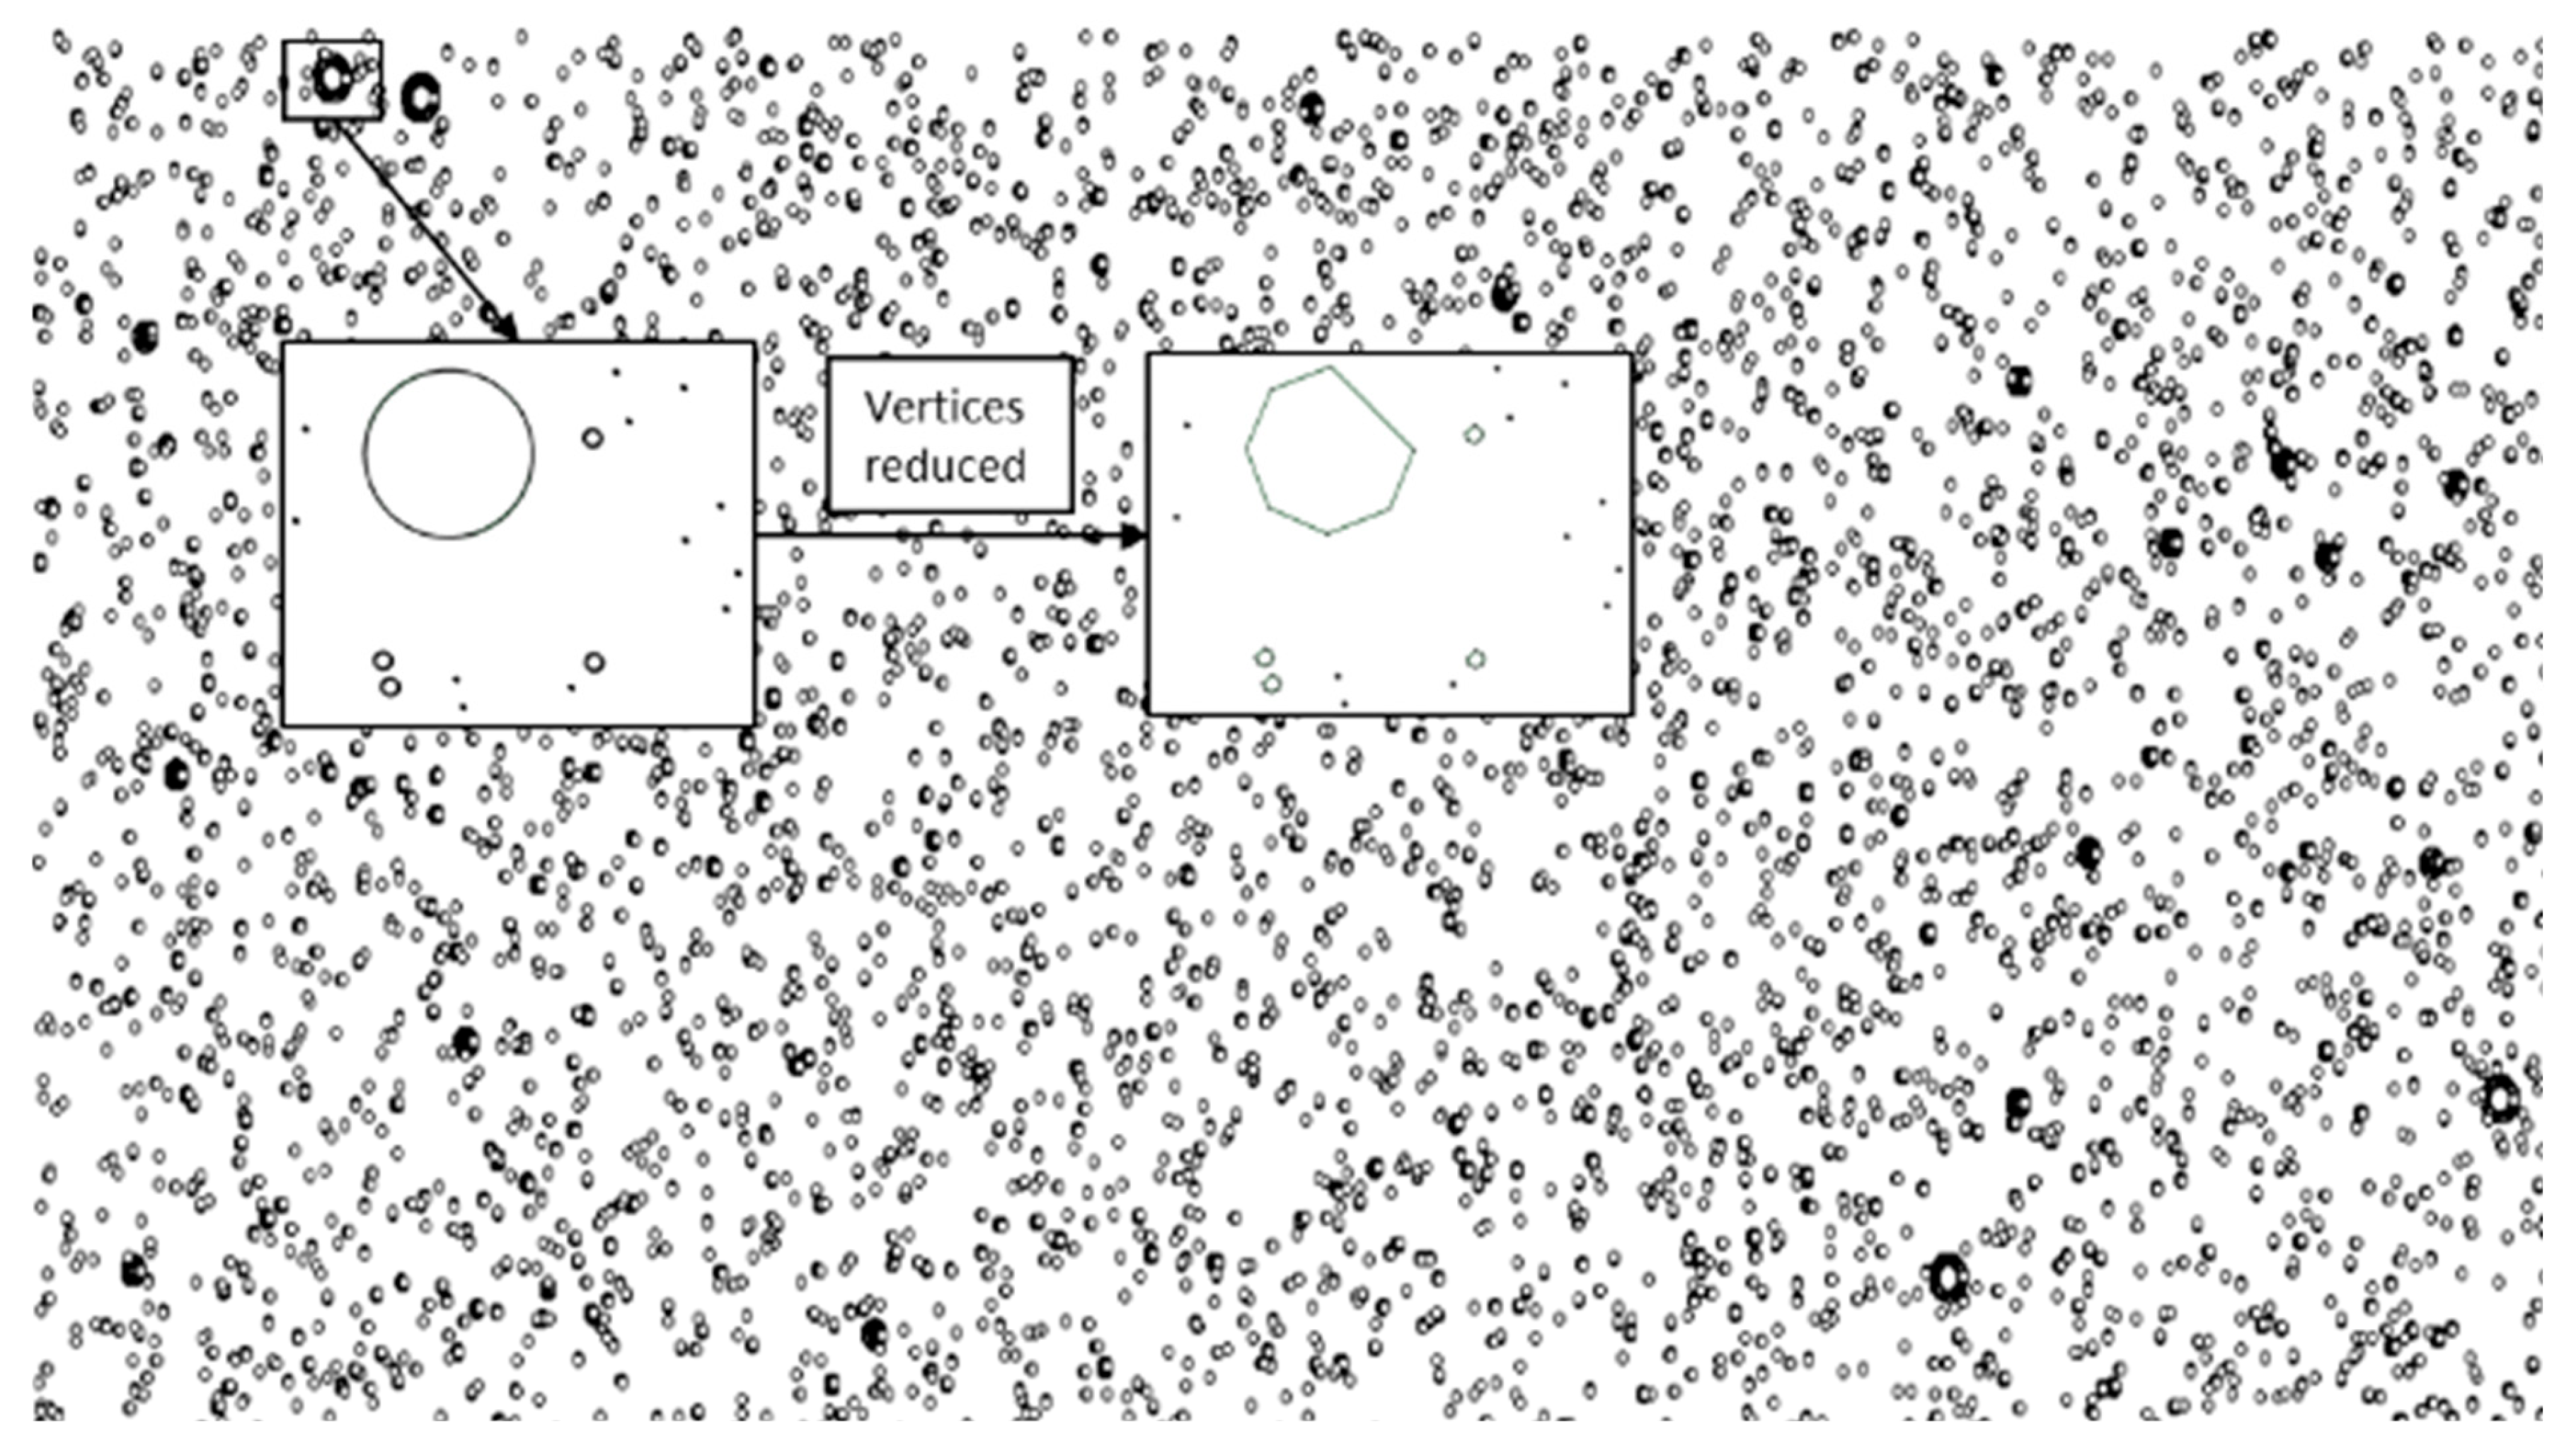
Figure 7. The appearance of the karst hollows matrix upon importing into RS2.
Modelling 06 00081 g007
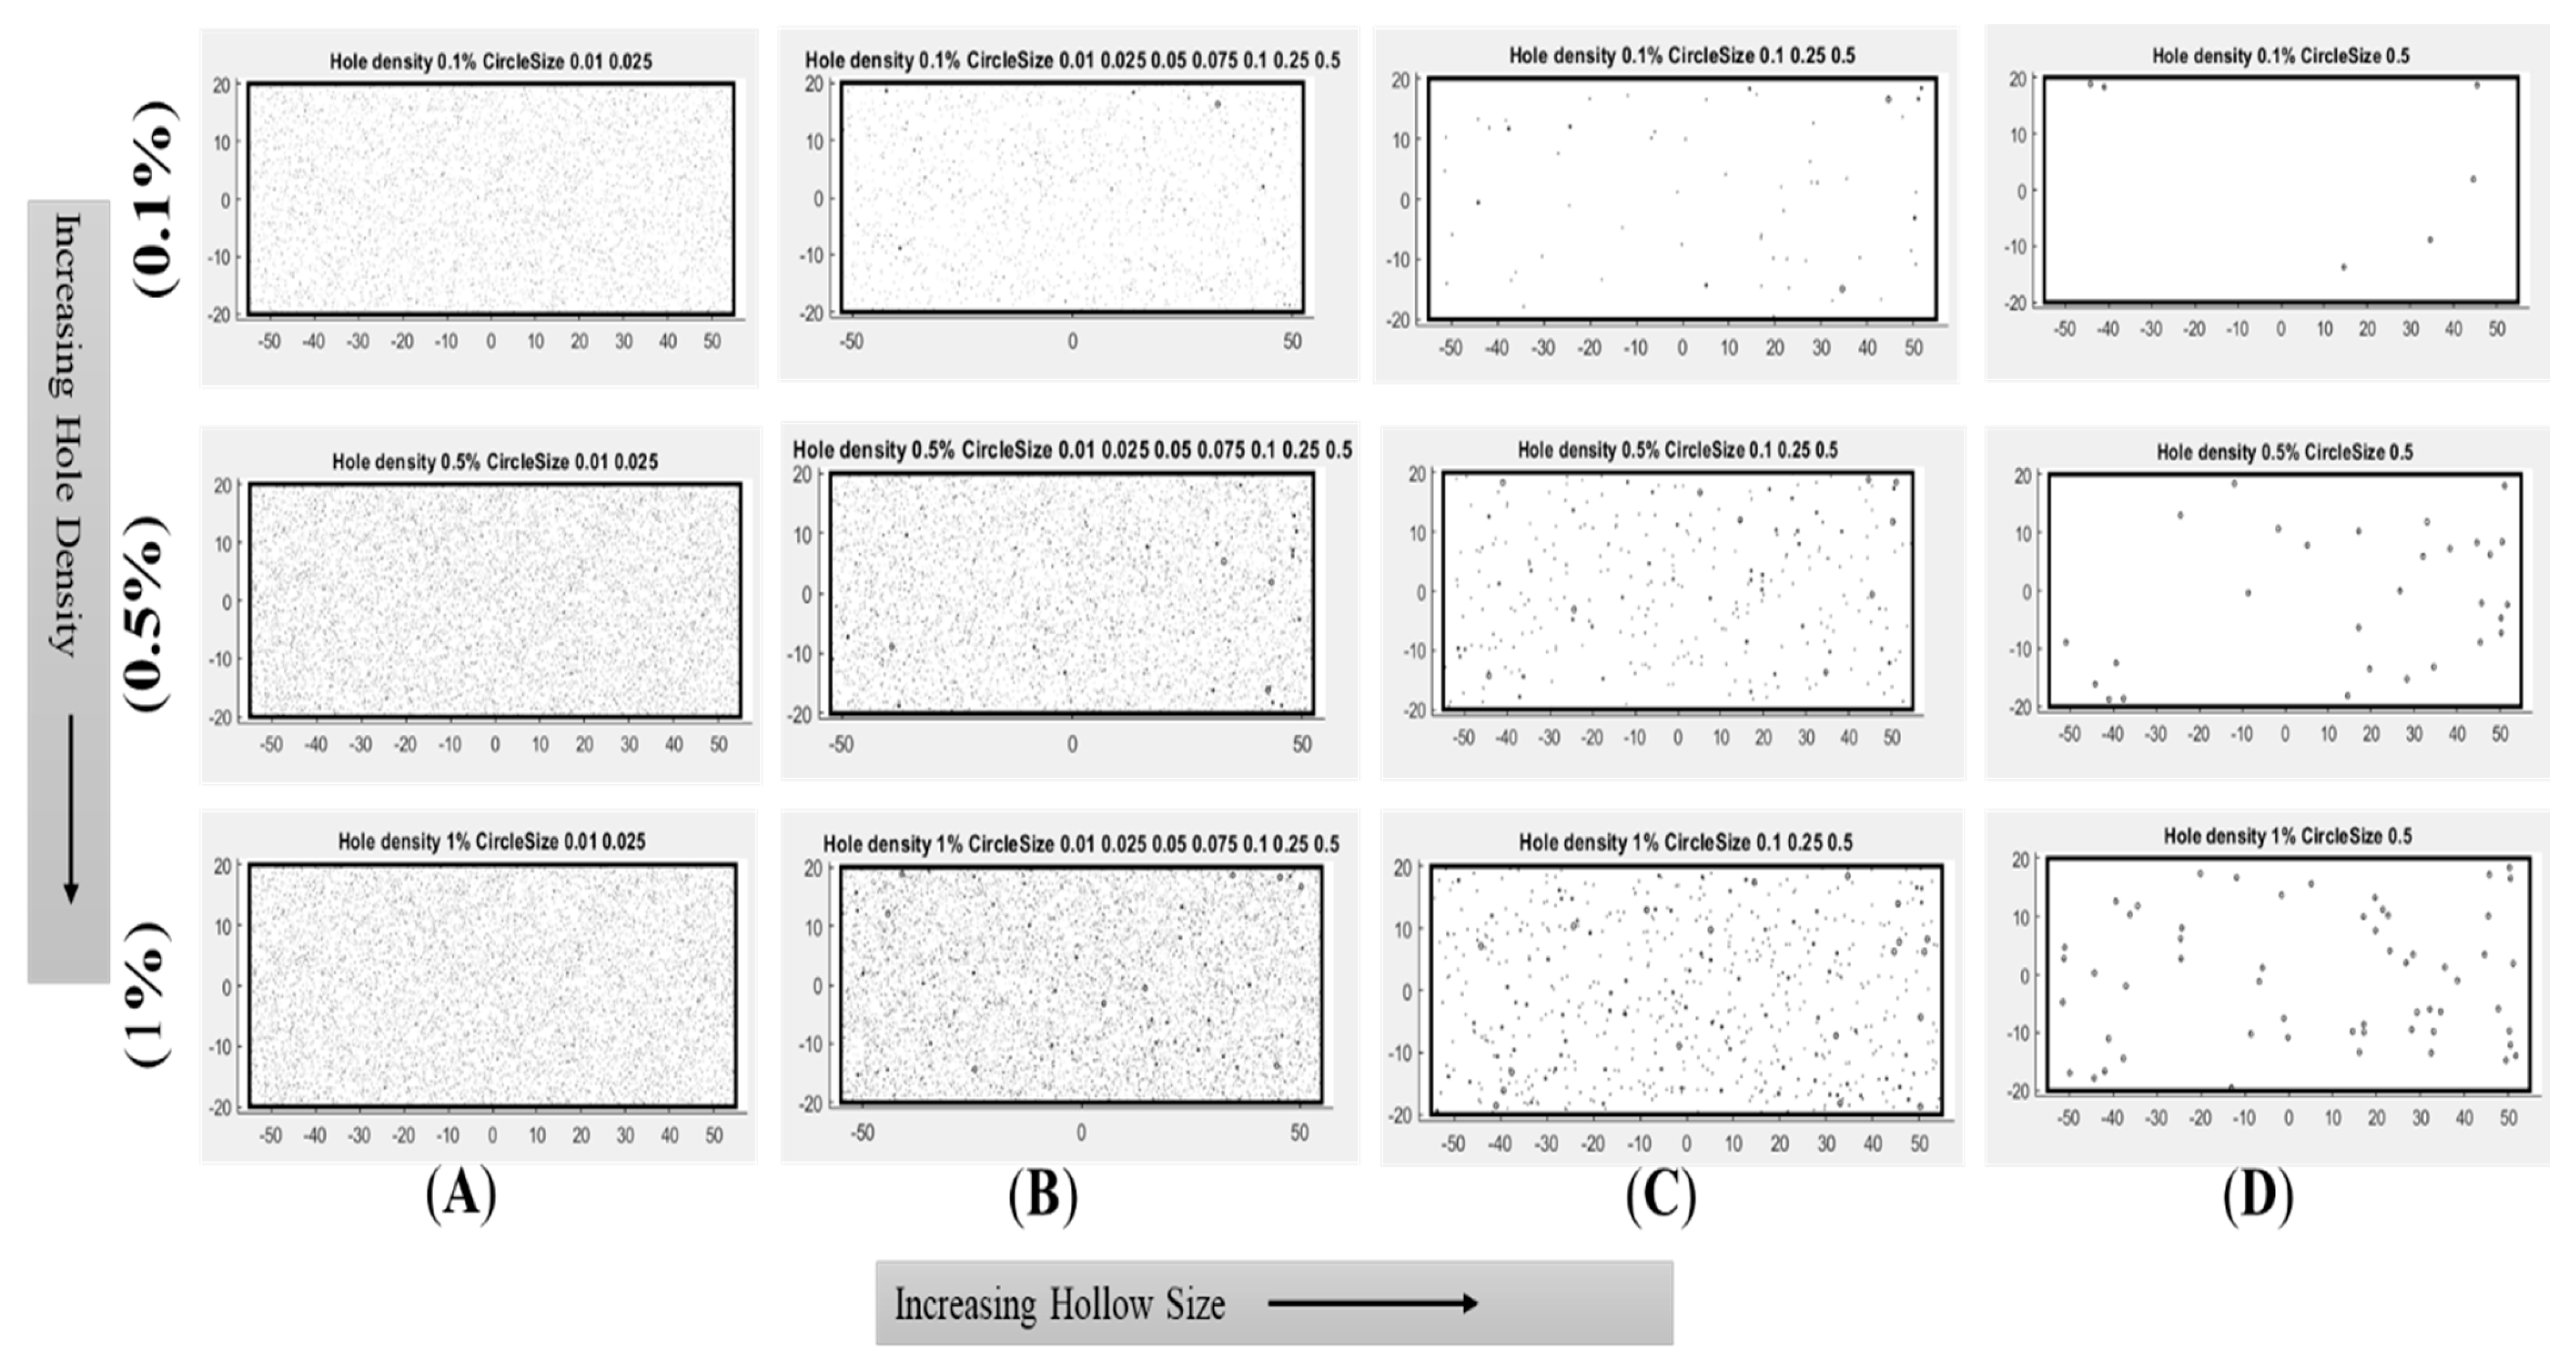
The influence of karst hollow size and distribution on slope stability was evaluated by varying both the radius and spatial density of voids. Four configurations (sets A–D) were defined based on hollow dimensions:
Set A (small-sized features): radii of 0.01 m and 0.025 m;
Set B (broad spectrum): radii of 0.01 m, 0.025 m,0.05 m, 0.075 m, 0.1 m, 0.25 m, and 0.5 m;
Set C (medium-to-large features): radii of 0.1 m, 0.25 m, and 0.5 m;
Set D (singular large voids): radius of 0.5 m
For each set, three void density scenarios were modeled: 0.1%, 0.5%, and 1%. These densities encompass the typical range observed in field sections (see Table 1), with 0.1% representing average conditions and 1% capturing upper-bound cases. They also ensure computational tractability in RS2; attempts to simulate densities exceeding 1% led to meshing difficulties and convergence instability. The chosen range thus balances physical realism and numerical stability. The four sets of karst matrix distribution are presented in Figure 8, arranged by increasing void density (vertical arrow) and size (horizontal arrow).
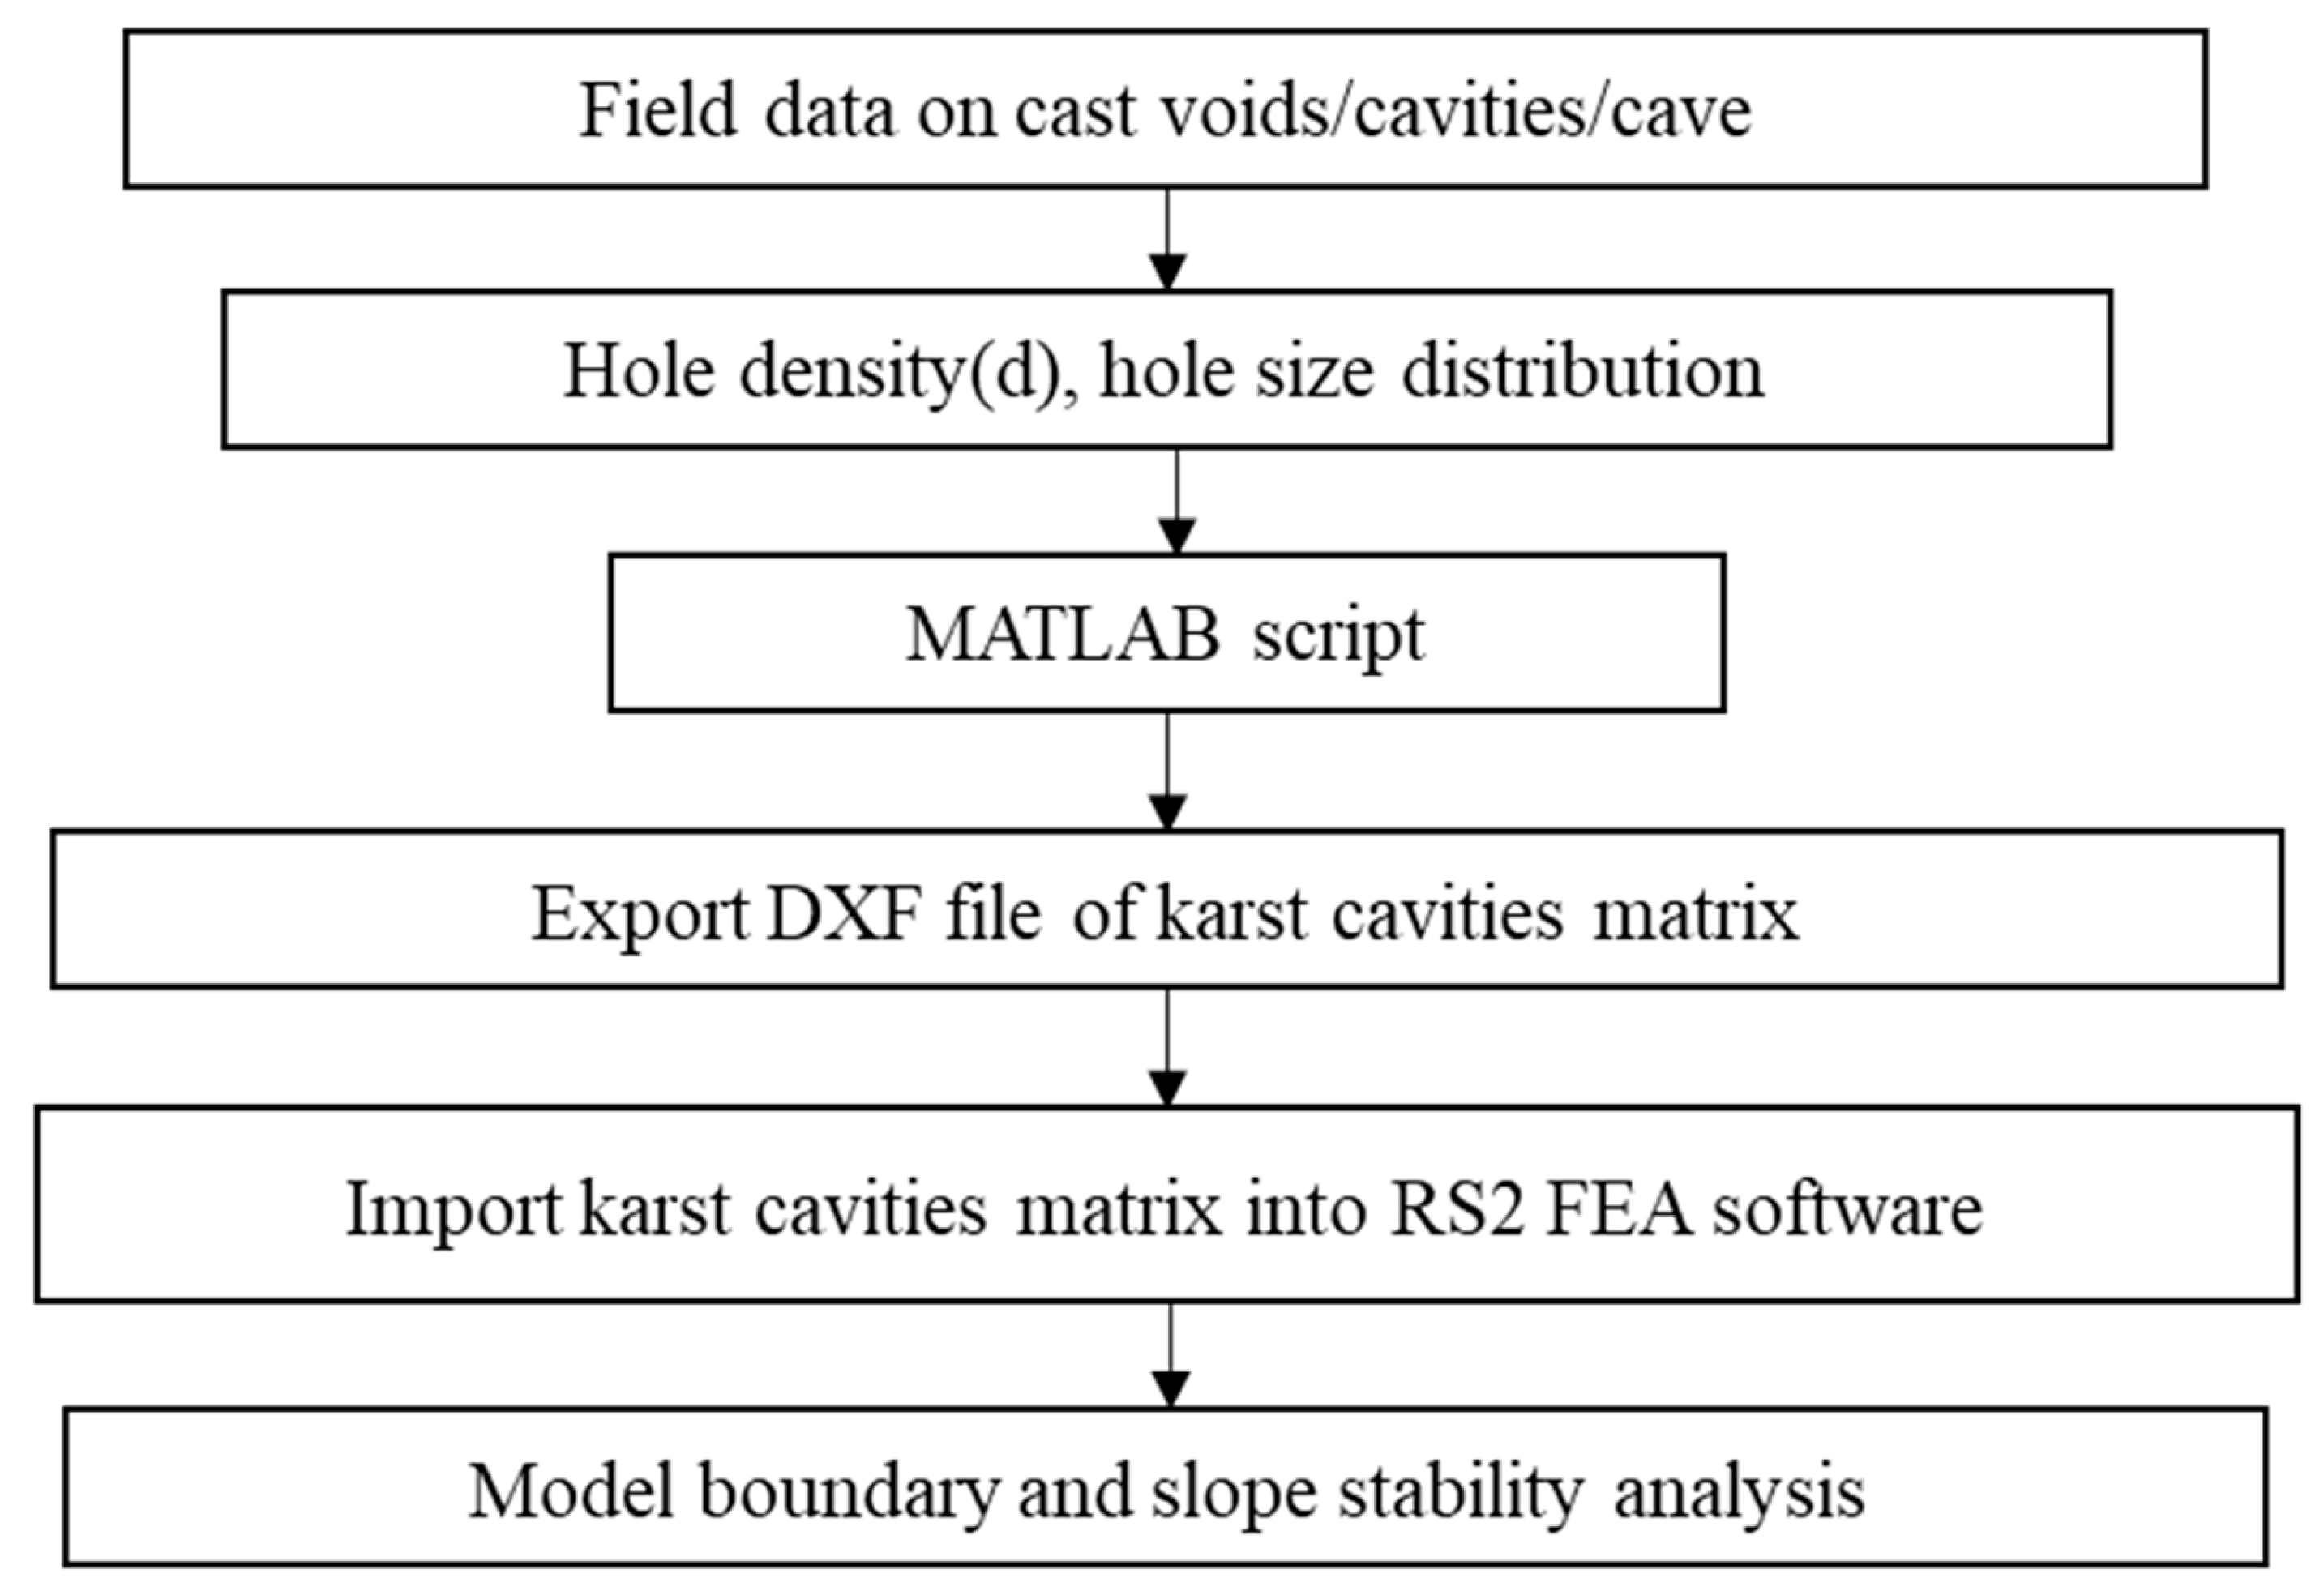
Figure 9 illustrates the process flow for developing the EPM, from data collection to integration of the karst matrix into the RS2 geotechnical model for slope stability analysis.

2.3. Model Setup in RS2

Finite element numerical analysis using RS2 software was employed in this study. A plane strain 2D model of the slope adequately represents the slope condition with the karst matrix. Figure 10a shows the 2D model of the slope in Figure 5, whereas Figure 10b shows the slope model with the karst matrix geometry added. To reduce model bulkiness and computation time, the karst matrix is only modeled on the already excavated section of the slope.
The numerical analysis domain is 100 m in length and 70 m in height. A pit depth of 20 m was modeled, corresponding to the final pit depth. The overall slope angle is 59°, with vertical benches modeled at 90°. The mesh comprises graded 3-noded triangles, with 200 default external nodes. Mesh density near the slope face was increased to effectively capture small strains. Boundary conditions restrain the sides in the X-direction and fix the bottom in both X and Y directions, while the top, including bench faces, remains free. Voids were not assigned material properties; the remaining intact rock mass was assigned geotechnical properties based on laboratory testing and literature for similar coral limestones.

2.4. Material Properties and Parameters

The analysis considers a homogeneous slope section with properties listed in Table 2. The Hoek–Brown criterion was used to simulate deformations in weak rock masses.

2.5. Seepage Modeling

To simulate the effect of groundwater seepage, steady-state flow analyses were coupled with the mechanical model in RS2. A piezometric surface was defined along the slope crest, and material permeability was assigned based on typical limestone values (10−5 to 10−7 m/s). Karst void zones were assigned higher permeability values (10−3 m/s) to simulate preferential flow paths. Analyses were performed for both dry and seepage-affected slope conditions. The effective stress condition was activated to account for pore pressure reduction in shear strength.

2.6. Simulation and Failure Evaluation

RS2 records displacements and velocities during finite element analysis. Figure 11 illustrates how slope stability is inferred from stress analysis: increasing displacements and velocities indicate instability, while steady displacements and decreasing velocities indicate stability (Figure 11a). Constant velocity and displacement fields indicate failure (Figure 11b,c). Plasticity is examined by failure state indicators, where failure is either in tension or shear (Figure 11d).
Stress trajectories, placed at every finite element node, display the principal stress directions: a long line for σ1 and a short line for σ3 [38]. Failure trajectories indicate potential failure plane orientations at each mesh node. Shear failure is shown by intersecting lines oriented with respect to principal stress directions; tensile failure is indicated by a single line perpendicular to the direction of maximum tensile stress. Failure trajectories do not necessarily indicate actual failure, but rather potential failure planes for the current stress state. Yielded elements show the locations of failure and are only displayed for Mohr–Coulomb or Hoek–Brown materials.

2.7. Interpretation of RS2 Analysis Results

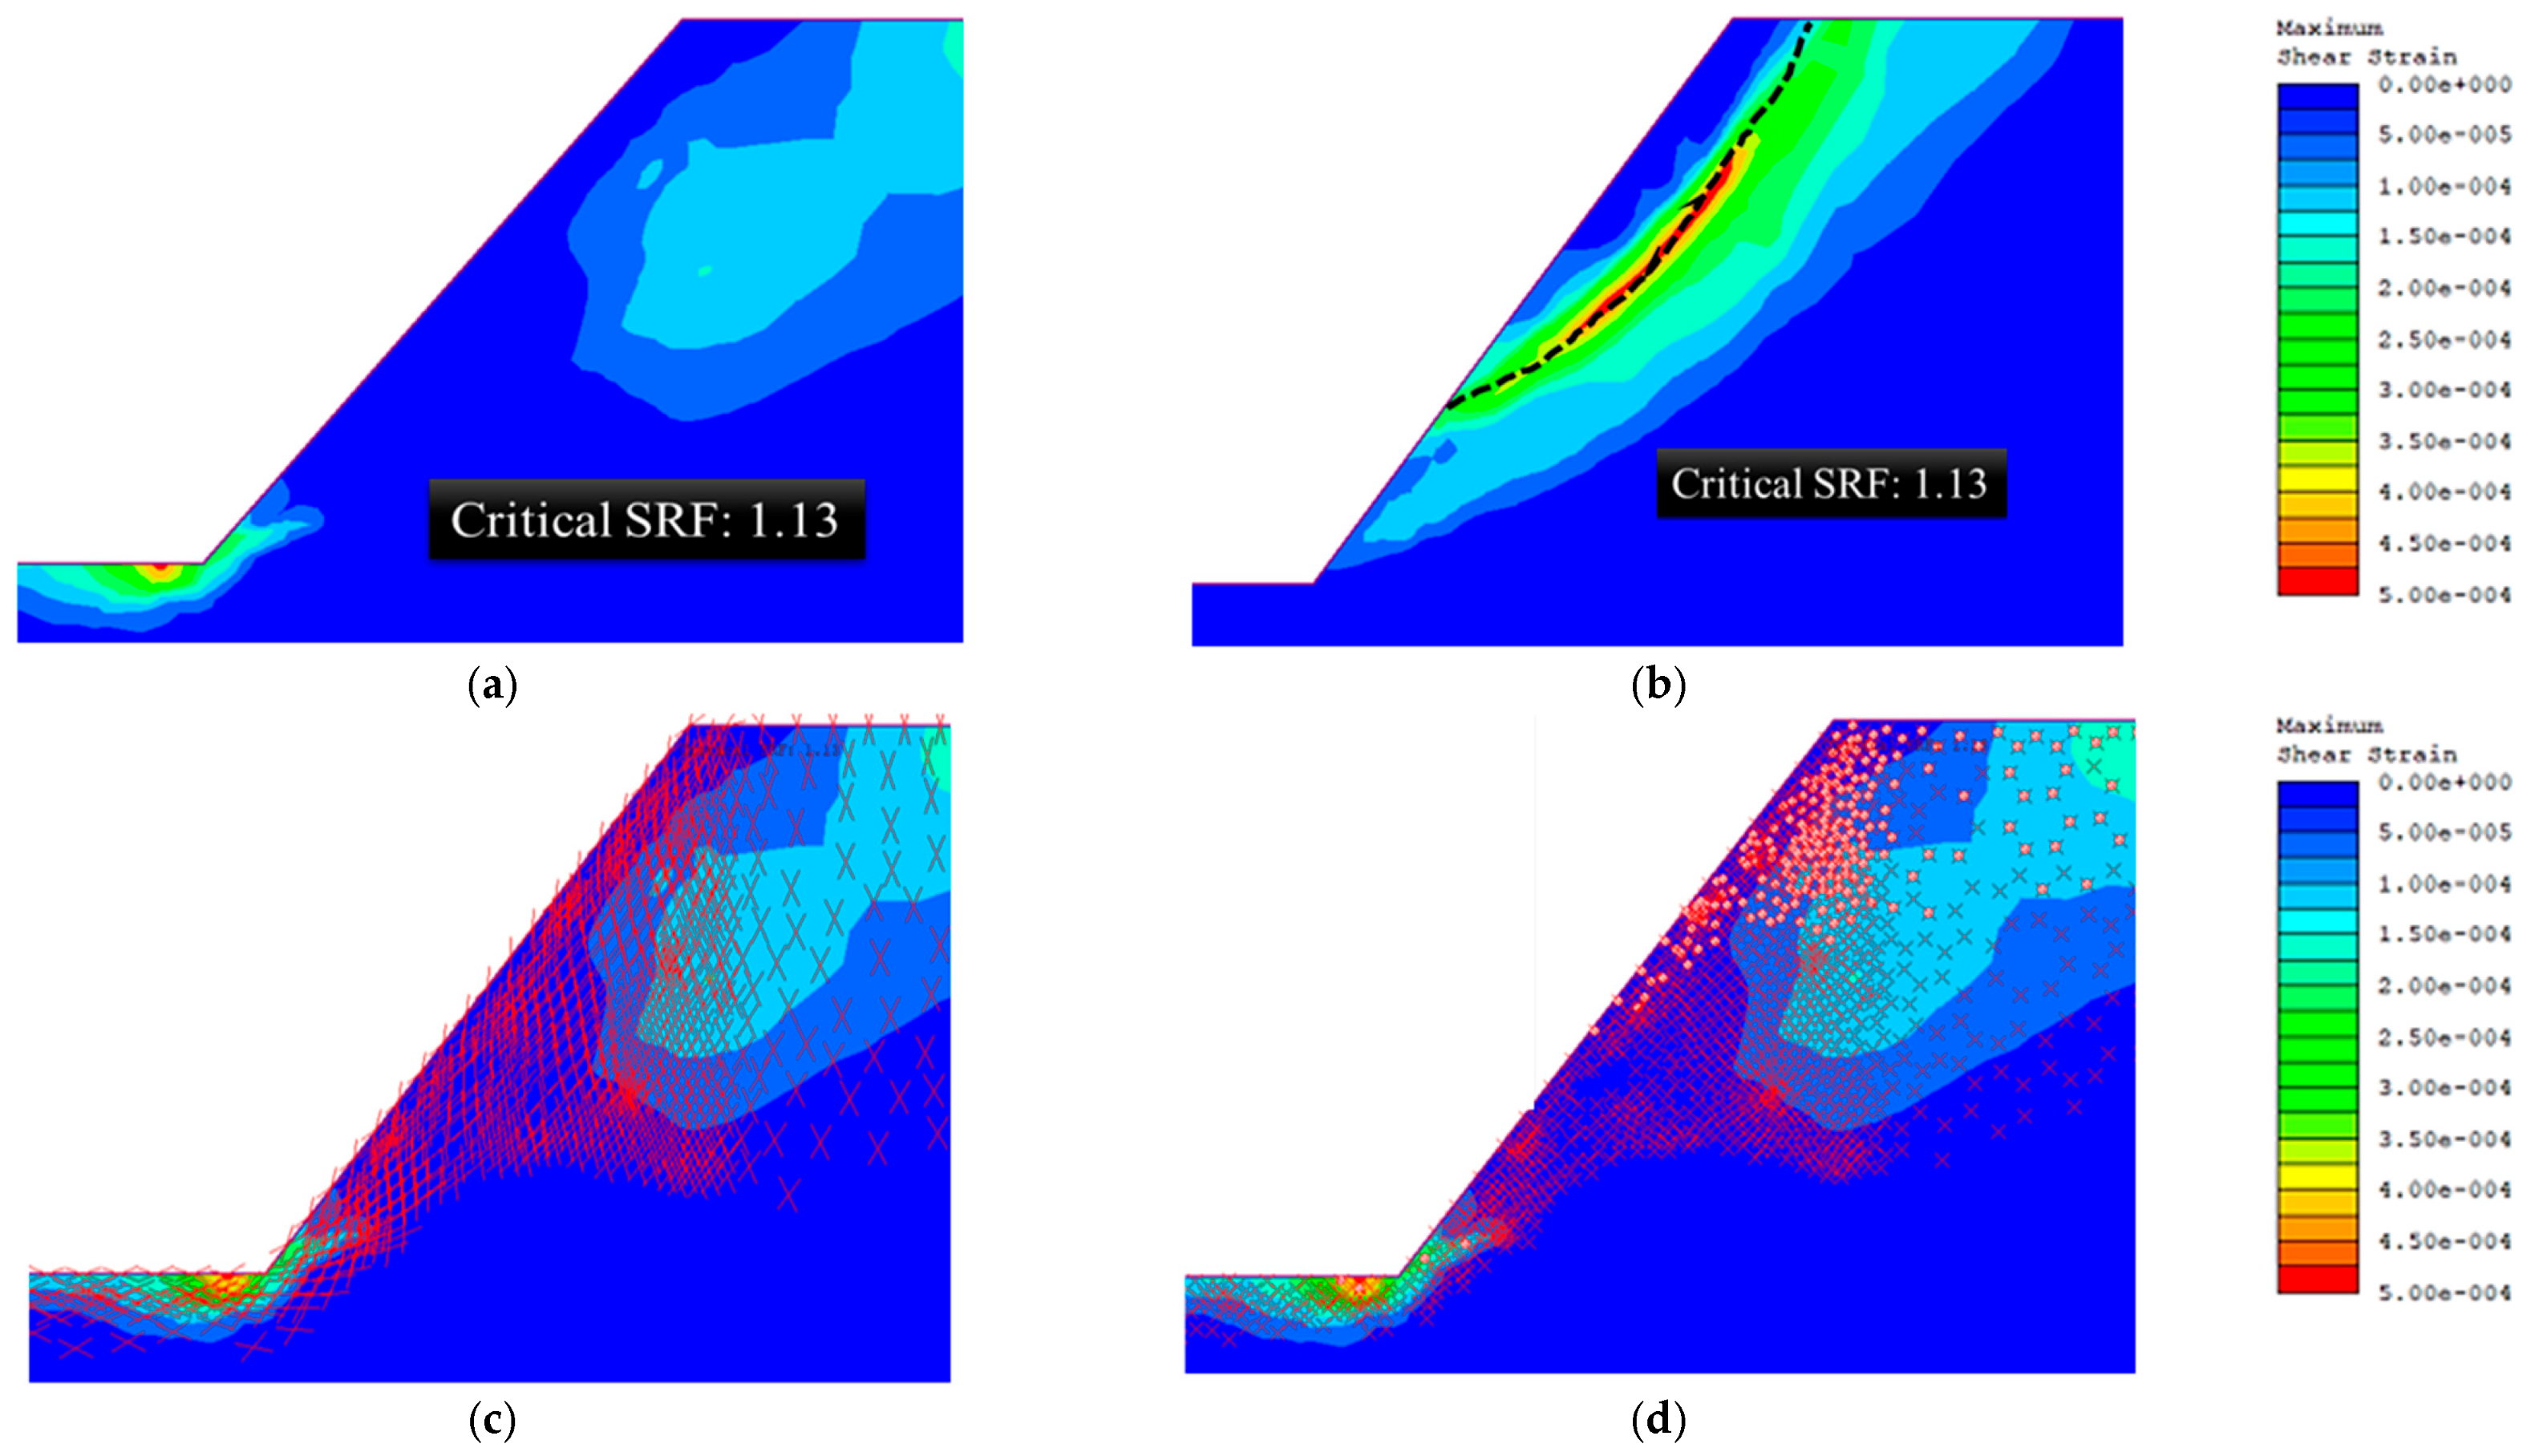
Slope stability is interpreted using several parameters: safety factor, yielded elements, maximum shear strain, and failure trajectories Figure 12. The safety factor equals the Critical Strength Reduction Factor (SRF), indicating the slope’s ability to withstand applied stresses. An SRF greater than 1 denotes stability; less than 1 indicates instability. In Figure 12a, the Critical SRF is 1.13, meaning the slope can withstand stresses 1.13 times greater than current loading—i.e., resistance exceeds driving forces by 13%.
Another key indicator is the maximum shear plastic strain contours, which correspond to principal stress directions and define the failure plane. As shown in Figure 12b, when slope strength is overcome by a factor of 1.13, failure occurs along the defined sliding plane.
Failure trajectories, displayed at all mesh nodes, indicate potential—not actual—failure planes. Two symbols are used: intersecting lines for shear failure, and a single perpendicular line for tensile failure. In Figure 12c, intersecting lines indicate potential shear failure planes.
Yielded elements, displayed in plastic materials, indicate plastic failure of finite elements during stress analysis. In Figure 12d, shear failure is marked by an X symbol, and tension failure by an O symbol; both may overlap if an element fails in both modes.

3. Results

3.1. Stability Condition of Dry Slope in the Absence of Karst

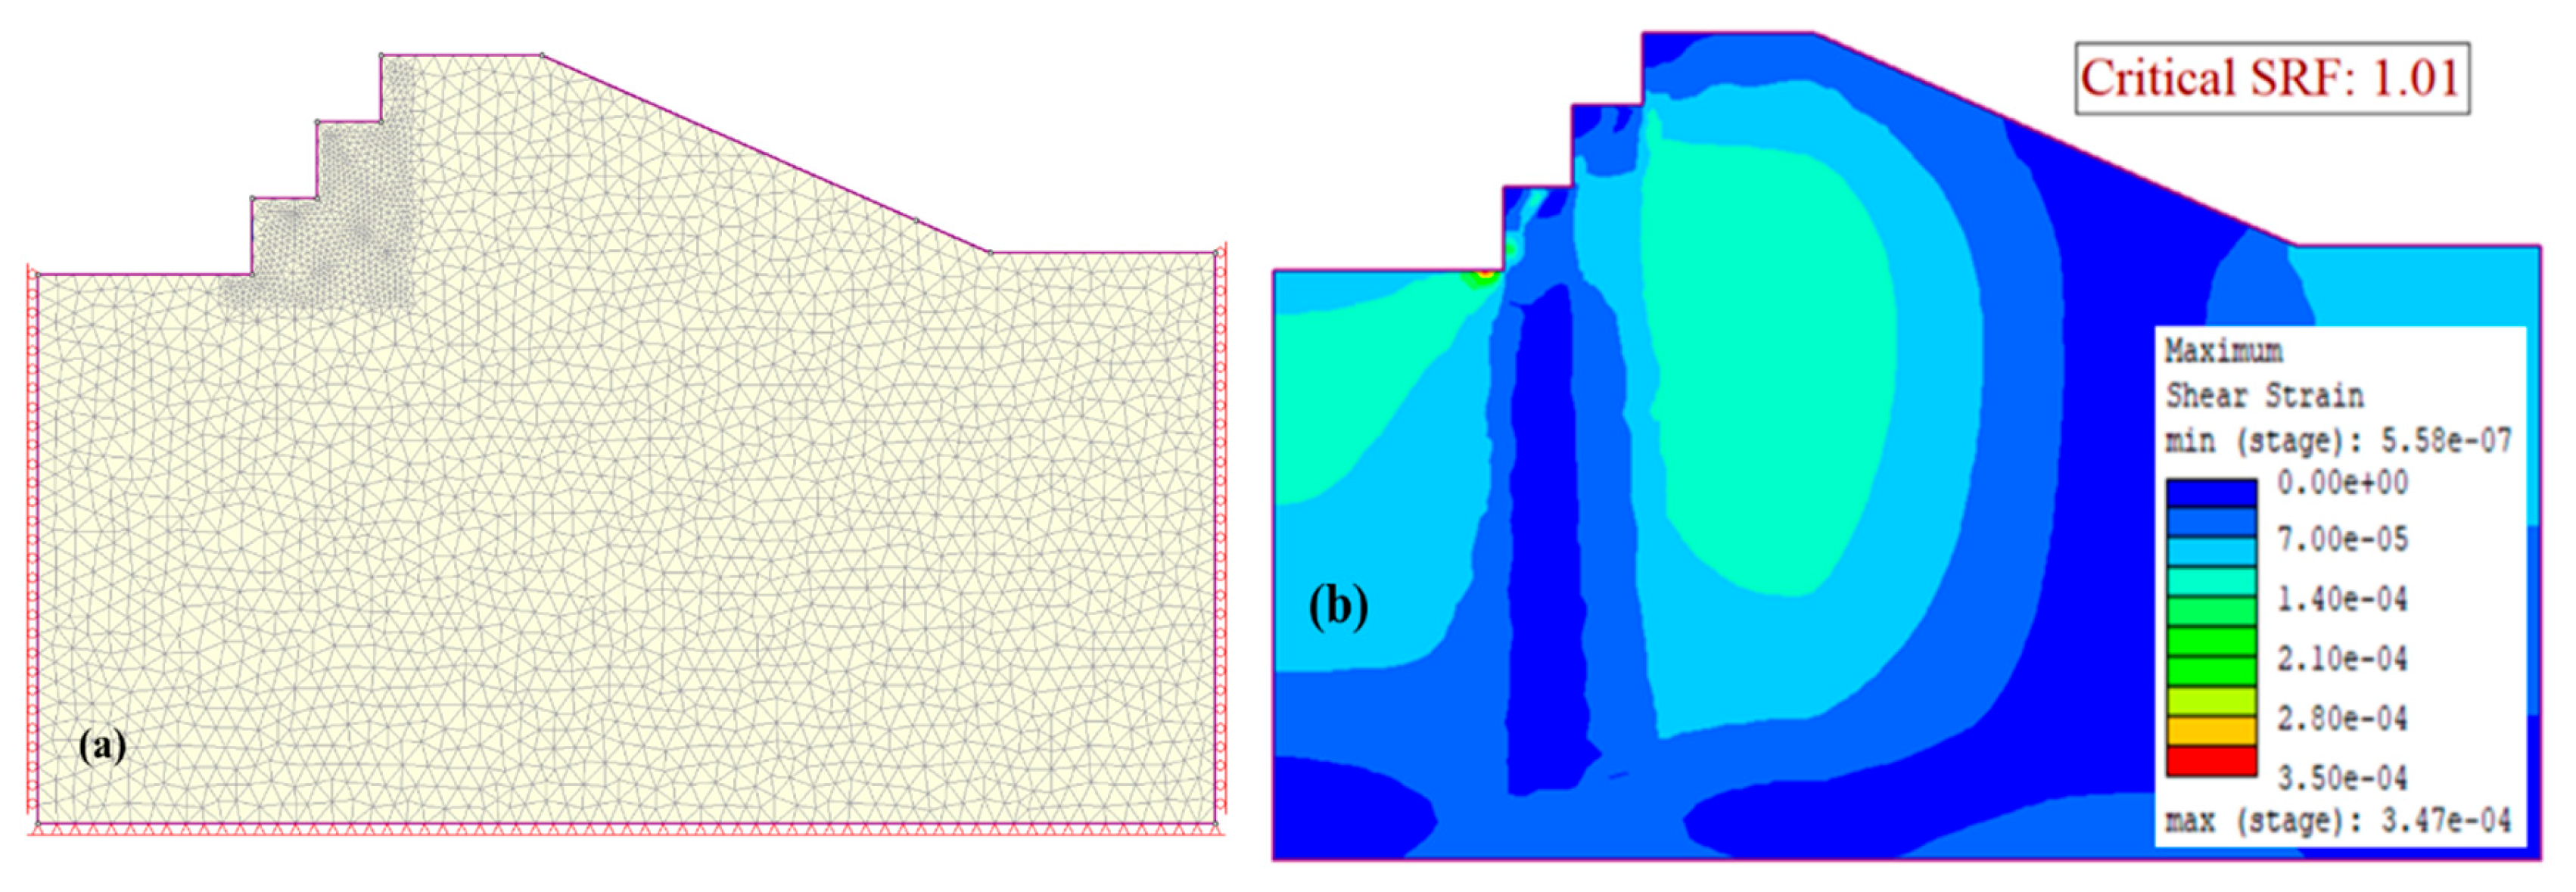
Analysis of the safety factor of the slope without considering the karst hollows (Figure 13a) gives a safety factor of 1.01 (Figure 13b), indicating that the quarry wall is at a state of equilibrium. A potential sliding plane is clearly observed in the bottom-most bench. The toes of the benches experience the highest shear strains, suggesting a high likelihood of material detachment at the bench edges.

3.2. Slope Stability Condition Under Seepage Boundary Conditions

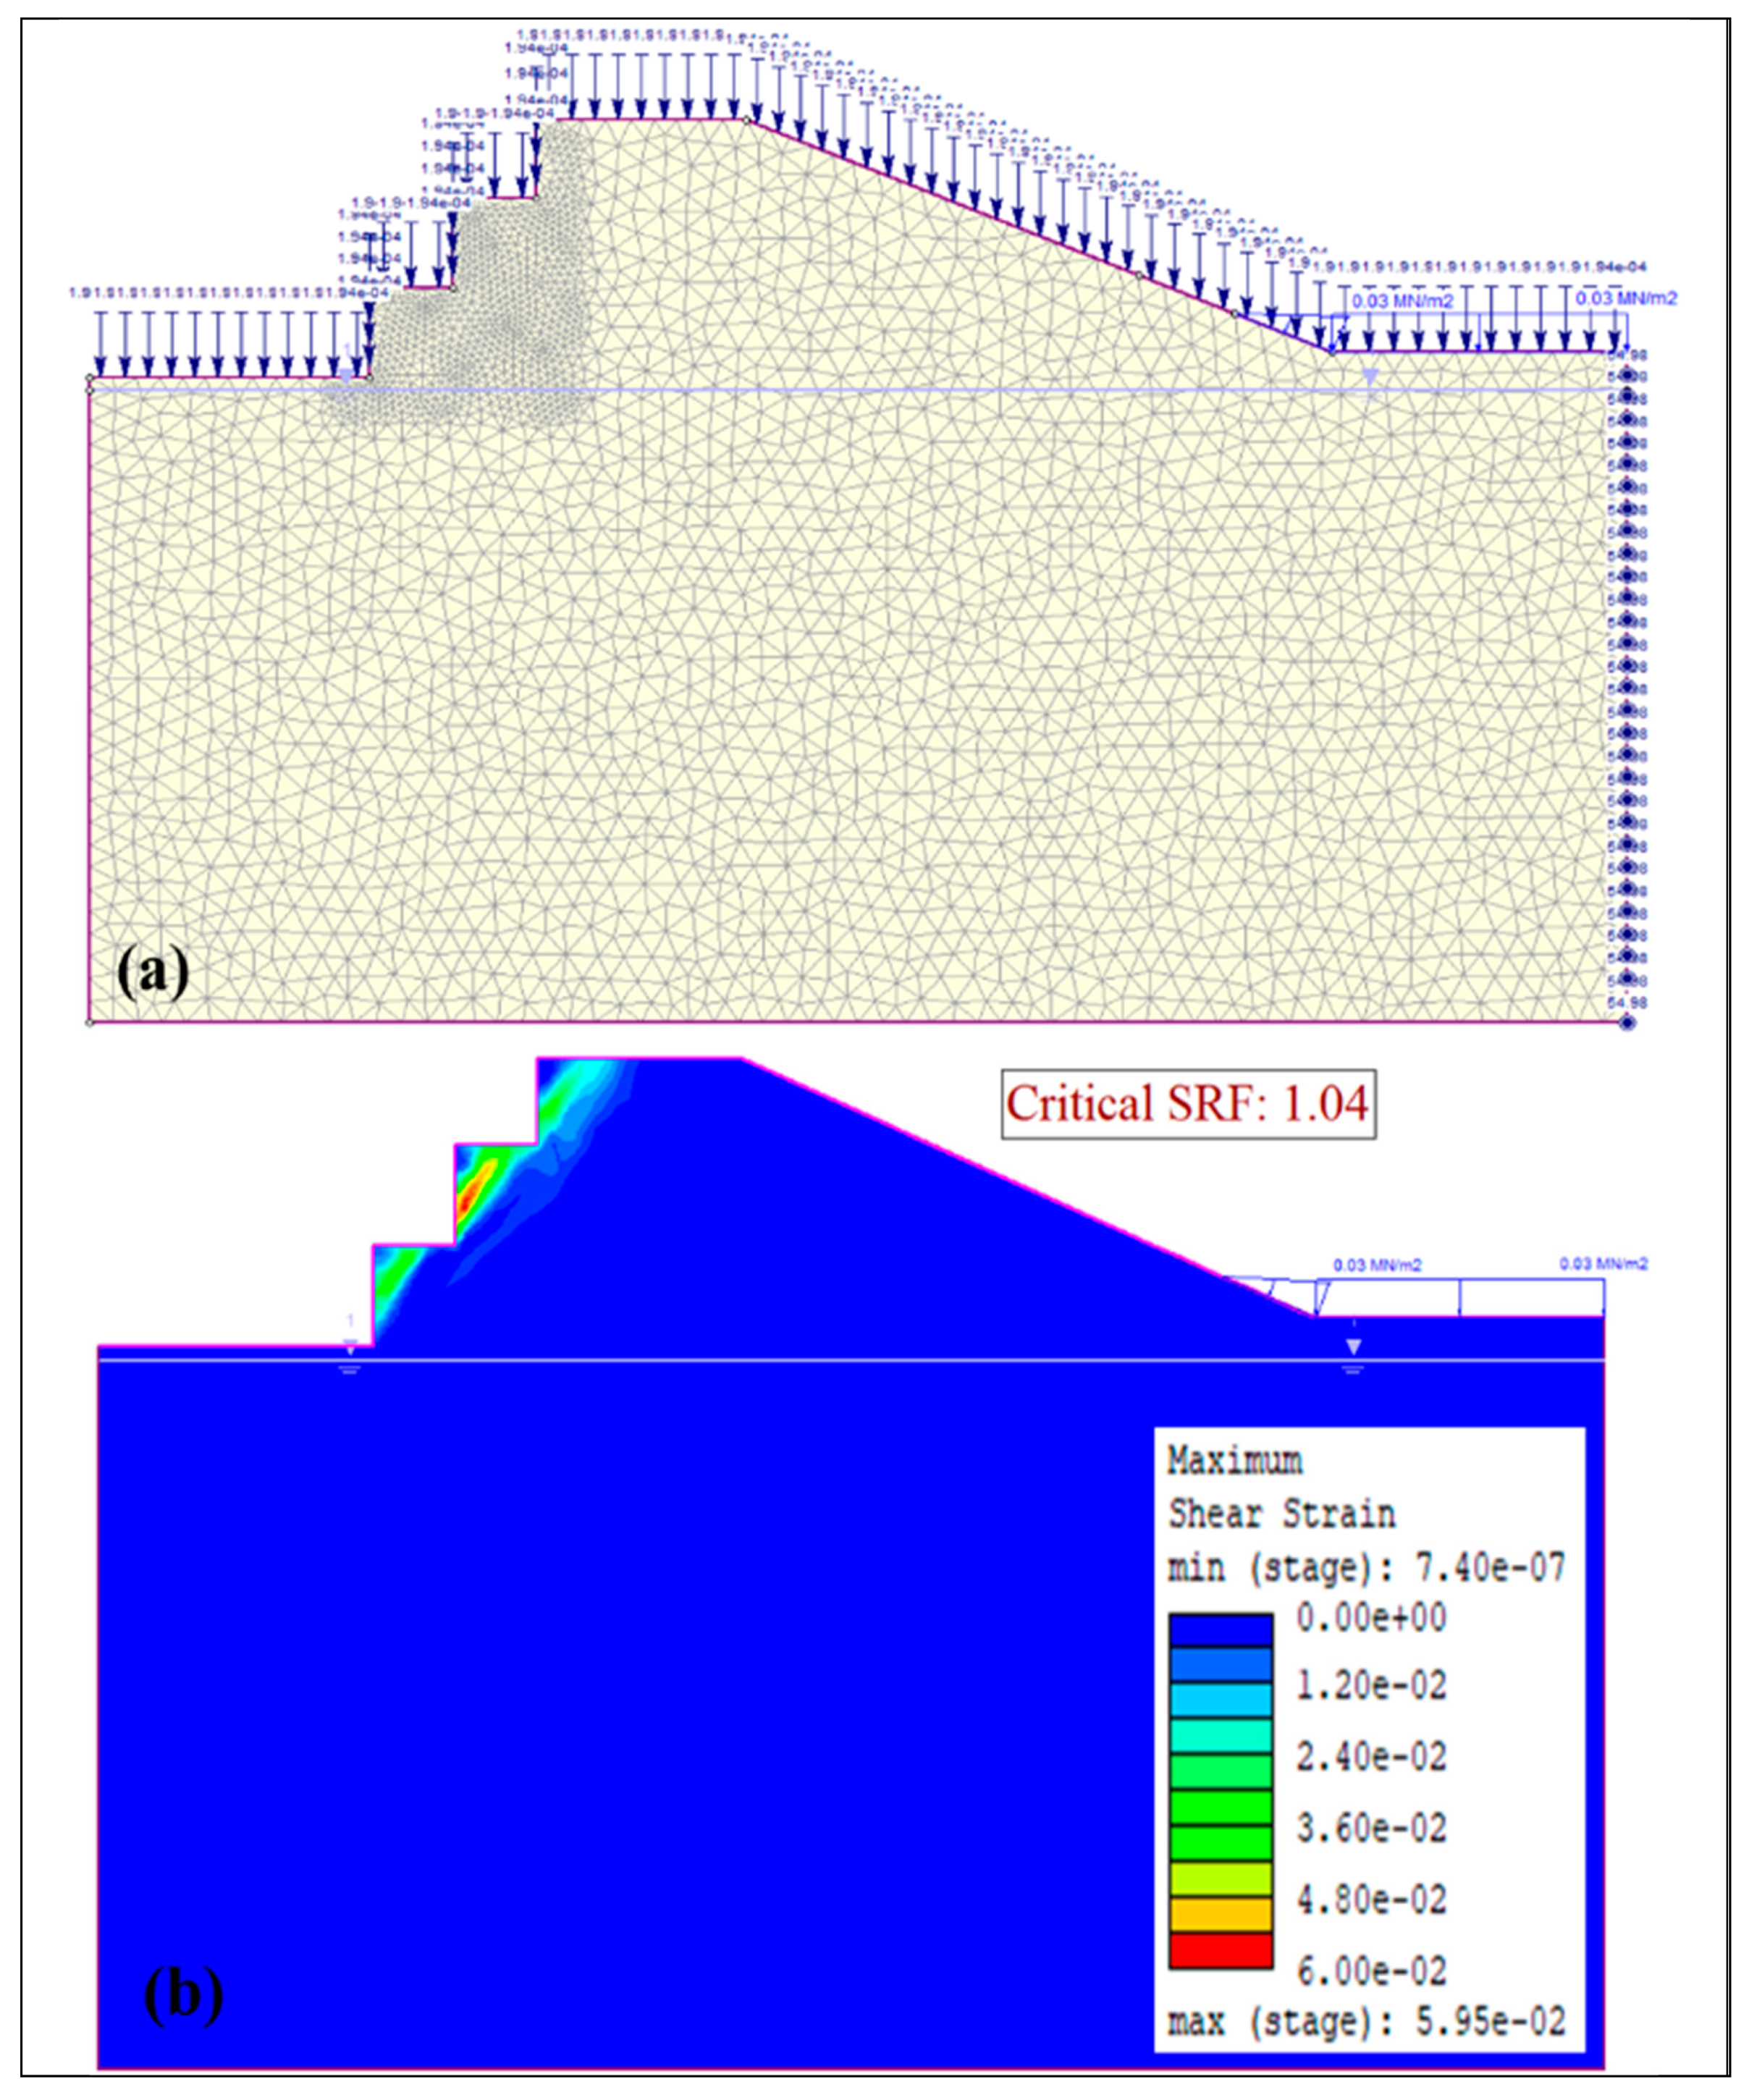
Previous research has demonstrated that the strength of weak rocks is significantly affected by the presence of water. In the Vipingo quarry, sources of water contributing hydraulic pressure to the slopes include groundwater, the adjacent Indian Ocean, and rainfall. The RS2 groundwater analysis module enables modeling of these seepage conditions as hydraulic boundary conditions (Figure 14a). During quarrying, a minimum 1 m buffer zone is maintained above the groundwater level, which is represented in the model by the blue line. Ocean water is represented as a ponded load, with a total head of 0.71 m at low tide and 2.96 m at high tide. The impact of ocean water on slope stability has been previously investigated by the authors [39] and by Wu and Shen [40]. Rainfall is modeled as an infiltration boundary condition with a vertical infiltration rate of 1.94 × 10⁻⁴ m/s [41]. Analysis results show a slight increase in the safety factor (Figure 14b) compared to dry slope conditions, but a significant increase in shear strain values. All benches develop potential shear planes under seepage conditions, indicating further reduction in shear strength.

3.3. Slope Stability Condition with Karst Hollows

The presence of karst hollows reduces the safety factor by 15.84%, from 1.01 to 0.85, and increases shear strains within the slope. In addition to the shear plane on the bottom-most bench, which follows the karst hollows (Figure 15), shear strain is also concentrated around the hollows throughout the slope.

3.4. Slope Stability Condition with Karst Hollows and Seepage Boundary Conditions

Applying the same boundary conditions as in Section 3.2 to Figure 16a, a further increase in shear strains is observed. In addition to shear planes on each bench, a circular shear plane develops from the crest to the toe of the slope (Figure 16b), indicating that the entire slope is at risk of failure under combined hydraulic stresses from groundwater, ocean water, and rainfall. Notably, despite conditions that would typically compromise slope stability—such as high strains and multiple shear planes—an increase in the safety factor is observed.

3.5. Influence of Karst Void Density on Slope Stability

The following results illustrate slope behavior with varying karst densities for each of the four previously defined karst hollow configurations.

3.5.1. Karst Hollows Density of 0.1%

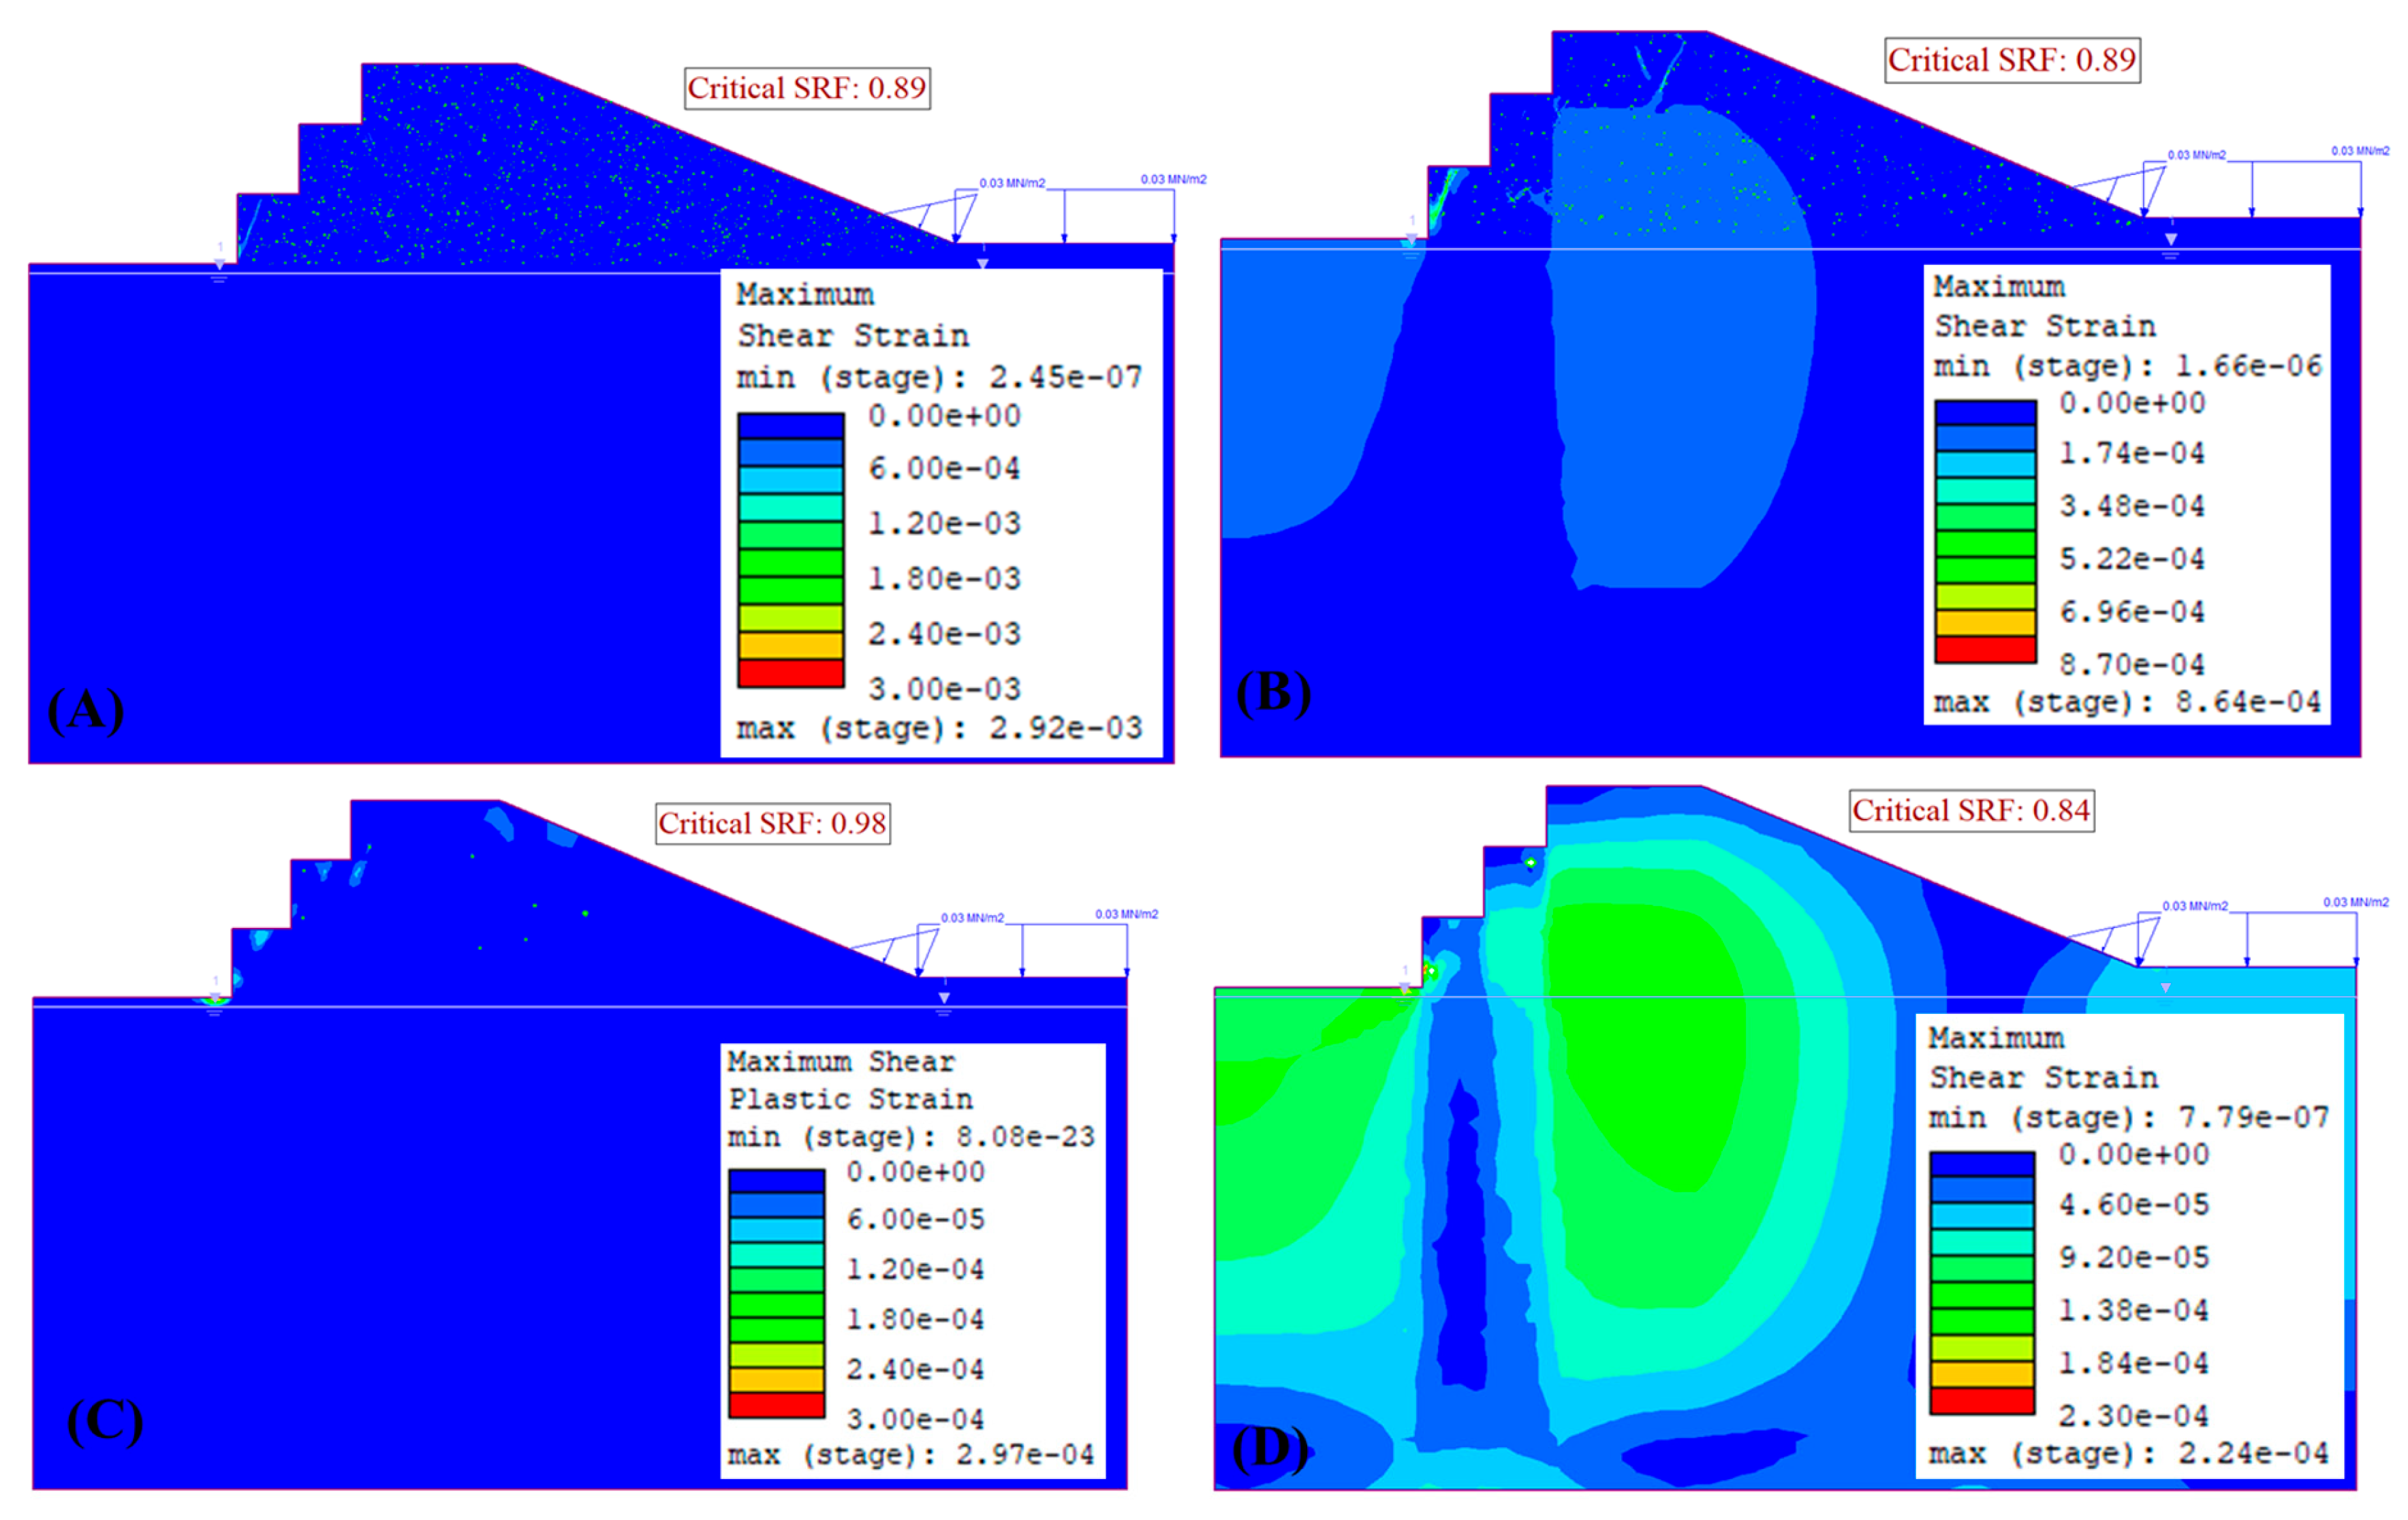
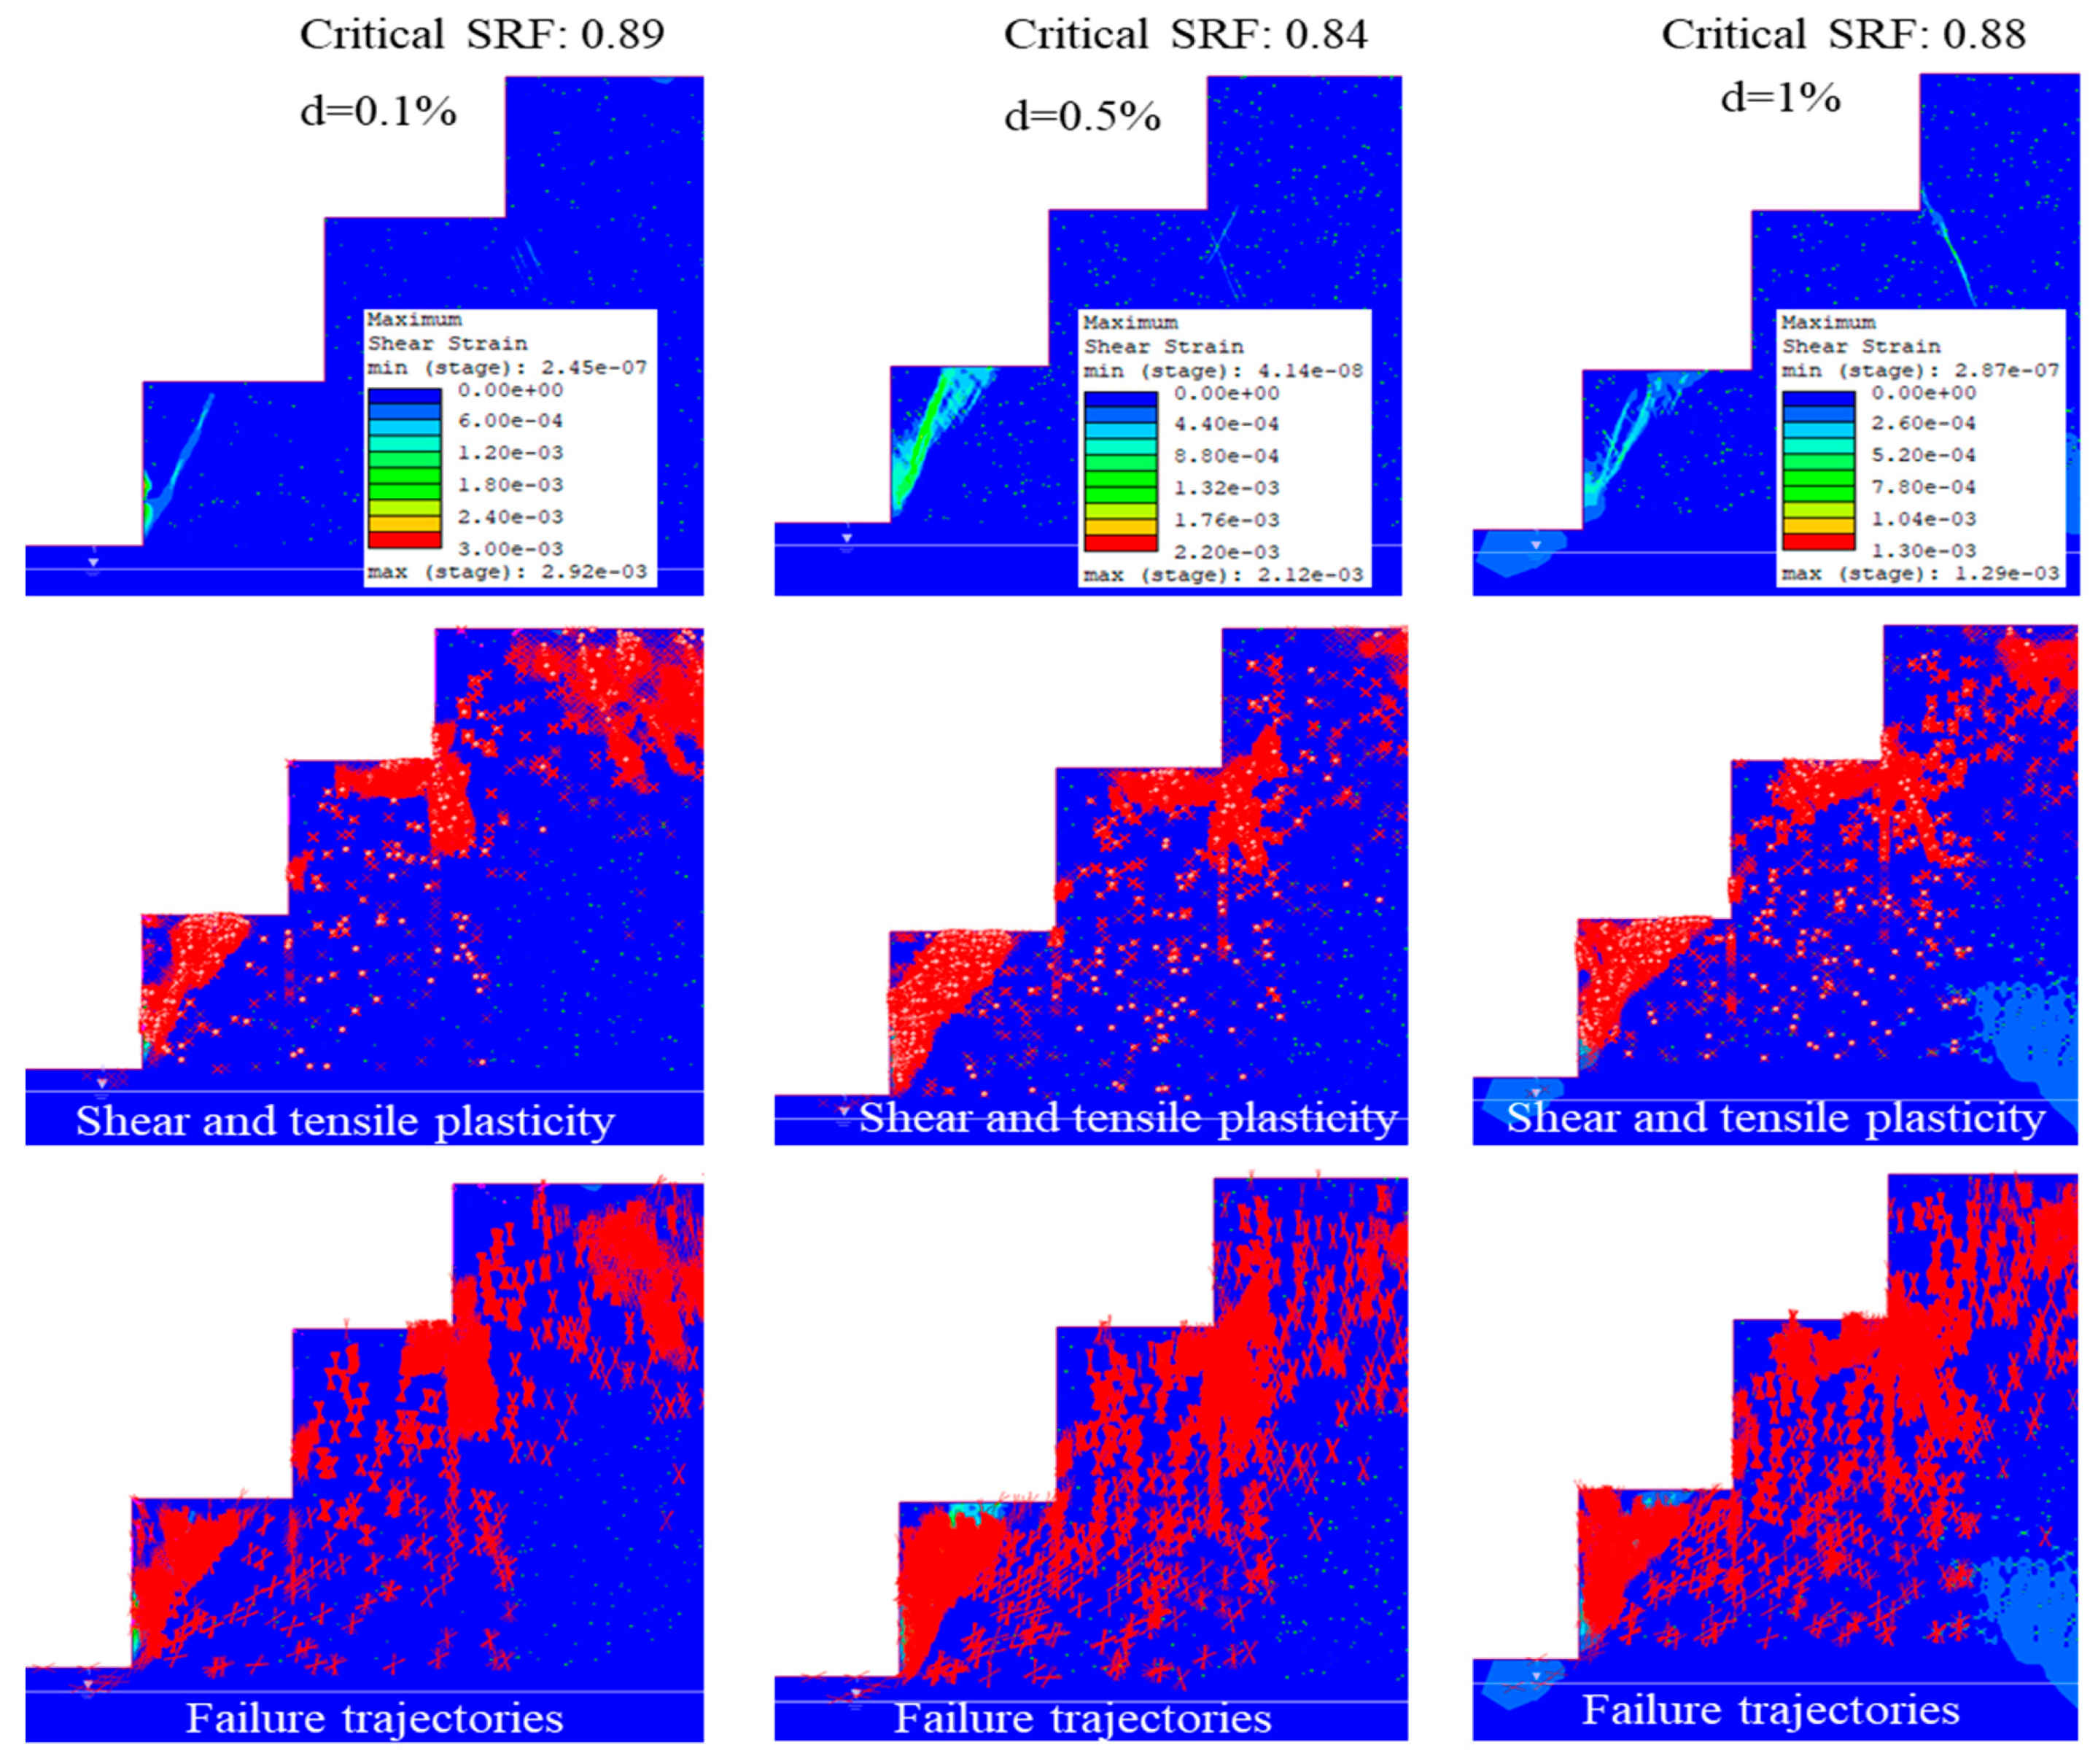
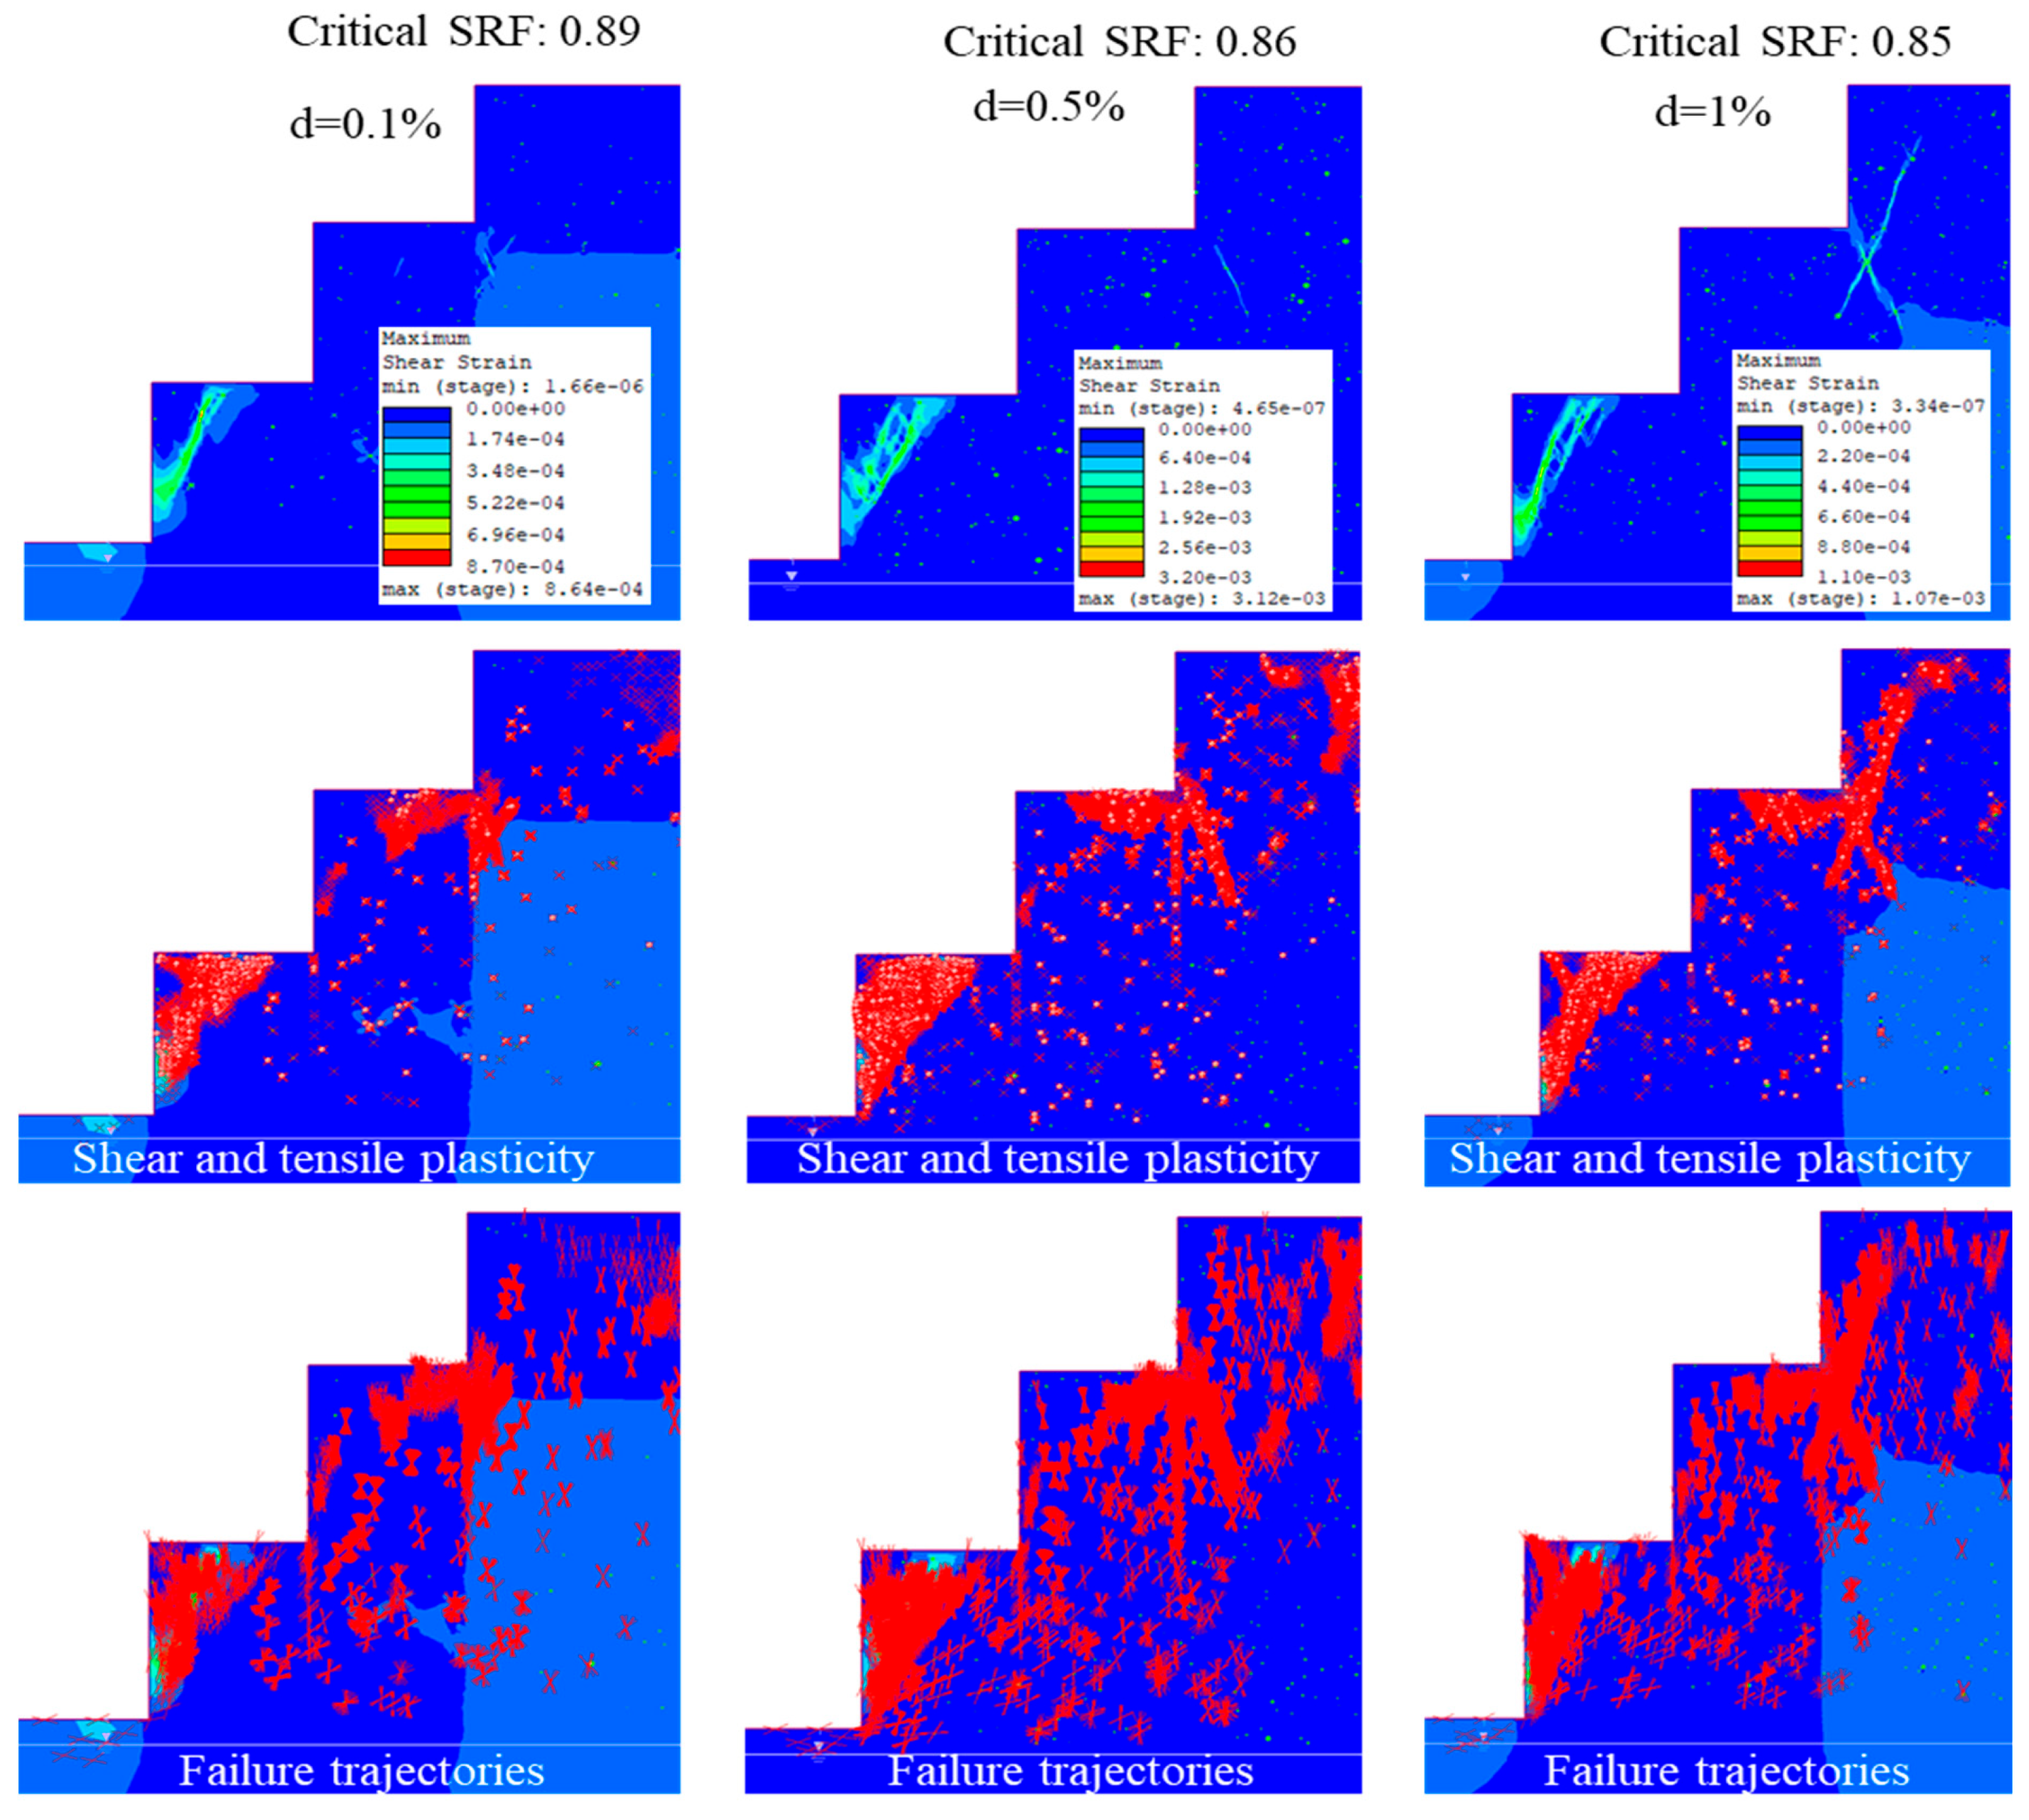
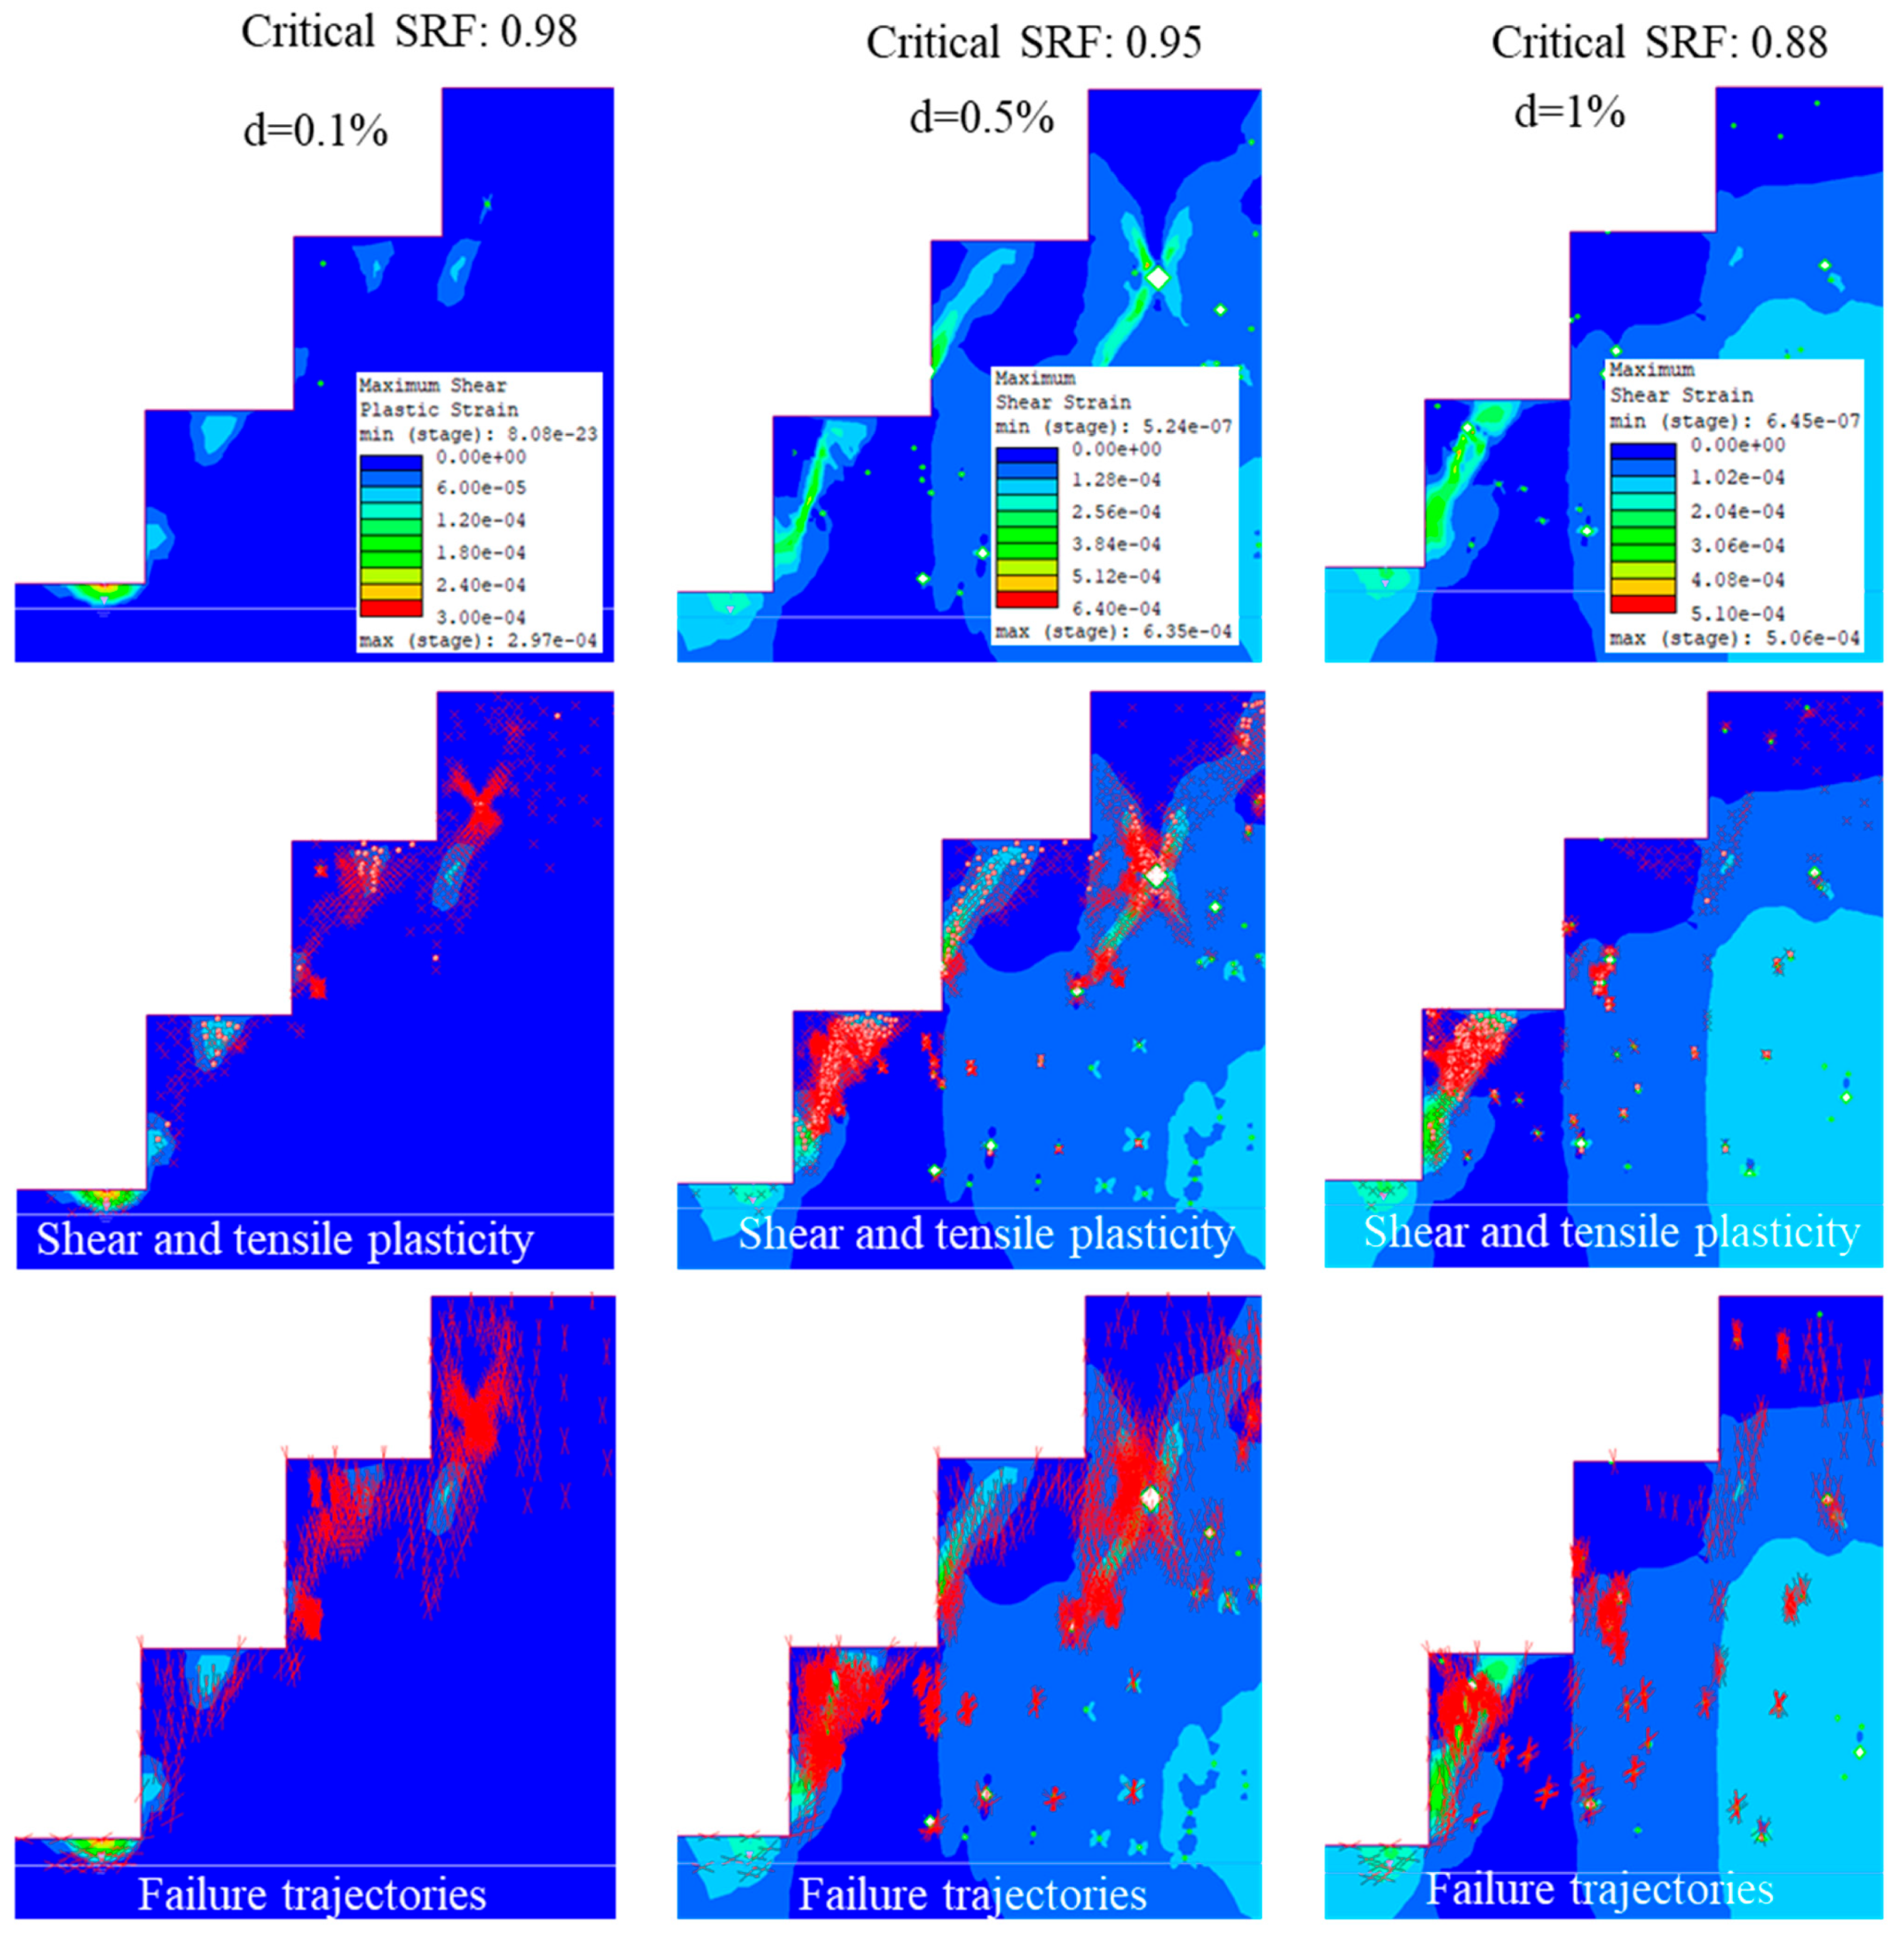
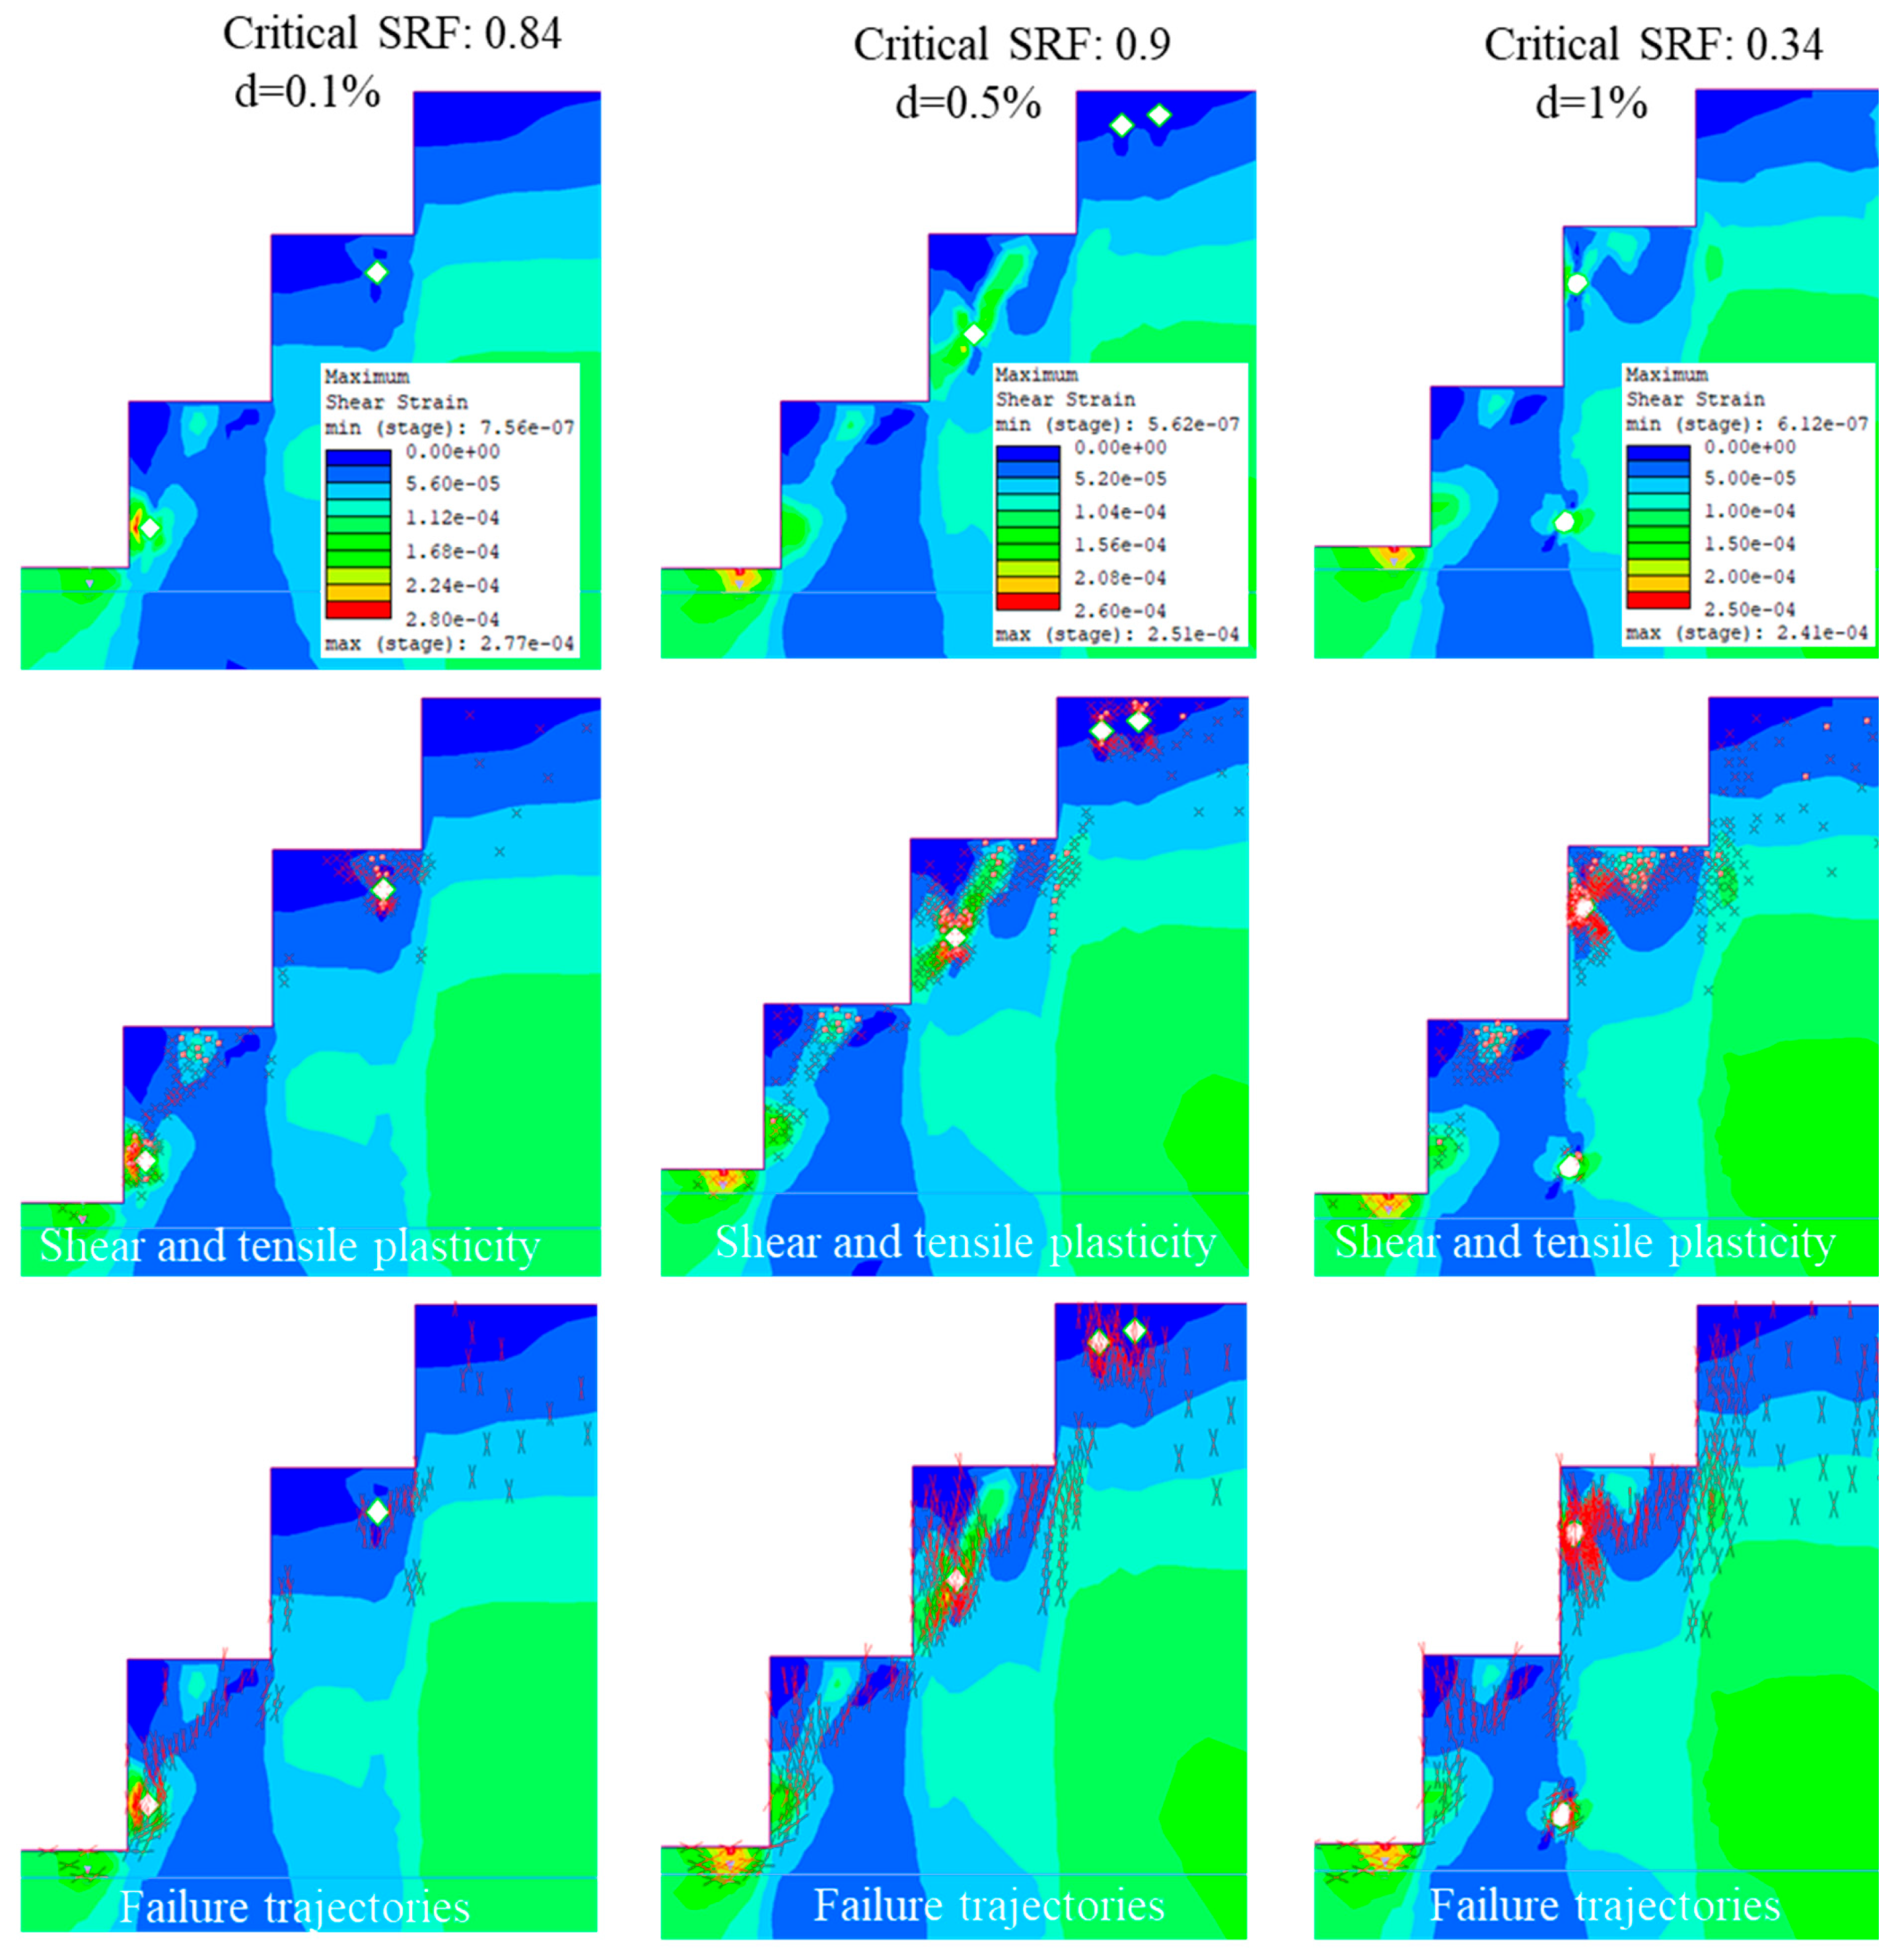
Parametric analysis at a karst hollow density of 0.1% for the four size sets is shown in Figure 17. At this density, the smallest hollows (Set A) reduce the safety factor to 0.89, while mixed hollows (Set B) yield a safety factor of 0.85. Larger hollows (Set C) result in a safety factor of 0.97, and the largest hollows (Set D) yield 0.84. Shear strain is highest with Set A and decreases with increasing hollow size. For smaller hollows in sets A and B, shear strain contours are concentrated around the hollows and form a distinct shear plane. In contrast, larger hollows produce more diffuse strain fields, loosely defining a potential sliding surface.

3.5.2. Karst Hollows Density of 0.5%

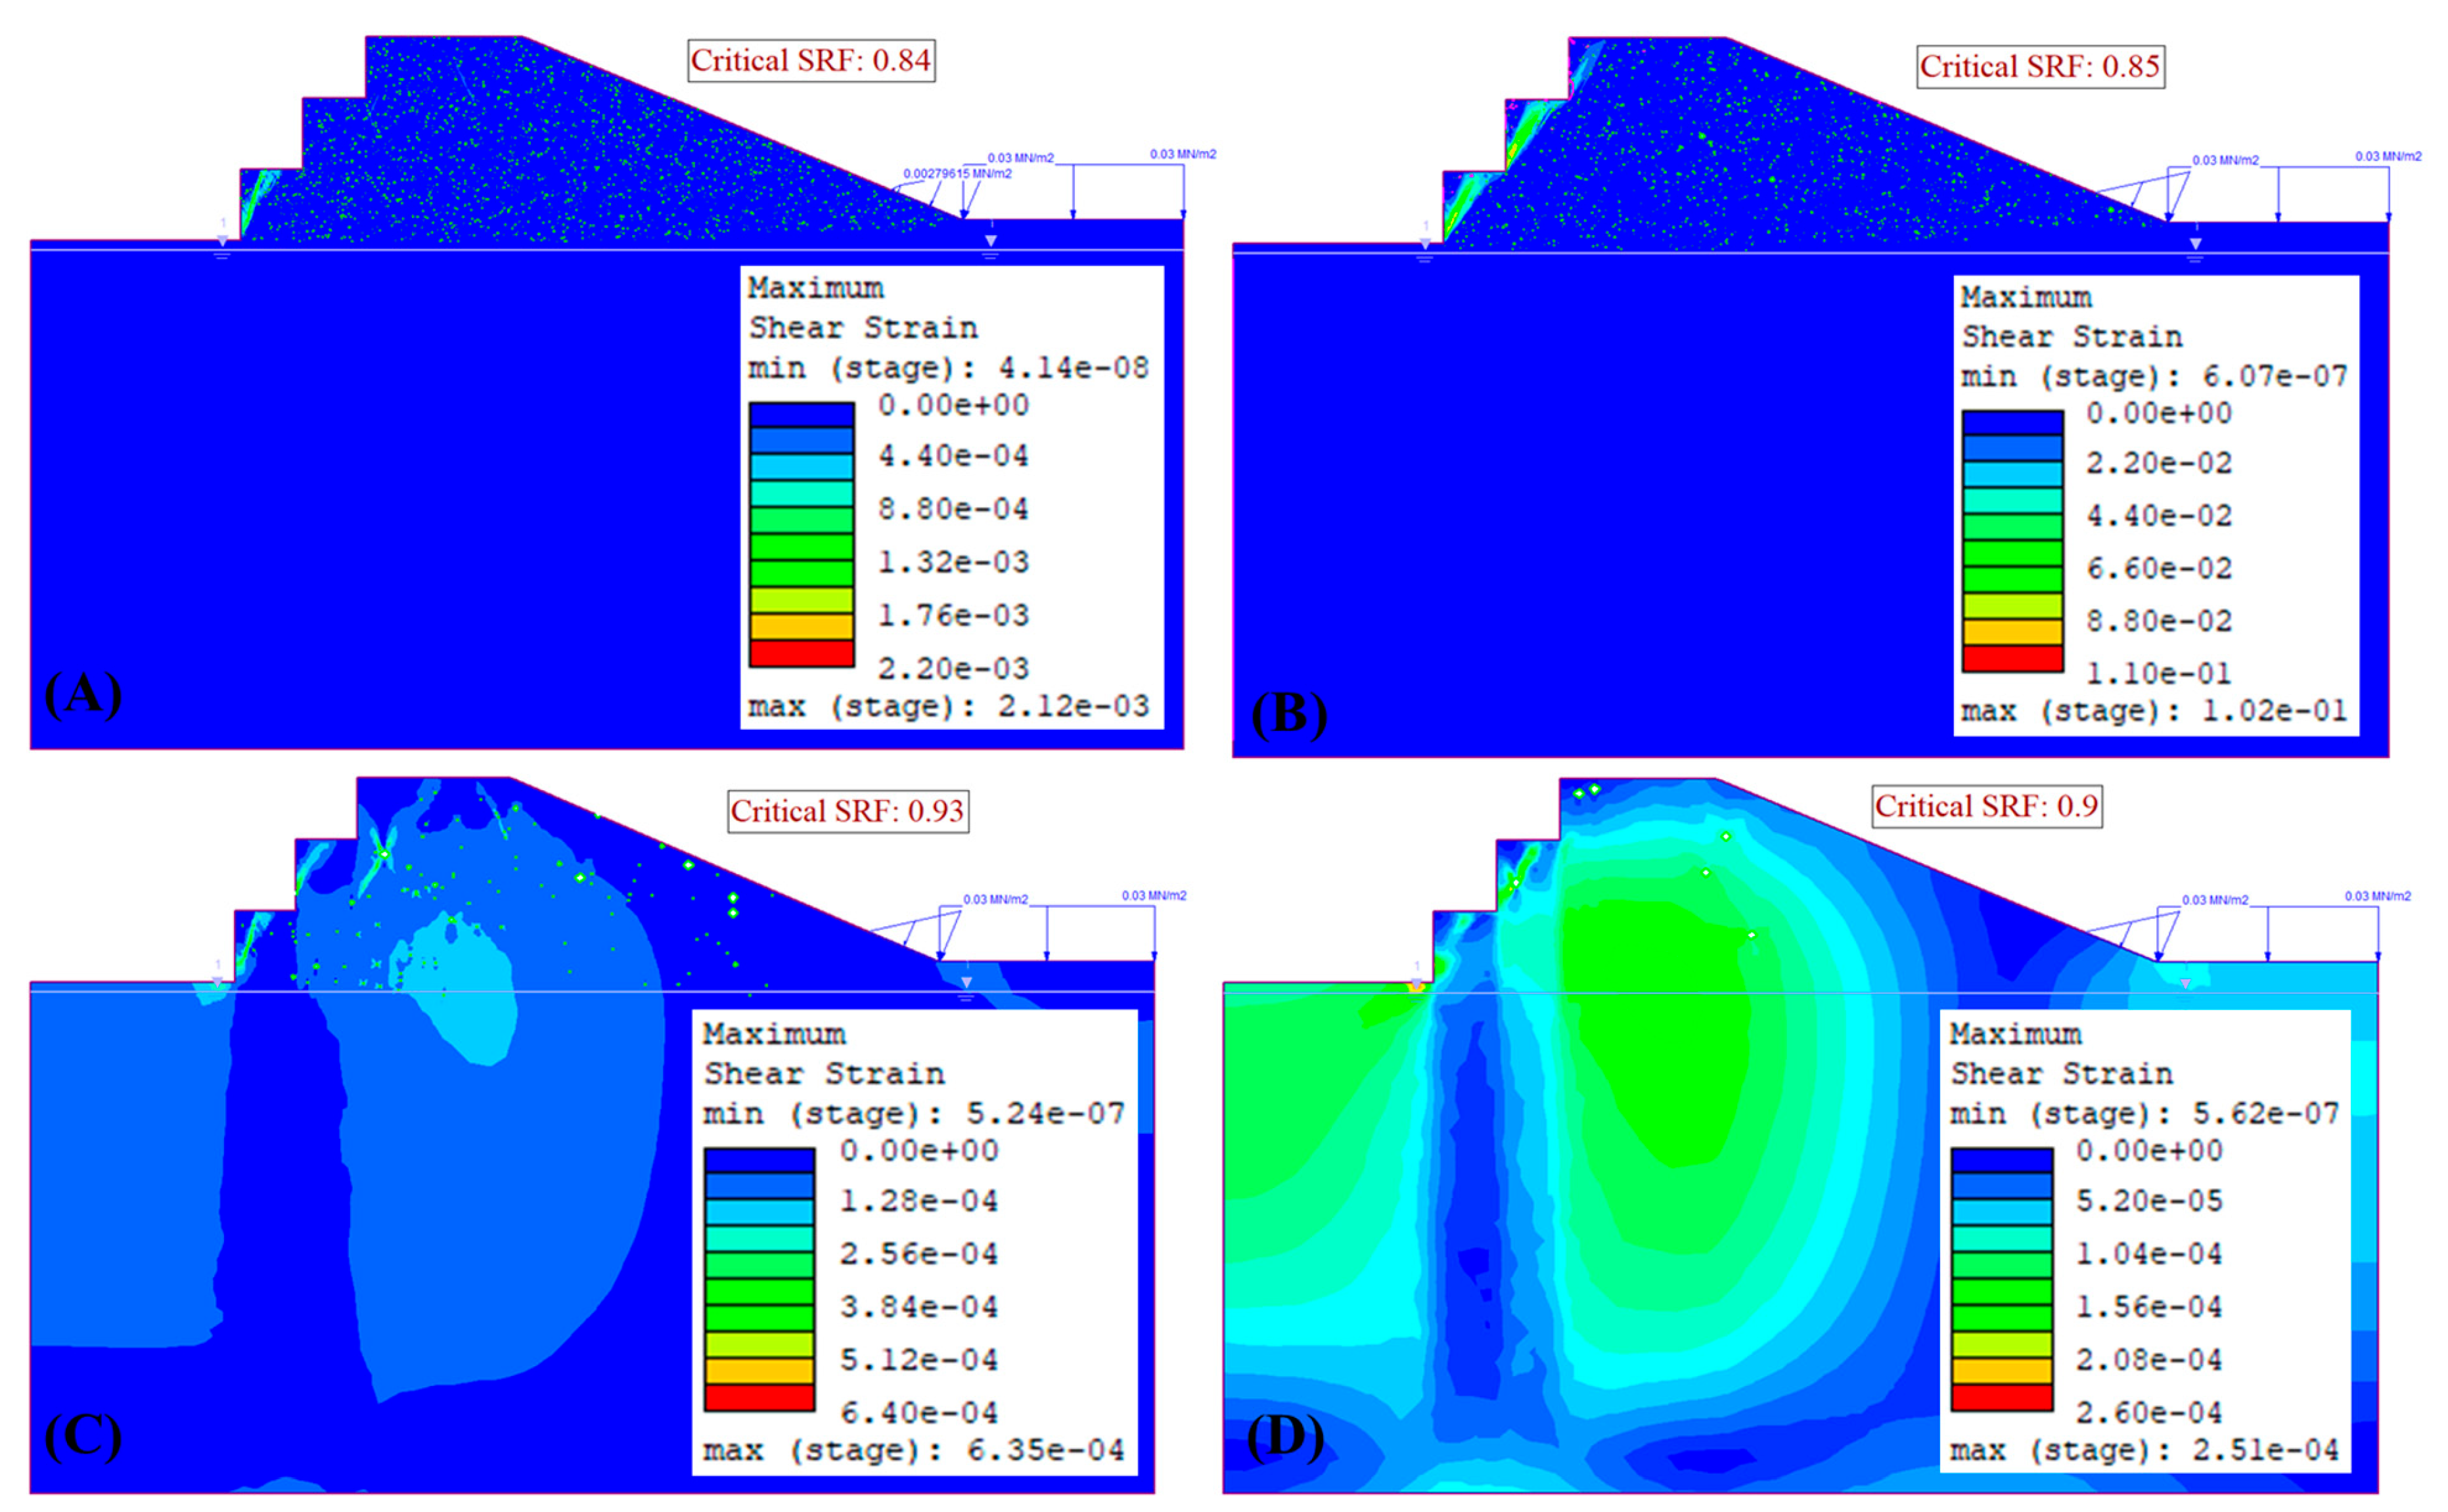
Increasing karst hollow density to 0.5% results in a further decrease in the safety factor for sets A and C. Set B remains unchanged, while Set D shows an increase in safety factor. Generally, shear strains are lower than at 0.1% density, except for Set D. As shown in Figure 18, more shear planes develop with increasing hollow density, consistent with the expected decrease in rock strength as porosity increases. The anomaly observed in Set D is attributed to the variation in the location of larger hollows relative to benches and the slope face.

3.5.3. Karst Hollows Density of 1%

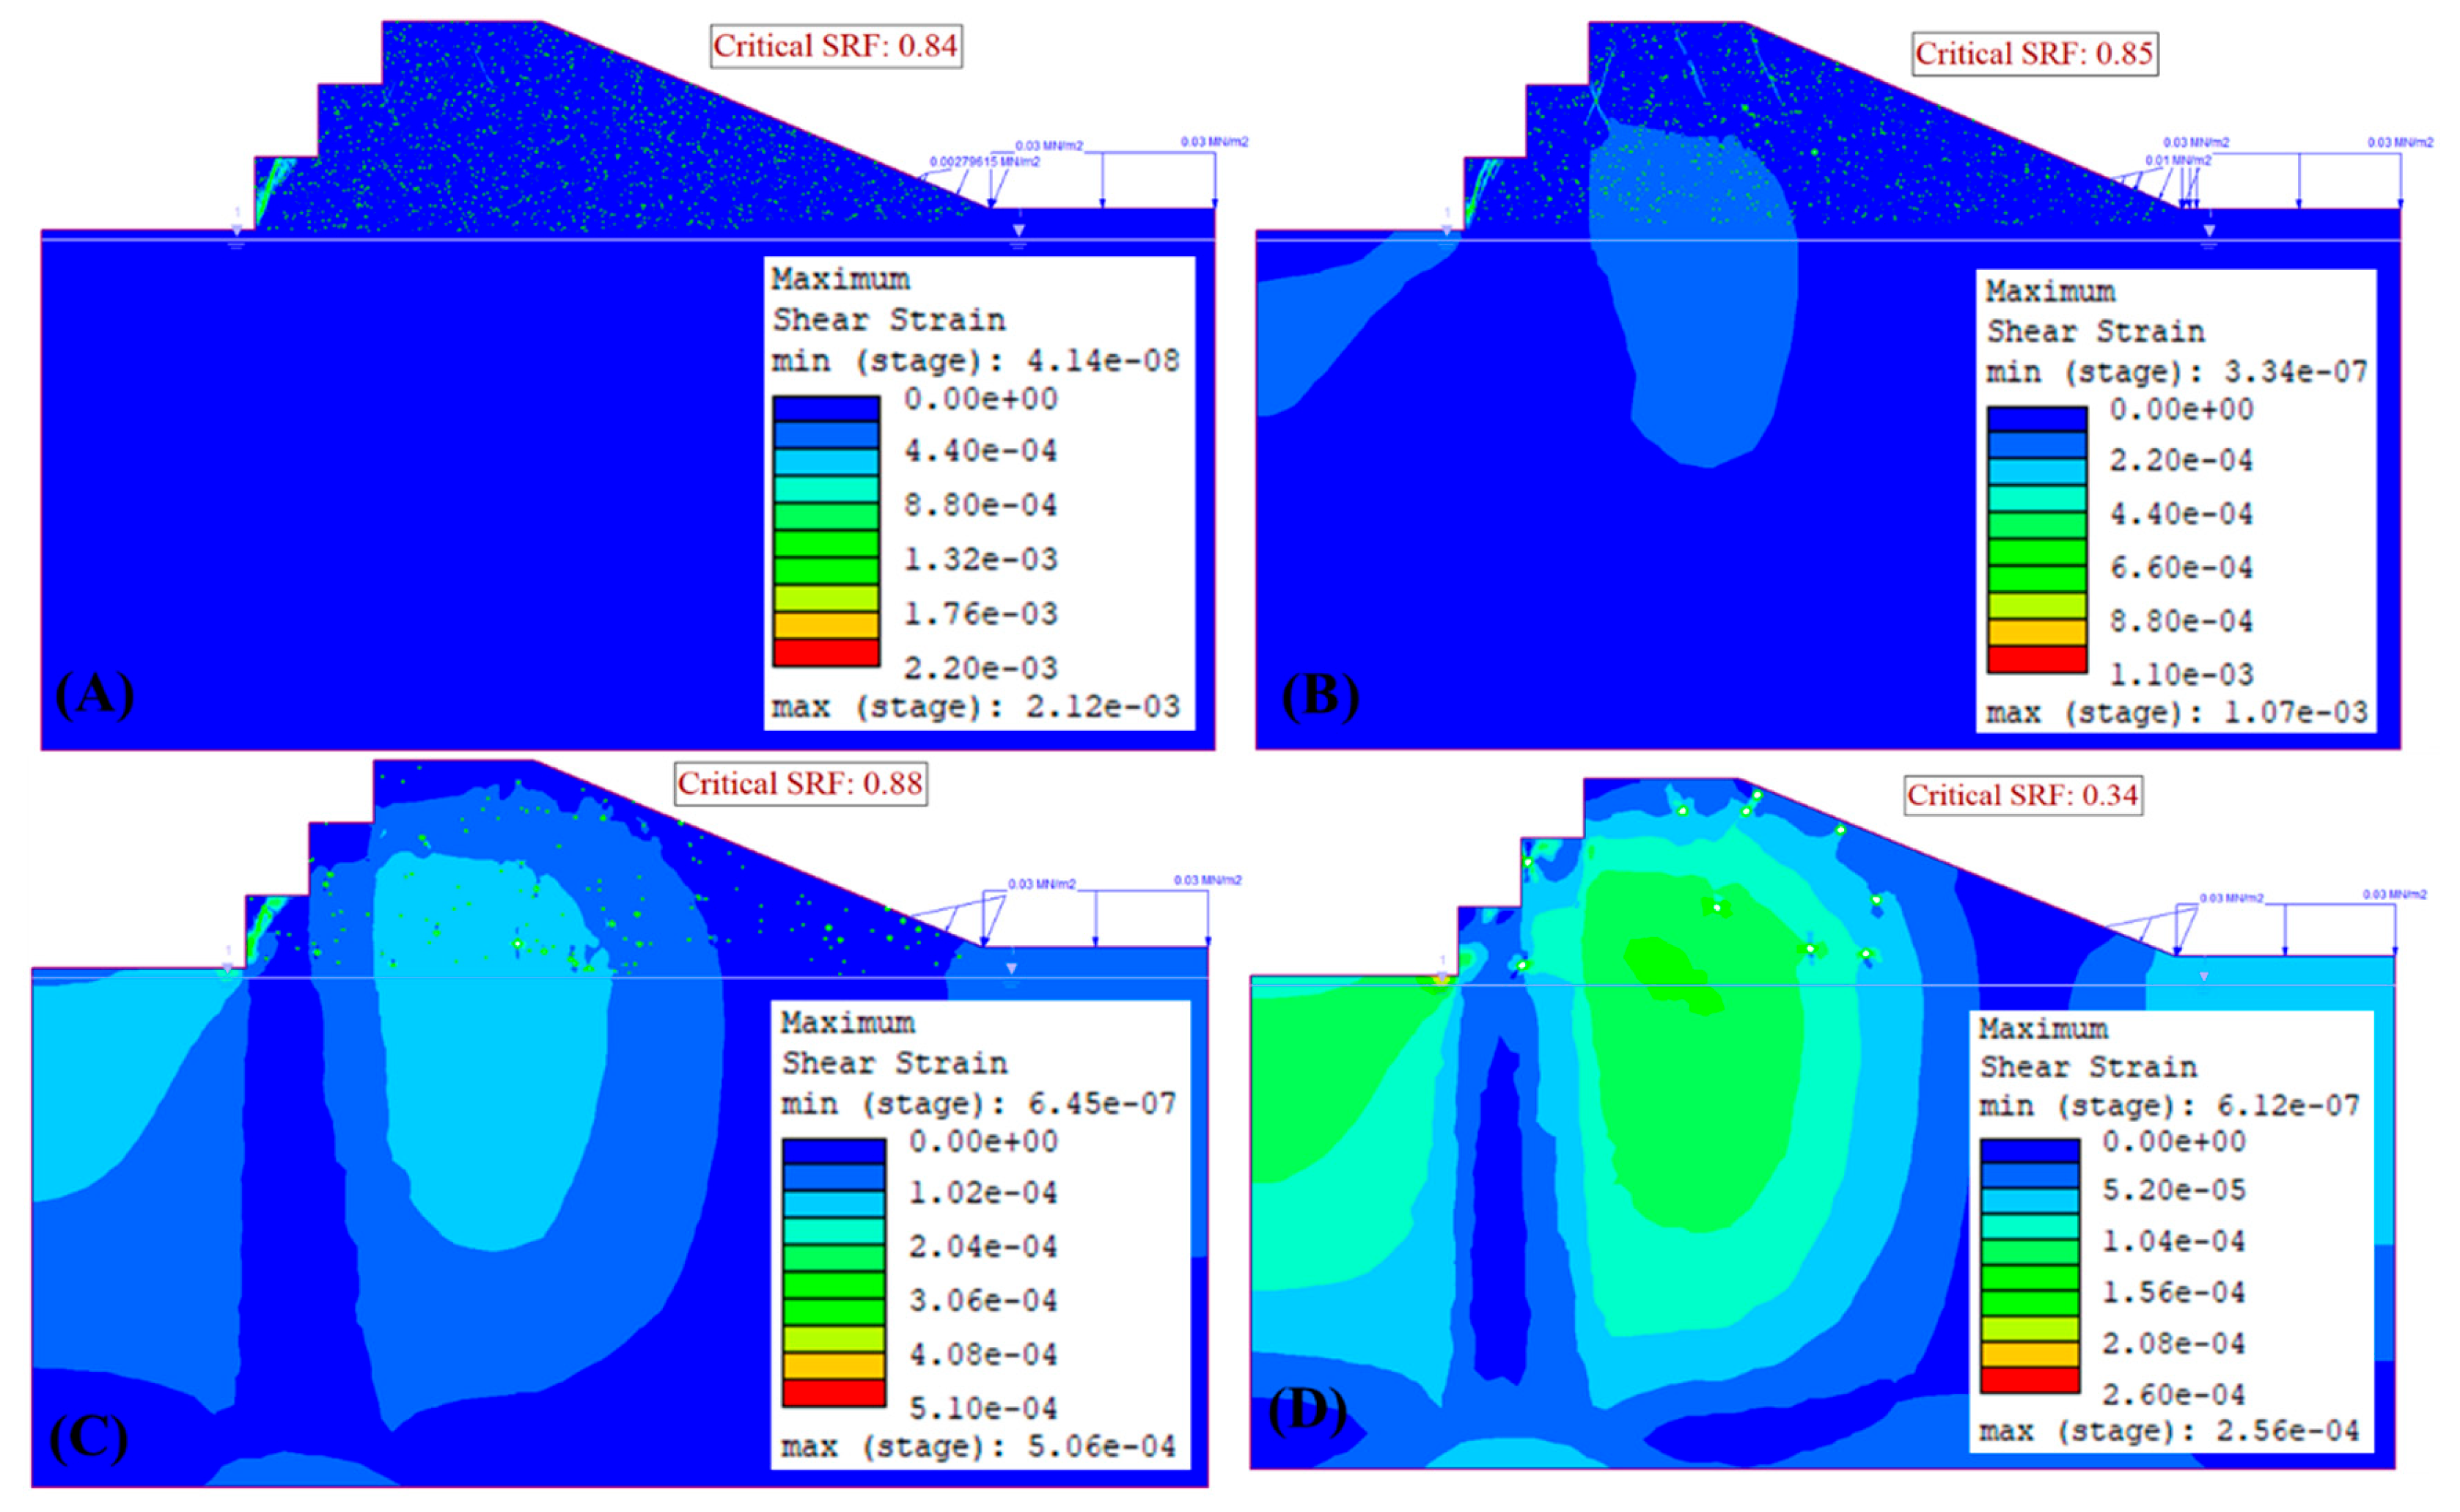
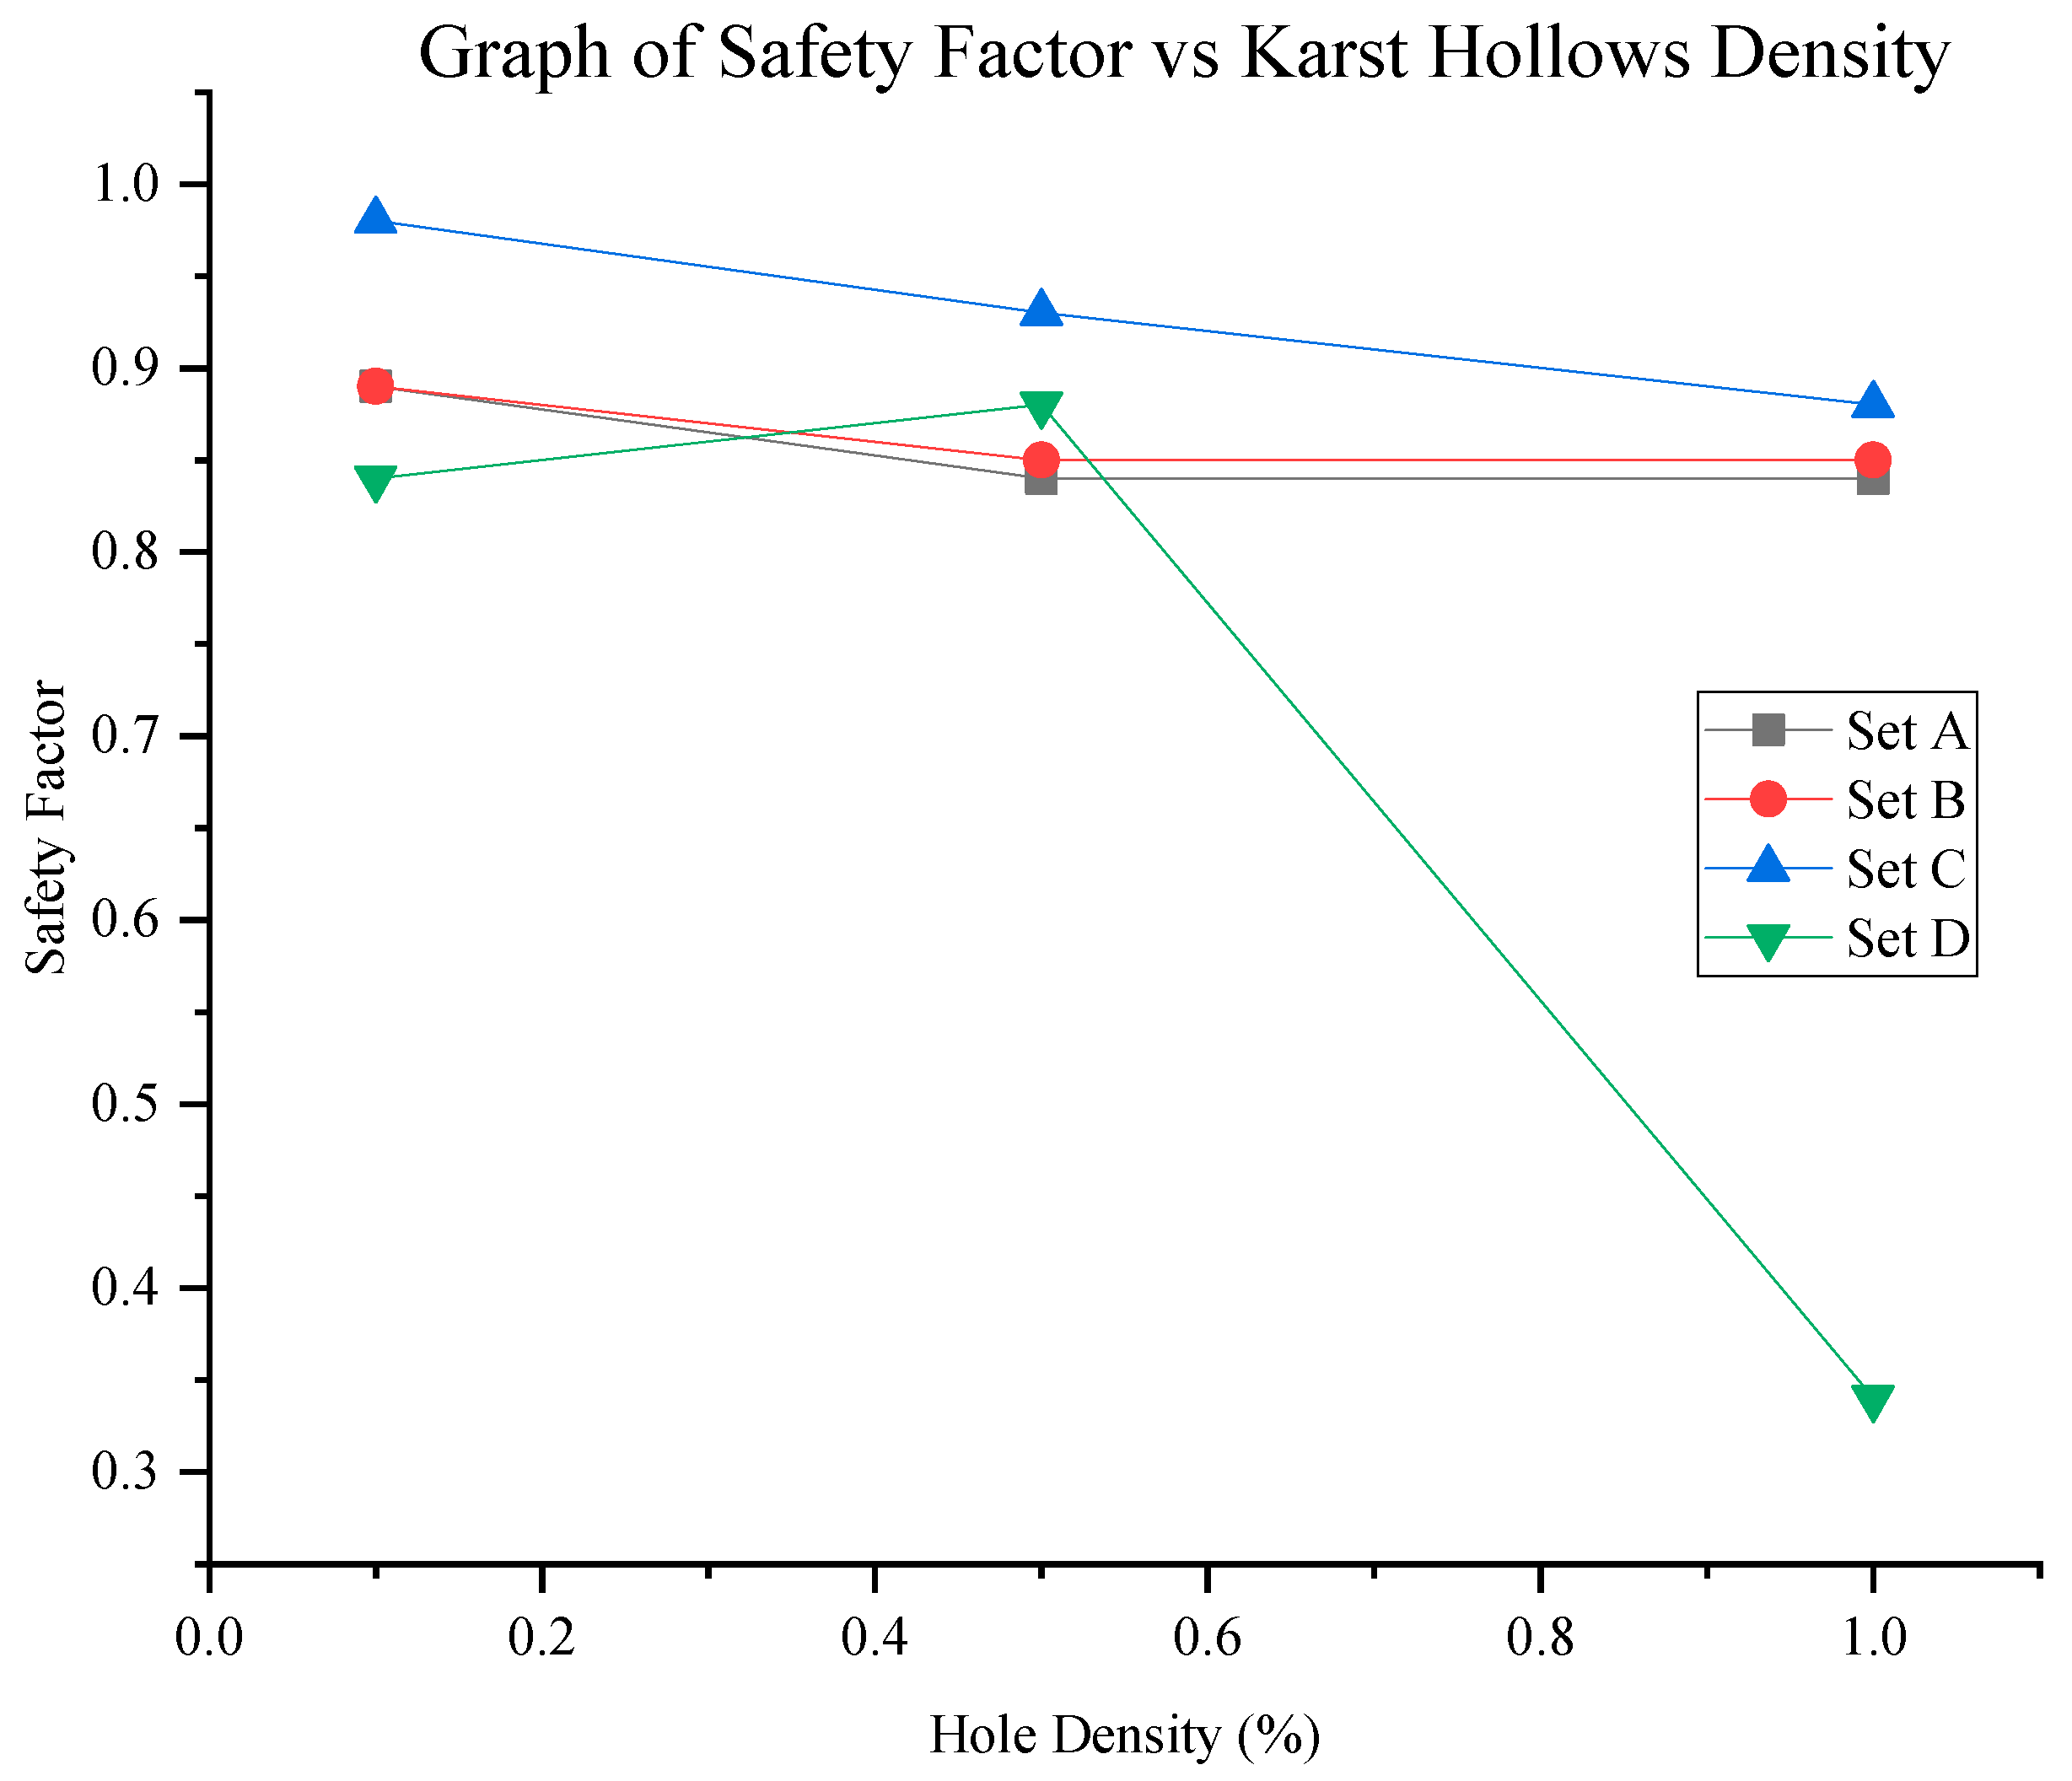
As karst hollow density increases to 1% (Figure 19), slope behavior becomes more complex. For smaller hollows (sets A and B), the safety factor increases with density, while for larger hollows, the safety factor decreases sharply, especially for Set D. Shear strain remains higher for smaller hollows than for larger ones.
Parametric results for the variation of safety factor with karst hollow density and size are summarized in Table 3.

3.6. Variation of Safety Factor with GSI

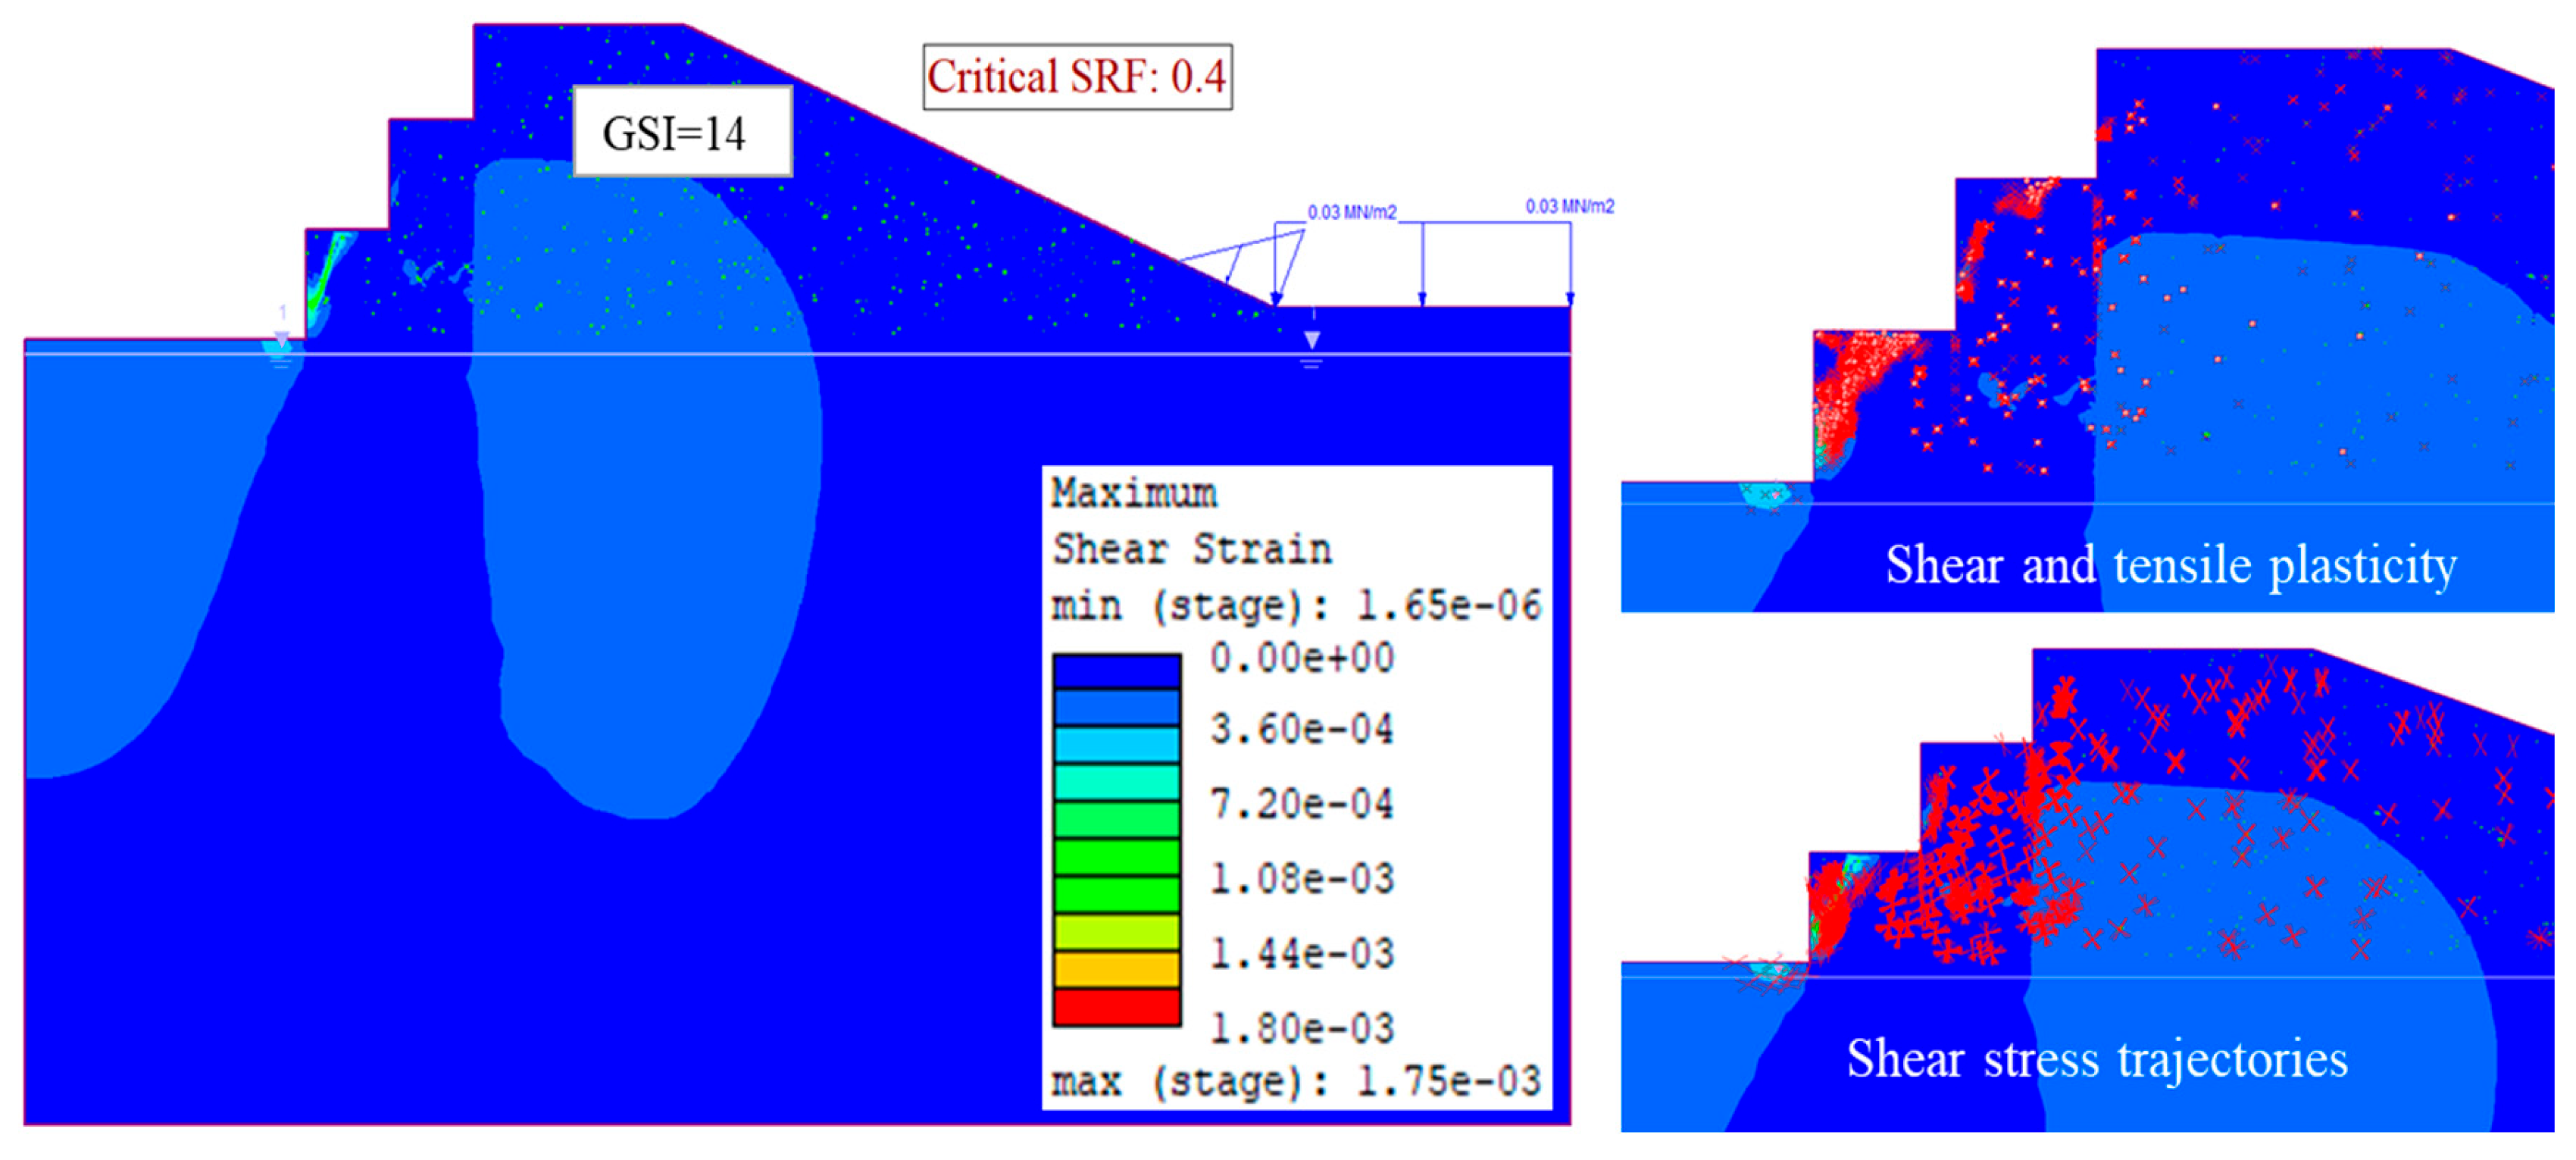
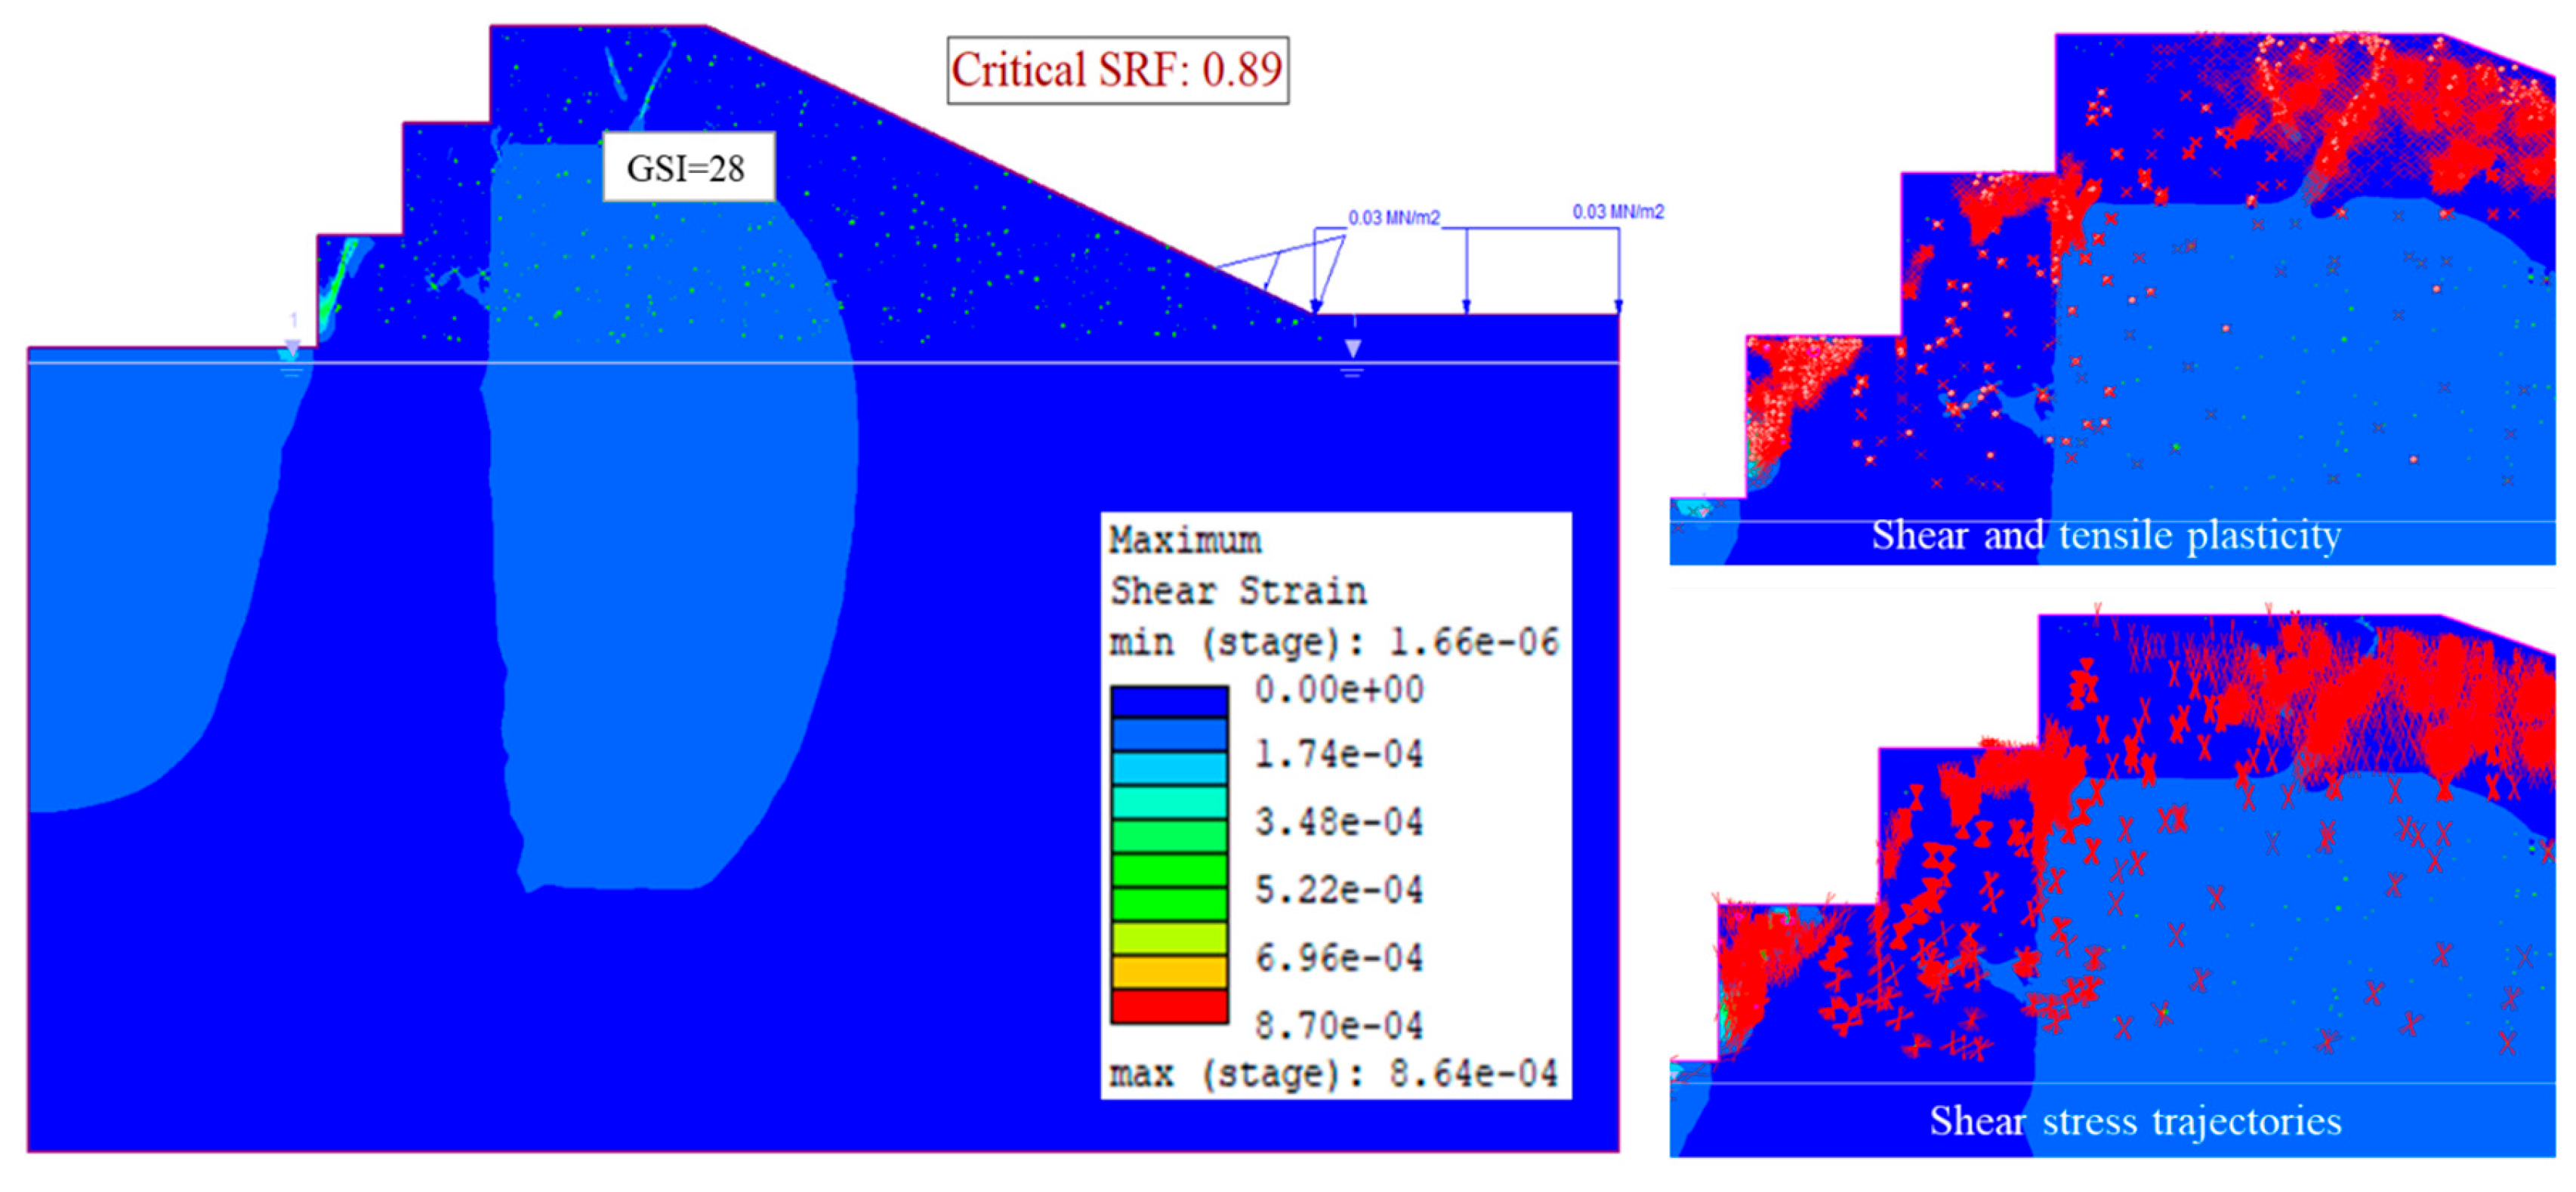
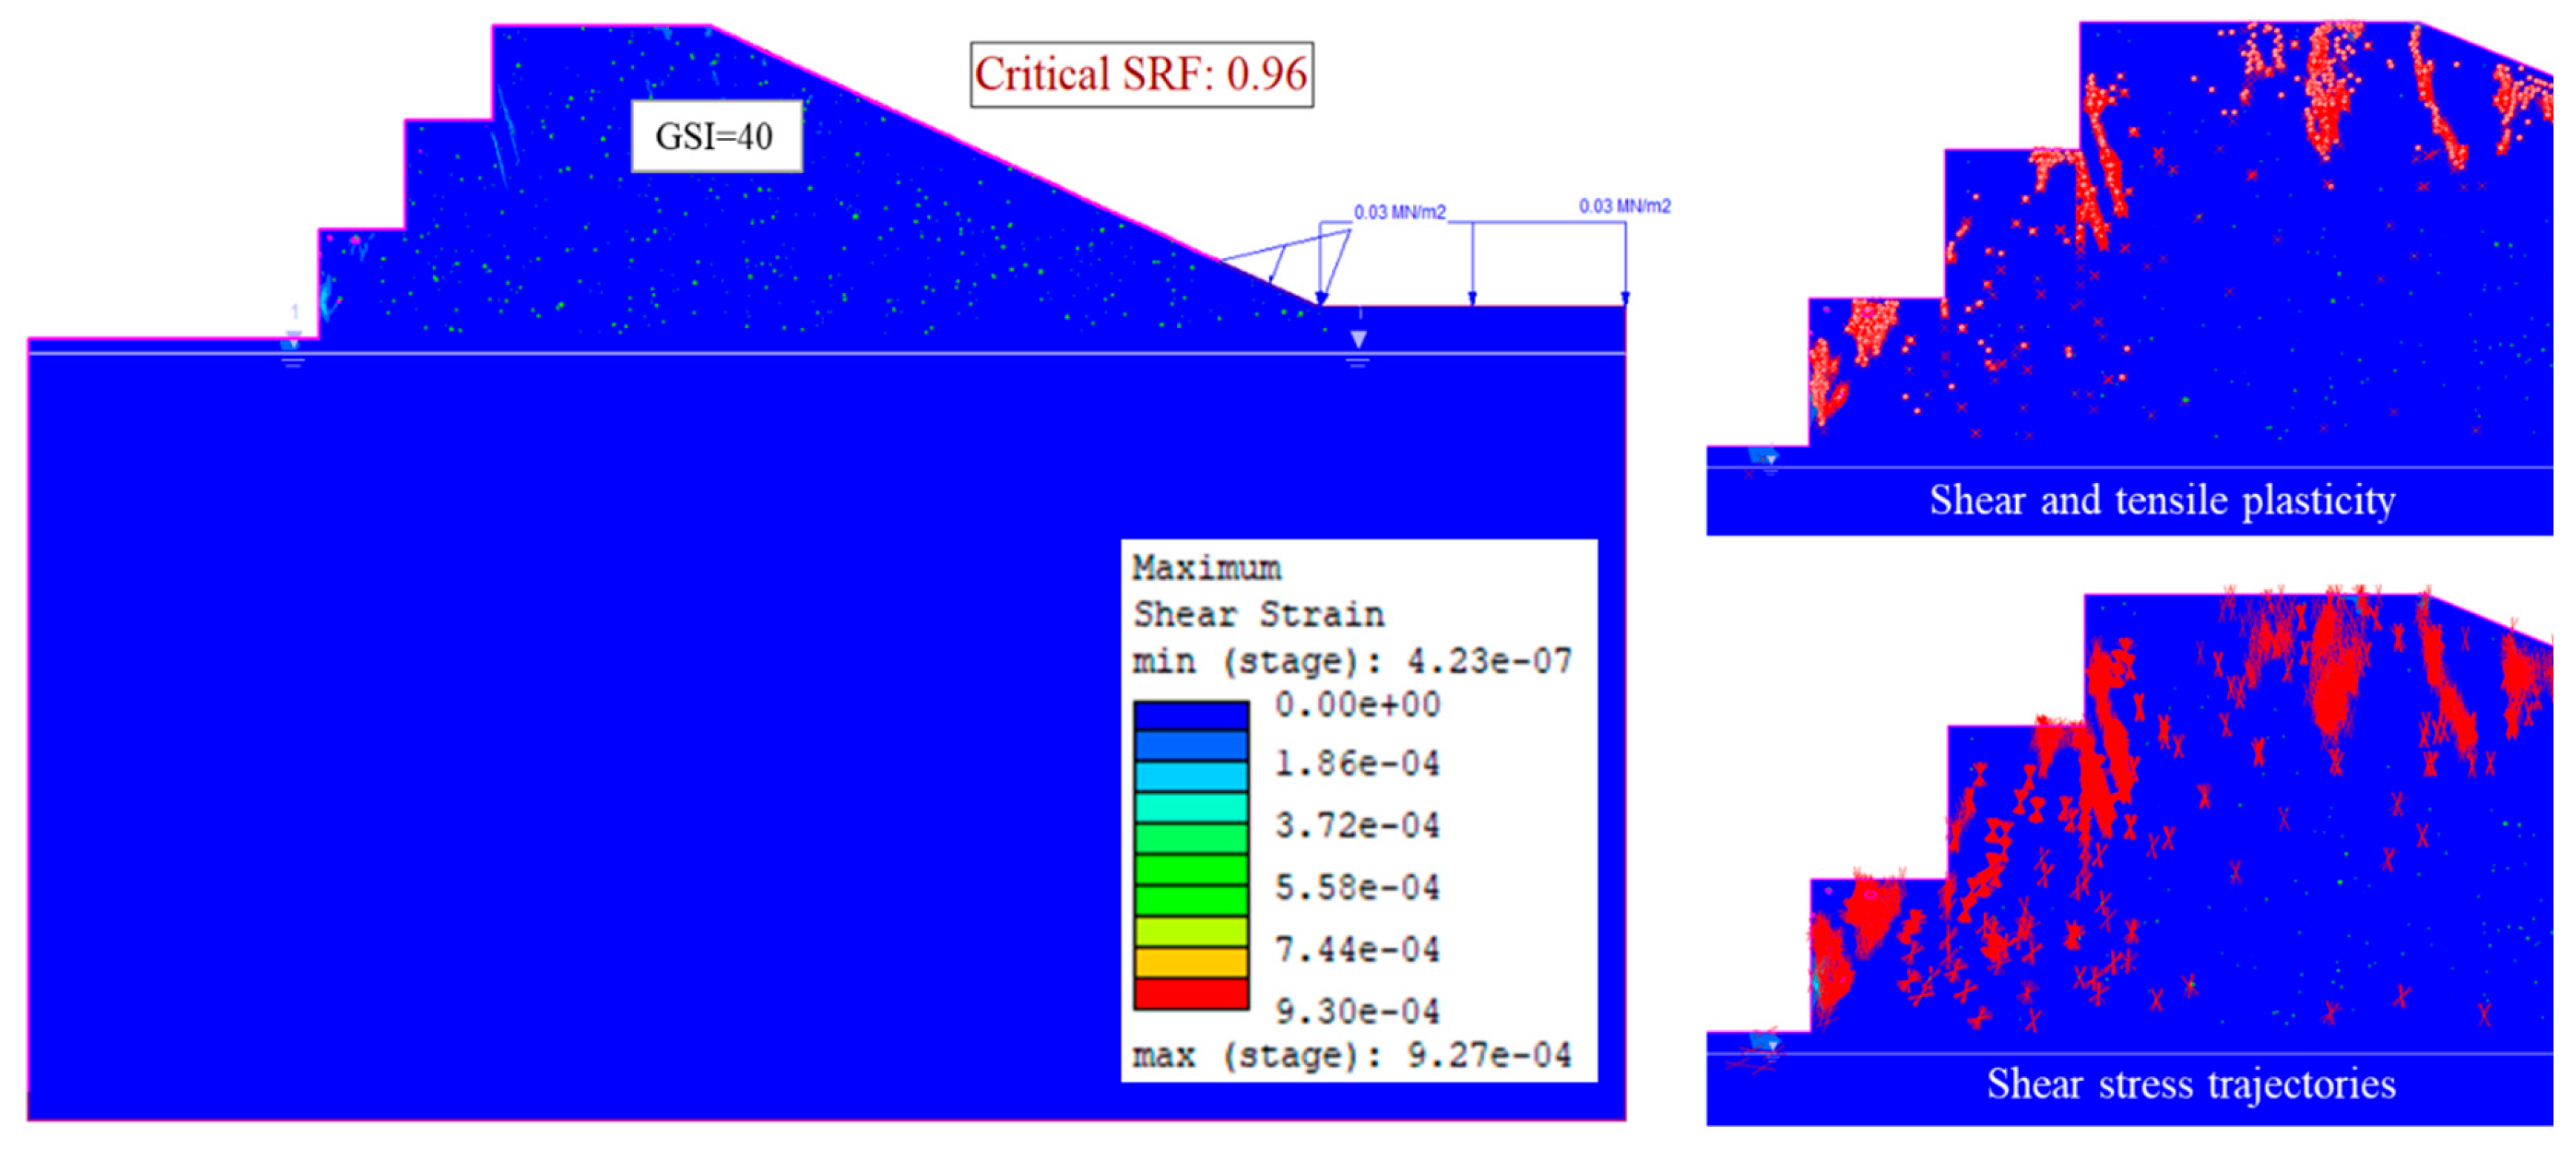
Using the original karst hollow distribution, slope stability was assessed with the Geological Strength Index (GSI) varied from 14 to 28 and 40. The safety factor increases with increasing GSI. Failure planes, as indicated by shear stress trajectories in Figure 20 and Figure 21, are more distinct and closely spaced when GSI is below 30. The safety factor remains below unity even at GSI 40 (Figure 22) when the geological structure and seepage conditions are considered.

3.7. Failure Modes/Failure Trajectories Observed

Plasticity nephograms were analyzed to identify failure modes associated with various sizes and distributions of karst hollows.

3.7.1. Failure in Set A

Set A comprises karst hollows with equivalent diameters from 0.02 m to 0.05 m. Shear strain plots (Figure 23) show how stress conditions change as hollow density increases. Shear and tensile plasticity develop in the bottom-most bench. As hollow density increases, a secondary shear plane develops at d = 1%. Failure trajectories indicate planar failure on the bottom bench, with circular failure planes also visible at both bench and slope scale. The number of failure planes increases with hollow density. Vertical shear planes, associated with vertical seepage paths, are also observed.

3.7.2. Failure in Set B

Set B includes a wide range of hollow sizes (0.02 m to 1 m). In addition to the well-defined shear plane on the lowest bench, additional shear planes develop at the toe of the uppermost bench (Figure 24). At d = 1%, intersecting shear planes suggest the potential for large rock blocks to dislodge, resulting in rockfalls. Circular failure planes are visible at both bench and slope scale, though they are more scattered compared to Set A. Shear planes starting and terminating far behind the slope highlight the unpredictable nature of karst rock masses. Vertical shear planes from seepage are also inferred.

3.7.3. Failure in Set C

Set C evaluates slightly larger hollows (0.2 m, 0.5 m, and 1 m). Shear strain plots (Figure 25) show that shear planes are largely controlled by hollow location. At d = 0.5%, a shear plane develops on the second bench, emanating from a hollow on the bench face. At d = 1%, the shear plane follows a series of hollows. At d = 0.1%, the shear plane is nearly absent. The plasticity zone around hollows extends significantly, indicating their influence extends beyond their immediate location.

3.7.4. Failure in Set D

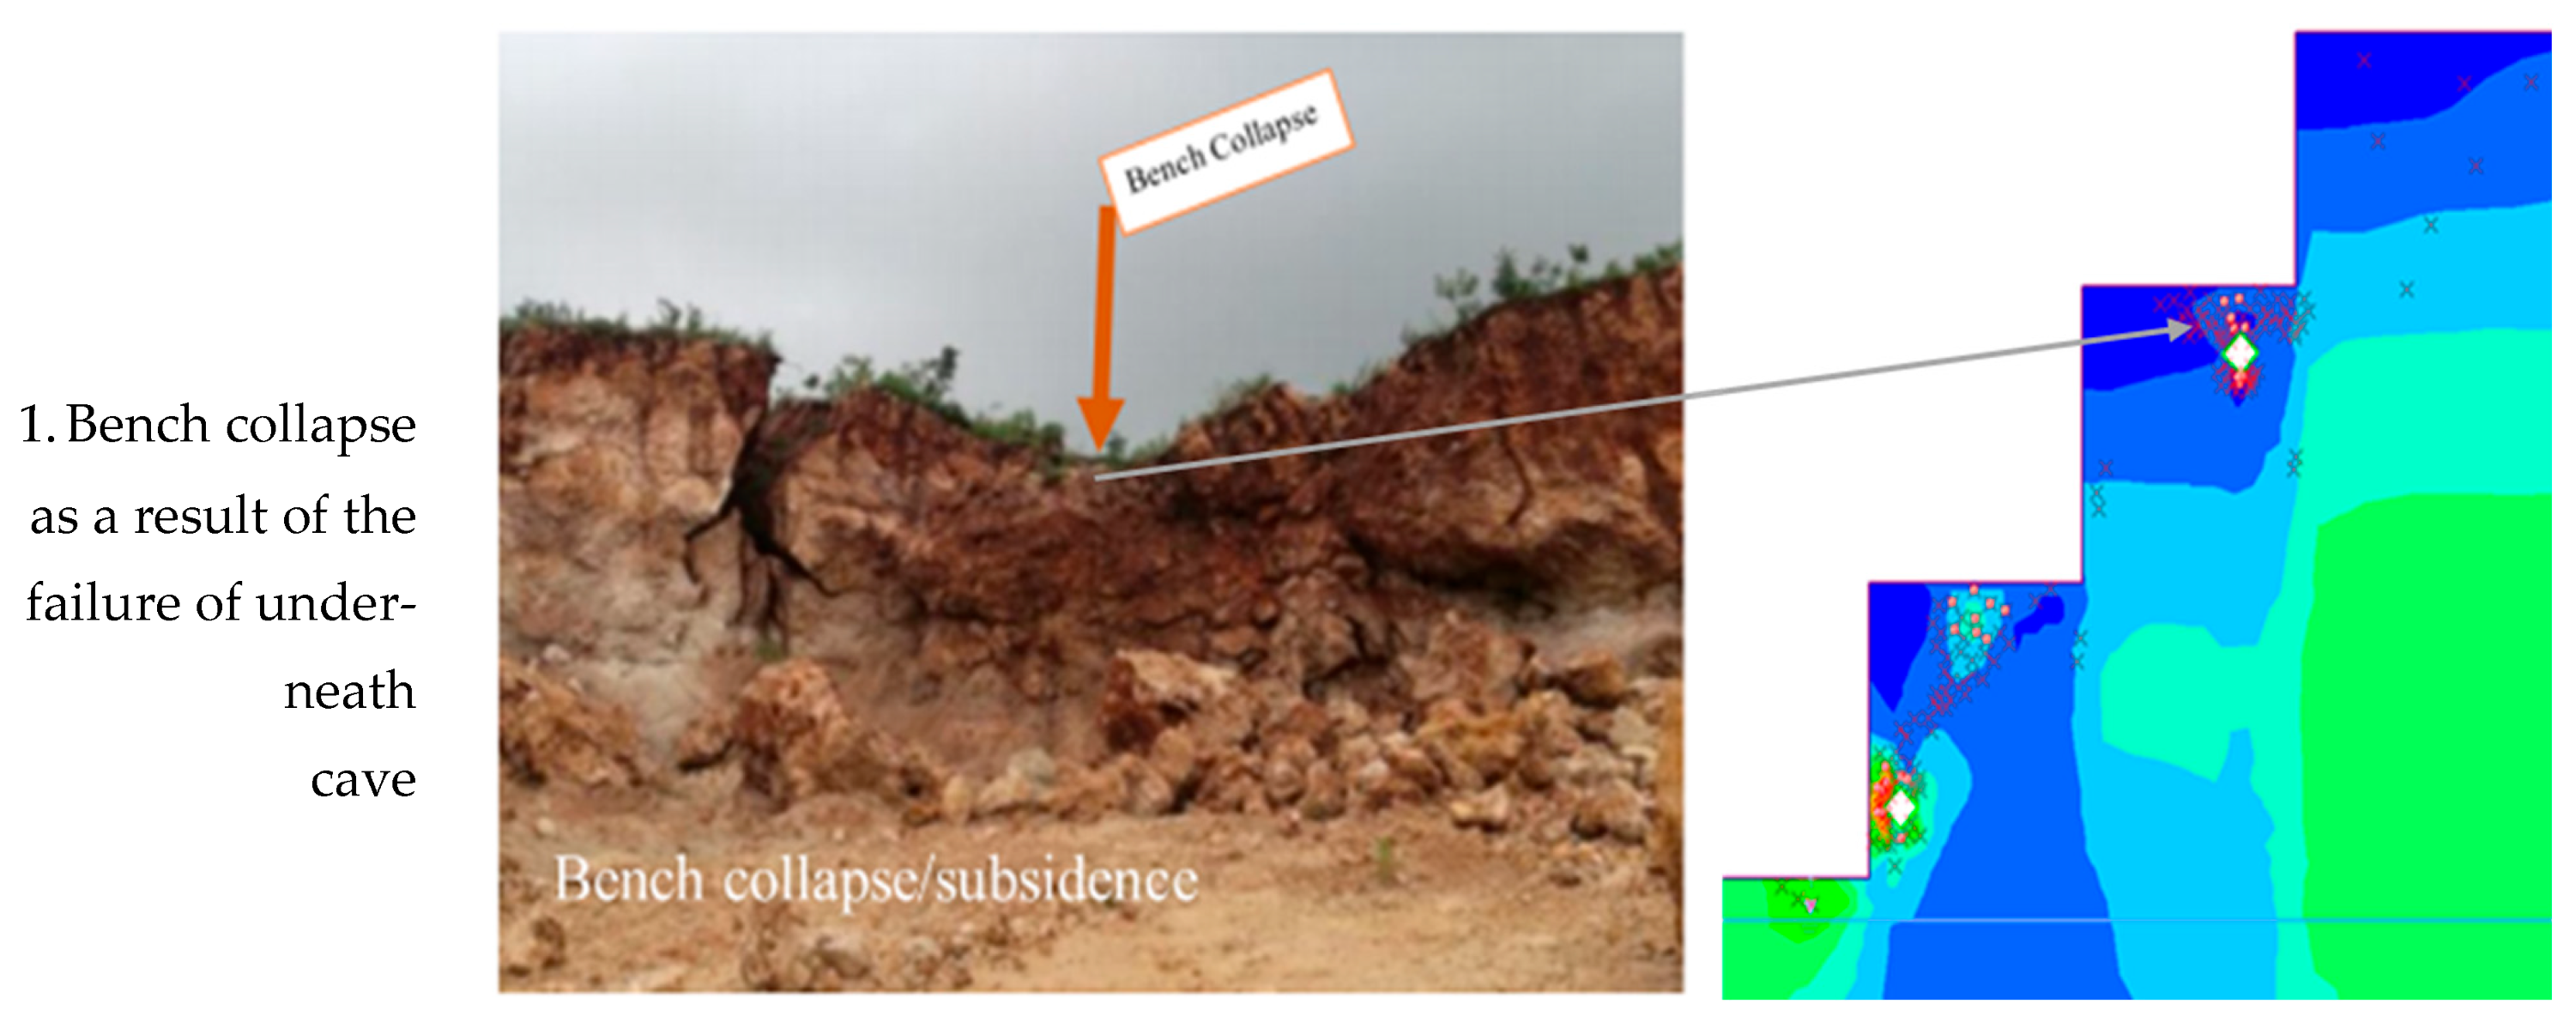
With set D, we test the impact of the large hollows of 1 m diameter. Shear planes are not well defined here, except those directly linked to the karst hollows. As can be seen from Figure 26, the hollows directly below the benches have their plasticity fields extending right up to the benches, meaning that if the cave collapses, a subsidence will happen on the bench. The large hollows on the bench faces also lead to material sliding when they collapse.

3.8. Correlation of Numerical Results with Field Observations

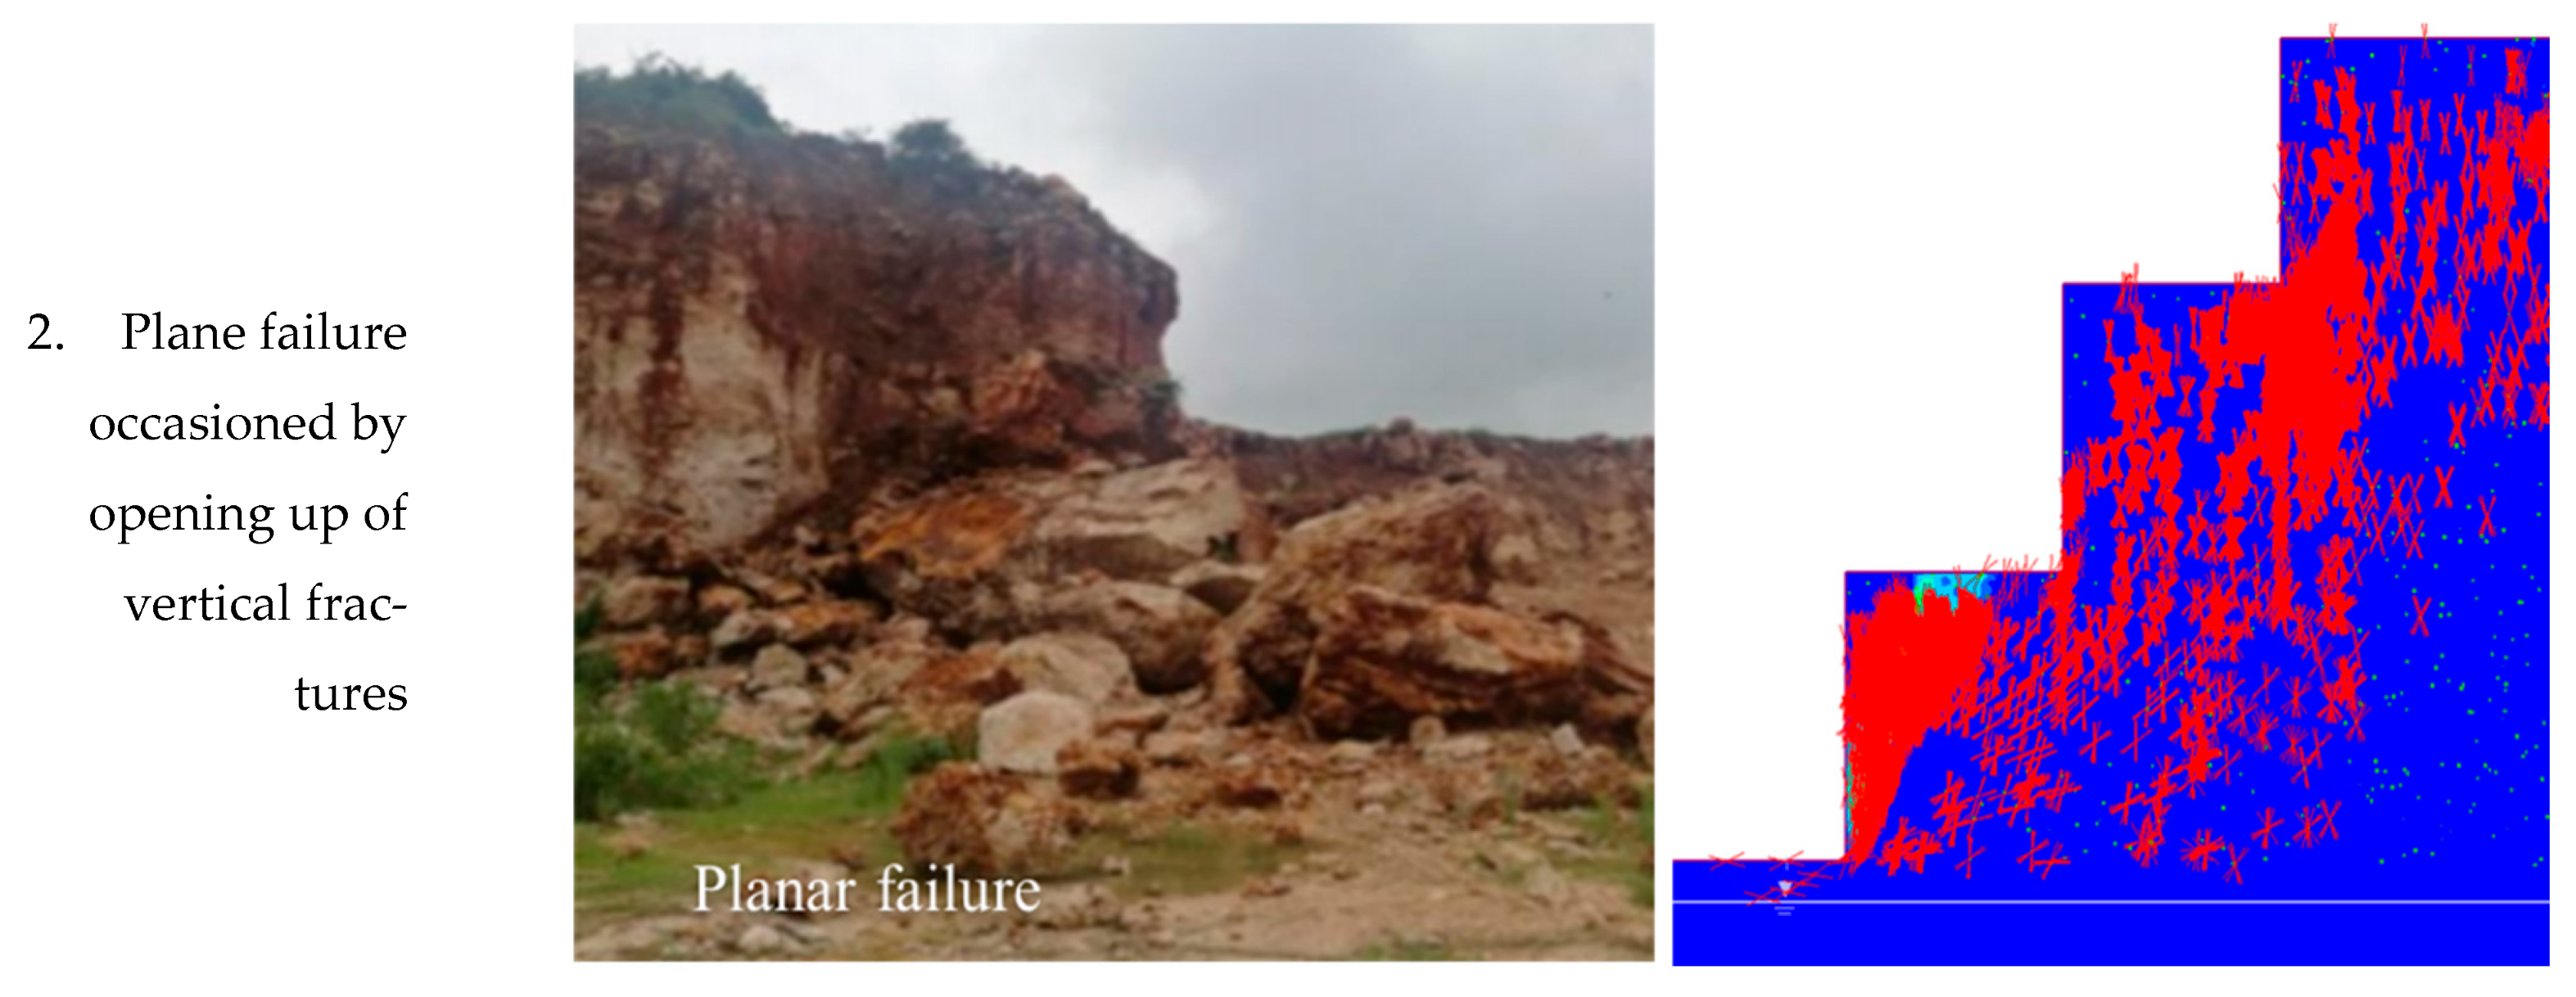
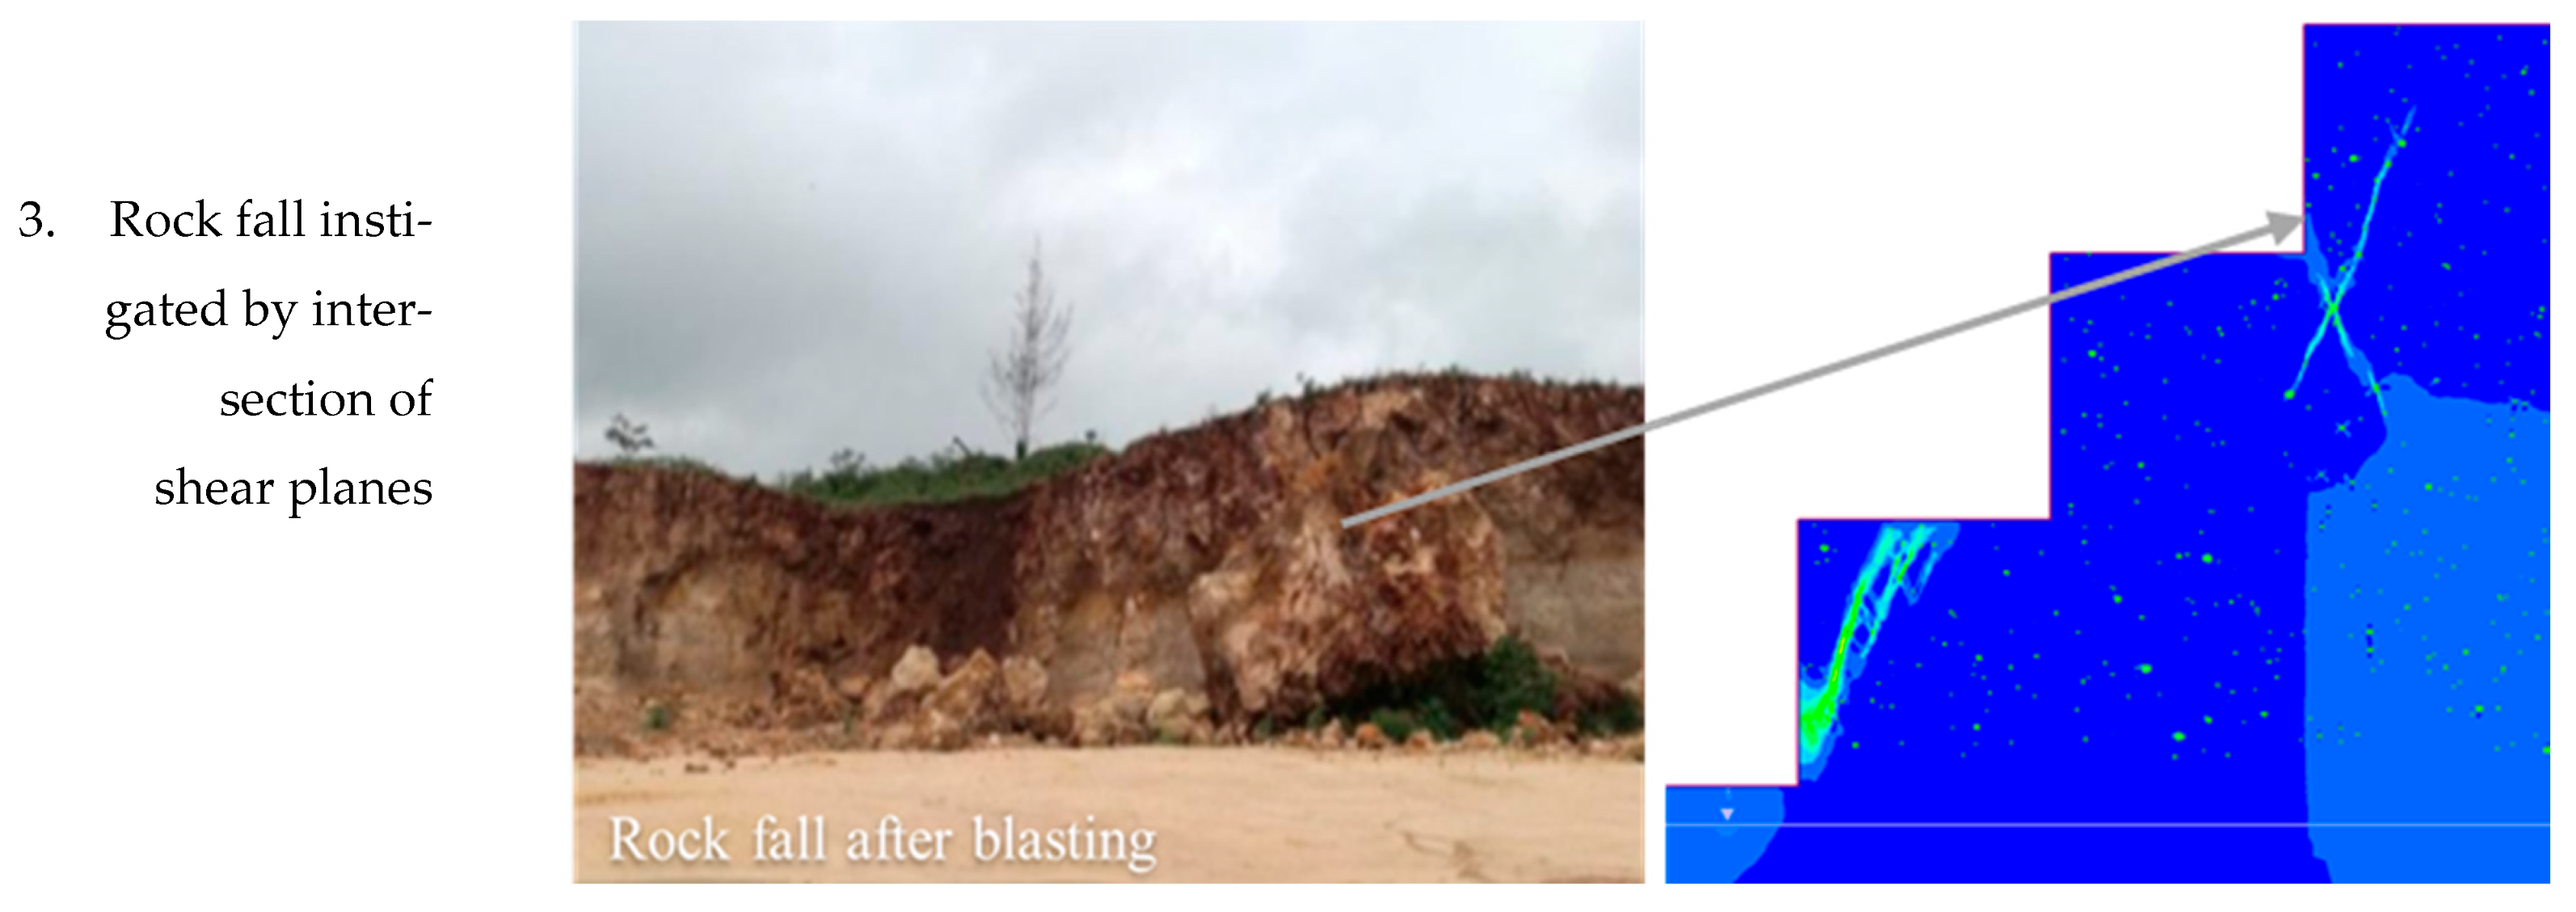
Stress analysis results reveal shear and tensile failure through plasticity indicators. Several instabilities reported in the Vipingo quarry are reflected in the analysis, including bench subsidence (Figure 27), planar failure (Figure 28), and rockfall (Figure 29).

4. Discussion

The results of this study clearly demonstrate that small-sized karst hollows, often disregarded in conventional slope stability analyses, exert a substantial influence on the mechanical behavior of weak rock slopes. The systematic reduction in the factor of safety (FoS) with increasing void density and size confirms that even sub-meter cavities must be considered critical discontinuities when assessing slope stability in karst-affected weak rock terrains.

4.1. General Impact of Karst Hollows on Slope Stability

This study explored a method for modeling small-sized karst hollows as an equivalent porous medium in slope stability analysis. The objective was to evaluate the impact of small-sized karst hollows (0.02–1 m diameter) on the stability of weak rock slopes. For the slope section analyzed, a hollow density of 0.1% was measured as the fraction of slope area covered by karst cavities. Stress analysis shows that the slope with a karst hollows matrix (Figure 15) has a safety factor of 0.85, lower than the slope without karst (1.01; Figure 13). In the absence of karst hollows, a potential failure plane develops only on the lower bench, and maximum shear strain is lower than in the case with hollows. When karst hollows are present, high-strain zones appear within the slope, indicating propagation of failure surfaces as shear strain fields around the hollows spread and coalesce. This phenomenon mirrors observations from compression tests on porous rock samples, where failure planes propagate through pore spaces [42,43]. Development of a failure plane on the bottom-most bench suggests that unloading is necessary to reduce shear strains. The failure plane developing on the bottom-most bench means the slope needs to be unloaded to reduce the shear strains. The equivalent porous medium approach enables upscaling of rock mass porosity by capturing small-sized hollows that are undetectable by geophysical methods yet too small for sample-scale analysis. The marked reduction in safety factor underscores that small-sized karst hollows cannot be neglected in weak rock masses.

4.2. Combined Impact of Karst Hollows and Water Seepage

Several slope instabilities in the quarry have been reported during the rainy season. Slopes are more prone to instability under wet conditions due to decreased shear strength resulting from increased pore water pressure [44]. In some cases, elevated pore water pressure can offset part of the rock mass weight, reducing effective stresses and slightly increasing the safety factor. Previous work by the authors [39] on the influence of ocean water on slope stability found that the safety factor remained nearly unchanged or slightly increased for pit depths up to 20 m. This trend is reflected in the current analysis, where the safety factor increases under seepage boundary conditions, even in the presence of karst hollows—indicating higher pore water pressure and reduced effective stress. This effect is particularly notable for small-sized karst hollows.
Seepage analysis further revealed the destabilizing effect of groundwater in weak, karstified rock. The modeled drop in FoS by over 20% under saturated conditions is consistent with the established role of pore pressure in reducing effective stress and promoting progressive failure in porous media [45,46]. Karst voids act as preferential flow paths, accelerating saturation and enhancing hydraulic connectivity between otherwise isolated weak zones. This hydro-mechanical interaction highlights the necessity for dual-process modeling in karst-prone environments, especially in coastal or tropical regions with seasonal infiltration. The EPM-based seepage simulations provide a realistic and computationally tractable means of capturing this coupled behavior.

4.3. Variation of Karst Hollows Sizes and Densities

A parametric analysis was conducted to evaluate the significance of variations in karst cavity size and density on slope stability. The changes in safety factor for various hollow sizes and densities shown in Table 3 are depicted in Figure 30. The results show a general trend of decreasing safety factor with increasing hollow density for larger hollows (diameter >0.2 m, Set C). For 1 m diameter hollows (Set D), the safety factor drops sharply at 1% density. For hollows below 0.2 m diameter, changes in safety factor are relatively minor and even slightly increase at 1% density (sets A and B). This suggests that slopes with smaller karst hollows behave more homogeneously, with general strength reduction and less well-defined shear planes. In contrast, larger hollows localize high-strain points, resulting in greater safety factor reduction and the formation of well-defined shear planes as strain fields coalesce. The location of larger hollows relative to benches is also critical; a cavity near the bench or slope face results in a lower safety factor than one located farther within the slope.

4.4. Relationship Between Karst Hollows and GSI

To further assess the impact of karst hollows at different rock strengths, slope behavior was analyzed at GSI values of 14, 28, and 40. The safety factor increased steadily with rising GSI, indicating that at higher rock mass strengths, the influence of karst hollows on strength reduction is less critical. The impact of water seepage is also diminished as rock mass strength increases. Thus, small-sized karst hollows (<1 m diameter) are most concerning within the weak rock strength range.
These findings align with those of Wang et al. [47], who reported that void clustering in porous rock specimens leads to stress concentration and premature failure. In the field-scale model, increasing void density reduced effective solid volume and disrupted stress paths, resulting in both reduced shear resistance and increased deformation potential. The observation that larger voids produce disproportionately larger failure zones, especially when coalescing, supports the hypothesis that cavity size governs both local weakening and the extent/type of failure propagation [48].
The transition from stable to unstable slope configurations at void diameters >50 cm suggests a critical threshold for mechanical integrity, consistent with Han et al. [23], who emphasized the importance of void scale in the elastic and failure response of porous media. This study extends those findings by showing that even 10 cm voids, if sufficiently dense, can destabilize entire slope segments.

4.5. Failure Mode Evolution

Analysis of stress nephograms, yielded elements, and stress trajectories enables identification of possible failure modes. Previous research on porous rock samples indicates that failure planes follow the hollows, corroborating this study’s findings, where shear stresses concentrate around karst hollows and shear planes are defined by the joining of strain fields. Planar failure is likely when karst hollows are small (diameter <0.5 m) and numerous, as these behave similarly to a homogeneous material with closely spaced stress trajectories. Larger hollows (>0.5 m) can lead to surface subsidence when they collapse, especially if located near benches. Bench subsidence, observed in Figure 27 and caused by the collapse of underlying caves, is evident from shear strain plots where the plasticity field extends to the bench surface. Failure planes may intersect, isolating rock blocks that can detach from the slope after blasting or other triggers. In addition to intersecting shear planes, vertical shear paths—indicative of vertical seepage or water-formed fissures—are also observed.
The distinct failure modes identified—circular slip, localized subsidence, and rockfall—demonstrate how void spatial distribution controls the mechanical response of the slope. Circular failure zones under low-density, small-void conditions suggest progressive weakening via shear band propagation around isolated defects. Subsidence under high-density, large-void conditions indicates void coalescence and collapse, akin to sinkhole-prone terrains [49].
The emergence of rockfall potential near the slope crest, particularly under seepage conditions, is a significant practical concern. Such failures result from tensile cracking and toppling at void edges—a mechanism often excluded from simplified limit equilibrium analyses but well captured in finite element modeling.

4.6. Influence of Fractures on Rock Mass Response

While this study focuses on the destabilizing effect of distributed karst voids, it is important to acknowledge the significant role of natural fractures in slope behavior. Fracture networks influence tensile splitting, stress redistribution, and failure modes, particularly under dynamic or rate-dependent loading conditions. Recent numerical studies (e.g., Zhang et al. [22] have shown that fractures can control tensile failure and fragmentation using particle-based modeling. Qiu et al. [50] used a combined BPM-DFN approach to investigate the rate-dependent tensile behavior in jointed rock masses, highlighting the interaction between geological conditions and failure mechanics. Although fracture networks were not explicitly modeled here, future work could couple the EPM framework with discrete fracture representations to simulate the combined influence of porosity and discontinuities in weak rock slopes.

4.7. Measures for Improving Slope Stability

This study highlights that rock strength, structure, and water seepage are key factors affecting slope stability in weak carbonate rock masses. Improving slope stability should focus on enhancing shear strength and protecting the slope from water-induced degradation. One approach is the use of deep-rooted plants, whose fibrous roots bind rock particles, forming a rock-root system with higher shear strength than bare rock. Root binding also reduces permeability, minimizing the erosive effects of seepage [51,52]. Analysis shows that the benches are highly susceptible to failure; thus, maintaining gentle bench faces during mining is recommended to reduce slope loading [53,54,55]. Practice can help mitigate planar failures and rockfalls, as corroborated by recent studies emphasizing the importance of bench geometry and face angle in quarry slope stability.

4.8. Limitations and Future Work

4.8.1. Challenges Encountered

Some practical and computational challenges were encountered:
The primary challenge was balancing modeling complexity with computational feasibility. RS2’s import of detailed karst geometries from DXF files resulted in numerous vertices, making the model bulky and slowing the simulation. Some models crashed at the onset of simulation. To address this, the number of vertices was reduced, preserving total area but simplifying shape, which may have slightly affected local stress redistribution.
At higher void densities (>1%), simulations struggled to converge due to geometric complexity from closely packed voids, causing mesh distortion and localized strain accumulation. This limited the range of densities that could be practically simulated.

4.8.2. Recommendations for Future Work

Future studies should further investigate the effect of void shape. While this study focused on void area, comparing circular, elliptical, or irregular shapes could clarify how geometry influences local stress redistribution and failure propagation.
Coupling the EPM approach with discrete fracture models would be valuable, especially where joints and cavities interact, to simulate failure more realistically in anisotropic or fractured rock masses.
Machine learning algorithms could be trained on existing karst data to identify spatial patterns and inform stochastic generation of void fields in numerical models, reducing manual parameterization and increasing representativeness.

5. Conclusions

This study demonstrates the critical role of small-sized karst hollows in controlling the stability of slopes within weak carbonate rock masses. By employing the equivalent porous medium (EPM) approach within a finite element modeling framework, we systematically quantified the effects of cavity size, density, and seepage conditions on slope failure mechanisms.
The results reveal that even voids as small as 2–10 cm, when sufficiently dense, can reduce the factor of safety below acceptable limits. Larger or more densely clustered voids trigger more complex and hazardous failure modes, including subsidence, coalescing shear planes, and rockfalls. The presence of seepage further destabilizes the slope by reducing effective stress and accelerating the onset of failure.
The EPM-based modeling methodology introduced here provides a robust, practical, and computationally efficient means of incorporating the distributed impacts of karstification into slope stability analysis. When calibrated with site-specific data, this approach substantially enhances the reliability of geotechnical assessments in karst-prone environments.
Looking ahead, integrating this framework with probabilistic analysis or three-dimensional modeling could yield even deeper insights, particularly in highly heterogeneous or hydrogeologically dynamic settings. The EPM approach also shows promise for broader applications, such as stability assessments of tailings dams and underground excavations affected by minor voiding.

Author Contributions

Conceptualization, methodology, and formal analysis, J.A.O.; writing, D.M. and J.A.O.; supervision and funding acquisition, T.S., H.S., and A.H.; software and resources, A.H. All authors have read and agreed to the published version of the manuscript.

Funding

The research work is part of a doctoral program sponsored by JICA FY 2023/2024.

Data Availability Statement

All data generated or analyzed during this study are included in this published article.

Acknowledgments

The authors express their sincere gratitude to JICA for the scholarship funding that facilitated this research work. The contribution of Vipingo quarry in providing the information and data that enabled the conceptualization of this research work is sincerely appreciated.

Conflicts of Interest

The authors declare no conflicts of interest in this study.

References

  1. Chalikakis, K.; Plagnes, V.; Guerin, R.; Valois, R.; Bosch, F.P. Contribution of geophysical methods to karst-system exploration: An overview. Hydrogeol. J. 2011, 19, 1169–1180. [Google Scholar] [CrossRef]
  2. El Aal, A.A. Identification and characterization of near surface cavities in Tuwaiq Mountain Limestone, Riyadh, KSA, “detection and treatment”. Egypt. J. Pet. 2017, 26, 215–223. [Google Scholar] [CrossRef]
  3. Yilmaz, I.; Marschalko, M.; Bednarik, M. Gypsum collapse hazards and importance of hazard mapping. Carbonates Evaporites 2011, 26, 193–209. [Google Scholar] [CrossRef]
  4. Parise, M.; Ravbar, N.; Živanović, V.; Mikszewski, A.; Kresic, N.; Mádl-Szőnyi, J.; Kukurić, N. Hazards in Karst and Managing Water Resources Quality. In Karst Aquifers—Characterization and Engineering; Stevanović, Z., Ed.; Professional Practice in Earth Sciences; Springer: Cham, Switzerland, 2015. [Google Scholar]
  5. Kuhn, A.K. Geotechnical considerations in surface mine reclamation. In Mining and Reclamation in the Next Millennium, Proceedings of the 16th Annual National Meeting of the American Society for Surface Mining Reclamation, Scottsdale, AZ, USA, 1 July 1999; American Society for Surface Mining and Reclamation: Blacksburg, VA, USA, 1999. [Google Scholar]
  6. Youssef, A.M.; El-Shater, A.-H.; El-Khashab, M.H.; El-Haddad, B.A. Karst Induced Geo-hazards in Egypt: Case Study Slope Stability Problems Along Some Selected Desert Highways. In Engineering Geology and Geological Engineering for Sustainable Use of the Earth’s Resources, Urbanization and Infrastructure Protection from Geohazards; International Congress and Exhibition Sustainable Civil Infrastructures: Innovative Infrastructure Geotechnology; Springer: Cham, Switzerland, 2017. [Google Scholar]
  7. Jiang, J.; Zhang, Z.; Wang, D.; Wang, L.; Han, X. Web pillar stability in open-pit highwall mining. Int. J. Coal Sci. Technol. 2022, 9, 12. [Google Scholar] [CrossRef]
  8. Liu, H.; Li, Z.; Zhang, Y.; Wang, D. The weakening mechanisms of the rock mechanics of marlite bank slopes under water–rock interaction conditions. Carbonates Evaporites 2020, 35, 60. [Google Scholar] [CrossRef]
  9. Sasaoka, T.; Karian, T.; Hamanaka, A.; Shimada, H.; Matsui, K.; Ichinose, M. Effect of Mine Water on the Stability of Underground Coal Mine Roadways. Geotech. Geol. Eng. 2016, 34, 671–678. [Google Scholar] [CrossRef]
  10. Supandi. The Influence of Water Balance for Slope Stability on the High Mine Waste Dump. Geotech. Geol. Eng. 2021, 39, 5253–5266. [Google Scholar] [CrossRef]
  11. Jele, R.; Dunn, M. Economic Significance of Geotechnical Uncertainties In MGR 2019, Proceedings of the First International Conference on Mining Geomechanical Risk; Australian Centre for Geomechanics: Perth, Australia, 2019. [Google Scholar]
  12. Kannan, R.C. Designing Foundations Around Sinkholes. Eng. Geol. 1999, 52, 75–82. [Google Scholar] [CrossRef]
  13. Al-Halbouni, D.; Holohan, E.P.; Taheri, A.; Schöpfer, M.P.J.; Emam, S.; Dahm, T. Geomechanical modelling of sinkhole development using distinct elements. Solid Earth 2018, 9, 1341–1373. [Google Scholar] [CrossRef]
  14. Ford, D.C.; Ewers, R.O. The development of limestone cave systems in the dimensions of length and depth. Can. J. Earth Sci. 1978, 15, 1783–1798. [Google Scholar] [CrossRef]
  15. El Aal, A.K.A.; Nabawy, B.S.; Aqeel, A.; Abidi, A. Geohazards assessment of the karstified limestone cliffs for safe urban constructions, Sohag, West Nile Valley, Egypt. J. Afr. Earth Sci. 2020, 161, 103671. [Google Scholar] [CrossRef]
  16. Onyango, J.A.; Moses, D.N. Karst-Induced Geoharzards in Kenya’s Coastal Region: A Case Study of Vipingo Coral Limestone Quarry. Eur. J. Environ. Earth Sci. 2021, 2, 5–17. [Google Scholar] [CrossRef]
  17. Andriani, G.F.; Parise, M. On the applicability of geomechanical models for carbonate rock masses interested by karst processes. Environ. Earth Sci. 2015, 74, 7813–7821. [Google Scholar] [CrossRef]
  18. Fleurisson, J.-A. Slope Design and Implementation in Open Pit Mines: Geological and Geomechanical Approach. Procedia Eng. 2012, 46, 27–38. [Google Scholar] [CrossRef]
  19. Fleurisson, J.-A.; Cojean, R. Error Reduction in Slope Stability Assessment. In Surface Mining Methods, Technology and Systems; Wide: Fontainebleau, France, 2014; Volume 1, p. 41. [Google Scholar]
  20. Shapka-Fels, T.; Elmo, D. Numerical Modelling Challenges in Rock Engineering with Special Consideration of Open Pit to Underground Mine Interaction. Geosciences 2022, 12, 199. [Google Scholar] [CrossRef]
  21. Zhang, Y.; Xia, Z.; Jiang, Y.; Chen, M.; Liu, J.; Yin, Q. Effect of Hole Density and Confining Pressure on Mechanical Behavior of Porous Specimens: An Insight from Discrete Element Modeling. Comput. Model. Eng. Sci. 2020, 125, 259–280. [Google Scholar] [CrossRef]
  22. Han, Y.; Hu, D.; Matzar, L. Numerical computation of elastic properties for porous rocks based on CT-scanned images using direct mapping method. J. Pet. Sci. Eng. 2014, 122, 346–353. [Google Scholar] [CrossRef]
  23. Hertel, S.A.; Rydzy, M.; Anger, B.; Berg, S.; Appel, M.; Jong, H.D. Upscaling of Digital Rock Porosities by Correlation with Whole-Core CT-Scan Histograms. Petrophysics SPWLA J. Form. Eval. Reserv. Descr. 2018, 59, 694–702. [Google Scholar] [CrossRef]
  24. Liu, S.; Wang, H.; Xu, W.; Cheng, Z.; Xiang, Z.; Xie, W.-C. Numerical Investigation of the Influence of Rock Characteristics on the Soil-Rock Mixture (SRM) Slopes Stability. KSCE J. Civ. Eng. 2020, 24, 3247–3256. [Google Scholar] [CrossRef]
  25. Zhang, K.; Cao, P.; Ma, G.; Fan, W.; Meng, J.; Li, K. A New Methodology for Open Pit Slope Design in Karst-Prone Ground Conditions Based on Integrated Stochastic-Limit Equilibrium Analysis. Rock Mech. Rock Eng. 2016, 49, 2737–2752. [Google Scholar] [CrossRef]
  26. Li, B.; Lin, Z.; Chen, Y.; Xu, C.; Li, P.; Ding, H. Numerical analysis for supporting and deformation of complex foundation pit groups in unstable areas of karst strata. Front. Earth Sci. 2023, 11, 1283184. [Google Scholar] [CrossRef]
  27. Zou, Y.; Tang, Q.; Peng, L. Stability Analysis and Instability Time Prediction of Tunnel Roofs in a Karst Region Based on Catastrophe Theory. Appl. Sci. 2025, 15, 978. [Google Scholar] [CrossRef]
  28. Sheng, M.; Lu, F.; Jiang, N.; Guo, P.; Li, X.; An, R.; Wang, Y. Bearing behavior of pile foundation in karst region: Physical model test and finite element analysis. Appl. Rheol. 2024, 34, 20230115. [Google Scholar] [CrossRef]
  29. Wang, F.; Zhai, W.; Man, J.; Huang, H. A hybrid cohesive phase-field numerical method for the stability analysis of rock slopes with discontinuities. Can. Geotech. J. 2025, 62, 1–16. [Google Scholar] [CrossRef]
  30. Aminpour, M.; Alaie, R.; Khosravi, S.; Kardani, N.; Moridpour, S.; Nazem, M. Slope stability machine learning predictions on spatially variable random fields with and without factor of safety calculations. Comput. Geotech. 2023, 153, 105094. [Google Scholar] [CrossRef]
  31. Zhang, M.; Wei, J. Analysis of Slope Stability Based on Four Machine Learning Models: An Example of 188 Slopes. Period. Polytech. Civ. Eng. 2025, 69, 505–518. [Google Scholar] [CrossRef]
  32. Onyango, J.A. Rock Mass Classification of Limestone Considering Karst Formation and Its Application to Evaluation of Slope Stability in Open Pit Limestone Quarry. Ph.D. Thesis, Kyushu University Institutional Repository, Fukuoka, Japan, 2024. [Google Scholar]
  33. Bishop, A.W. The use of the Slip Circle in the Stability Analysis of Slopes. Geotech. 1955, 5, 7–17. [Google Scholar] [CrossRef]
  34. Aladejare, A.E.; Akeju, V.O. Design and Sensitivity Analysis of Rock Slope Using Monte Carlo Simulation. Geotech. Geol. Eng. 2019, 38, 573–585. [Google Scholar] [CrossRef]
  35. Sasowsky, I.; Bishop, M. Empirical Study of Conduit Radial Cross-Section Determination and Representation Methods On Cavernous Limestone Porosity Characterization. J. Cave Karst Stud. 2006, 68, 130–136. [Google Scholar]
  36. Jouves, J.; Viseur, S.; Arfib, B.; Baudement, C.; Camus, H.; Collon, P.; Guglielmi, Y. Speleogenesis, geometry, and topology of caves: A quantitative study of 3D karst conduits. Geomorphology 2017, 298, 86–106. [Google Scholar] [CrossRef]
  37. Martin, D.; Stacey, P. Guidelines for Open Pit Slope Design in Weak Rocks; CRC Press; Taylor & Francis Group: New York, NY, USA, 2018. [Google Scholar]
  38. Rocscience. Stress Trajectories. 2023. Available online: https://www.rocscience.com/help/rs2/documentation/rs2-interpret/viewing-and-display-options/stress-trajectories (accessed on 9 September 2023).
  39. Onyango, J.A.; Sasaoka, T.; Shimada, H.; Hamanaka, A.; Moses, D. Stability Assessment of the Slopes of an Oceanside Coral Limestone Quarry under Drawdown Condition of Semidiurnal Ocean Tides. Mining 2022, 2, 589–615. [Google Scholar] [CrossRef]
  40. Wu, D.; Shen, F. Stability assessment of coastal clay slopes considering strength nonlinearity and sea level drawdown. Mar. Georesour. Geotechnol. 2023, 41, 476–492. [Google Scholar] [CrossRef]
  41. Vacher, H.L.; Bengtsson, T.O. Effect of Hydraulic Conductivity on the Residence Time of Meteoric Ground Water in Bermudian and Bahamian-type Islands. In Proceedings of the Fourth Symposium on the Geology of the Bahamas, San Salvador, Bahamas, 17–22 June 1988. [Google Scholar]
  42. Zengin, E.; Erguler, Z.A. Experimental investigation of pore-fracture relationship on failure behaviour of porous rock materials. Bull. Eng. Geol. Environ. 2022, 81, 351. [Google Scholar] [CrossRef]
  43. Lee, H.J.; Locat, J.; Desgagnés, P.; Parsons, J.D.; McAdoo, B.G.; Orange, D.L.; Pere, P.; Wong, F.L.; Dartnell, P.; Boulanger, E. Submarine mass movements on continental margins. In Continental Margin Sedimentation: From Sediment Transport to Sequence Stratigraphy; Blackwell Publishing: Malden, MA, USA, 2007; pp. 213–274. [Google Scholar]
  44. Yang, Y.-C.; Xing, H.-G.; Yang, X.-G.; Chen, M.-L.; Zhou, J.-W. Experimental study on the dynamic response and stability of bedding rock slopes with weak interlayers under heavy rainfall. Environ. Earth Sci. 2018, 77, 433. [Google Scholar] [CrossRef]
  45. Caldwell, J.; Robertson, A. Geotechnical stability considerations in the design and reclamation of tailings impoundments. In Geotechnical Stability in Surface Mining; CRC Press: New York, NY, USA, 2022; pp. 255–258. [Google Scholar]
  46. Hansen, L.; LaFronz, N.; Yasin, M. Stabilization of the Pinto Valley tailings impoundment slide. In Tailings and Mine Waste 2000; CRC Press: New York, NY, USA, 2022; pp. 477–487. [Google Scholar]
  47. Wang, T.; Kang, Q.; Zhang, X.; Xu, X.; Li, W.; Zhang, H. Effects of hole structure on the mechanical properties and failure characteristics of random porous sandstone under uniaxial compression test. PLoS ONE 2022, 17, e0263387. [Google Scholar]
  48. Xu, J.; Wang, Y.; Yuan, B. Stability Analysis and Support Design Methods for Rock Foundation Pit with Combination of Structural Plane and Karst Cave. Adv. Civ. Eng. 2022, 1, 5662079. [Google Scholar] [CrossRef]
  49. Martino, S.; Prestininzi, A.; Scarascia Mugnozza, G. Geological-evolutionary model of a gravity-induced slope deformation in the carbonate Central Apennines (Italy). Q. J. Eng. Geol. Hydrogeol. 2004, 37, 31–47. [Google Scholar] [CrossRef]
  50. Qiu, J.; Huang, R.; Wang, H.; Wang, F.; Zhou, C. Rate-dependent tensile behaviors of jointed rock masses considering geological conditions using a combined BPM-DFN model: Strength, fragmentation, and failure modes. Soil Dyn. Earthq. Eng. 2025, 195, 109393. [Google Scholar] [CrossRef]
  51. Hamanakaa, A.; Inouea, N.; Shimadaa, H.; Sasaokaa, T.; Matsui, K.; Miyajima, I. Design of self-sustainable land surface against soil erosion at rehabilitation areas in open-cut mines in tropical regions. Int. J. Min. Reclam. Environ. 2015, 29, 305–315. [Google Scholar] [CrossRef]
  52. Huang, B.; Hanping, X.; Gang, D. Study on Application of Vetiver Eco-engineering Technique for Stabilization and Revegetation of Karst Stony Slopes. In Proceedings of the Third International Conference on Vetiver and Exhibition, Guangzhou, China, 6–9 October 2003. [Google Scholar]
  53. Moses, D.; Shimada, H.; Onyango, J.A.; Sasaoka, T.; Hamanaka, A. Slope design in brecciated carbonatite complexes under high-stress regimes. Bull. Eng. Geol. Environ. 2022, 81, 494. [Google Scholar] [CrossRef]
  54. Mgiba, C.; Rupprecht, S.M. Slope Stability Analysis and Design for Small-Scale Mines. In Proceedings of the 57th U.S. Rock Mechanics/Geomechanics Symposium, Atlanta, GA, USA, 25–28 June 2023. [Google Scholar]
  55. Barnett, W.P. Geological control on slope failure mechanisms in the open pit at the Venetia Mine. S. Afr. J. Geol. 2003, 106, 149–164. [Google Scholar] [CrossRef]
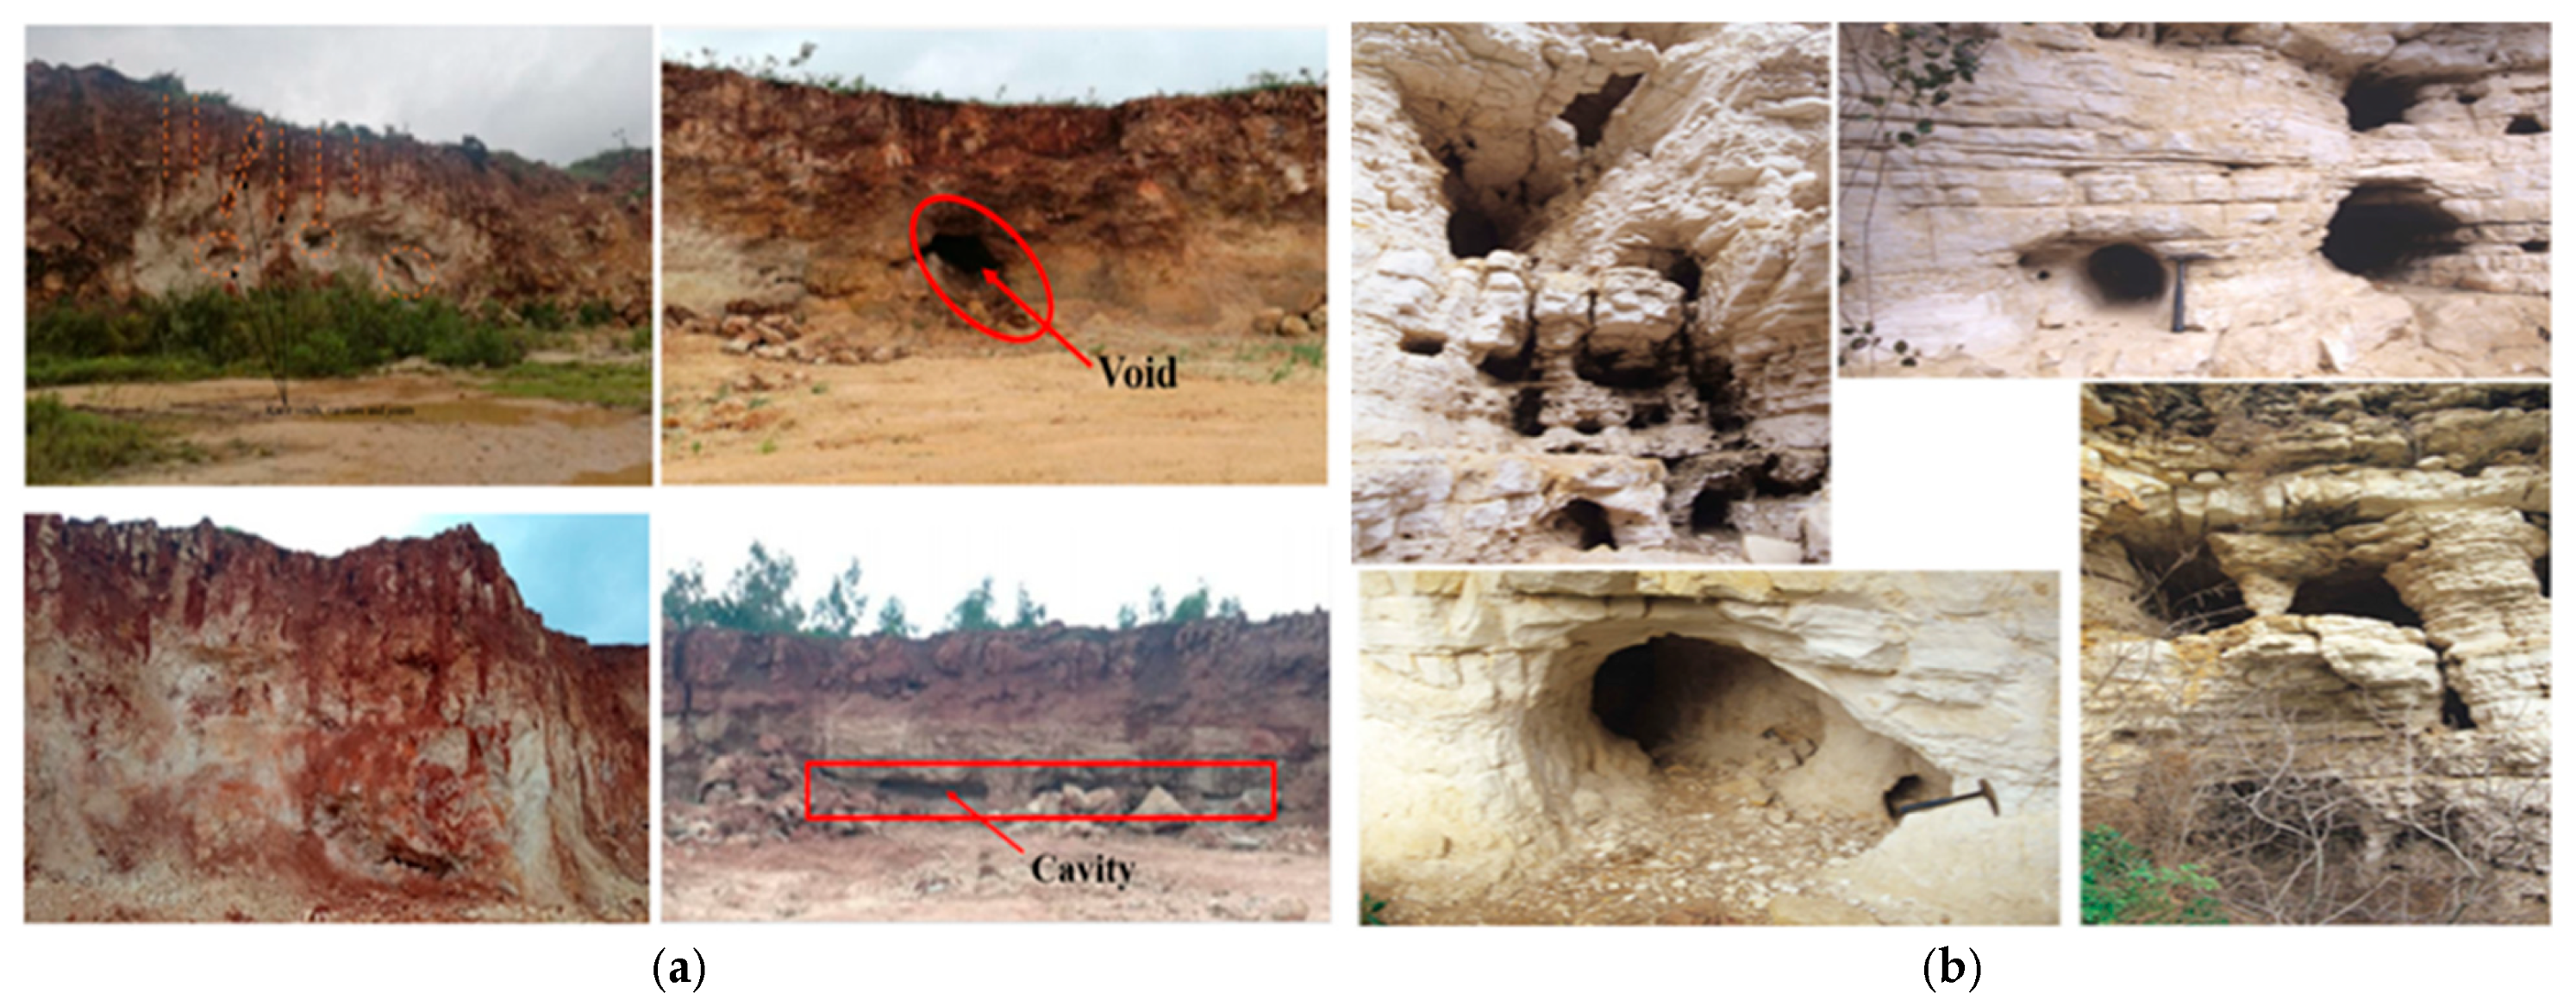
Figure 1. Examples of karst features on slopes: (a) Vipingo coral limestone quarry in Kenya [16]; (b) Pulo di Molfetta, southern Italy [17].
Modelling 06 00081 g001
Figure 2. Representation of the karst matrix as an equivalent porous medium [32].
Modelling 06 00081 g002
Figure 3. (a) Slice in a slope with karst hollows. (b) Free body diagram (modified after [34]).
Modelling 06 00081 g003
Figure 4. Geographical location of Vipingo quarry: (a) map of Kenya; (b) location of Vipingo quarry in Kilifi County.
Modelling 06 00081 g004aModelling 06 00081 g004b
Figure 5. Distribution of the karst hollows: (a) Pit slope section; (b) upper bench, 6 m high; (c) presentation of locations of karst cavities, not their dimensions; (d) size distribution graph of the karst hollows.
Modelling 06 00081 g005
Figure 6. The DXF output of the MATLAB random number generator function.
Modelling 06 00081 g006
Figure 8. The four sets of karst hollows output from MATLAB.
Modelling 06 00081 g008
Figure 9. Procedure for developing the equivalent porous medium.
Modelling 06 00081 g009
Figure 10. Two-dimensional model geometry of the quarry slope in Figure 5. (a) shows the 2D model of the slope in Figure 5, (b) shows the slope model with the karst matrix geometry added.
Modelling 06 00081 g010
Figure 11. Interpretation of velocity and displacement fields in RS2: (a) displacement and velocity fields; (b) constant velocity and displacement fields; (c) coherent, organized velocity field; (d) connected plasticity field (adapted from [37]).
Modelling 06 00081 g011
Figure 12. (a) The critical SRF denoting slope safety factor of a slope; (b) a plot of the maximum shear plastic strain; (c) failure trajectories on a slope face; (d) yielded elements on a slope model.
Modelling 06 00081 g012
Figure 13. Stability condition of slope without karst matrix: (a) model mesh and boundary conditions; (b) the shear strain plot.
Modelling 06 00081 g013
Figure 14. Stability condition of the slopes under the combined influence of groundwater, ocean water, and rainfall: (a) model mesh and boundary conditions; (b) the shear strain plot.
Modelling 06 00081 g014
Figure 15. Safety factor of dry slope under the impact of the karst hollows: (a) model mesh and boundary conditions; (b) the shear strain plot.
Modelling 06 00081 g015
Figure 16. Stability condition of the slopes with karst under the combined influence of groundwater, ocean water, and rainfall: (a) model mesh and boundary conditions; (b) the shear strain plot.
Modelling 06 00081 g016
Figure 17. Comparison of slope stability with various hollow sizes at 0.1% density: the small-sized hollows Set (A), broad spectrum hollows Set (B), medium-to-large hollows Set (C), singular large voids Set (D).
Modelling 06 00081 g017
Figure 18. Comparison of slope stability with various hollow sizes at 0.5% density: the small-sized hollows Set (A), broad spectrum hollows Set (B), medium-to-large hollows Set (C), singular large voids Set (D).
Modelling 06 00081 g018
Figure 19. Comparison of slope stability with various hollow sizes at 1% density: the small-sized hollows Set (A), broad spectrum hollows Set (B), medium-to-large hollows Set (C), singular large voids Set (D).
Modelling 06 00081 g019
Figure 20. Stability condition when GSI = 14.
Modelling 06 00081 g020
Figure 21. Stability condition when GSI = 28.
Modelling 06 00081 g021
Figure 22. Stability condition when GSI = 40.
Modelling 06 00081 g022
Figure 23. Plasticity and stress trajectories in slope with karst hollows of diameter range 0.02–0.05 m.
Modelling 06 00081 g023
Figure 24. Plasticity and stress trajectories in slope with karst hollows of diameter range 0.02–1 m.
Modelling 06 00081 g024
Figure 25. Plasticity and stress trajectories in slope with karst hollows of diameters 0.2 m, 0.5 m, and 1 m.
Modelling 06 00081 g025
Figure 26. Plasticity and stress trajectories in slope with karst hollows of 1 m diameter.
Modelling 06 00081 g026
Figure 27. Bench collapse.
Modelling 06 00081 g027
Figure 28. Planar failure.
Modelling 06 00081 g028
Figure 29. Rockfall.
Modelling 06 00081 g029
Figure 30. Variation of safety factor with karst hollow density and size.
Modelling 06 00081 g030
Table 1. Sampled karst hollow densities across slope sections.
Sampled SectionSampling Area (m × m)Total Void Area (m2)Calculated Hollows Density, d (%)
Slope A6 × 60.02560.071
Slope B6 × 60.03280.091
Slope C6 × 60.06450.179
Slope D6 × 60.12150.337
Slope E6 × 60.30110.836
Slope F6 × 60.83292.313
Slope G6 × 61.33153.698
Table 2. Material properties.
Material PropertyValue
Uniaxial Compressive Strength (UCS) MPa23.49
Geological Strength Index (GSI)28
Intact rock constant (mi)9
Disturbance factor0.7
Unit weight (MN/m3)0.0228
Young’s modulus (GPa)35.91
Poisson’s ratio0.39
Hydraulic conductivity (m/s)1.62 × 10−4
Table 3. Factor of safety for various karst hollow sizes and densities.
Hollows SizesFactor of Safety
Holes Density of 0.1%Holes Density of 0.5%Holes Density of 1%
Set A (Smallest two)0.890.840.9
Set B (Varied)0.850.860.88
Set C (Largest three)0.970.930.86
Set D (1 m dia)0.850.90.34
Disclaimer/Publisher’s Note: The statements, opinions and data contained in all publications are solely those of the individual author(s) and contributor(s) and not of MDPI and/or the editor(s). MDPI and/or the editor(s) disclaim responsibility for any injury to people or property resulting from any ideas, methods, instructions or products referred to in the content.