
Numerical Simulation and Performance Analysis of DesanderDuring Tight Gas Provisional Process

Abstract
1. Introduction
1.1. Motivation
1.2. Literature Review
1.3. Contributions
2. Systematic Description
2.1. The Role of Desanders in Sand Management
2.2. Factors Influencing Desander Efficiency
3. Model Building
3.1. Simulation Equation
- (1)
- Fundamental equations of fluid mechanics
- (2)
- Turbulence modeling
- (3)
- Boundary condition setting
3.2. Field Parameters
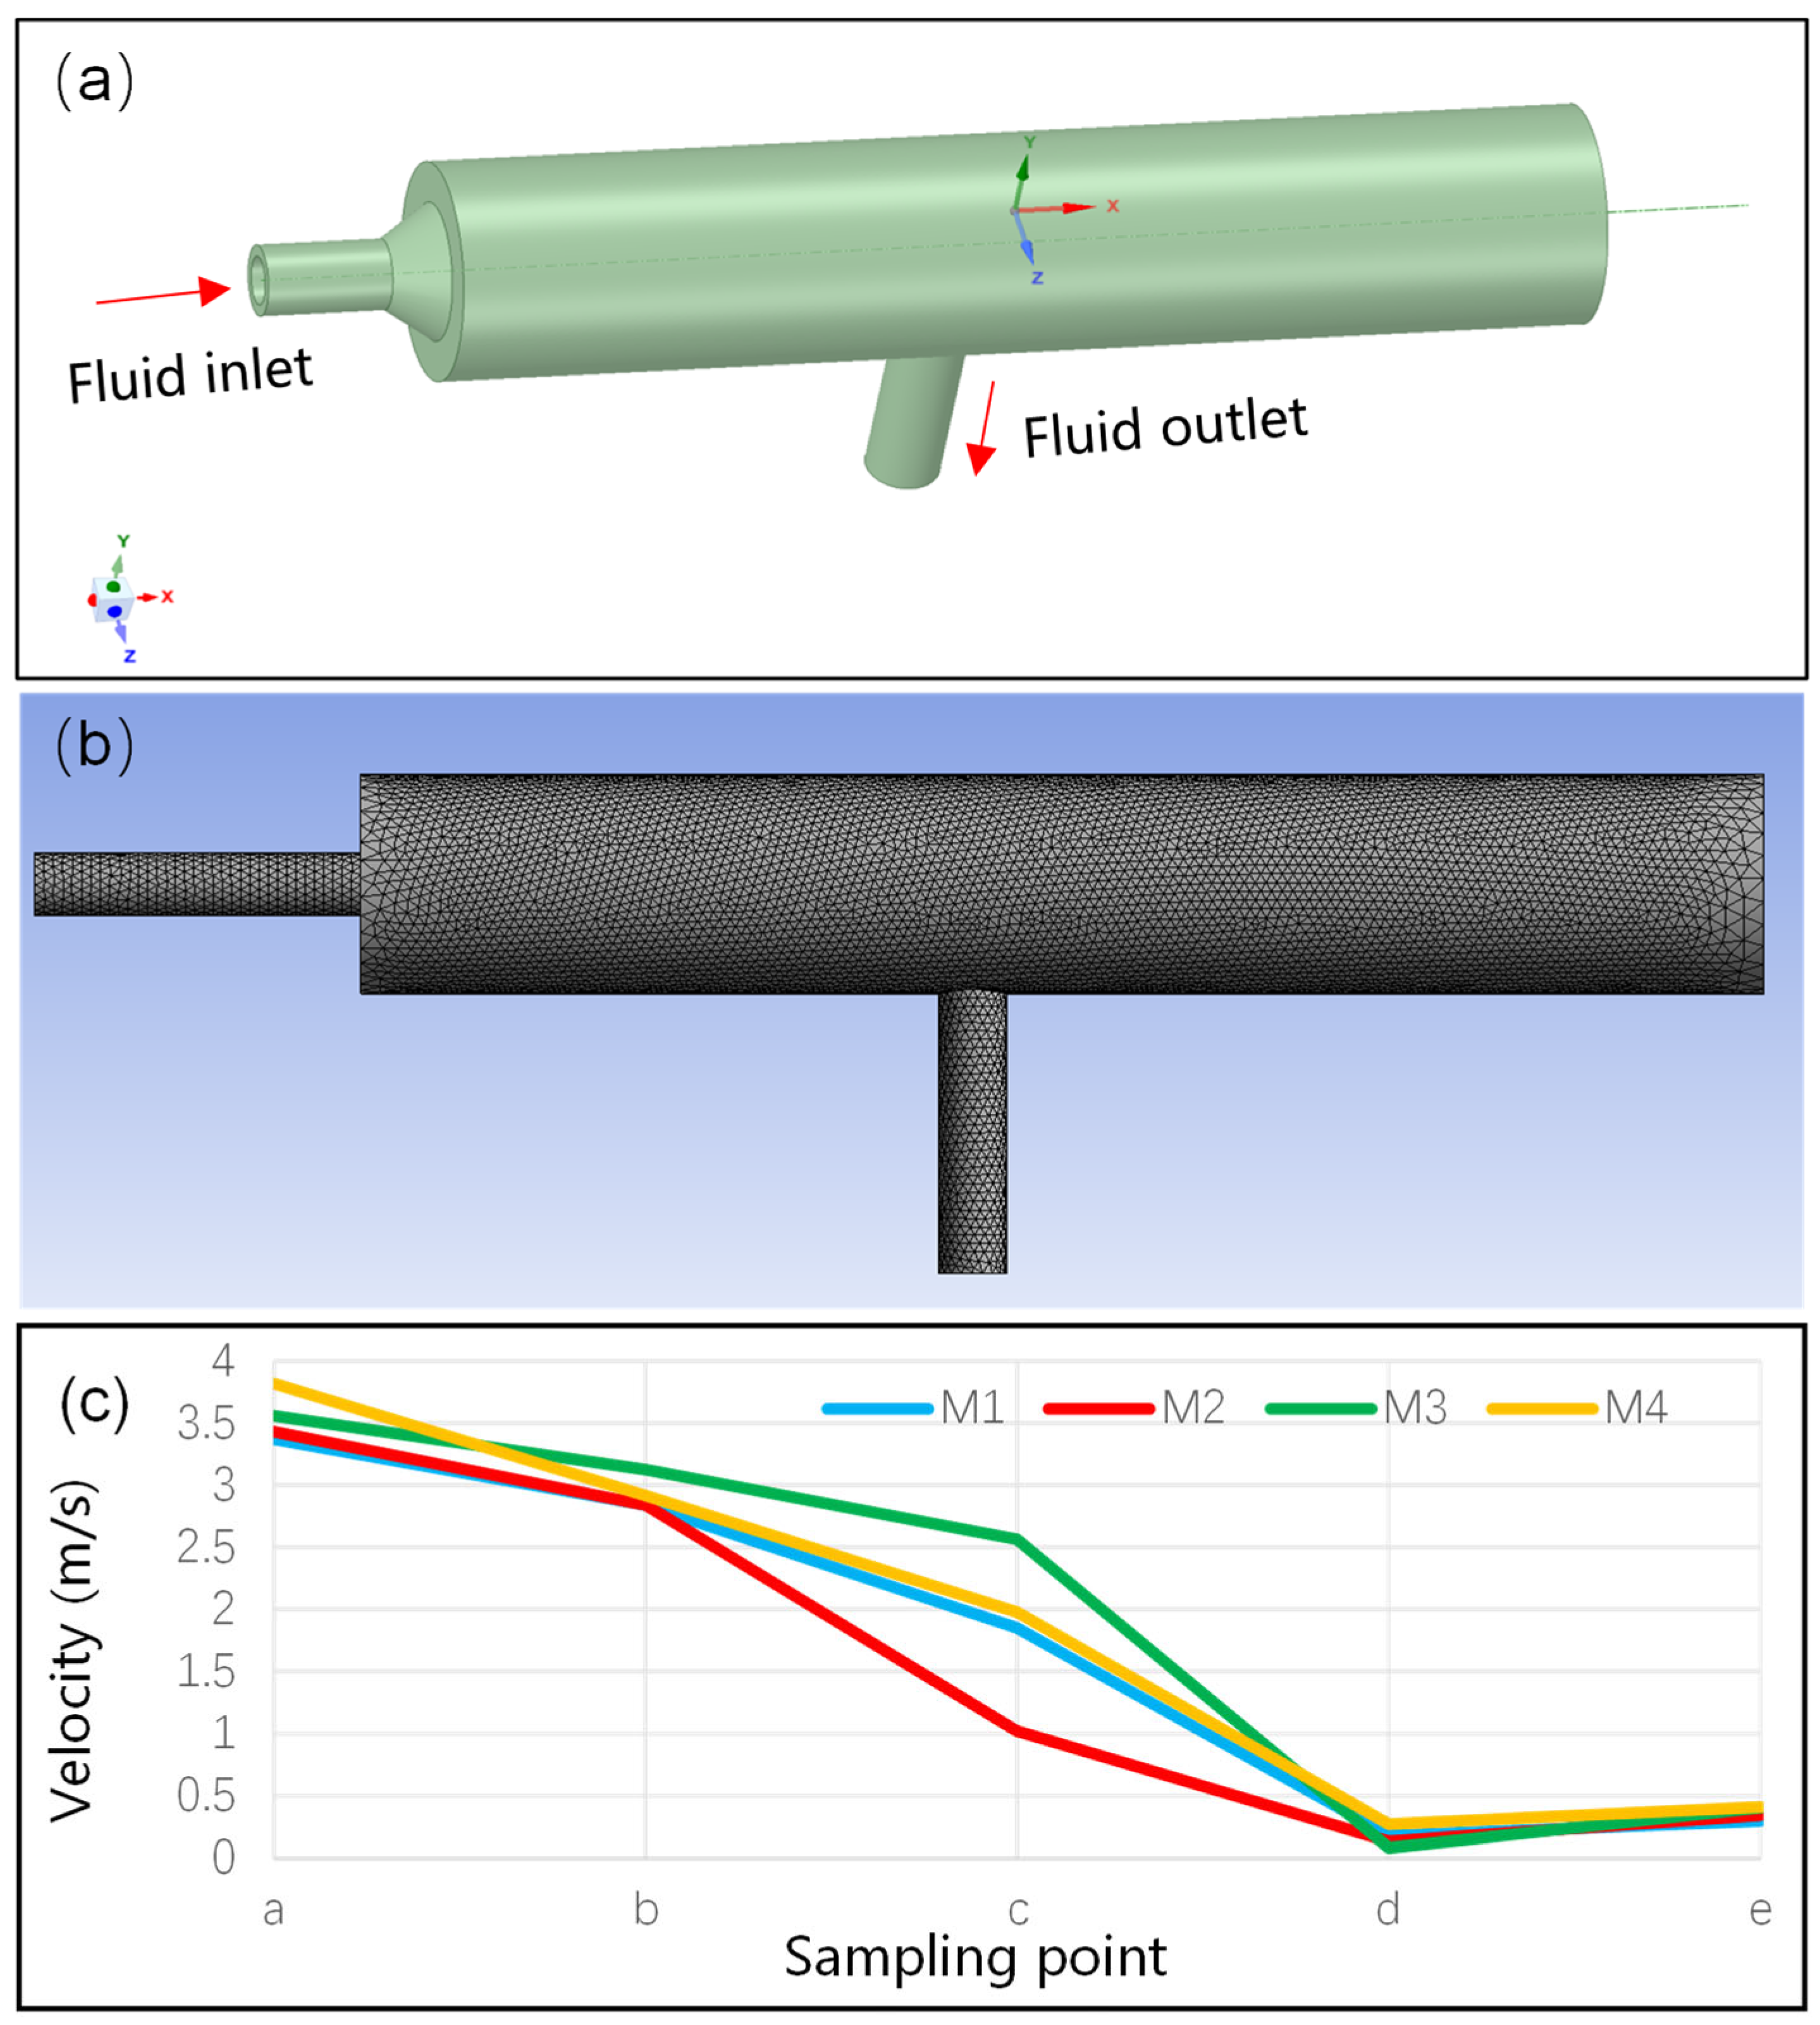
3.3. Device Modeling
- (1)
- Three-dimensional modeling
- (2)
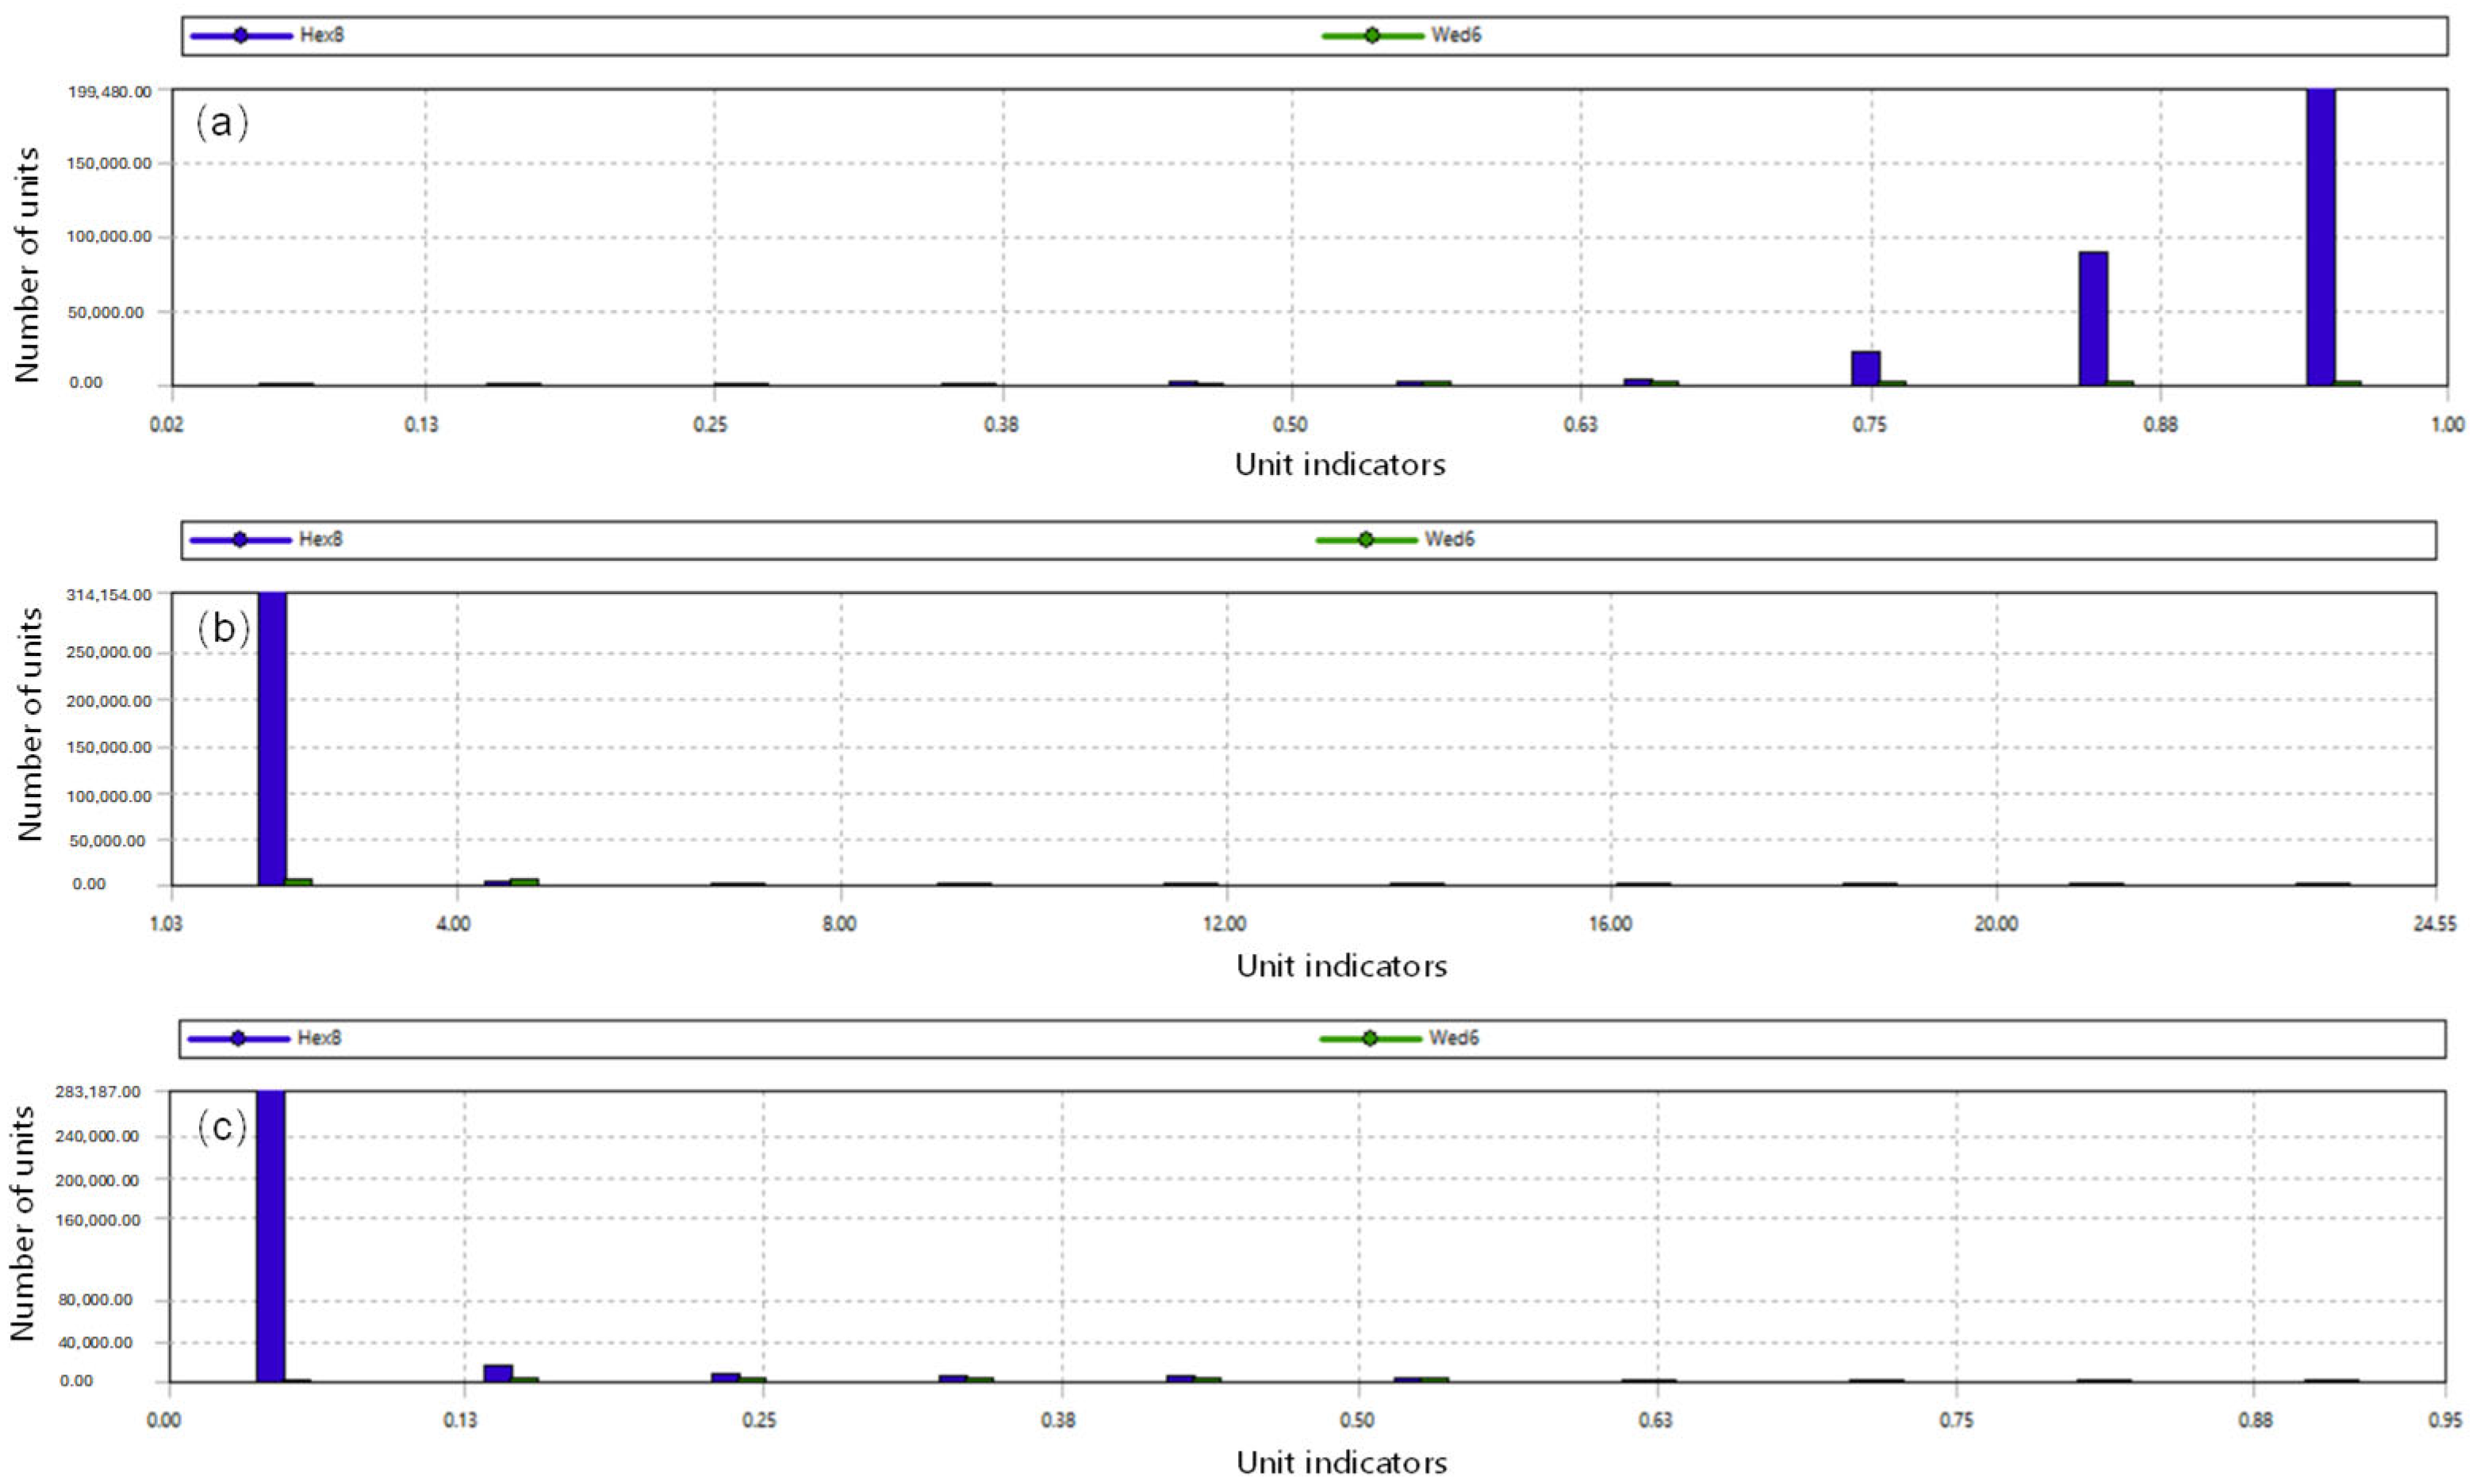
- Gridding
- (3)
- Grid-independent verification
4. Desander Adaptability Evaluation
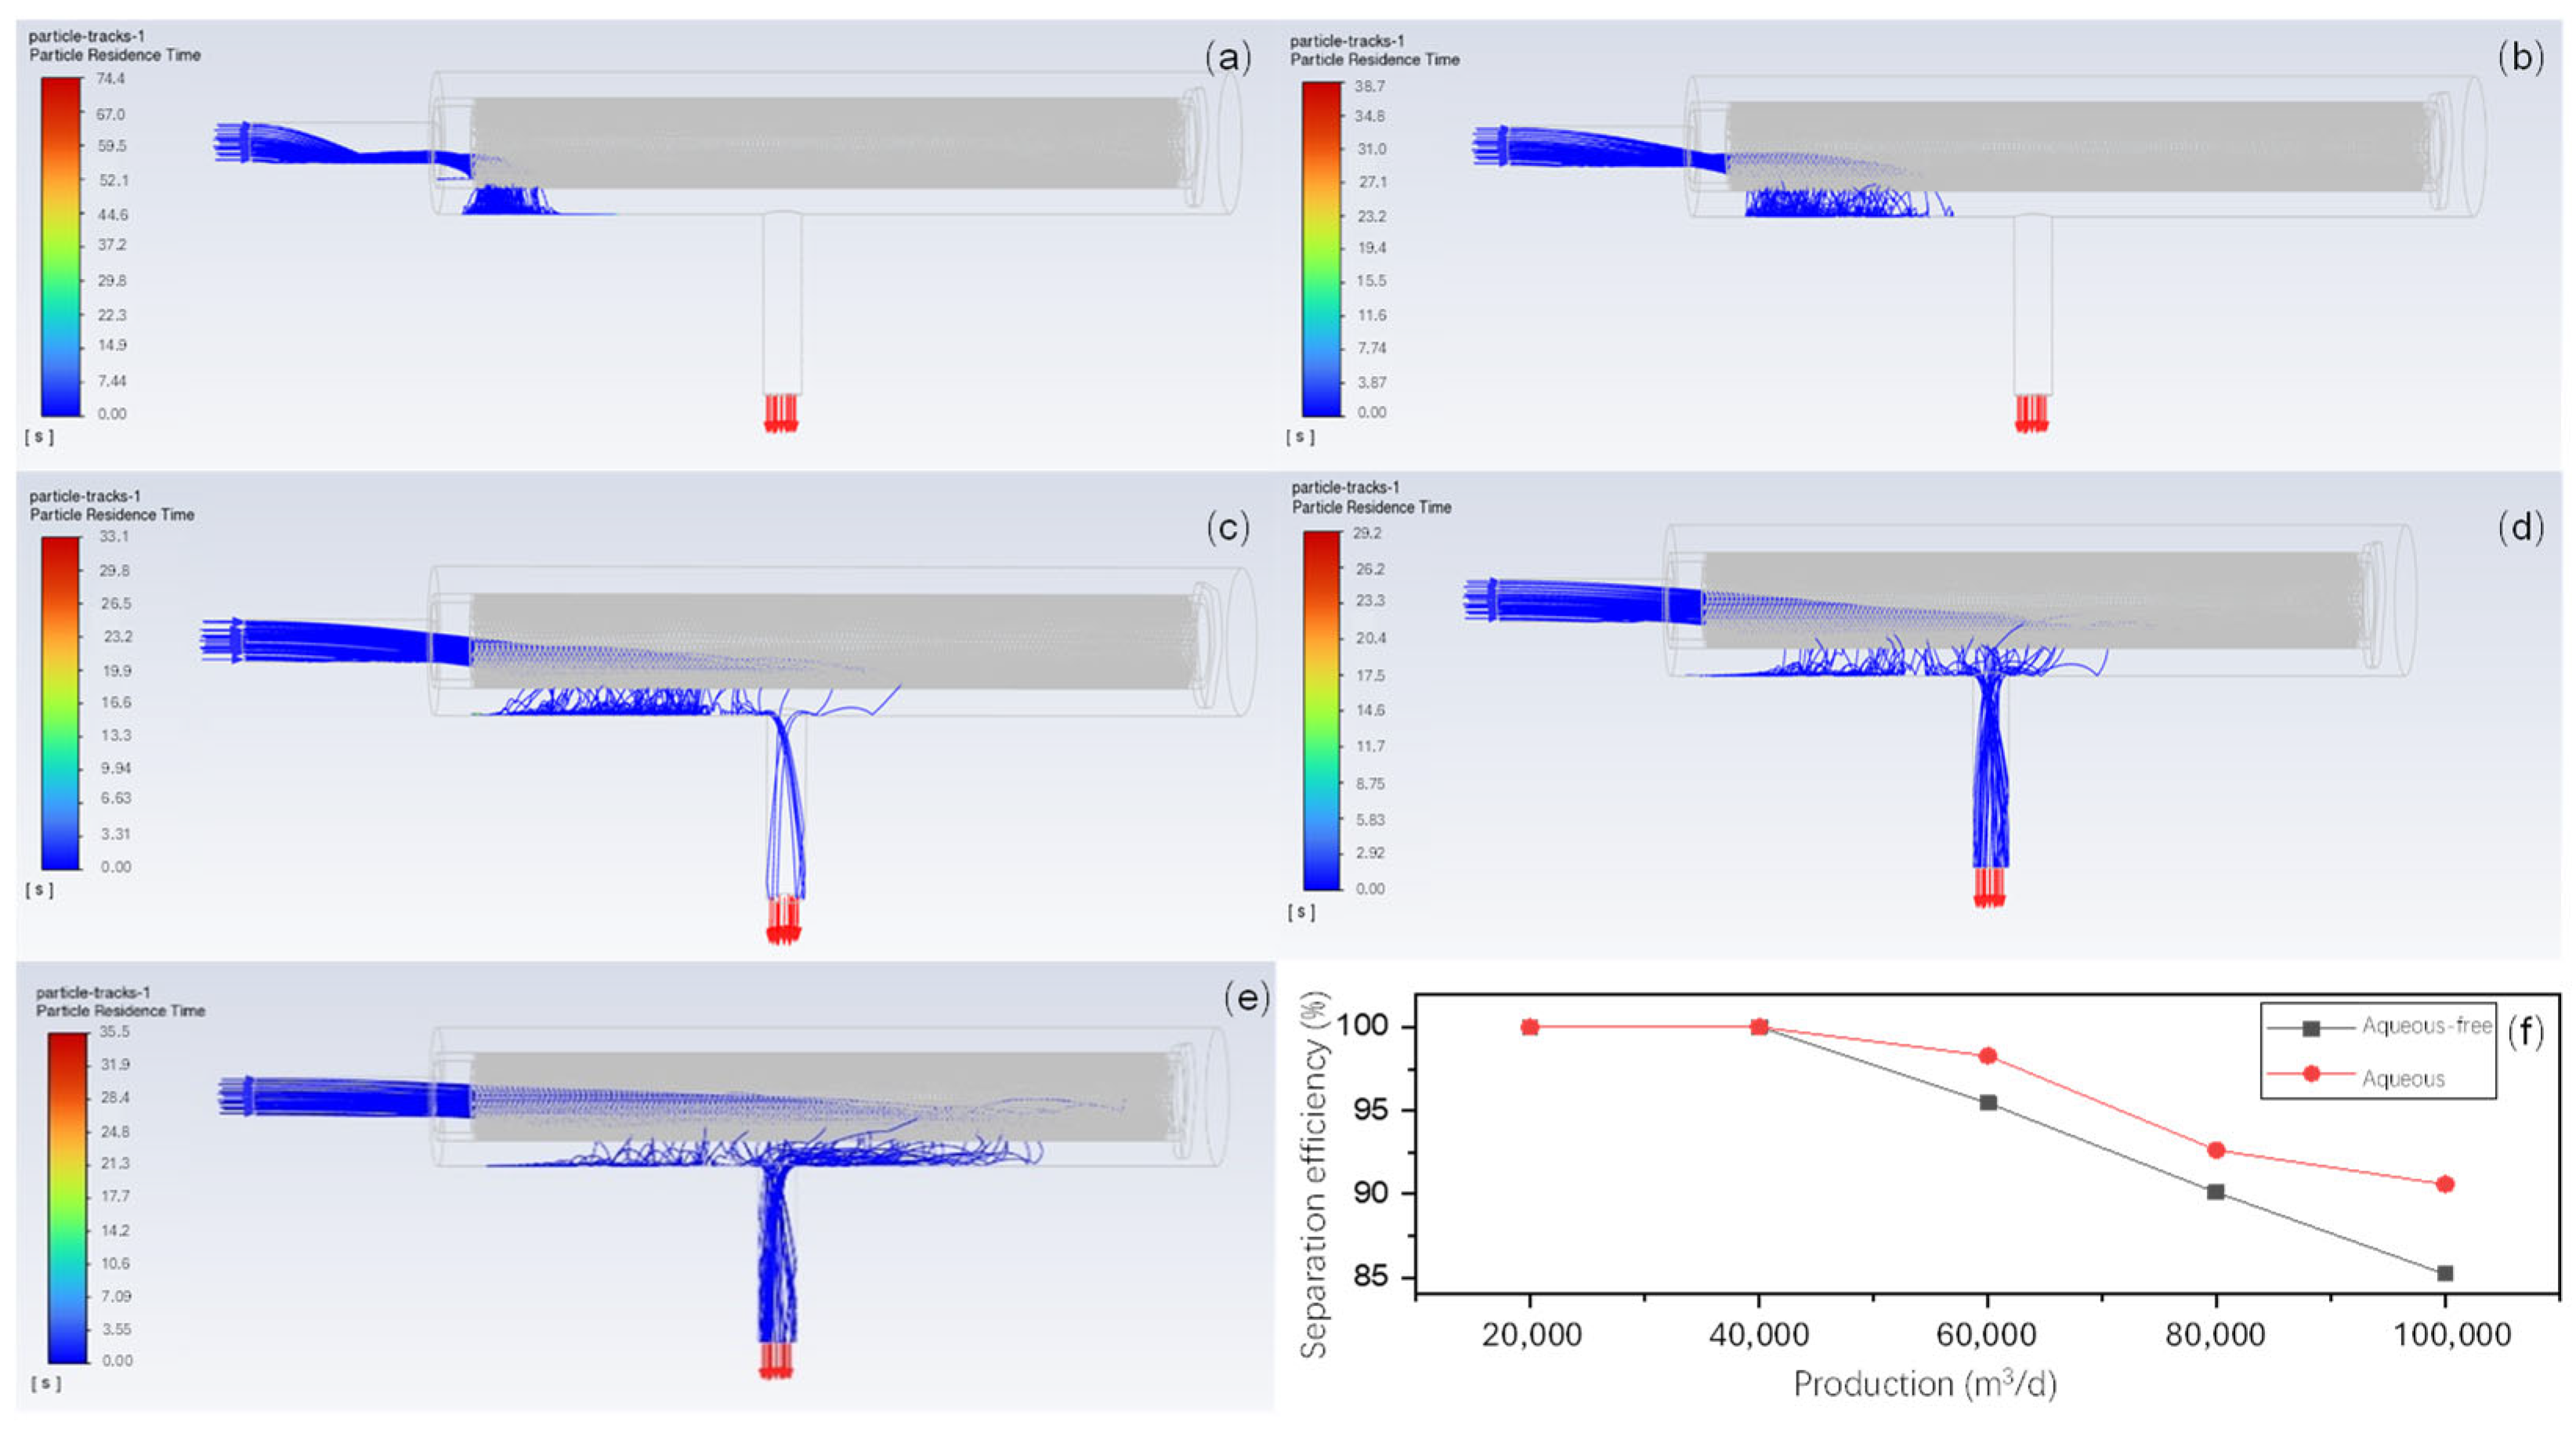
4.1. Effect of Gas Production
4.2. Effect of Pressure
4.3. Effect of Temperature
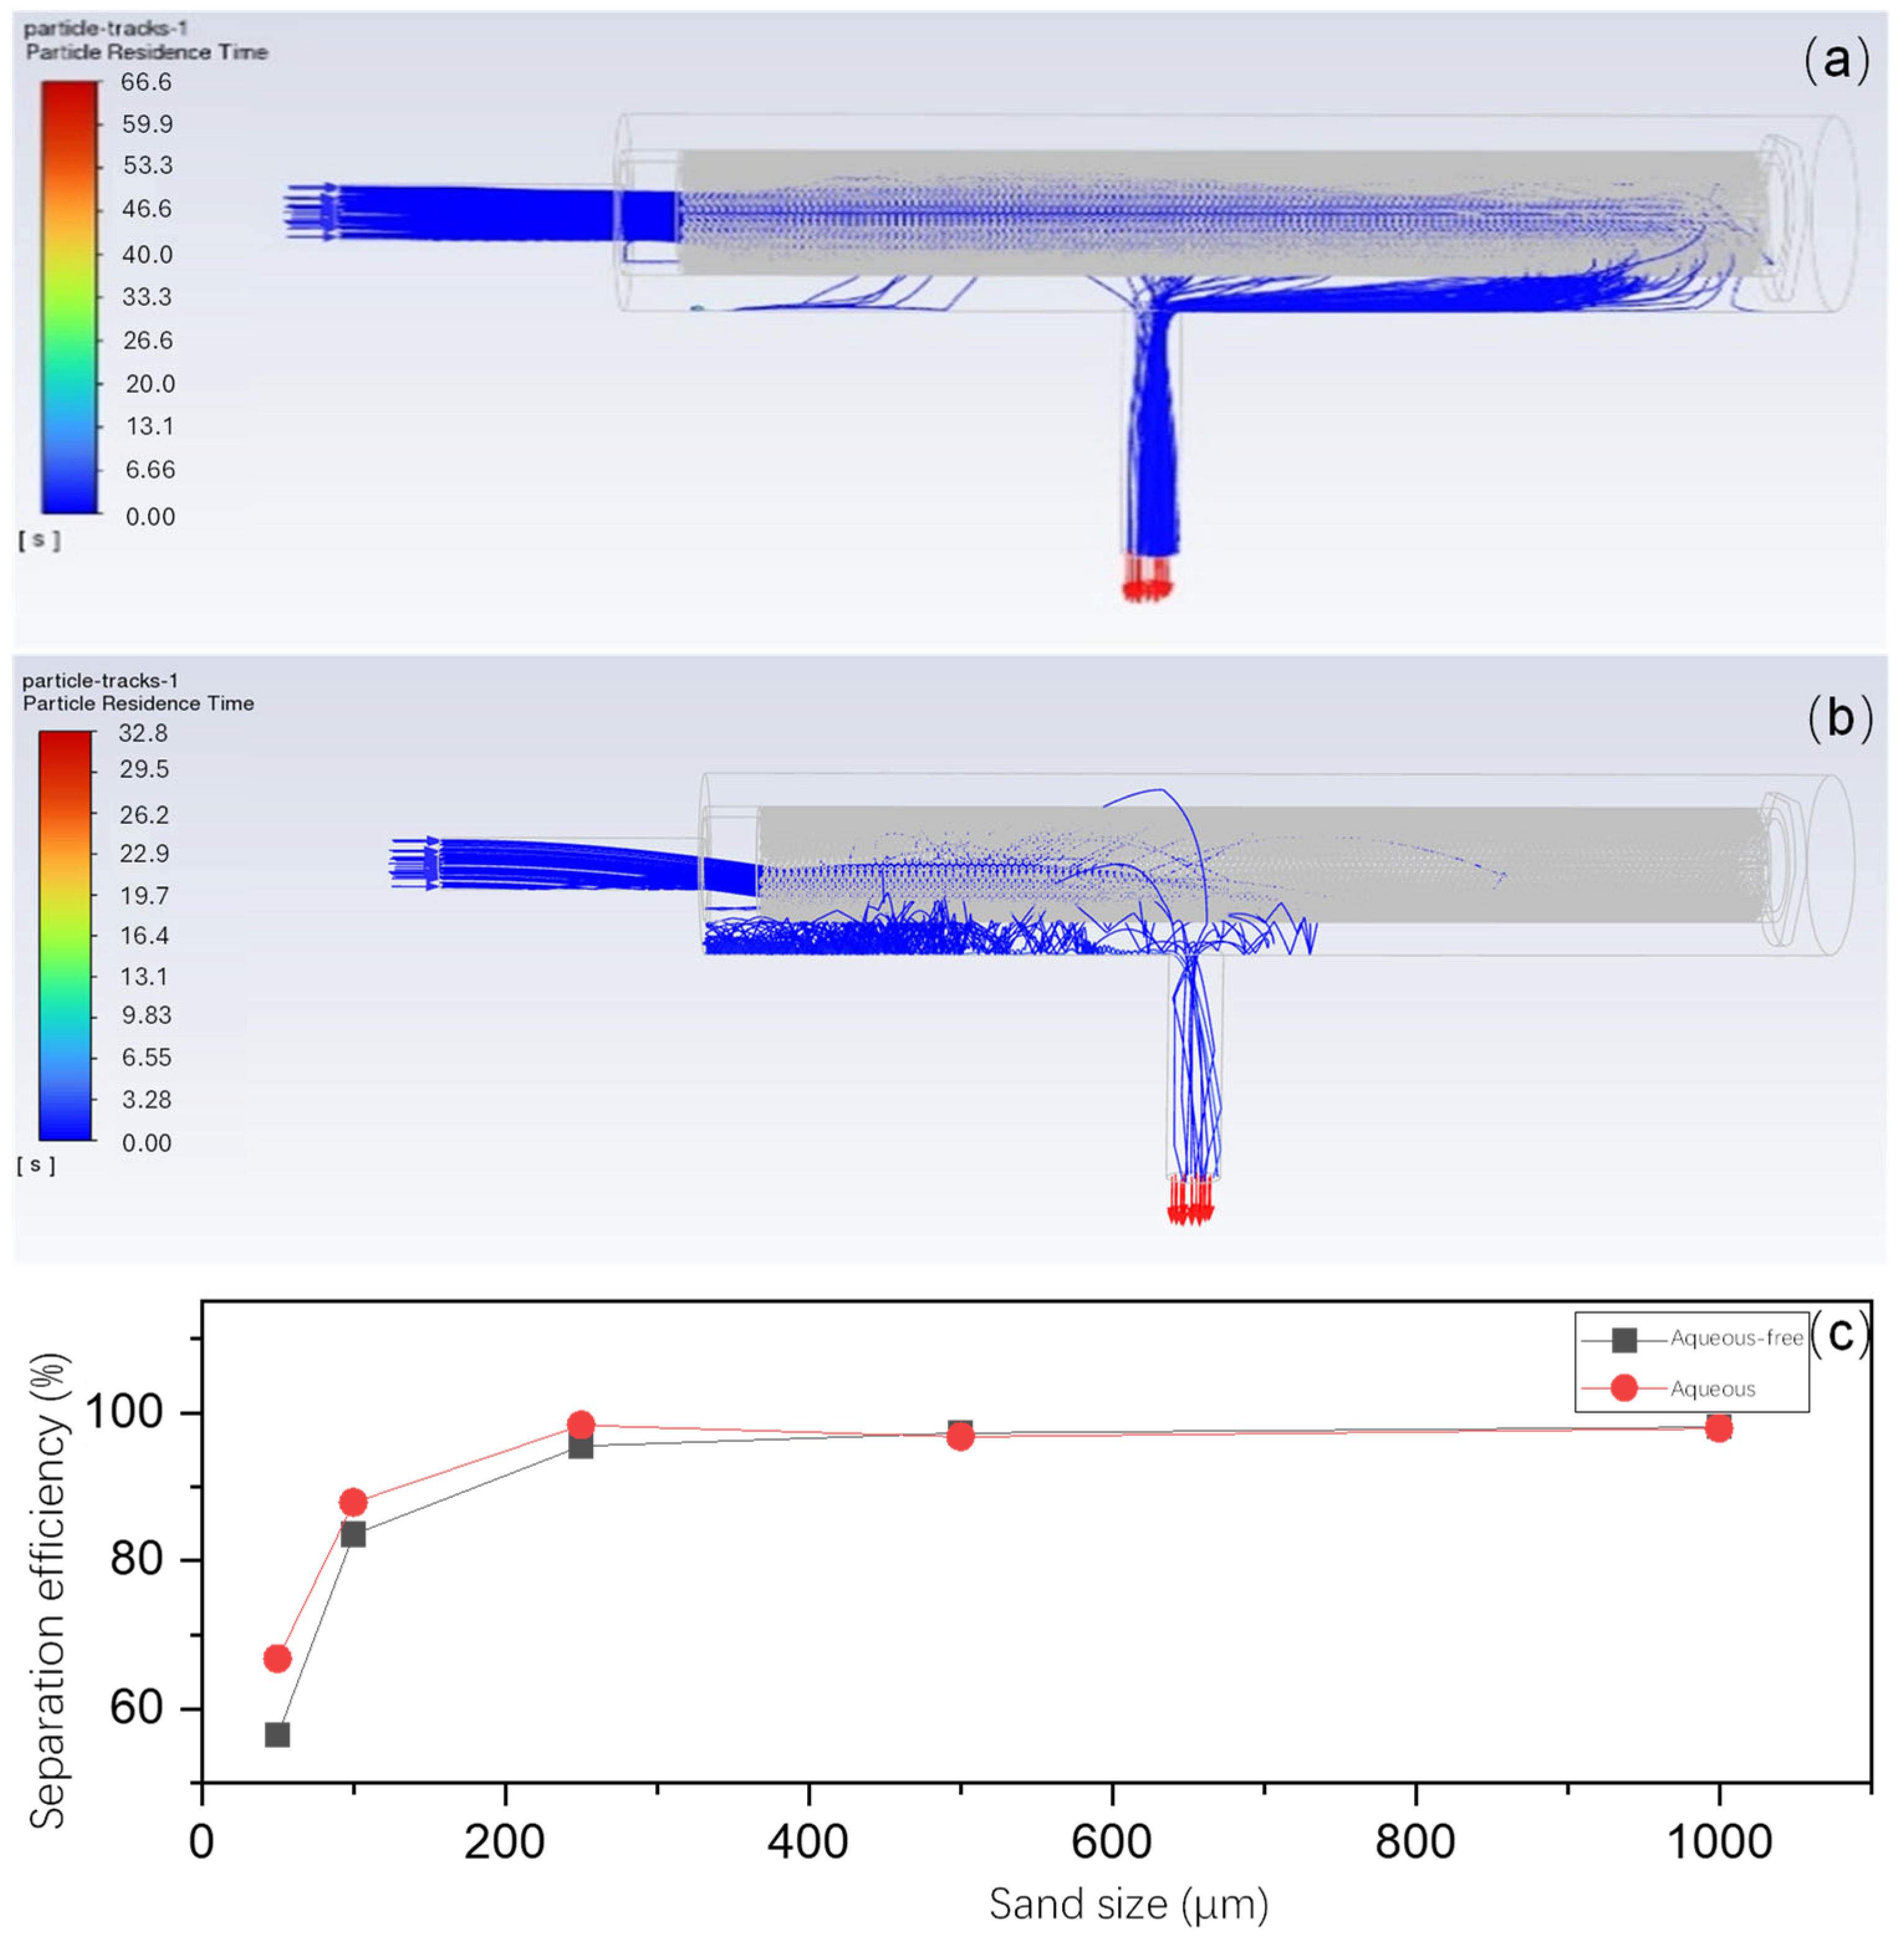
4.4. Effect of Sand Size
4.5. Effect of Water Content
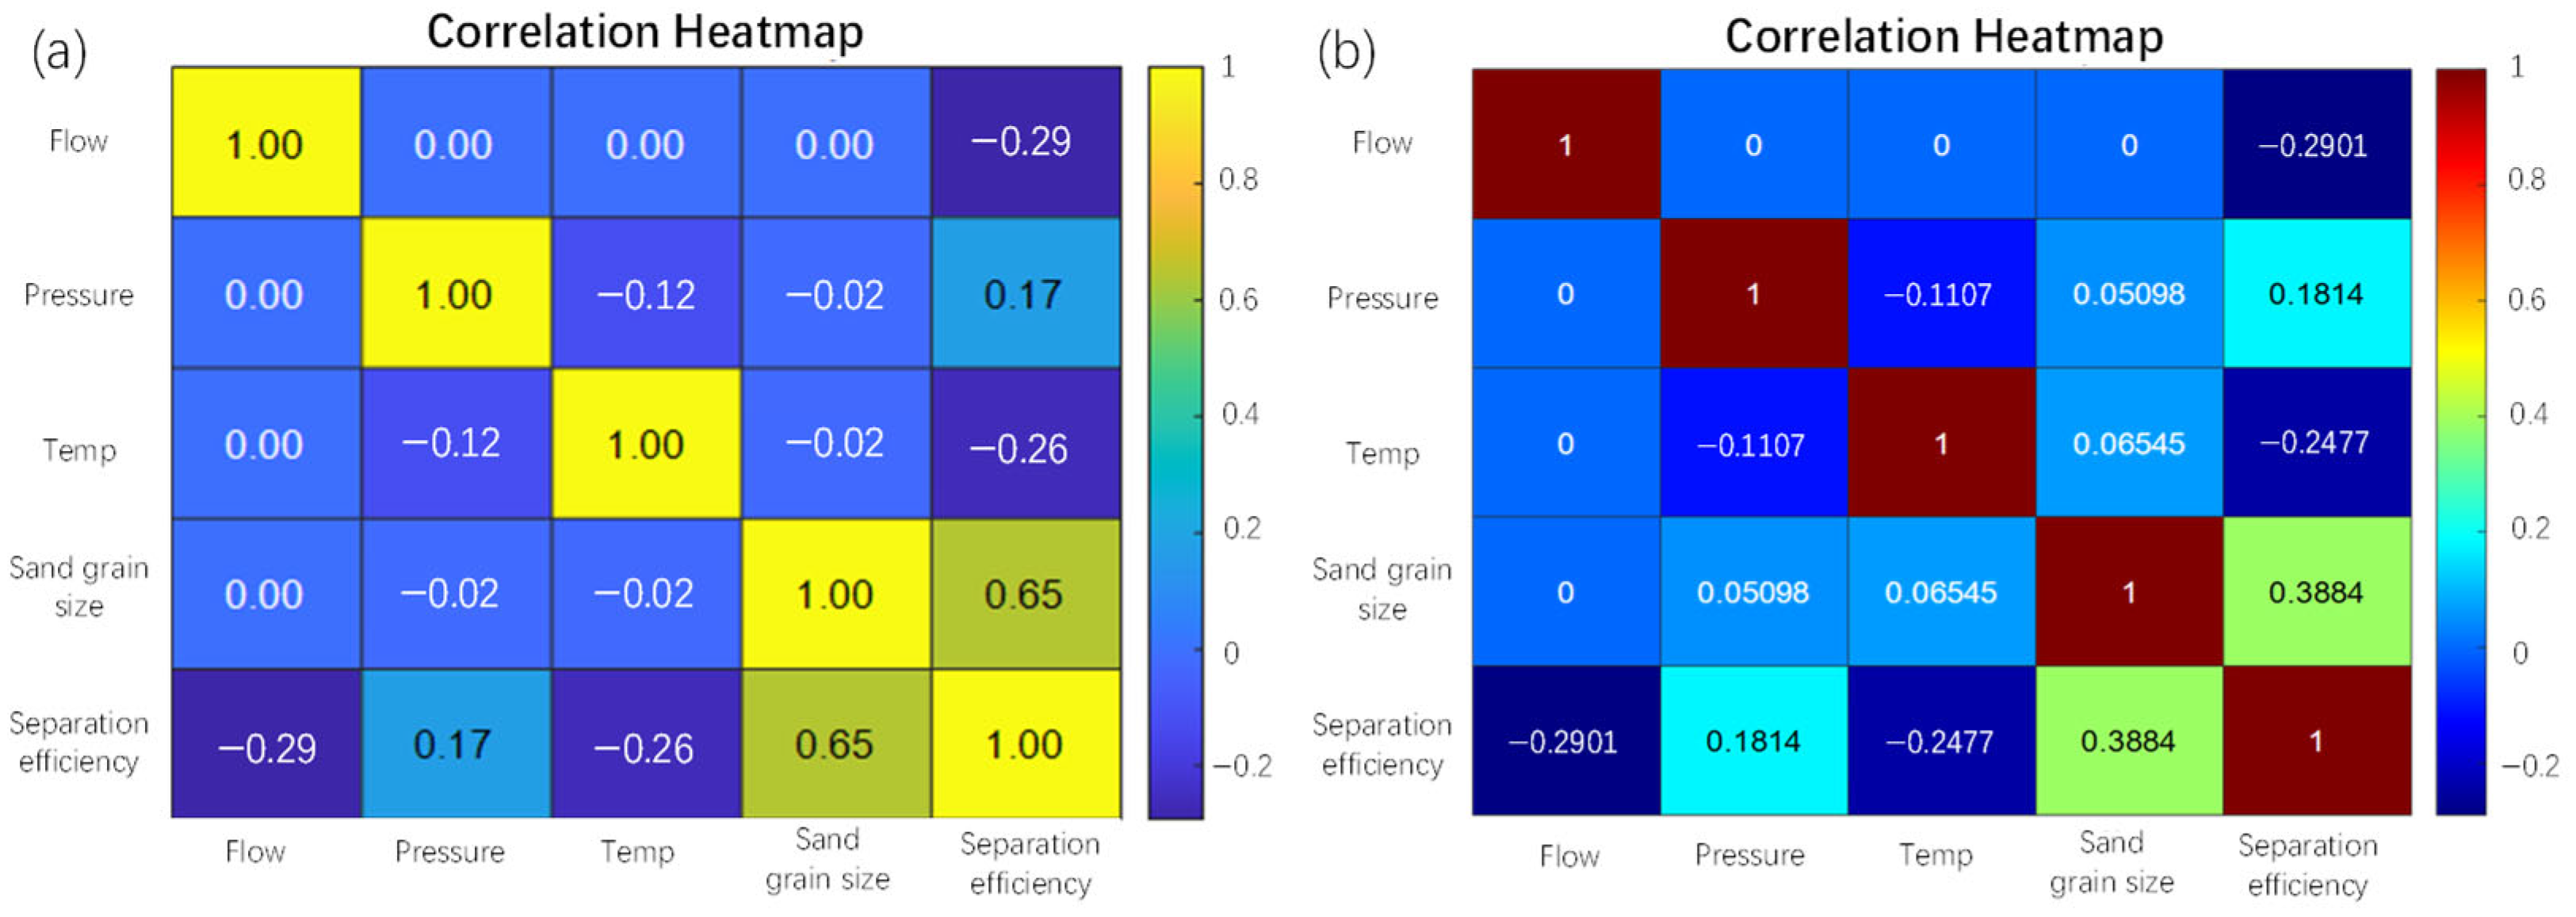
5. Main Controlling Factors of Separation Efficiency
6. Conclusions
Author Contributions
Funding
Data Availability Statement
Conflicts of Interest
References
- Liu, E.; Kou, B.; Wu, P.; Wang, M.; Peng, J.; Chen, Q. Performance analysis and structure optimization of shale gas desander. Energy Sources Part A Recovery Util. Environ. Eff. 2022, 1–21. [Google Scholar] [CrossRef]
- Jasmani, M.; Geronimo, E.; Chan, L. Installation of Online Vessel Desander Manifolds. In Proceedings of the SPE Annual Technical Conference and Exhibition 2006, San Antonio, TX, USA, 24–27 September 2006. [Google Scholar]
- Santhamoorthy, P.Z.; Williams, B.; Sambath, K.; Subramani, H.J.; Cremaschi, S. An integrated framework for sand handling in wellbore and surface facilities. Geoenergy Sci. Eng. 2024, 239, 212947. [Google Scholar] [CrossRef]
- Basyouny, A. Experimental validation of numerical two-phase flow in a horizontal separator. Results Eng. 2022, 15, 100476. [Google Scholar] [CrossRef]
- Alves, D.G.; da Silva, J.T.T.; Quintino, D.B.; Ataíde, C.H. Desander mini-hydrocyclones applied to the separation of microspheres and sand in non-Newtonian fluid: Efficiencies and drag analysis. Sep. Purif. Technol. 2020, 234, 116131. [Google Scholar] [CrossRef]
- Liu, E.; Li, D.; Li, W.; Liao, Y.; Qiao, W.; Liu, W.; Azimi, M. Erosion simulation and improvement scheme of separator blowdown system——A case study of Changning national shale gas demonstration area. J. Nat. Gas Sci. Eng. 2021, 88, 103856. [Google Scholar] [CrossRef]
- Liang, X.; He, L.; Luo, X.; Li, Q.; You, Y.; Xu, Y. Experimental study on sand particles accumulation, migration and separation efficiency in slug catcher. Chin. J. Chem. Eng. 2021, 32, 134–143. [Google Scholar] [CrossRef]
- Kou, J.; Qiu, H.; Wang, C. Numerical simulation analysis of particle motion behavior and key structures inside a novel cyclone separator. Chin. J. Chem. Eng. 2025, in press. [Google Scholar] [CrossRef]
- Jing, J.; Zhang, S.; Qin, M.; Luo, J.; Shan, Y.; Cheng, Y.; Tan, J. Numerical simulation study of offshore heavy oil desanding by hydrocyclones. Sep. Purif. Technol. 2021, 258, 118051. [Google Scholar] [CrossRef]
- Gorobets, A.V.; Tarabara, V.V. Separation performance of desanding and deoiling hydrocyclones treating three-phase feeds: Effect of oil-particle aggregates. Sep. Purif. Technol. 2020, 237, 116466. [Google Scholar] [CrossRef]
- Liang, H.; Ma, J.; Li, C.; Mu, L.; Jiang, X. Study on the performance of downhole axial cyclone with spiral fins for drainage and sand removal. J. Environ. Chem. Eng. 2023, 11, 111032. [Google Scholar] [CrossRef]
- Rawlins, C. Particle-Transfer Between the Cyclone and Accumulator Sections of a Desander. SPE Prod. Oper. 2019, 34, 270–279. [Google Scholar] [CrossRef]
- Rawlins, C.H. Application of multiphase desander technology to oil and gas production. In Proceedings of the 3rd North American Conference on Multiphase Technology, Banff, AB, Canada, 6–7 June 2002. [Google Scholar]
- Opawale, A.O.; Arreola, S.; Ciprick, K.; Ibouhouten, B.; Kruijtzer, G.L.; Verbeek, P.H.J.; Akdim, M.R. Desanding at the wellhead for optimal well productivity and minimal risks to surface facilities. In Proceedings of the Abu Dhabi International Petroleum Exhibition and Conference, Abu Dhabi, United Arab Emirates, 7–10 November 2016. [Google Scholar]
- Carpenter, C. New Approach in Gas-Condensate Fields Results in Smart Sand Management. J. Pet. Technol. 2025, 77, 71–73. [Google Scholar] [CrossRef]
- Zhang, S.; Jing, J.; Luo, M.; Qin, M.; Zhang, F.; Yuan, L. Experimental study on hydrocyclone desanding of high-viscosity oil. Fuel 2023, 341, 127691. [Google Scholar] [CrossRef]
- Gupta, A.; Kamat, D.; Shahrum, Z.; Firmansyah, A.; Salleh, N.I.; Tan, B.C.; Madon, B. Unique & practical approach in selection and classification of hydrocyclone desander technology: Utilizing a decade of experience. In Proceedings of the SPE Asia Pacific Oil and Gas Conference and Exhibition, Jakarta, Indonesia, 17–19 October 2017. [Google Scholar]
- He, J.; Zhu, Z.; Niu, H.; Tian, Z.; Yang, J.; Sun, G. Enhancing the efficiency of two-stage cyclones without increasing pressure drop by optimizing inlet and outlet dimensions. Can. J. Chem. Eng. 2024, 102, 4371–4385. [Google Scholar] [CrossRef]
- Rawlins, C. Operating Limits of the Desanding Hydrocyclone for Produced Water Treatment. In Proceedings of the SPE Western Regional Meeting, Garden Grove, CA, USA, 27 April–1 May 2025. [Google Scholar]
- Zhang, L.; Chen, X.; Zheng, J.; Gao, Y.; Deng, X. Investigation of the separation performance of a T-junction buffer desander. Part. Sci. Technol. 2025, 43, 382–392. [Google Scholar] [CrossRef]
- Qiu, S.; Wang, G.; Wang, L.; Fang, X. A downhole hydrocyclone for the recovery of natural gas hydrates and desanding: The CFD simulation of the flow field and separation performance. Energies 2019, 12, 3257. [Google Scholar] [CrossRef]
- Cen, Z.L. A Comparative Study of Omega RSM and RNG k–ε Model for the Numerical Simulation of a Hydrocyclone. Iran. J. Chem. Chem. Eng. 2014, 33, 53–61. [Google Scholar]
- Zhang, Y.; Cai, P.; Jiang, F.; Dong, K.; Jiang, Y.; Wang, B. Understanding the separation of particles in a hydrocyclone by force analysis. Powder Technol. 2017, 322, 471–489. [Google Scholar] [CrossRef]
- Bumrungthaichaichan, E. A note of caution on numerical scheme selection: Evidence from cyclone separator CFD simulations with appropriate near-wall grid sizes. Powder Technol. 2023, 427, 118713. [Google Scholar] [CrossRef]
- Basyouny, A. Sand settling in a three-phase flow inside a horizontal separator. Int. J. Thermofluids 2022, 16, 100235. [Google Scholar] [CrossRef]
- Zhao, Z.; Zhou, L.; Liu, B.; Cao, W. Computational fluid dynamics and experimental investigation of inlet flow rate effects on separation performance of desanding hydrocyclone. Powder Technol. 2022, 402, 117363. [Google Scholar] [CrossRef]
- Zhang, M.; Li, W.; Zhang, L.; Jin, H.; Mu, Y.; Wang, L. A Pearson correlation-based adaptive variable grouping method for large-scale multi-objective optimization. Inf. Sci. 2023, 639, 118737. [Google Scholar] [CrossRef]


| Structure Parameters | Sizes |
|---|---|
| Inlet diameter/(mm) | 89 × 14 |
| Outlet diameter/(mm) | 89 × 14 |
| Height from inlet center point to bottom of desander/(mm) | 106.5 |
| Height from outlet center point to bottom of desander/(mm) | 417 |
| Desander cylinder diameter/(mm) | 273 × 30 |
| Total height of filter desander/(mm) | 1283 |
| Number of cartridges/(pcs) | 1 |
| Inlet type/(radial inlet/tangential inlet) | Radial direction |
| Outlet type/(radial outlet/tangential outlet) | Radial direction |
| Number | Influencing Factors | Effect Factor Values | Simulation Conditions |
|---|---|---|---|
| 1 | Flow | 2 × 10⁴ m3/d | Pressure: 6 MPa Temperature: 20 °C Sand size: 250 μm Water: 35 m3/d |
| 4 × 10⁴ m3/d | |||
| 6 × 10⁴ m3/d | |||
| 8 × 10⁴ m3/d | |||
| 1 × 10⁵ m3/d | |||
| 2 | Pressure | 3 MPa | Flow: 6 × 10⁴ m3/d Temperature: 20 °C Sand size: 250 μm Water: 35 m3/d |
| 4 MPa | |||
| 5 MPa | |||
| 6 MPa | |||
| 7 MPa | |||
| 3 | Temperature | −20 °C | Flow: 6 × 10⁴ m3/d Pressure: 6 MPa Sand size: 250 μm Water: 35 m3/d |
| −10 °C | |||
| 0 °C | |||
| 10 °C | |||
| 20 °C | |||
| 30 °C | |||
| 4 | Sand size | 50 μm | Flow: 6 × 10⁴ m3/d Pressure: 6 MPa Temperature: 20 °C Water: 35 m3/d |
| 100 μm | |||
| 250 μm | |||
| 500 μm | |||
| 1000 μm | |||
| 5 | Water yield | 5 m3/d | Flow: 6 × 10⁴ m3/d Pressure: 6 MPa Temperature: 20 °C Sand size: 250 μm |
| 10 m3/d | |||
| 20 m3/d | |||
| 35 m3/d | |||
| 50 m3/d | |||
| 100 m3/d |
Disclaimer/Publisher’s Note: The statements, opinions and data contained in all publications are solely those of the individual author(s) and contributor(s) and not of MDPI and/or the editor(s). MDPI and/or the editor(s) disclaim responsibility for any injury to people or property resulting from any ideas, methods, instructions or products referred to in the content. |
© 2025 by the authors. Licensee MDPI, Basel, Switzerland. This article is an open access article distributed under the terms and conditions of the Creative Commons Attribution (CC BY) license (https://creativecommons.org/licenses/by/4.0/).
Share and Cite
Sun, G.; Li, H.; Liu, H.; Li, F.; Wang, H.; Zhou, J.; Liang, G. Numerical Simulation and Performance Analysis of DesanderDuring Tight Gas Provisional Process. Modelling 2025, 6, 57. https://doi.org/10.3390/modelling6030057
Sun G, Li H, Liu H, Li F, Wang H, Zhou J, Liang G. Numerical Simulation and Performance Analysis of DesanderDuring Tight Gas Provisional Process. Modelling. 2025; 6(3):57. https://doi.org/10.3390/modelling6030057
Chicago/Turabian StyleSun, Gang, Hua Li, Hongcheng Liu, Fuchun Li, Huanhuan Wang, Jun Zhou, and Guangchuan Liang. 2025. "Numerical Simulation and Performance Analysis of DesanderDuring Tight Gas Provisional Process" Modelling 6, no. 3: 57. https://doi.org/10.3390/modelling6030057
APA StyleSun, G., Li, H., Liu, H., Li, F., Wang, H., Zhou, J., & Liang, G. (2025). Numerical Simulation and Performance Analysis of DesanderDuring Tight Gas Provisional Process. Modelling, 6(3), 57. https://doi.org/10.3390/modelling6030057