Abstract
The fatigue of adhesive joints in offshore wind turbine blades is a critical and widespread challenge, necessitating an urgent focus on adhesive bond reliability. Given the constraints of full-scale testing, this research explores the fatigue endurance of carbon fiber–epoxy adhesive composites, integral to blade construction. Recognizing the fatigue characteristics’ sensitivity to environmental factors and joint dimensions, an innovative approach to fatigue modelling and evaluation is introduced. This method incorporates the influence of different environmental stresses and size effects. Specifically, a degradation coefficient and size impact factor (SIF) are introduced into the cyclic cohesive zone model, and a simulation-based analytic approach is proposed for analyzing adhesive fatigue. Furthermore, we introduce a reliability modelling procedure that integrates performance degradation theory to address the deteriorative characteristics inherent in adhesive fatigue. Subsequently, the specimens’ damage accumulation increased by 75% because of the stresses and escalated to 85% with adhesive joint size effects, causing carbon fiber Reinforced Polymer/epoxy adhesive joints to fail interfacially rather than in a mixed-mode manner. This study provides valuable insights for the safety analysis and assessment of adhesive joint performance in offshore wind turbine blades.
1. Introduction
As a crucial component of offshore wind turbines, the performance and reliability of the blades are crucial to ensure the normal operation of the entire system [1,2,3]. As shown in Figure 1, offshore wind turbine blades are joined together through the bonding of various composite material components: suction shell, pressure shell, leading edge, trailing edge, and spar cap. Extensive research has indicated that adhesive bonding regions are the most vulnerable areas in offshore wind turbine blades, and their bonding properties are considerably influenced by the marine environment and size effects, including factors such as temperature, humidity, salt spray, and adhesive joint sizes [4,5,6,7,8]. The adhesive bonding regions are prone to various fatigue-related issues, including interface failure, cohesive failure, and mixed failure. Furthermore, the coupling of environmental stresses and size effects can exacerbate the aforementioned concerns [9,10]. These problems present a significant risk to the safety and reliability of the blades during their operation.
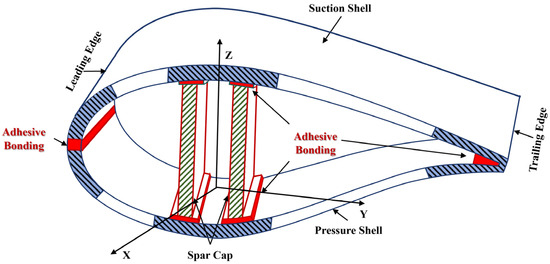
Figure 1.
The structure composition of an offshore wind turbine blade.
Fatigue testing at the material level furnishes essential cyclic load data for the adhesive structures of offshore wind turbine blades, which is instrumental for forecasting durability and for making strategic enhancements during the design phase. Full-scale testing ensures the safety and reliability of blades under actual operating conditions. Given the high cost, time consumption, and low reproducibility of full-scale fatigue testing for offshore wind blades, conducting material-level tests on adhesive samples made of carbon fiber and epoxy resin is particularly important [11]. Combining both testing methods can reduce costs, advance fatigue testing technology, and improve the performance and lifespan of wind turbine blades [12]. Zheng et al. [13] utilized nCode (2019 version) software and an equivalent model to assess the adhesive fatigue performance of bionic glass fiber composites blades for offshore wind turbines. The study revealed that fatigue damage predominantly occurs at the blade’s root edge and the skin–web junction, especially near the 50–60 m span tip. Shankar et al. [14] designed offshore wind turbine blade adhesive joints and, via shear tests, determined that the thickest joints sustained the most damage under a set impact energy. In contrast, thinner joints benefited from a 20% increase in failure load due to mechanical interlocking at the bond interface. Raman et al. [15] leveraged finite element analysis (FEA) to scrutinize the adhesive structure within the wind turbine blade’s pivotal region. The research findings underscore that adhesive delamination at the interface of the composite laminate and adhesive layer emerges as the predominant factor precipitating trailing edge deterioration. Li et al. [16] applied Fluent software (2021 version) for analyzing nine adhesive joint repair models of offshore wind turbine blades. The simulations highlighted that the overlap length and adhesive joint slope, as internal parameters, are crucial for improving adhesive performance at the sharp edge.
Numerous studies have shown that the fatigue characteristics of adhesive joints are influenced by multienvironmental stresses. Yang et al. [17] conducted torsion–tension tests and found that CFRP–steel adhesive specimens, when exposed to salt spray aging, would develop local cracks. This leads to a significant decrease in the torsional strength of the joint and ultimately adhesive failure. Chen [18] simulated the impact of marine environments on stitched joints through salt spray aging, analyzing changes in fracture surfaces and strain energy release rates. The study found that salt spray aging predominantly led to adhesive debonding failure by reducing critical strain energy release rates. Mu et al. [19] delved into the temperature’s influence on the fatigue life of adhesive joints in composite materials via aging tests. Their findings revealed that temperature has a negligible effect on fatigue life up to the brink of the adhesive’s glass transition temperature. However, beyond this point, the fatigue life experiences a pronounced downturn as temperatures escalate. Na et al. [20] conducted static tensile tests on BFRP–Al adhesive joints across a range of temperatures. The findings indicated that the adhesive strength of these joints significantly decreases with elevated temperatures. This decrease in adhesive strength leads to a decline in the joints’ adhesion and a reduction in their fatigue life. Rafiee et al. [21] revealed through static testing that glass–epoxy composite joints, when subjected to elevated humidity conditions, exhibit reduced shear strength, abbreviated fatigue life, and are prone to debonding and cracking at earlier stages of their service life. Hage et al. [22] found an inverse relationship between the fatigue life of glass–epoxy composite adhesives and aging time through shear tests. Initially, the fatigue life plummeted as moisture and oxidation rose in the adhesive layer. After 30 days, the specimens entered a saturated state, with fatigue life slowly deteriorating until eventual failure. Taskin et al. [23] compared metal lap shear tests between aged and nonaged specimens, finding a 50% drop in aged joints’ strength, mainly from interface failure. This underscores the substantial impact of environmental aging on adhesive joints’ fatigue properties.
Moreover, a comprehensive examination of the existing literature has delineated that adhesive joints, contingent upon their dimensional attributes, manifest divergent failure mechanisms and fracture topologies, underscoring the complexity of adhesive bond performance under fatigue conditions. Makkonen et al. [24] used the S-N method to fatigue-test 34CrNi3Mo adhesive joints with U-notches, revealing varying fracture rates and types, with quicker fractures tending towards cohesive failure. Sun and Zou [25,26] investigated single-lap carbon fiber composite joints with varying overlaps and found that increasing overlap length initially lowers shear strength, which later stabilizes, while the failure mode shifts from interface to mixed failure. Similarly, Zhao et al. [27] conducted shear tests on aluminum alloy adhesive specimens with varying adhesive thicknesses. Their results indicated that increasing the adhesive layer thickness by 0.1 mm, within the range of 0.1 mm to 0.5 mm, led to a 3.5% increase in shear strength. Tanulia et al. [28] used the virtual crack closure technique to simulate wind turbine blades with thick adhesive layers, finding that a 0.05 mm change in adhesive thickness caused roughly a 200 N variation in the blade’s load-bearing capacity. Rajad et al. [29] found through stiffness degradation tests that composite samples with adhesive lengths of 3.5–7.5 mm experienced rapid stiffness degradation, short fatigue lives, and were more likely to suffer interfacial damage. Meanwhile, samples with adhesive lengths over 7.5 mm showed slower stiffness degradation and longer fatigue lives, but were more prone to cohesive failure. The reviewed literature has meticulously examined the mechanical characteristics and the influence of size on specimens with varying adhesive dimensions.
Current research has mainly focused on the impact of individual environmental stresses on structural performance. However, few studies have addressed the effects of multiple environmental stresses, and even fewer have investigated the adhesive joint size effect on fatigue performance degradation under these conditions. The aforementioned studies compellingly underscore the imperative of examining the multienvironmental stress and size effects on the fatigue failure of bonded joints, highlighting the critical need for further investigation in this domain. Given this necessity, this study aims to fill these research gaps by proposing a novel modelling and assessment method. It evaluates the fatigue reliability of adhesive bonding in offshore wind turbine blades, taking into account the combined effects of multiple environmental stresses and size effects. Compared to existing research, this paper offers significant contributions, detailed as follows:
- (1)
- The degradation of adhesive performance is analyzed using the cyclic cohesive zone theory, which assesses cumulative fatigue damage in adhesive bonding. Additionally, a model depicting the degradation process is constructed.
- (2)
- The impact of various environmental stresses and size effects on the fatigue performance of the carbon fiber and epoxy adhesive bonding structures is investigated using a combination of experimental and simulation tests conducted on adhesive joints.
- (3)
- A novel approach is developed to model the fatigue reliability of the carbon fiber and epoxy adhesive bonding structures, taking into consideration the combined impacts of multiple environmental stresses and size effects.
The remainder of this paper is organized as follows: Section 2 presents the methodology for analyzing cumulative fatigue damage, considering the influence of multiple environmental stresses and size effects. Additionally, it proposes a novel adhesive fatigue reliability modelling method based on performance degradation theory. Section 3 conducts an experimental–numerical simulation to gather data on the degradation of fatigue performance in adhesive joints, taking into account the combined effects of environmental stresses and size variations. Section 4 utilizes the Wiener process to elucidate the degradation of fatigue performance and assesses the fatigue reliability of the adhesive joint under these conditions, and discusses the current assumptions and limitations of the CCZM. Finally, Section 5 summarizes the key findings and presents the conclusions of this study.
2. A Novel Adhesive Bonding Fatigue Reliability Modelling and Assessment Approach
2.1. Cyclic Cohesive Zone Model (CCZM)
The cohesive zone model, proposed by Siegmund [30], is a primary method for studying adhesive performance. The assumptions for applying the CCZM are as follows: It is assumed that the material is subjected to cyclic loading during the loading process, and its cohesive behavior is typically described by a nonlinear relationship; it is defined that no damage occurs at the beginning of each cycle of loading, and damage accumulation begins after the damage initiation point is exceeded; the differences in the material’s microstructure and mechanical properties are taken into account; the frequency and amplitude of the cyclic loading in the model are kept consistent in the analysis; under cyclic loading, the damage evolution equation can link fatigue damage with traction force and cumulative displacement.
The schematic diagram of the cohesive zone model is shown in Figure 2, where segment represents the initial elastic phase, indicating the process of gradually reaching the maximum traction force, and segment represents the damage evolution phase, indicating the process of damage accumulation [31].
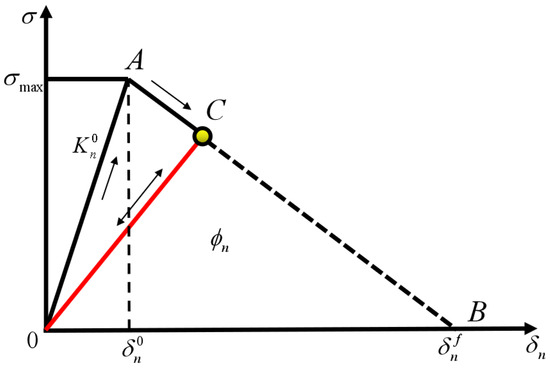
Figure 2.
Schematic diagram of the cohesive zone model.
Based on the relationship between fracture energy and failure fracture energy , the failure modes of the cohesive zone model can be determined. Here, the traction force is represented by , the separation displacement is represented by , and is the initial stiffness. The relationship of fracture energy in the cohesive zone model can be described by the following equation:
Based on Figure 2 and the geometric significance of Equation (1), the failure fracture energy of this model can be obtained as follows:
where is the area enclosed by the triangle in Figure 2, and the critical strength and fracture energy can be obtained from experimental data. If the bilinear cyclic cohesive zone model is deterministic, then the critical initial displacement and fracture failure displacement are also constant values. The traction–displacement relationship of the bilinear cyclic cohesive zone model considering fatigue damage is shown in Figure 3 [32].
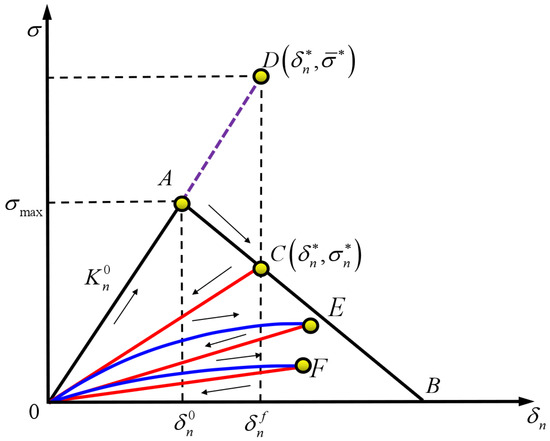
Figure 3.
Traction–displacement relationship.
According to Figure 3, where is the damage quantity, the relationship between the traction strength without considering damage and the traction strength considering damage can be obtained as follows:
This is obtained from the relationship between traction strength and model stiffness:
where is the initial stiffness and is the stiffness after damage discounting has occurred. By substituting Equations (4) and (5) into Equation (3), Equation (6) can be obtained as follows:
According to Equation (6), the evolution essence of the cyclic cohesive zone model is the process of material stiffness degradation. The damage state variable can be defined from Figure 3:
where is the maximum displacement value that can be reached during the experimental loading process, and the effective stress corresponding to is ; it can also be represented by . In Figure 3, the straight line segment represents the initial elastic phase, and its slope can be described as
The ontological relationship of the bilinear cyclic cohesive zone model can be obtained by combining Equations (3), (4), (7), and (8):
Here, represents the effective stress corresponding to the separation displacement of , where means that the model is in the initial elastic stage and no damage has occurred, means that the model is in the stage of damage evolution, and the evolution pattern follows the Equation (7).
2.2. A Modified CCZM Considering the Effects of Environmental Stresses
The adhesive performance degradation process under effects of environmental stresses is visually depicted in Figure 4. In this paper, the environmental degradation factor (Deg) and size impact factor (SIF), which are used to describe the coupling of environmental and sizes, are introduced as a methodology to quantify the extent of degradation of adhesive structures’ fatigue life. We denote the fatigue life of the adhesive bonding under the environmental conditions of aging time, temperature, and saline concentration as , respectively; , , and denote the length, width, and thickness of the bonding region, respectively. The environmental degradation factor and the size impact factor can be calculated as follows:
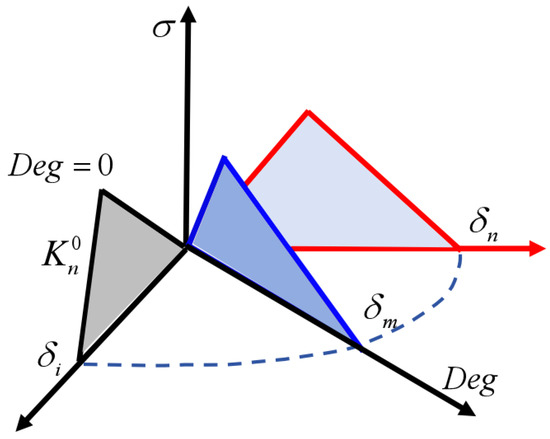
Figure 4.
Degradation process of cyclic cohesive zone model with the introduction of environmental degradation factors.
In Equation (10), indicates the fatigue life of unaged adhesive specimens, and represents the fatigue life under environmental impact. signifies undamaged adhesive structure, while marks its progressive damage to failure. Considering the complex interplay of various environmental factors on the adhesive bond of the blade, the environmental degradation factor is articulated as follows:
According to cyclic cohesive zone theory, after introducing the environmental degradation factor and size factor, the fatigue damage model should be rewritten as
where is the volume of fatigue damage corresponding to each strain increment, is strain increment, the current traction force is obtained by substituting the strain into the ontological equation, is the maximum traction force under the damaged state, is the initial damage separation displacement, is a Heaviside function, and , denotes the link between current strain increment and initial damage displacement. Only when will fatigue cumulative damage occur; is the fatigue damage parameter in the model, which is usually set as times the initial separation displacement ; is the size effect factor; is another parameter in the fatigue damage model; and is known from Equation (13). When , no damage occurs.
2.3. Performance Degradation Analysis-Based Adhesive Fatigue Reliability Modelling and Assessment
Performance degradation analysis is frequently utilized for the purpose of reliability assessment and fatigue life prediction [33,34]. In this study, the Wiener process and a probabilistic failure model are combined to describe the performance degradation trajectory of adhesive bonding. This approach is used to depict the degradation process of adhesive performance, as illustrated in Figure 5.
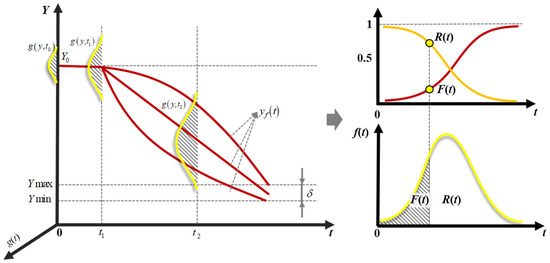
Figure 5.
Degradation-trajectory-based reliability modelling and assessment.
In this context, refers to the reliability function, is the failure function, is the probability density function of , and is the performance degradation function.
The Wiener process, being a continuous-time random process, is widely used in nonmonotonic degradation modelling and fatigue life prediction [35]. The expression of the Wiener process is as follows:
where is the amount of performance degradation at time ; is drift coefficient; is diffusion coefficient; and is standard Brownian motion with .
We assume that the degradation process of adhesive performance of the blade follows a linear Wiener process with smooth independent increments. Thus, Equation (14) can be modified as [36]:
where and are the degradation amounts at the initial degradation stage and a certain degradation time , respectively.
We assume that the fatigue performance of the adhesive bonding degrades following the wiener process in the time interval , and the failure threshold is w. Then, the corresponding probability density function and cumulative failure distribution function can be expressed as follows [37]:
Moreover, the reliability can be calculated:
For the fatigue performance of adhesive bonding in offshore wind turbine blade, Equation (15) can be modified as follows:
The corresponding probability density function and cumulative failure distribution function are
Then, the reliability of adhesive bonding in offshore wind turbine blade at time can be calculated as follows:
3. Experimental–Numerical Simulation Analysis of Carbon Fiber/Epoxy Resin Bonded Structure Incorporating Multienvironmental Stresses and Size Effects
3.1. Environmental Aging Tests and Fatigue Tests
In this study, the epoxy structural adhesive WD3135/3137, which is commonly used in offshore wind turbine blades, is chosen as the adhesive. The single-lap joint specimens are prepared by using carbon fiber reinforced polymer (CFRP) as the substrate and epoxy resin as the spacer plate [4]. The structural configuration of the specimen is depicted in Figure 6.
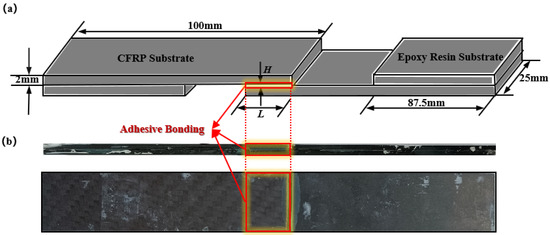
Figure 6.
(a) Schematic diagram of the single lap joint specimen; (b) Physical drawing of a single lap joint specimen.
Based on the standards GB/T 2573-2008 [38] and GB/T 16779-2008 [39], the specimens were divided into 23 groups for environmental aging tests, as depicted in Figure 7a,b. Environmental and dimensional factors, such as saline concentration, temperature, aging time, and bonding dimensions, were assigned different levels, as outlined in Table 1. Subsequently, the specimens underwent aging tests and were subsequently subjected to tensile tests and fatigue tests (, ), as illustrated in Figure 8b. The static tensile process and failure behaviors of the specimens were recorded (see Figure 8a,c). The fatigue life and fracture morphology of each specimen was analyzed (Figure 9). The results of the static tensile test are shown in Figure 10. The results of the fatigue tests are presented in Figure 11.
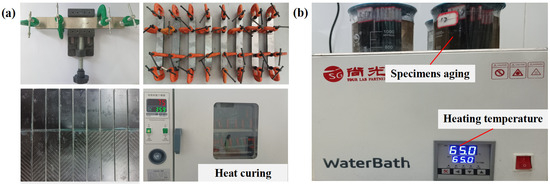
Figure 7.
(a) The fabrication process of the adhesive samples; (b) environmental aging test.

Table 1.
Stress level information of the specimens.
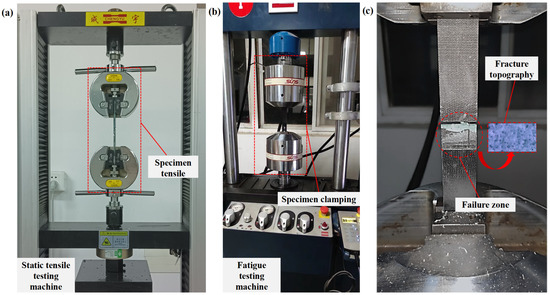
Figure 8.
(a) Static test; (b) fatigue life test; (c) fatigue failure.
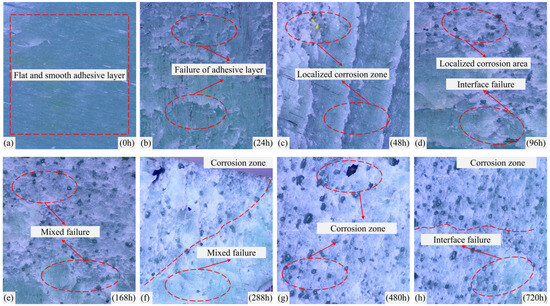
Figure 9.
(a) Cross-sectional failure diagram of the bonding layer of an unaged specimen; (b) Section failure diagram of the bonding layer after aging the specimen for 24 h; (c) Section failure diagram of the bonding layer after aging the specimen for 48 h; (d) Section failure diagram of the bonding layer after aging the specimen for 96 h; (e) Section failure diagram of the bonding layer after aging the specimen for 168 h; (f) Section failure diagram of the bonding layer after aging the specimen for 288 h; (g) Section failure diagram of the bonding layer after aging the specimen for 480 h; (h) Section failure diagram of the bonding layer after aging the specimen for 720 h.
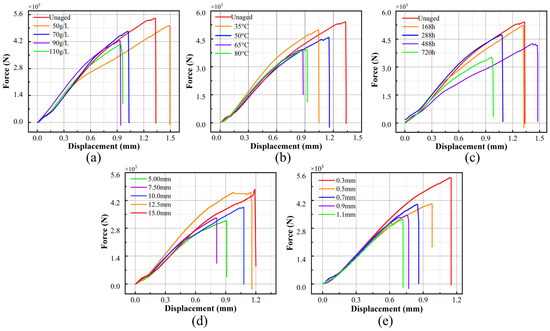
Figure 10.
(a) Static tensile testing in relation to salt concentration; (b) static tensile testing in relation to temperature; (c) static tensile testing in relation to aging time; (d) static tensile testing in relation to bonding length; (e) static tensile testing in relation to bonding width.
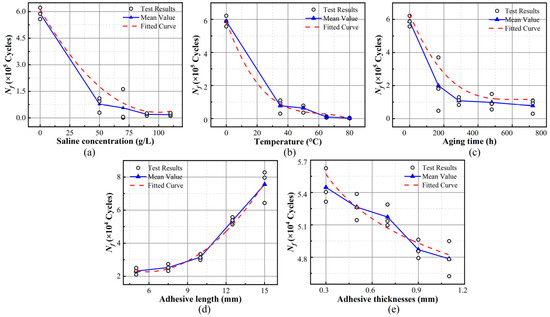
Figure 11.
(a) Fatigue life in relation to salt concentration; (b) fatigue life in relation to temperature; (c) fatigue life in relation to aging time; (d) fatigue life in relation to bonding length; (e) fatigue life in relation to bonding width.
As can be seen from Figure 9, the surface of the adhesive layer of the unaged specimen (Figure 8a) is almost smooth. With the increase in aging time, the adhesive layer is gradually eroded by the saltwater solution (Figure 9a–h), and delamination failure begins to occur. As the erosion area gradually expands, the specimen transitions from mixed failure to interfacial failure, and, ultimately, adhesive failure occurs.
Figure 10a–c demonstrate that specimens exposed to environmental aging exhibit substantial adhesive damage. With the progression of salt concentration, aging temperature, and aging duration, there is a notable decline in the load-bearing capability of the samples, amounting to 17.24%, 27.24%, and 36.21%, respectively. An increase in the overlap length of the samples results in enhanced load-bearing capacity and toughness, as observed from various tensile displacement measurements. However, an increase in the thickness of the overlap leads to a gradual decrease in load-bearing capacity and a relative reduction in toughness, according to different tensile displacement results. Moreover, as can be seen from Figure 10d,e, samples with varying adhesive bond dimensions exhibit considerable variability in their maximum load-bearing capacity, with decreases of 28.22% and 23.1% in carrying capacity, respectively, further demonstrating the impact of size effects on the mechanical properties of the samples. Significantly, the static evaluations of adhesive single-lap specimens, undertaken in the presence of a variety of environmental stresses and dimensional effects, establish a benchmark for their subsequent fatigue assessments.
Figure 11 delineates the patterns of fatigue life deterioration under a multitude of environmental and dimensional parameters. It is manifest that an escalation in saline concentration, temperature, and the duration of aging is directly associated with a reduction in the endurance of the material against fatigue. However, the degradation tendency ultimately reaches a stabilization point, resulting in a transition from mixed failure to interface failure. Notably, the impact of temperature on the fatigue life of adhesive bonding is particularly significant. In specimens tested at °C, a significant decrease in fatigue life of 99.57% was observed. This finding highlights the high sensitivity of adhesive bonding to temperature factors. The primary cause of this sensitivity is attributed to an increase in temperature, which amplifies thermal expansion and moisture absorption at the bonding interface, consequently leading to a reduction in bonding strength. Moreover, when exposed to specific salt concentration and , it was observed that the fatigue life degradation increased by 96.78% and 97.70% as the temperature rose, with a corresponding increase of 0.92%. These findings indicate that the cumulative impact of multiple environmental stresses amplifies the damage accumulation in adhesive bonding, ultimately resulting in fatigue failure. In general, there is a positive correlation between bonding dimensions and fatigue life. More specifically, as can be seen in Figure 11d, for each increase in bonding length (ranging from 5 mm to 15 mm), the fatigue life demonstrates an associated increase of 28%. Conversely, Figure 11e indicates that as the bond thickness varies from 0.3 mm to 1.1 mm, there is a gradual 11% decrease in the fatigue life of the specimens.
3.2. Fatigue Numerical Simulation Analysis
This study aims to investigate the variations in internal stresses within the adhesive joint and the fatigue failure process under cyclic loading. To this end, a three-dimensional model of the bonding joint is created using the ABAQUS software (2021 version), which employs a CCZM, as depicted in Figure 12. In this figure, the adhesive layer is represented by the cohesive element (COH3D8), characterized by its bilinear shear separation properties. This representation facilitates the investigation of fatigue damage and failure modes within the adhesive layer when subjected to shear.
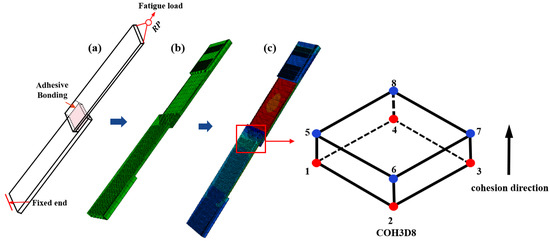
Figure 12.
(a) Schematic diagram of the constraint conditions applied to the 3D model; (b) Visualization cloud map of the undeformed specimen; (c) Visualization cloud map of specimen deformation with cohesive force elements in the adhesive layer.
To incorporate the analysis of environmental stress effects and size effects into fatigue failure analysis, the fatigue simulation of adhesive bonding is conducted by integrating the multienvironment degradation factor (Deg) and size impact factor (SIF) into the CCZM in ABAQUS using the USDFLD subroutine. The adhesive bonding failure process follows three stages: initial crack formation, crack propagation, and complete failure. The initial conditions for adhesive layer destruction and the criteria for complete failure are defined based on the second-order nominal stress criterion and the second-order energy criterion, respectively. Based on test data obtained in Section 3.1, the initial parameters of the cyclic cohesive zone model are set as . The fatigue damage process of the specimen is depicted in Figure 13. Here, is stress, is the fatigue damage accumulation of the adhesive layer, and is the equivalent strain. indicates that the bonding area is undamaged, while represents complete failure occurring. The fatigue failure of adhesive bonding begins at the edges of the overlap region and progressively extends towards the center. When the remaining bonded region becomes insufficient to meet the demanded fatigue strength, the adhesive bonded specimen fractures. This phenomenon corresponds to the failure observed in fatigue tests conducted on adhesive joints.
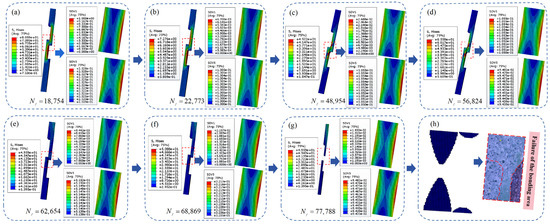
Figure 13.
(a) Damage stress map for a specimen life of 18,754 cycles; (b) Damage stress map for a specimen life of 22,773 cycles; (c) Damage stress map for a specimen life of 48,954 cycles; (d) Damage stress map for a specimen life of 56,824 cycles; (e) Damage stress map for a specimen life of 62,654 cycles; (f) Damage stress map for a specimen life of 68,869 cycles; (g) Damage stress map for a specimen life of 777,788 cycles; (h) (Failure stress map of the specimen).
The fatigue simulation results are obtained and presented in Table 2 and Table 3. For further analysis, comparisons with experimental test results are depicted in Figure 14. Observations from Figure 14 indicate that the simulation results, which take into account environmental and size factors, closely match the test outcomes. The fitting degree for the curve is determined to be 0.9886. Consequently, the fatigue analysis methodology introduced in this study demonstrates its suitability for assessing the fatigue reliability of adhesive bonding in offshore wind turbine blades.

Table 2.
Fatigue life of bonding joints under different environmental stresses.

Table 3.
Fatigue life of bonding joints with different bonding dimensions.
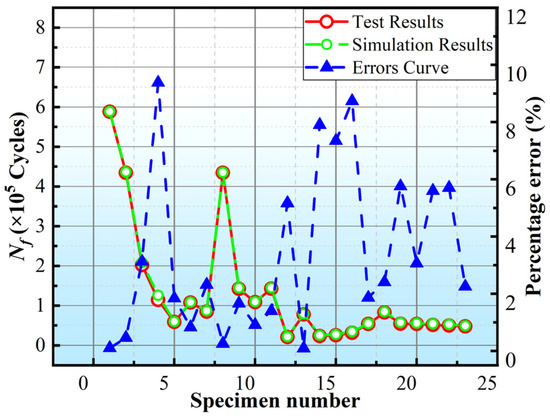
Figure 14.
Comparisons of fatigue simulation results and test results.
4. Fatigue Reliability Modelling and Assessment of Adhesive Bonding Incorporating Multiple Environmental Stresses and Size Effects
4.1. Fatigue Performance Degradation Analysis
Expanding upon the findings detailed in Section 3.2, this research delves into the fatigue fracture characteristics of adhesively bonded joints, taking into account a spectrum of environmental influences and the implications of scale. To better characterize and model the failure behavior, we gathered fatigue accumulation damage data for the bonding joints across a range of environmental and dimensional conditions, as illustrated in Figure 15.
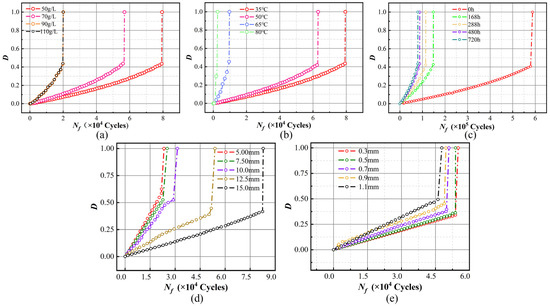
Figure 15.
(a) Fatigue damage accumulation in relation to salt concentration; (b) fatigue damage accumulation in relation to temperature; (c) fatigue damage accumulation in relation to aging time; (d) fatigue damage accumulation in relation to bonding length; (e) fatigue damage accumulation in relation to bonding width.
Figure 15 illustrates the cumulative fatigue damage progression in bonding joints influenced by environmental and size factors. The research findings reveal substantial variations in the rate of fatigue damage accumulation within adhesive bonds, which are significantly influenced by environmental stresses and the effects of size. Specifically, as can be seen from Figure 15a–c, when the saline concentration exceeds threshold and the temperature surpasses threshold °C, the specimens exhibit a 75% increase in the rate of fatigue damage accumulation, which significantly increases further after an aging time of 168 h. From the damage cumulative trajectory in Figure 15d,e, it is evident that bonding joints with bonding lengths ranging from 5 mm to 15 mm exhibit a relatively rapid rate of fatigue damage accumulation, and this rate increases by 27.5% for joints with an overlap length of less than 12.5 mm. The fatigue damage accumulation rate of specimens with different bonding thicknesses is relatively slow, exhibiting an increasing trend from 0.3 mm to 1.1 mm, and the fatigue damage accumulation rate of specimens with overlap thicknesses greater than 0.7 mm increased by 6.25%. According to fatigue damage cumulative theory, the more fatigue damage accumulates, the lower the fatigue strength of the structure and the shorter the fatigue life [40]. Therefore, the accumulated fatigue damage can be used as an indicator to characterize the degradation of fatigue performance [41,42,43]. From Figure 15, it can be observed that the cumulative fatigue damage of the bonding joint increases monotonically. Thus, the Wiener process can be used to model the fatigue performance degradation trajectory.
4.2. Fatigue Reliability Modelling and Assessment Based on Fatigue Performance Degradation Analysis
Based on Section 4.1’s fatigue damage data (Figure 15), the adhesive’s fatigue performance degradation is modelled by a nonlinear Wiener process , with as the drift coefficient and as the diffusion coefficient. The and estimates for each degradation dataset are determined by maximum likelihood estimation method, detailed in Table 4 and Table 5. The range of the fatigue damage cumulative amount D is [0, 1]. According to the concept of first arrival time, fatigue failure will occur in the bonding joint when the cumulative degradation reaches 1 for the first time. The corresponding time will be considered as its fatigue life [44,45]. The reliability of the bonding joint under various environmental stresses and bond sizes are calculated from Equation (23), with results plotted in Figure 16.

Table 4.
Wiener process parameters estimation for bonding joints considering environmental factors.

Table 5.
Wiener process parameters estimation for bonding joints considering size factors.
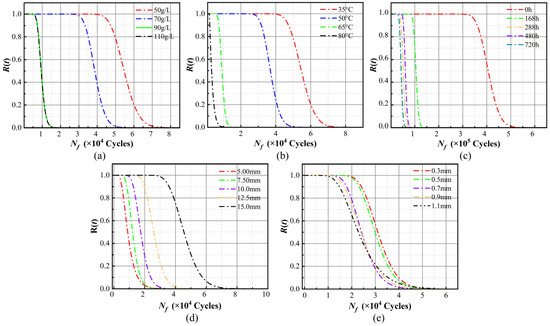
Figure 16.
(a) Reliability curves in relation to salt concentration; (b) reliability curves in relation to temperature; (c) reliability curves in relation to aging time; (d) reliability curves in relation to bonding length; (e) reliability curves in relation to bonding width.
Upon examining Figure 16, it can be inferred that there is a corresponding decrease in the periods at which the reliability of the blade specimens is 1 as the saline concentration, temperature, and aging time increase. Notably, adhesive joint reliability significantly declines when salt concentration is above 70 g/L, temperature exceeds °C, and aging time surpasses 168 h. Particularly at temperature °C, the joint reliability drops markedly. Moreover, as the bonding length decreases and the bonding thickness increases, the period at which the reliability of the blade specimens is 1 will also decrease. Bonding joints with length and thickness experience a rapid decline in reliability and fatigue life, highlighting a pronounced size effect. This result highlights the critical necessity of integrating environmental stresses and dimensional factors into the design and fabrication processes of wind turbine blades. Such considerations are paramount to ensuring their safety and reliability throughout operation [46].
In the process of fatigue reliability modelling for blade adhesive structures, it was found that the CCZM still has certain limitations. The determination of the cyclic cohesive zone model parameters usually requires a large number of experiments and analysis work; in numerical simulation, CCZM may face convergence issues, which require the use of specific numerical techniques to solve; the CCZM needs to be closely combined with experimental data to ensure the accuracy of the model parameters and the effectiveness of the model prediction.
5. Conclusions
The research on the environmental durability and size effects of CFRP/epoxy adhesive structures forms the fundamental basis for ensuring the reliable operation of offshore wind turbine systems throughout their entire service life. This paper introduces a fatigue reliability modelling and assessment method based on performance degradation analysis. The conclusions of the research are as follows:
- (1)
- Multienvironmental aging tests exposed pronounced size effects in the adhesive structures of various dimensions when subjected to multienvironmental stress. The damage accumulation in specimens escalated by 75% as a result of these stresses. Moreover, with the compounding influence of size effects, this figure escalated further to 85%, precipitating a shift in the failure mode for CFRP/epoxy adhesive joints from mixed to interfacial.
- (2)
- This paper introduces environmental degradation factors and size factors into the CCZM, taking into account the coupled effects of multienvironmental stresses and size effects on carbon fiber/epoxy adhesive structures. The proposed numerical simulation method can effectively simulate the fatigue life of blade adhesive structures, with a simulation error within 10%.
- (3)
- To address the characteristics of adhesive fatigue joint performance degradation, this paper employed a nonlinear Wiener process to describe the degradation process. Consequently, a fatigue reliability model for bonding joints was established, considering the impact of multiple environmental stresses and size effects. The reliability of bonding joints was assessed accordingly.
- (4)
- This paper introduces environmental degradation coefficients and size effect factors into the CCZM, effectively assessing the fatigue damage in wind turbine blade adhesive samples due to multienvironmental stresses and size effects. Although the assumptions of the proposed model have certain limitations, it still provides a theoretical method for the reliability research of adhesive structures in wind turbine blades.
Author Contributions
Z.S.: data curation, formal analysis, investigation, visualization, writing—original draft. Z.L.: Management and coordination of the planning and execution of research activities, with supervisory and leadership responsibility for the planning and execution of research activities. J.L.: Providing experimental data, formal analysis, surveys, visualizations. H.L.: Providing experimental data, formal analysis, surveys, visualizations. Y.Z.: Providing experimental data, formal analysis, surveys, visualizations. All authors have read and agreed to the published version of the manuscript.
Funding
This research was funded by the GuangDong Basic and Applied Basic Research Foundation (2022A1515240006), the National Natural Science Foundation of China (52175132), and National Natural Science Foundation of China (51905116).
Data Availability Statement
No new data were created or analyzed in this study. The original contributions presented in the study are included in the article.
Conflicts of Interest
The authors declare no conflicts of interest.
References
- Li, H.; Soares, C.G. Assessment of failure rates and reliability of floating offshore wind turbines. Reliab. Eng. Syst. Saf. 2022, 228, 108777. [Google Scholar] [CrossRef]
- Yan, J.; Tong, L.; Xiang, P. Free vibration analysis of single-walled boron nitride nanotubes based on a computational mechanics framework. Superlattices Microstruct. 2017, 112, 230–248. [Google Scholar] [CrossRef]
- Liao, D.; Zhu, S.-P.; Correia, J.A.; De Jesus, A.M.; Veljkovic, M.; Berto, F. Fatigue reliability of wind turbines: Historical perspectives, recent developments and future prospects. Renew. Energy 2022, 200, 724–742. [Google Scholar] [CrossRef]
- Li, Y.; Liu, Z.; He, Z.; Tu, L.; Huang, H.-Z. Fatigue reliability analysis and assessment of offshore wind turbine blade adhesive bonding under the coupling effects of multiple environmental stresses. Reliab. Eng. Syst. Saf. 2023, 238, 109426. [Google Scholar] [CrossRef]
- Xu, K.; Liu, F.; Liu, D. A multifield loads evaluation method for offshore wind turbines considering multivariate coherence effect. Ocean Eng. 2023, 280, 114586. [Google Scholar] [CrossRef]
- Shafiee, M.; Finkelstein, M.; Bérenguer, C. An opportunistic condition-based maintenance policy for offshore wind turbine blades subjected to degradation and environmental shocks. Reliab. Eng. Syst. Saf. 2015, 142, 463–471. [Google Scholar] [CrossRef]
- Wang, B.; Wang, L.; Liang, X.; Sheng, F.; Zhang, J.; Hong, Y.; Wang, L. 3D multiscale dynamic analysis of offshore wind turbine blade under fully coupled loads. Renew. Energy 2024, 223, 119985. [Google Scholar] [CrossRef]
- Rezaee, M.; Aly, A.M. Vibration Control in Wind Turbines to Achieve Desired System-Level Performance under Single and Multiple Hazard Loadings. Struct. Control Health Monit. 2018, 25, e2261. [Google Scholar] [CrossRef]
- Horn, J.-T.; Leira, B.J. Fatigue reliability assessment of offshore wind turbines with stochastic availability. Reliab. Eng. Syst. Saf. 2019, 191, 106550. [Google Scholar] [CrossRef]
- Na, J.; Mu, W.; Qin, G.; Tan, W.; Pu, L. Effect of temperature on the mechanical properties of adhesively bonded basalt FRP-aluminum alloy joints in the automotive industry. Int. J. Adhes. Adhes. 2018, 85, 138–148. [Google Scholar] [CrossRef]
- Khoshmanesh, S.; Watson, S.; Zarouchas, D. The effect of the fatigue damage accumulation process on the damping and stiffness properties of adhesively bonded composite structures. Compos. Struct. 2022, 287, 115328. [Google Scholar] [CrossRef]
- Jørgensen, J.B.; Sørensen, B.F.; Kildegaard, C. Tunneling cracks in full scale wind turbine blade joints. Eng. Fract. Mech. 2018, 189, 361–376. [Google Scholar] [CrossRef]
- Zheng, T.; Zhao, C.; He, J. Research on fatigue performance of offshore wind turbine blade with basalt fiber bionic plate. Structures 2023, 47, 466–481. [Google Scholar] [CrossRef]
- Verma, A.S.; Vedvik, N.P.; Gao, Z.; Castro, S.G.P.; Teuwen, J.J.E. Bondline Thickness Effects on Damage Tolerance of Adhesive Joints Subjected to Localized Impact Damages: Application to Leading Edge of Wind Turbine Blades. Materials 2021, 14, 7526. [Google Scholar] [CrossRef]
- Raman, V.; Drissi-Habti, M.; Guillaumat, L.; Khadhour, A. Numerical simulation analysis as a tool to identify areas of weakness in a turbine wind-blade and solutions for their reinforcement. Compos. Part B Eng. 2016, 103, 23–39. [Google Scholar] [CrossRef]
- Li, H.; Zhang, X.; Zhou, B.; Wang, L.; Zhu, C. Study on the repair parameters for trailing-edge bonding failure of wind turbine blade in service. Energy Sci. Eng. 2022, 11, 143–163. [Google Scholar] [CrossRef]
- Yang, Y.; Zhao, J.; Zhang, S.; Yang, Z.; Biscaia, H. Influence of salt fog and ambient condition exposure on CFRP-to-steel bonded joints. Compos. Struct. 2022, 280, 114874. [Google Scholar] [CrossRef]
- Lin, C. Study on the interlaminar fracture toughness of stitched composites type I under salt spray environment. Master’s Thesis, Tiangong University, Tianjin, China, 2021. [Google Scholar] [CrossRef]
- Mu, W.-L.; Xu, Q.-H.; Na, J.-X.; Wang, H.; Tan, W.; Li, D.-F. Influence of temperature and humidity on the fatigue behaviour of adhesively bonded CFRP/aluminium alloy joints. J. Adhes. 2022, 98, 1358–1376. [Google Scholar] [CrossRef]
- Na, J.X.; Wang, G.B.; Zhuang, W.M.; Mu, W.L.; Xi, Q.H. A review on structural strength and environmental durability of composite bonded structures. J. Transp. Eng. 2021, 21, 78–93. [Google Scholar] [CrossRef]
- Rafiee, R.; Hashemi-Taheri, M.R. Failure analysis of a composite wind turbine blade at the adhesive joint of the trailing edge. Eng. Fail. Anal. 2021, 121, 105148. [Google Scholar] [CrossRef]
- El Hage, J.; Challita, G.; Capelle, J.; Gilgert, J.; Alhussein, A. Influence of short-time thermal ageing on the behaviour of double lap composite adhesively bonded joints. SN Appl. Sci. 2020, 2, 1734. [Google Scholar] [CrossRef]
- Taskin, N.U.; Sahin, A. Effect of aging time at high temperature on the shear strength of adhesively bonded aluminum composite foam joints. J. Adhes. 2019, 95, 308–324. [Google Scholar] [CrossRef]
- Makkonen, M. Notch size effects in the fatigue limit of steel. Int. J. Fatigue 2003, 25, 17–26. [Google Scholar] [CrossRef]
- Sun, L.; Tie, Y.; Hou, Y. Prediction of failure behavior of adhesively bonded CFRP scarf joints using a cohesive zone model. Eng Fract Mech 2020, 228, 1068977. [Google Scholar] [CrossRef]
- Zou, T.C.; Fu, J.; Li, L.H.; Liu, Z.H.; Zhu, H. Effect of lap length on the tensile properties and damage characteristics of CFRP single-lap glued joints. Mater. Eng. 2021, 49, 158–165. [Google Scholar] [CrossRef]
- Zhao, L.Y.; Liu, Y.; Xu, Y.M.; Jiang, Y. A brief discussion on the application of PFMEA in the bonding process of offshore wind turbine blades. FRP/Composites 2019, 303, 58–61. [Google Scholar] [CrossRef]
- Tanulia, V.; Wang, J.; Pearce, G.M.; Baker, A.; Chang, P.; Prusty, B.G. Experimental and computational assessment of disbond growth and fatigue life of bonded joints and patch repairs for primary airframe structures. Int. J. Fatigue 2022, 159, 106776. [Google Scholar] [CrossRef]
- Rajad, O.; Mounir, H.; El Marjani, A.; Fertahi, S.E.-D. Nonlinear modeling analysis of the coupled mechanical strength and stiffness enhancement of composite materials of a Horizontal Axis Wind Turbine Blade (HAWTB). Int. J. Interact. Des. Manuf. 2022, 16, 469–492. [Google Scholar] [CrossRef]
- Siegmund, T. A numerical study of transient fatigue crack growth by use of an irreversible cohesive zone model. Int. J. Fatigue 2004, 26, 929–939. [Google Scholar] [CrossRef]
- Beber, V.; Schneider, B.; Brede, M. Efficient critical distance approach to predict the fatigue lifetime of structural adhesive joints. Eng. Fract. Mech. 2019, 214, 365–377. [Google Scholar] [CrossRef]
- Roth, S.; Kuna, M. Prediction of size-dependent fatigue failure modes by means of a cyclic cohesive zone model. Int. J. Fatigue 2017, 100, 58–67. [Google Scholar] [CrossRef]
- Yan, T.; Lei, Y.; Li, N.; Wang, B.; Wang, W. Degradation modeling and remaining useful life prediction for dependent competing failure processes. Reliab. Eng. Syst. Saf. 2021, 212, 107638. [Google Scholar] [CrossRef]
- Yan, T.; Wang, D.; Hou, B.; Peng, Z. Generic framework for integration of first prediction time detection with machine degradation modelling from frequency domain. IEEE Trans. Reliab. 2022, 71, 1464–1476. [Google Scholar] [CrossRef]
- Yang, J.; Meng, D.B.; Zhang, X.L. Reliability Based Design Optimization of Aero-Engine Spindle Ball Bearings. J. Donghua Univ. 2014, 31, 853–855. [Google Scholar]
- Wang, X.; Wang, B.X.; Jiang, P.H.; Hong, Y. Accurate reliability inference based on Wiener process with random effects for degradation data. Reliab. Eng. Syst. Saf. 2020, 193, 106631. [Google Scholar] [CrossRef]
- Zhao, J.; Zhou, Y.; Zhu, Q.; Song, Y.; Liu, Y.; Luo, H. A remaining useful life prediction method of aluminum electrolytic capacitor based on wiener process and similarity measurement. Microelectron. Reliab. 2023, 142, 114928. [Google Scholar] [CrossRef]
- GB/T 2573-2008; Test Method for Aging Performance of Glass Fiber Reinforced Plastics. National Standards of People’s Republic of China: Beijing, China, 2008.
- GB/T 16779-2008; Test Method for Tensile-Tensile Fatigue Properties of Fiber-Reinforced Plastic Laminates. National Standards of People’s Republic of China: Beijing, China, 2008.
- Zhu, S.-P.; Liu, Q.; Lei, Q.; Wang, Q. Probabilistic fatigue life prediction and reliability assessment of a high pressure turbine disc considering load variations. Int. J. Damage Mech. 2018, 27, 1569–1588. [Google Scholar] [CrossRef]
- Li, Y.-F.; Liu, Y.; Huang, T.; Huang, H.-Z.; Mi, J. Reliability assessment for systems suffering common cause failure based on Bayesian networks and proportional hazards model. Qual. Reliab. Eng. Int. 2020, 36, 2509–2520. [Google Scholar] [CrossRef]
- Mi, J.; Lu, N.; Li, Y.-F.; Huang, H.-Z.; Bai, L. An evidential network-based hierarchical method for system reliability analysis with common cause failures and mixed uncertainties. Reliab. Eng. Syst. Saf. 2022, 220, 108295. [Google Scholar] [CrossRef]
- Mi, J.; Li, Y.-F.; Peng, W.; Huang, H.-Z. Reliability analysis of complex multi-state system with common cause failure based on evidential networks. Reliab. Eng. Syst. Saf. 2018, 174, 71–81. [Google Scholar] [CrossRef]
- Zhang, X.; Huang, H.; Zhang, X.; Zhang, K. A multiaxial probabilistic fatigue life prediction method for nickel-based single crystal turbine blade considering mean stress correction. Qual. Reliab. Eng. Int. 2023, 39, 1735–1755. [Google Scholar] [CrossRef]
- Zhang, X.; Zhang, K.; Yang, X.; Fazeres-Ferradosa, T.; Zhu, S.-P. Transfer learning and direct probability integral method based reliability analysis for offshore wind turbine blades under multi-physics coupling. Renew. Energy 2023, 206, 552–565. [Google Scholar] [CrossRef]
- Malhotra, P.; Hyers, R.; Manwell, J.; McGowan, J. A review and design study of blade testing systems for utility-scale wind turbines. Renew. Sustain. Energy Rev. 2012, 16, 284–292. [Google Scholar] [CrossRef]
Disclaimer/Publisher’s Note: The statements, opinions and data contained in all publications are solely those of the individual author(s) and contributor(s) and not of MDPI and/or the editor(s). MDPI and/or the editor(s) disclaim responsibility for any injury to people or property resulting from any ideas, methods, instructions or products referred to in the content. |
© 2024 by the authors. Licensee MDPI, Basel, Switzerland. This article is an open access article distributed under the terms and conditions of the Creative Commons Attribution (CC BY) license (https://creativecommons.org/licenses/by/4.0/).