1. Introduction
Concrete bridge-building techniques in Norway have been around since the early 20th century [
1,
2]. The most used bridge types are reinforced concrete bridges [
3,
4], incremental launching method bridges [
5,
6], precast concrete bridges [
7,
8], and post-tensioned cast concrete bridges. Cast concrete girder bridges evolved due to the limitations of older bridge designs [
9]. They consist of concrete girders, horizontal beams that sustain the bridge’s weight, and passing traffic. They are strengthened with steel bars to increase strength and longevity and are commonly precast or cast-in-place. The pillars and abutments are the vertical columns and supports that secure the girders and convey the bridge’s weight to the ground. Decking is the surface of the bridge that traffic travels on, and bearings are the components that allow the bridge to move and expand or contract as the temperature changes [
10].
Over the last half century, finite element modeling (FEM) has revolutionized the analysis of concrete bridges, enabling engineers to develop models and assess their behavior under dead loads, live loads, wind, seismic loads, and varying boundary conditions [
11]. It provides vital information regarding the strength and stability of bridges, resulting in greater design precision, decreased dependency on physical testing, cost-effectiveness, and safety optimization. Case studies have shown the beneficial influence of numerical research on concrete bridges, leading to safer, more resilient, and long-lasting structures [
12]. Researchers have conducted numerous case studies to solve a wide range of problems, such as a novel non–linear analysis model created to examine the effects of creep and shrinkage on long-span prestressed concrete box girder bridges [
13], the construction of a prestressed concrete cable-stayed bridge by employing the progressive cantilever method in FEM [
14], a shell model for the load-carrying capacity of prestressed concrete bridges under shear and torsion [
15], and a new FEM for analyzing the structural behavior of fiber-reinforced polymer (FRP)-strengthened steel-reinforced concrete (RC) beams under cyclic loading using FEM [
16].
Using various FEM approaches, extensive research has examined concrete bridges’ construction adaptability, serviceability, and reliability. The significance of the finite element approach for assessing concrete bridges is increasing with numerous advanced FEM models validated against the experimental results. This also indicates that FEM is one of the most reliable techniques for investigating superstructures [
17].
This work intends to improve the future of bridge construction by developing better techniques and methods for the autonomous monitoring of structural health, addressing the considerable resources currently dedicated to bridge maintenance. Herøysund Bridge in Norway [
18], currently with limited structural health and maintenance documentation, is the centerpiece of this study. Since no 3D–solid- or shell-based FEM exists for the bridge, this work adds novelty. These insights could transform the approach to monitoring structural integrity, streamlining the process, reducing costs, and facilitating quicker responses to other complex bridges.
This work includes developing reliable models representing Herøysund Bridge’s physical behavior. As the bridge will shortly undergo in situ testing, the model should be accurate enough to replicate the actual bridge’s behavior, enabling the design and interpretation of experimental test outcomes with the numerical results obtained in this study. Therefore, a detailed 3D–solid element model and a 3D–shell element model (hereinafter called the “Shell model” for brevity) is created using Solidworks [
19] and ANSYS SpaceClaim [
20]. Both models undergo structural and modal analysis to determine their natural frequencies and mode shapes under realistic boundary conditions. The last step is a comparison of both models in terms of vibration using the modal assurance criterion (MAC) to identify the similarity of the mode shapes in the models. This would validate FEM for the shell-based model identifying the resonant frequencies. The main target is to prove that both models can lead to obtaining very similar information, and, consequently, they may be used alternatively. Of course, using a shell model can reduce the computational efforts in numerical analyses and, consequently, easily achieve results.
2. Herøysund Bridge and Research Project
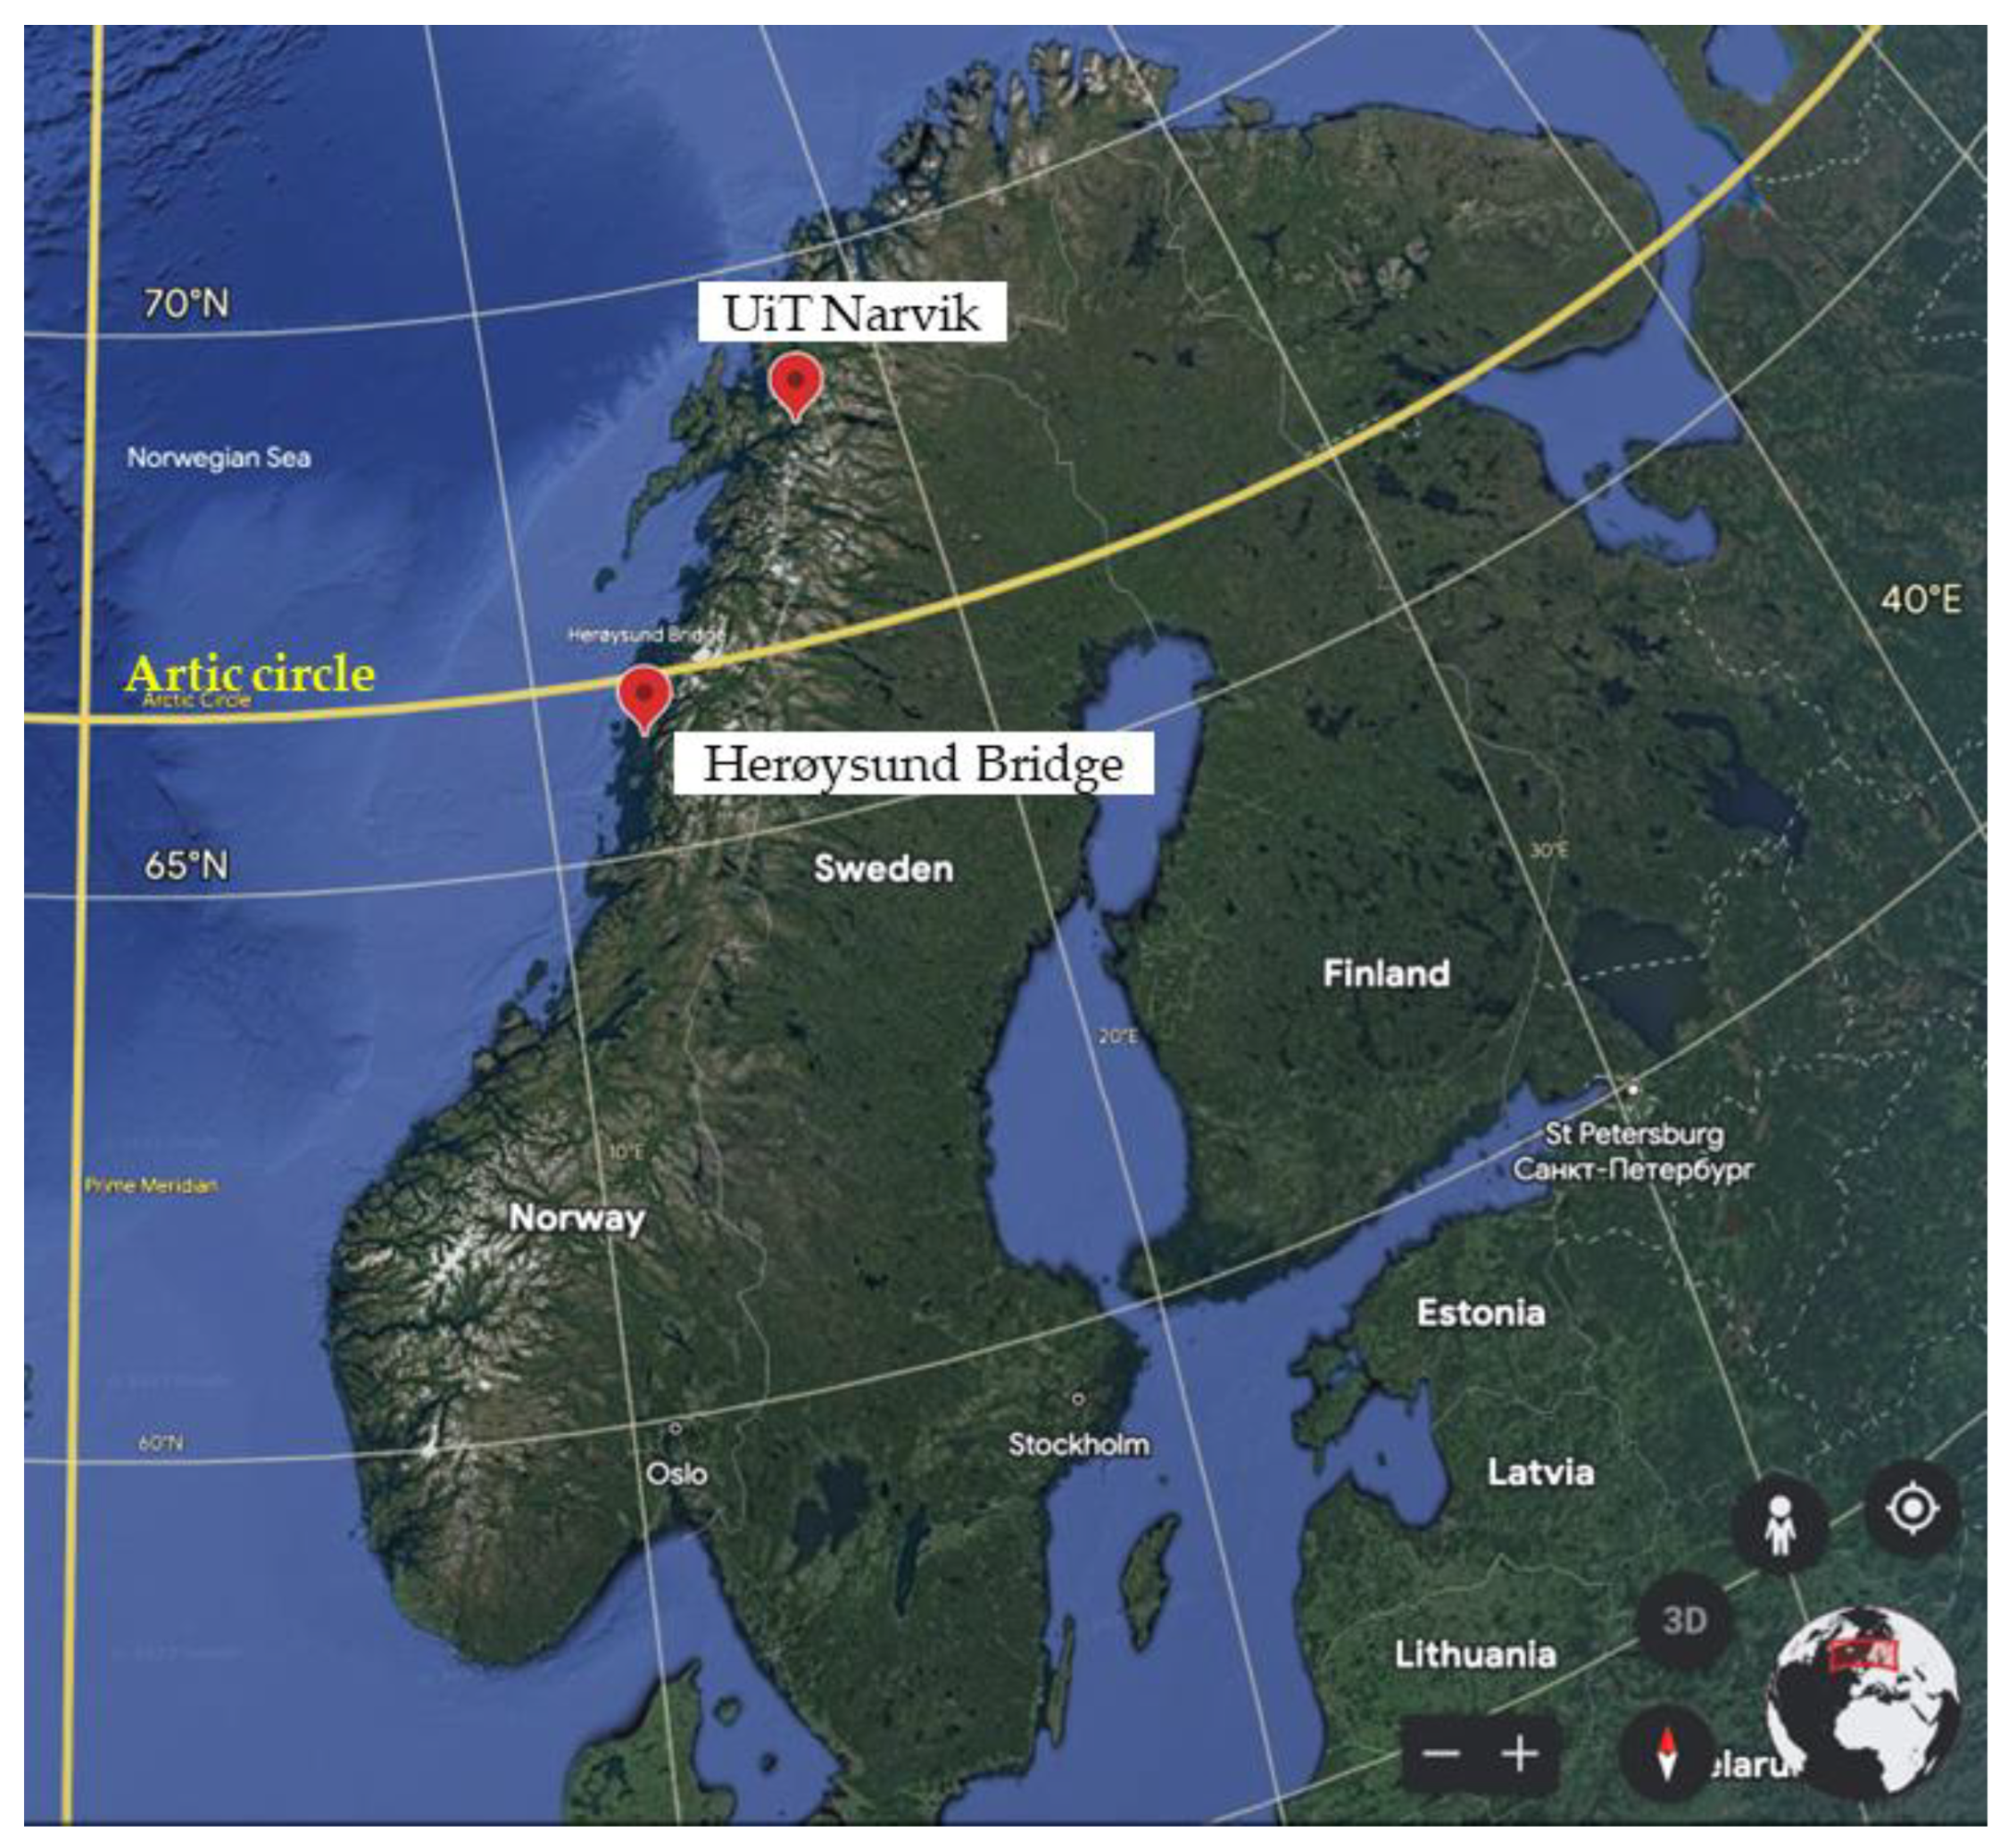
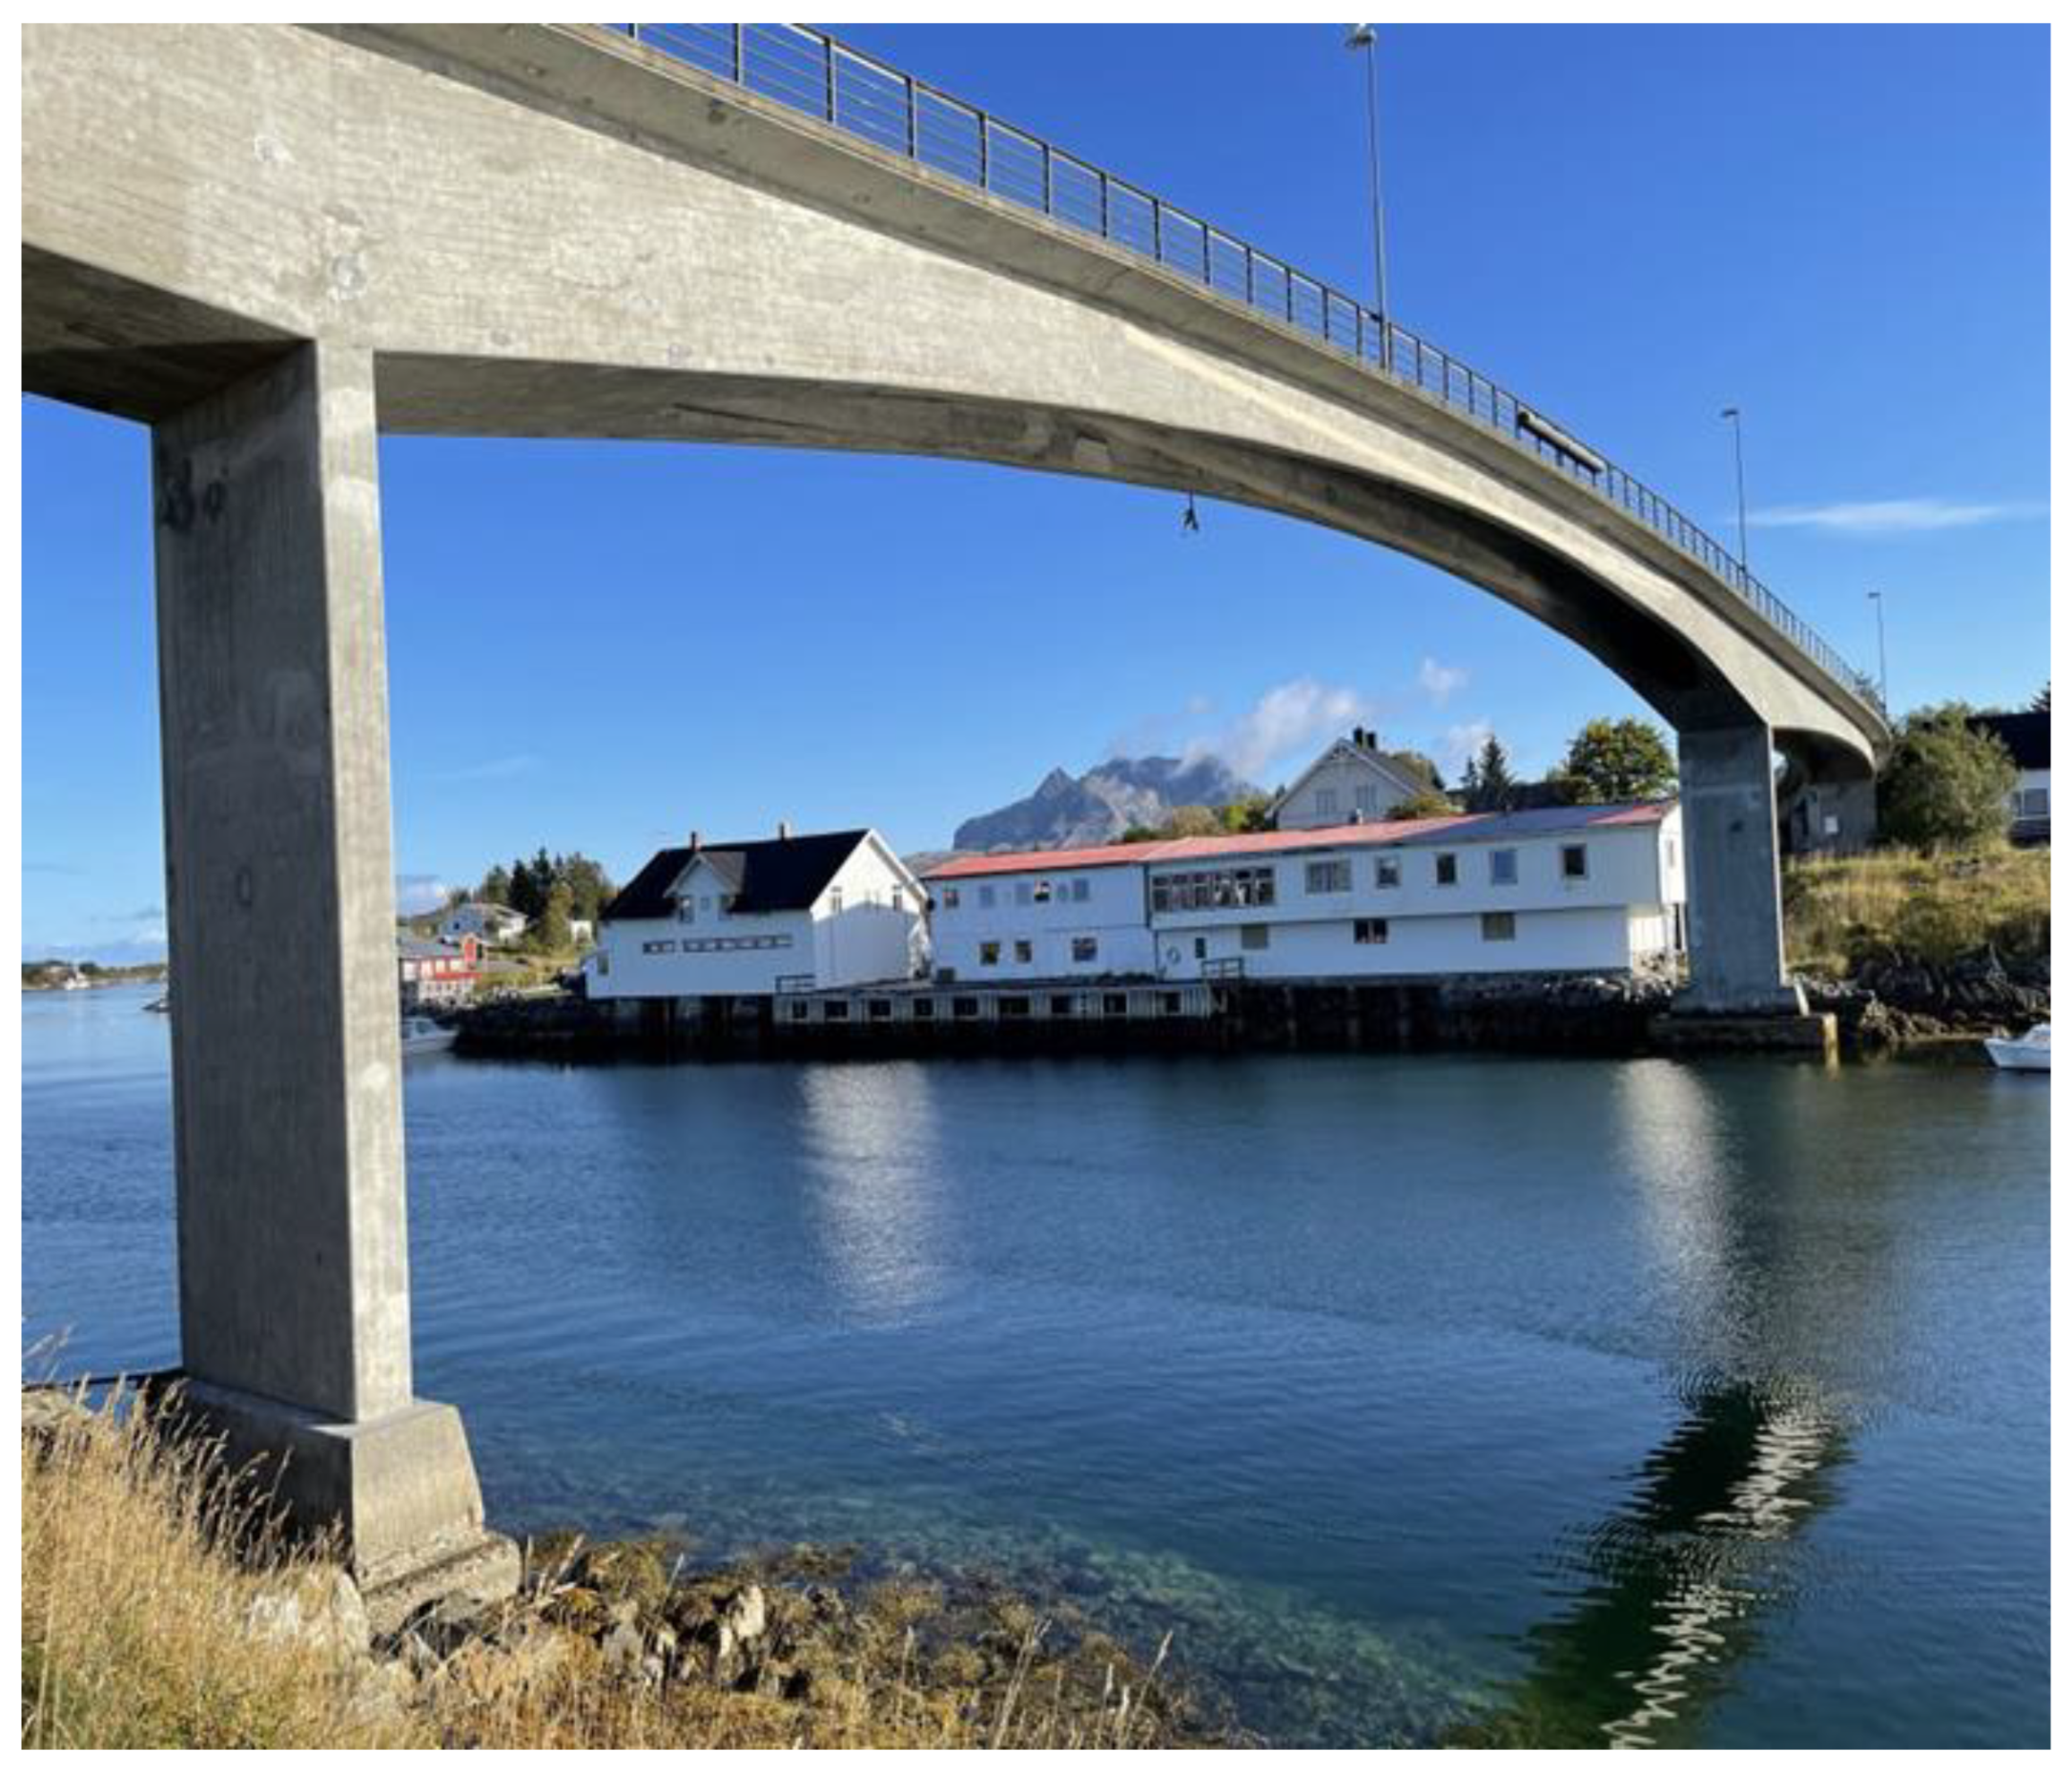
Herøysund Bridge is located in Nordland Fylkekommune (NFK) in Norway. The bridge connects the South-Herøy and North-Herøy islands and is less than 100 km from the Arctic Circle (
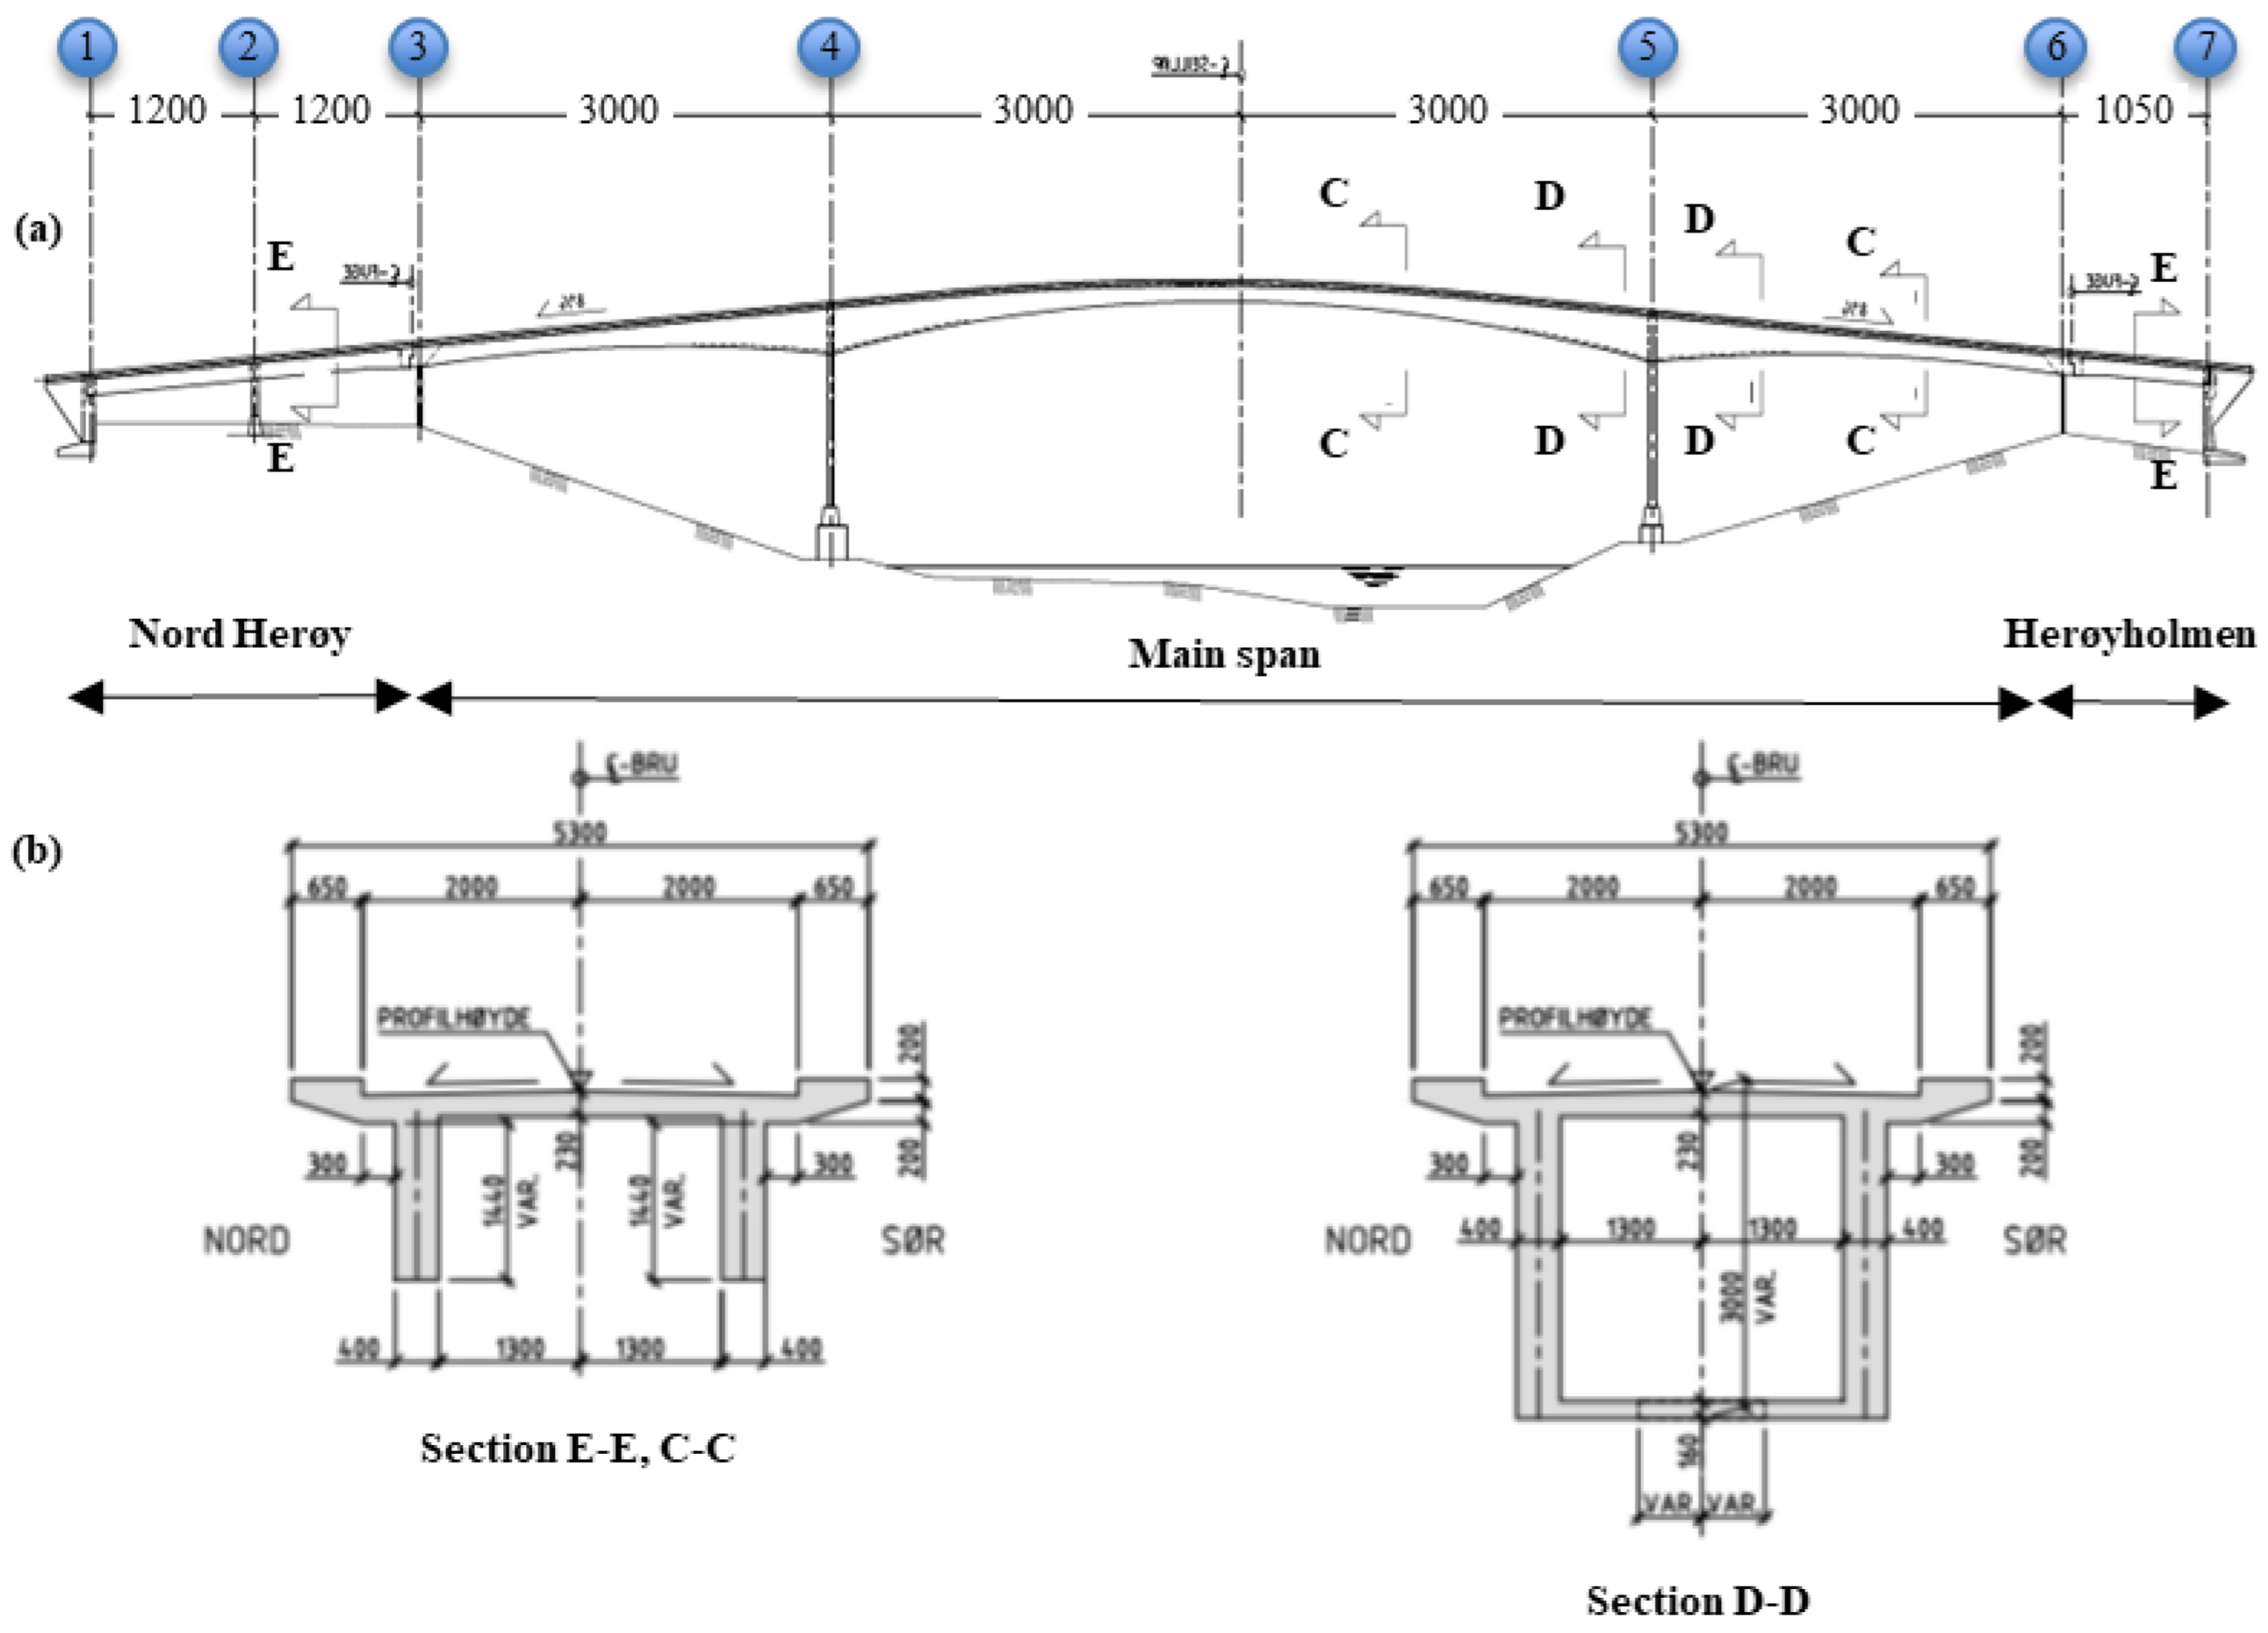
Figure 1). It was built in 1966 and has a total length of 154 m, with the largest span of 60 m, and a width of 5.3 m. There are two girders on the north and south sides of the bridge that have four post-stressed cables, with anchors on the west and east sides, respectively (
Figure 2). Furthermore, the bridge has a cast-in-place pressure plate approaching piers 4 and 5, which is configured as a sort of box-like section in these short parts. Some sketches from the blueprints are reported in
Figure 3. The bridge was constructed utilizing the stress control method, contrary to modern techniques, such as the partial factor method, which incorporates material and load factors.
In 2019, major damage was found to the construction of Herøysund Bridge. As a result, concerned authorities carried out an inspection, and it was decided to restore the bridge. During the restoration activities, it was discovered that the bridge had some serious damage, so it was not possible to completely restore the bridge; thus, it has reduced load-bearing capacity. Later in 2020, NFK and the Norwegian Public Road Administration decided to work on building a new bridge that would be located just south of the current bridge. The new Herøysund Bridge is expected to cost about NOK 300 million (approximatively over EUR 25 million) and is expected to be finished in the summer of 2024.
After reinforcements occurred in the recent past, the bridge has been opened for public use with a limited load capacity of vehicles passing over. This also led to a new research project, Herøy FoU, that is jointly funded by NFK and Statens Vegvesen. This research project kickstarted in November 2022 with various partners including NTNU as project lead along with the UiT—The Arctic University of Norway and Sintef Narvik as project partners. This project generates data that can provide very crucial information about the old Herøysund Bridge. This information can be very useful for similar bridges in Norway and around the world.
3. Construction of Solid Model
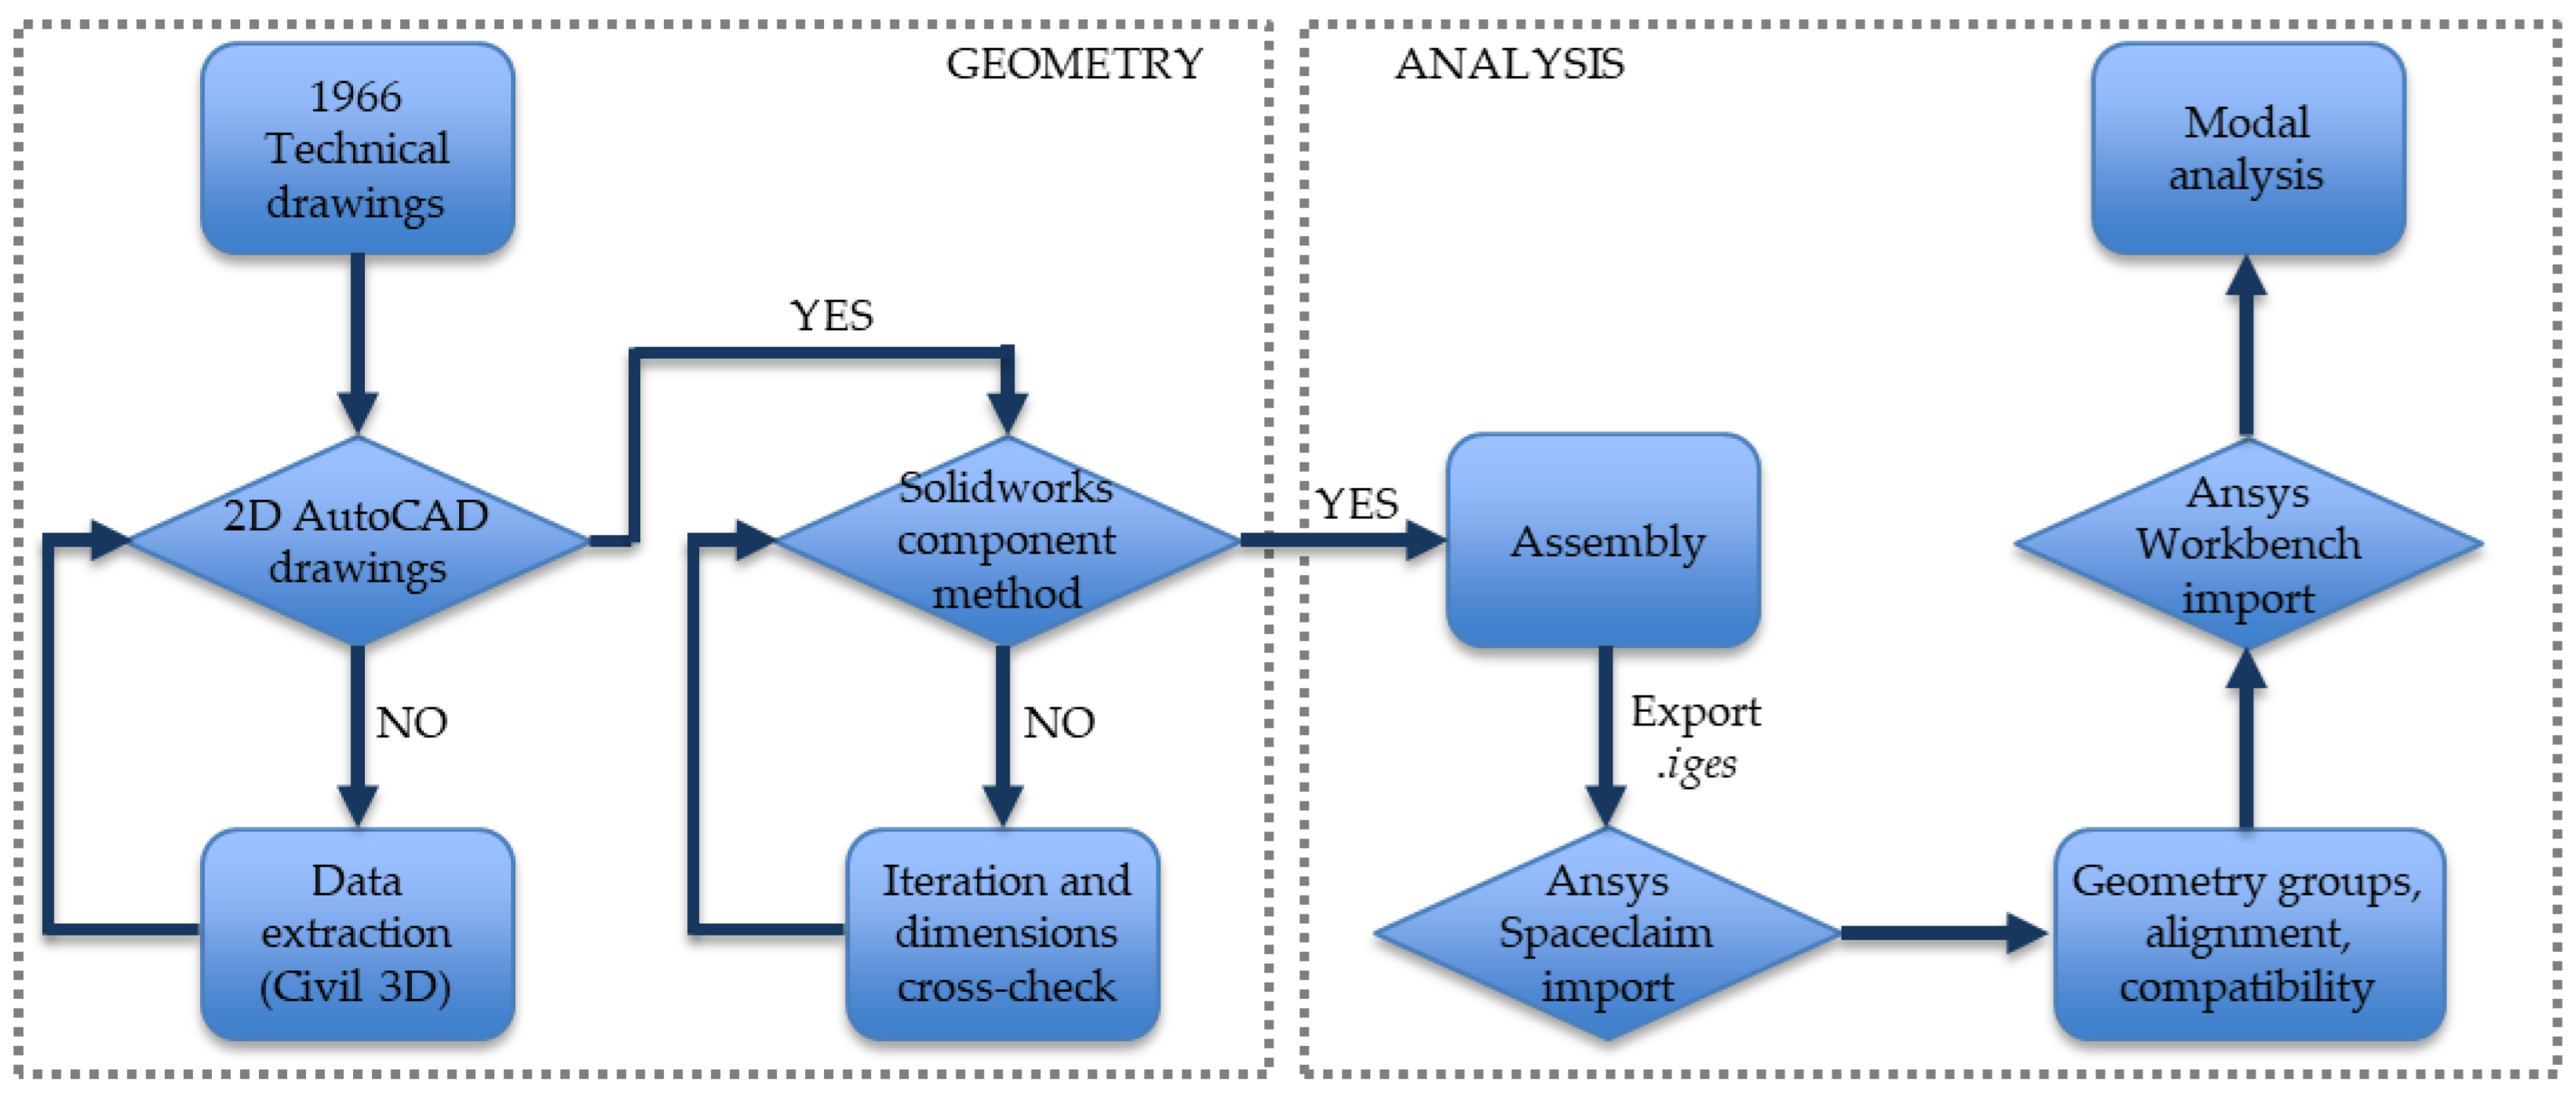
This study models Herøysund Bridge using 3D–solid and shell finite elements based on 1966 technical drawings. A 3D CAD model is created in Solidworks, and finite element analysis (FEA) is conducted in ANSYS, following the workflow reported in
Figure 4.
The technical drawings extracted key information on the support mechanisms, pillars, superstructure section connectivity, and curvature dimensions. Given the hand-drawn nature of these drawings, details appeared blurred. A cross-reference approach was adopted by consulting recreated drawings using Autodesk Civil 3D (2023) The superstructure’s deck, piers, and curvatures were cross-checked and dimensioned to minimize anomalies in interpreting the original base drawings.
Herøysund Bridge’s parametric CAD model features complex geometry, including horizontal and vertical curvatures. A parametric model is created since, if the profile of any bridge section is changed, the elevation and span length would also accommodate itself accordingly. Therefore, the structural model can be altered by a single input to identify alternate models in future studies. To geometrically recreate the bridge using an FEM, certain low-sensitivity simplifications must be implemented without affecting the study’s objectives. Specifically, some bridge sections possess both vertical and horizontal curvature, while others exhibit slight horizontal curvature. The main span has minimal horizontal curvature, primarily varying in the vertical direction. As indicated by the original drawing, the top deck incorporates banking, with elevations in the point data form at each pillar. A notable characteristic of the structure is the varying cross-section across spans. It features a 16 mm pressure plate at the bottom, depicted as a single but independent body.
The solid model is created in Solidworks, assuming the following simplifications:
The transverse section in bridge spans 1–3 and 6–7 is assumed without plan curvature, since it would add complexity to the geometry. Also, this assumption would not affect mid-span 3–6, i.e., the primary area of concern.
The transverse elevation of the top deck adds complexity to the FEM geometry; it is assumed to be perfectly in-plane.
Post-tensioning in the bridge involves tendons embedded within the structure, making them difficult to physically track. Due to the limited geometrical information in the drawings, the cables are not directly modeled, but an inward compressive force of about 12,000 kN is assumed on either side of the main span 3–6. This force is calculated by multiplying the design pre-stressing force of a typical cable by the total number of cables (18 cables).
The top deck features a 60 mm asphalt layer, according to SV handbook V-412 [
21], that exerts additional load. To avoid FEM contact region errors, a uniform load of 1.32 kN/m
2 is applied to the entire top deck from pillars 1-to-7, instead of modeling a layered geometry.
This study does not consider reinforcements or rebars in pillars and other spans.
The connection between the spans is a joint; the connection between the pillars/abutments and spans is a rotational joint, fixed for all other degrees of freedom, along the longitudinal axis.
The presented work analyzes the structure under static loads and assumes linear behavior. The actual damage to the structure is neglected since it is deemed to be negligible in the total response of the structure. However, anomalies such as cracks, eccentricity, deformation, bending, and displacement are meant to be tested in the later stage of research.
The mechanical material properties adopted for the model are listed in
Table 1.
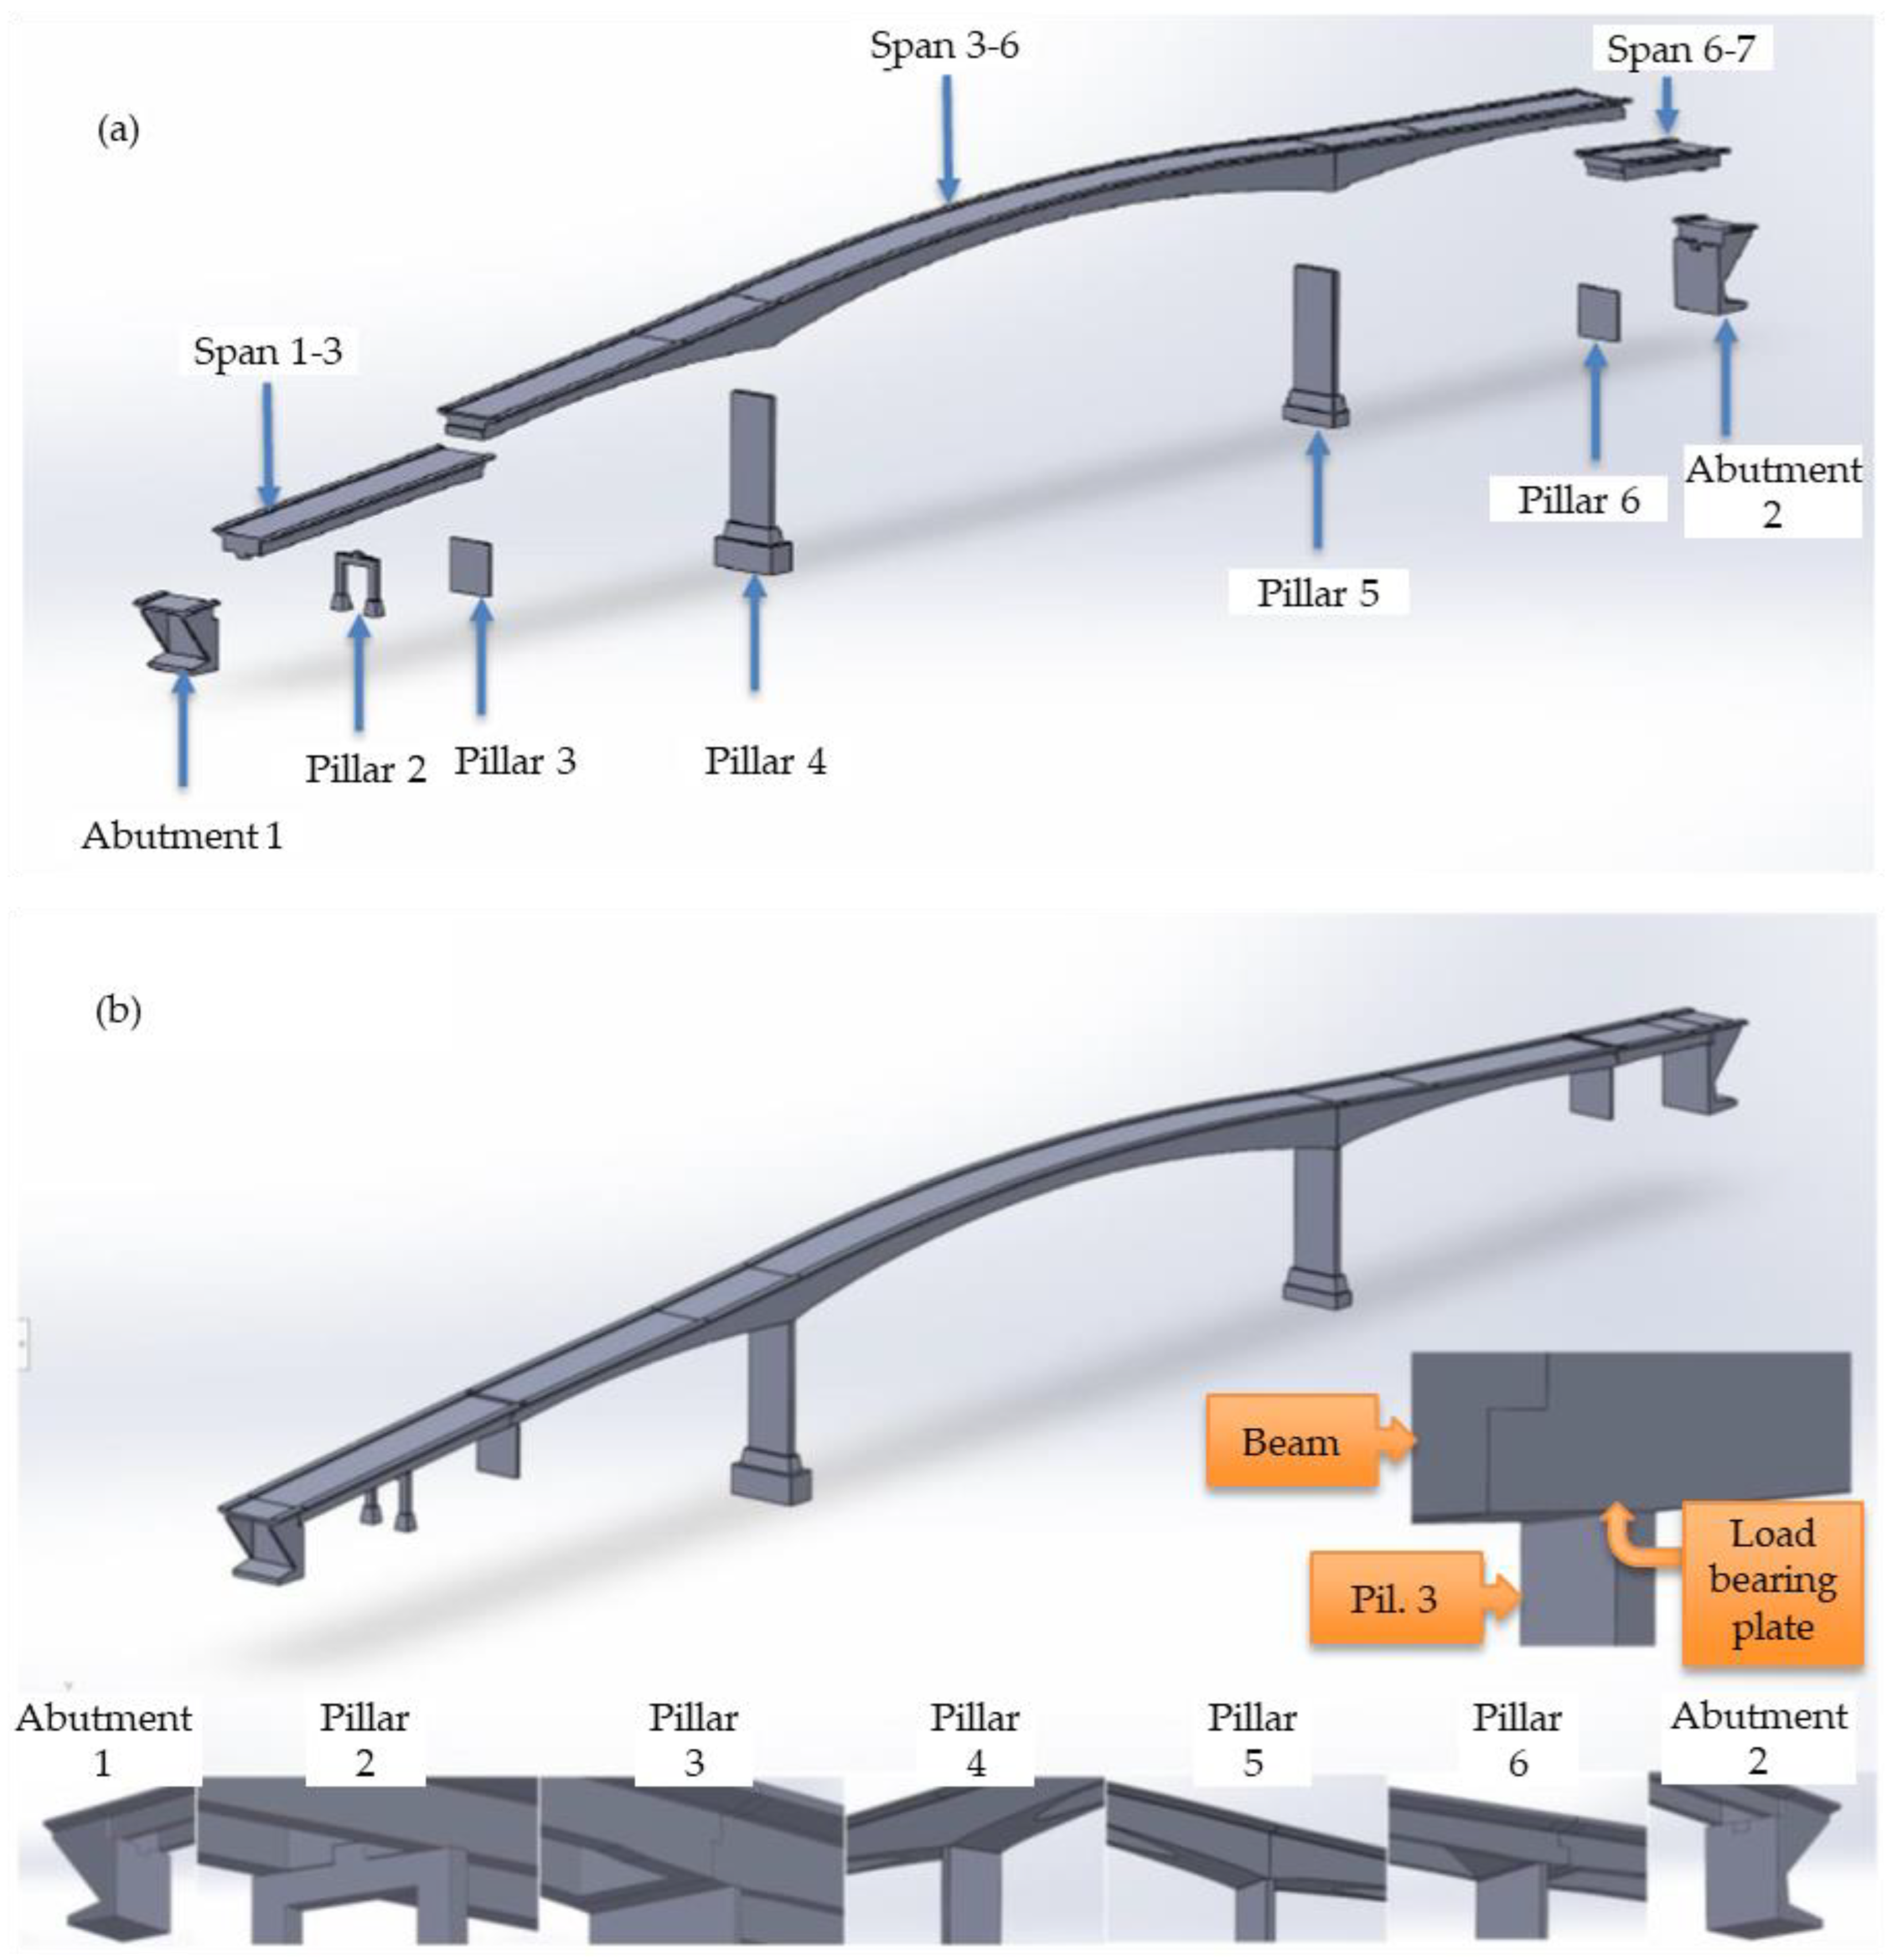
Using the section profile obtained from the archive data provided by NFK, the model was dimensioned using the Autodesk Civil 3D student version annotation tool. Details on the pillars, bridge spans, pressure plates, and beam curvatures were also extracted from the drawings. The assembly view of the bridge is depicted in
Figure 5. The model is an assembly with each pillar connected to the deck and beams.
4. Development of Shell FEM and Boundary Conditions
4.1. Development of Shell Model
The shell model is created in ANSYS SpaceClaim starting from the 3D–solid model. As discussed in the general theory, the shell model needs several considerations, as it is based on a mid-surface method where each solid body is represented as a single mid-surface.
Therefore, it is simplified per the needs of the required model. The simplifications are as follows:
Since surfaces are to be extracted from a 3D–solid model, it automatically induces the assumption of null transverse curvature. Hence, spans are considered perfectly straight.
As completed for the solid model, the banking or elevation of the top deck asphalt is small in magnitude and is assumed to be completely planar.
The post-tensioning CAD integration is not possible for a shell model since it is a planar representation of all solid features. Therefore, compressive inward forces on the main span replicate the effect of tendons.
The top deck has an asphalt layer of 60 mm, like the solid model. Modeling two coincident surfaces causes mesh errors, as it duplicates surfaces in the shell model. Therefore, instead of modeling mid-surface for asphalt, a uniform load of 1.32 kN/m2 is applied to the top deck from pillars 1-to-7.
The reinforcements or rebars in the pillars and other spans are neglected for the shell model.
The top deck step profile is considered flat, as a mid-surface, to simplify pedestrian walkways. If drawn as a separate surface, pedestrian walkways cause surface dysconnectivity.
The pressure plates have varying section profiles. For a shell model, exceedingly small curvatures at the end of the profile make them highly undesirable due to the large deflection and stress concentration possibility. Also, these singularities disrupt the meshing. Therefore, for simplicity, pressure plates are not included in the shell model.
The shell model is extracted from the solid model with the aforementioned assumptions. The following steps are adopted to model the geometry:
The solid model assembly of the bridge is first imported to ANSYS SpaceClaim as an .iges file.
The SpaceClaim geometry is then renamed into the sub-assemblies, such as the deck, beams, and pillars for each section.
SpaceClaim allows solid models to be mid-surfaced from a solid body. The mid-surface represents the geometry’s cross-section (shell), given a section thickness representing a solid body. Using the mid-surface command, the features of the bridge, such as the top deck, beams in the +z and −z directions, transverse beams, and pillars, are transformed into individual mid-surfaces.
The control of surfaces is conducted by stitching each surface with the adjacent to avoid connectivity issues. If there is dysconnectivity in the mid-surfaces, the internal forces and stresses are not appropriately translated, affecting the results.
The longitudinal and transverse beams on either side of the bridge are drawn on independent surfaces, to be given a thickness equal to the top deck width, since the main span rests on these beams.
Once the mid-surfaces are connected, the topology is shared individually for each span to define the contact edges of the surfaces. This, again, is an important step, as the distribution of loads between members during analysis plays a significant role.
The shell model is also drawn section-by-section for each span and pillar. The load-bearing plates are also mid-surfaced.
SpaceClaim’s built-in geometry checks are conducted to investigate extra edges, discontinuities in the surface, tangencies, gaps, and duplicates. The model is then imported to ANSYS for further analysis.
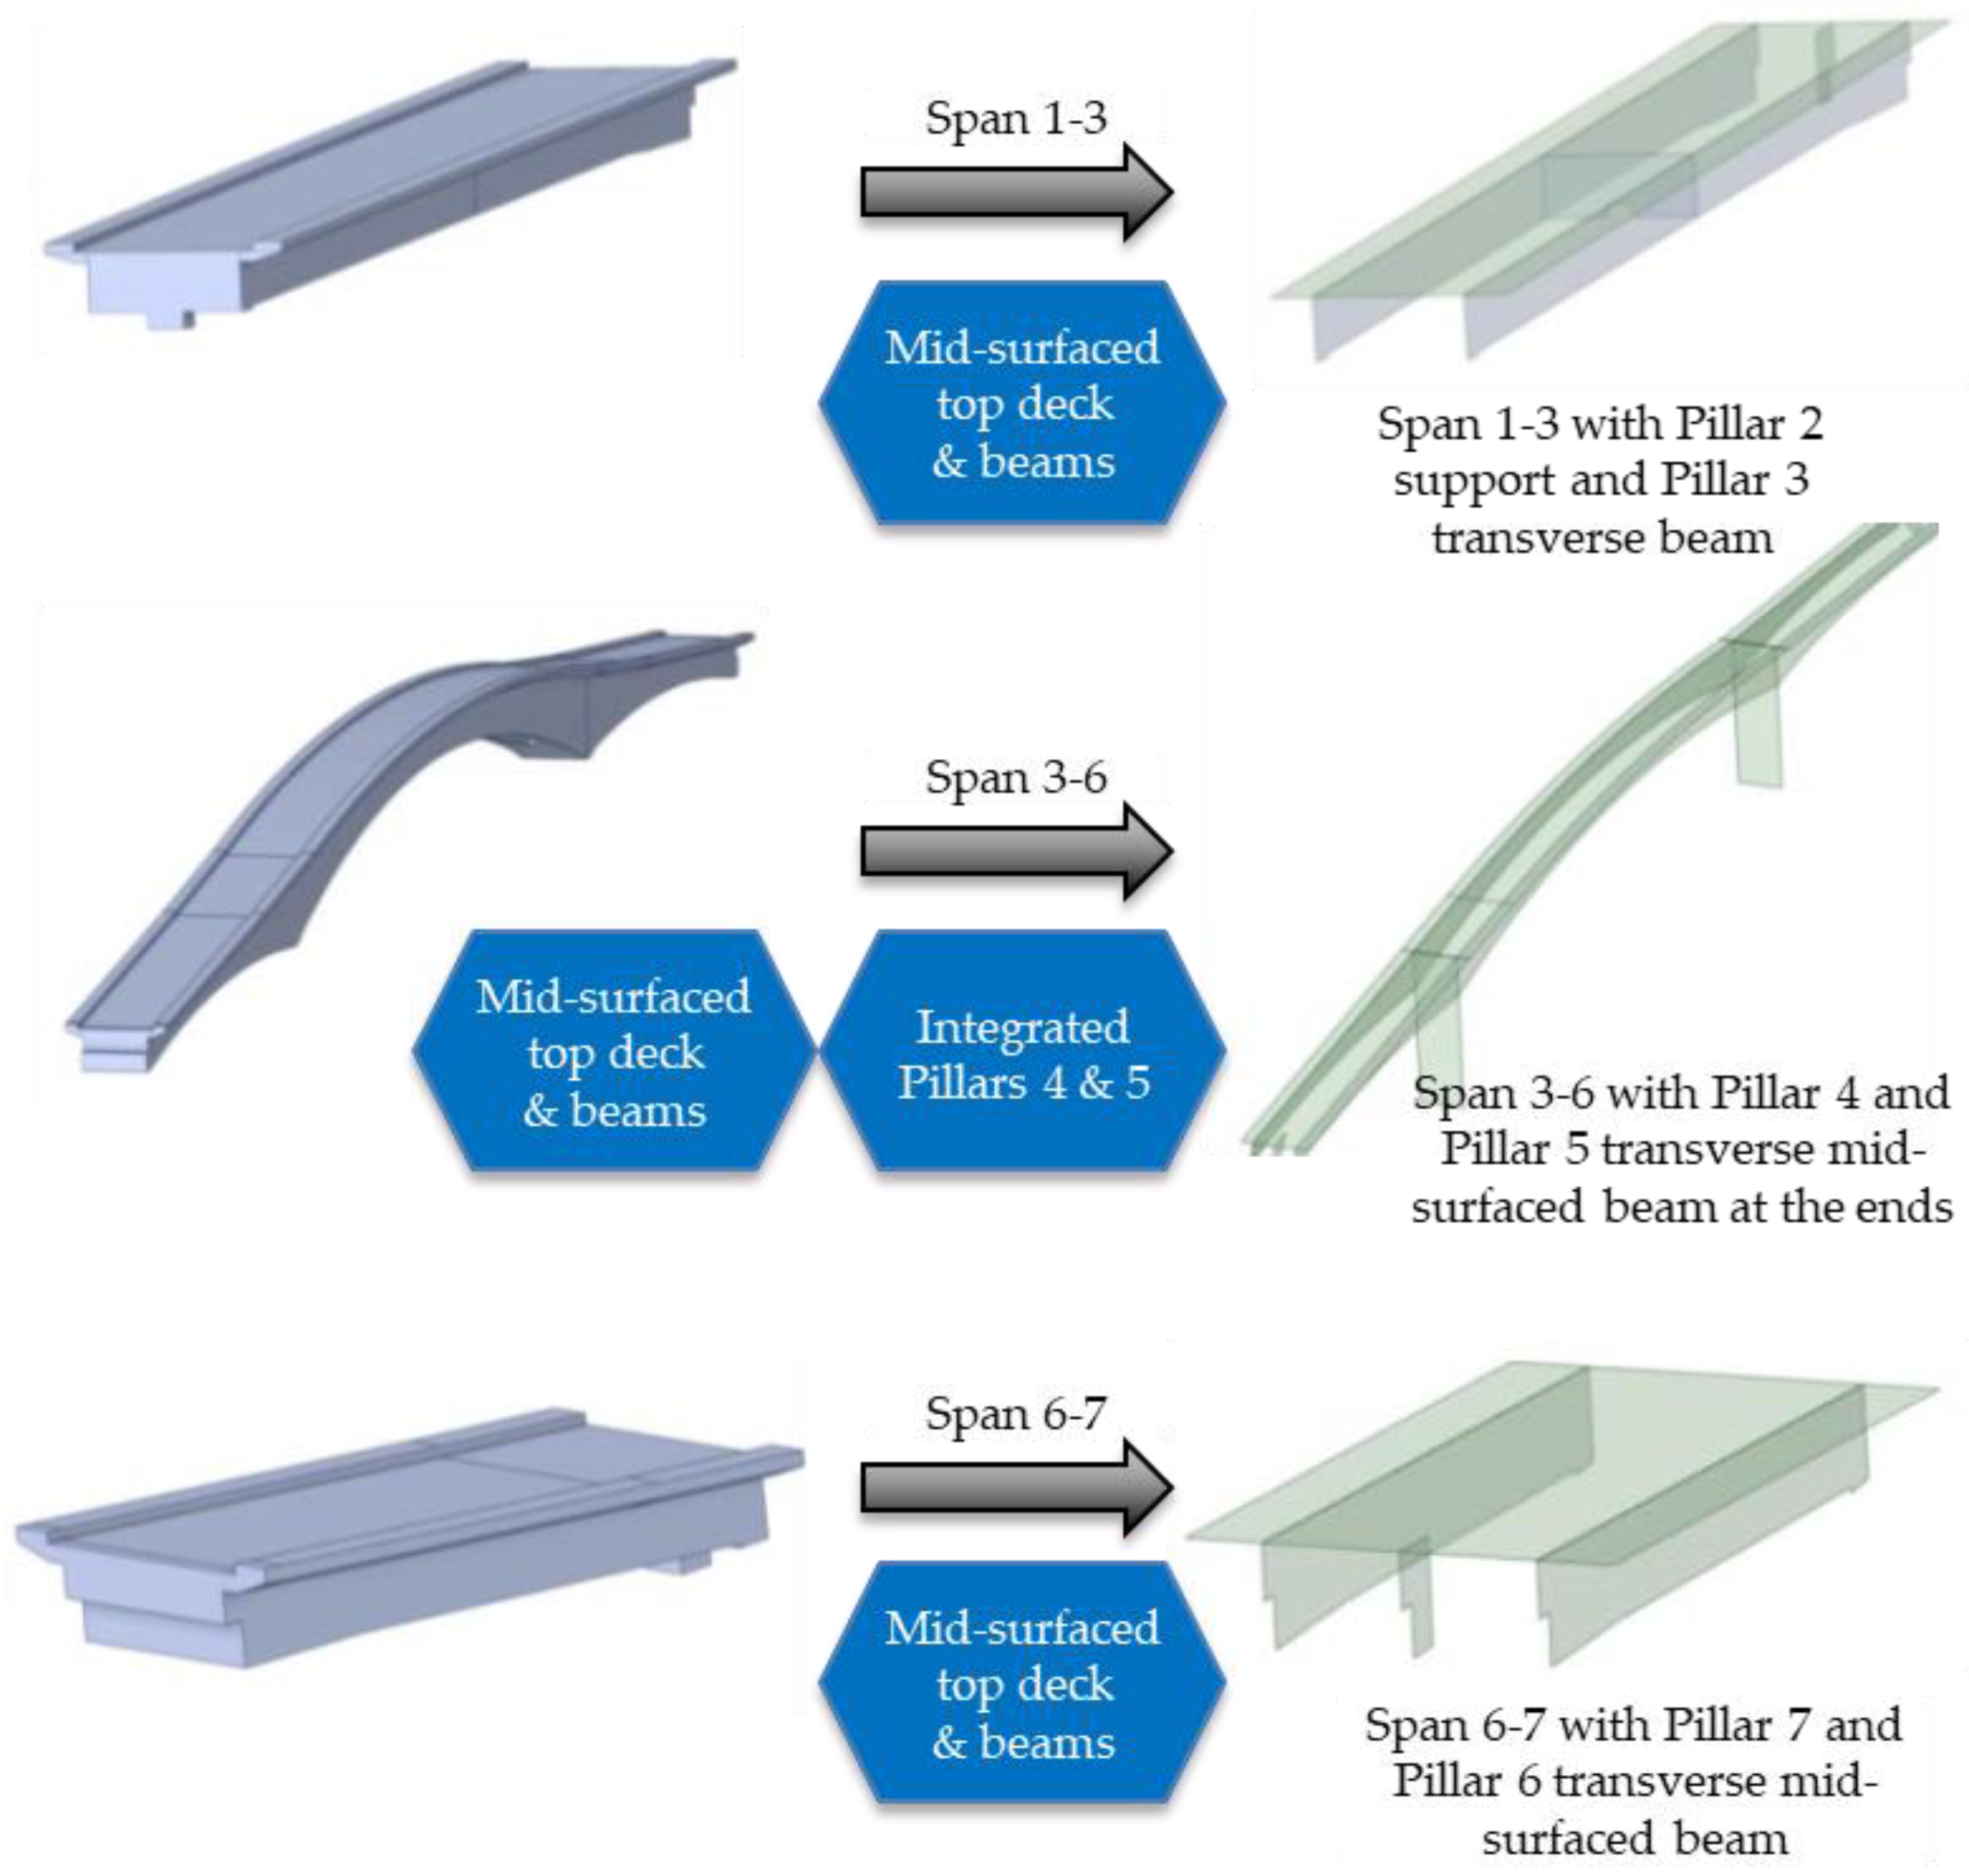
The shell model’s components’ transformation can be seen in
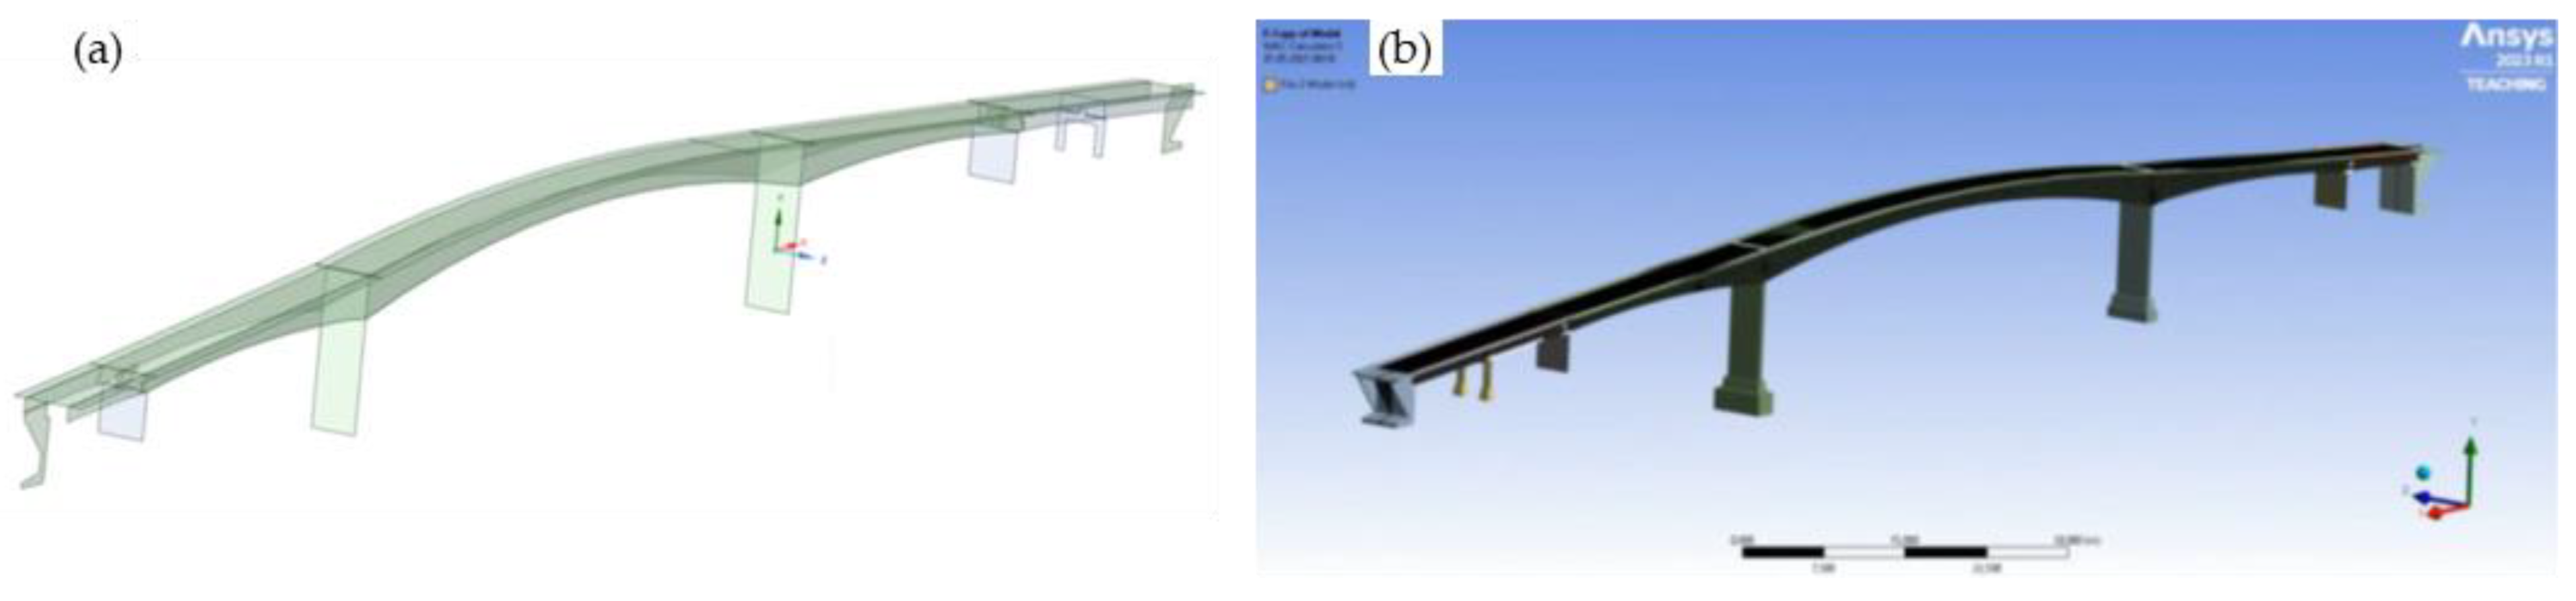
Figure 6. The shared topology in SpaceClaim is individually completed for each component. The definition of individual topologies disassociates these components as an assembly; therefore, the joints between bridge spans are analyzed in detail to correctly represent the real bridge connections. The shell model for spans 1–3, 3–6, and 6–7 shares the topology between the respective span surfaces. Each surface in the shell is assigned a thickness per the technical drawings. The thickness parameter plays a vital role in mass control for bridge geometry. Since the model is to be compared to the solid one, the mass distribution across its span should be as close to that of the solid model as possible. The complete shell model is depicted in
Figure 7.
Each bridge section has longitudinal beams, transverse beams at the pillars, a top deck, and pillar surfaces. These surfaces have a thickness, as shown in
Table 2. Once the thicknesses are defined in the shell model in ANSYS, the geometry takes the form, as shown in
Figure 7b.
Solid 186 and 187 elements are used in the solid FEM. Solid 186 has reduced integration and is suitable for linear analyses of structures with moderate to low aspect ratios [
22]. However, as the element best-suited for each geometry section, solid 187 is an improved version of solid 186, with full integration, and is suitable for modeling thin-walled structures with high aspect ratios, accurately capturing bending and shear stresses [
23], p. 187. Therefore, both element types are program-controlled by ANSYS in areas where they are needed in the solid model. For the shell model, shell 281 is used [
24]. Shell 281 is a six-node FE type used in ANSYS for the structural analysis of thin to moderately thick shell structures. It accurately captures shear deformation effects and has three degrees of freedom per node. Its ability to capture shear deformation effects makes it the preferred choice for accurately analyzing and designing structures such as Herøysund Bridge. For the mesh size, after some tests it was decided to adopt an average mesh dimension of 80 mm.
The coherence between the shell and 3D–solid models plays a vital role in the results’ comparison. The primary control parameters are mass control and the geometric constraints’ similarity. As discussed above, the shell model allows faster computation than a solid model with fewer elements. However, due to mid-surfacing limitations and the bridge’s complex geometry, it would be interesting to compare the structural and modal deformations. Furthermore, the mass and volume control for constrained prestressed structures should be as close as possible for 3D–solid and shell models. Comparing the vibration modes effectively controlling these parameters is significantly important. These parameters are listed in
Table 3.
4.2. Boundary Conditions
Proper boundary conditions, including supports, loads, temperature, and soil, are essential for safe and reliable bridge analysis. This study considers self-weight, ambient temperature, and foundation supports for prestressed modal analysis from structural to modal analysis.
Standard Earth gravity is used to calculate the internal forces and stresses caused by the weight of the bridge structure and loads, and its constant value (9.8 m/s2) is used to calculate the self-weight of the bridge structure.
The post-tensioning in Herøysund Bridge consists of tendons along the longitudinal beams. The tendons in the bridge structure are tensioned while exerting a compressive force on the bridge structure. Due to the unavailability of the tendons’ exact locations across the geometry, as an approximation, a compressive load is applied at the front face on either side of span 3–6.
The base of all seven pillars is fixed to the ground.
5. Results of Modal Analysis
This section presents the modal analysis results that were carried out using ANSYS 2023 R1 [
25], p. 56. The numerical modal analysis was carried out for 20 modes, but most relevant data for mode shapes and modal frequencies are discussed in detail for the first 6 modes. It also incorporates a widely used modal assurance criterion (MAC)-based comparison of the solid and shell models. This section also identifies the numerical suitability of both modeling strategies for structures of the type of Herøysund Bridge.
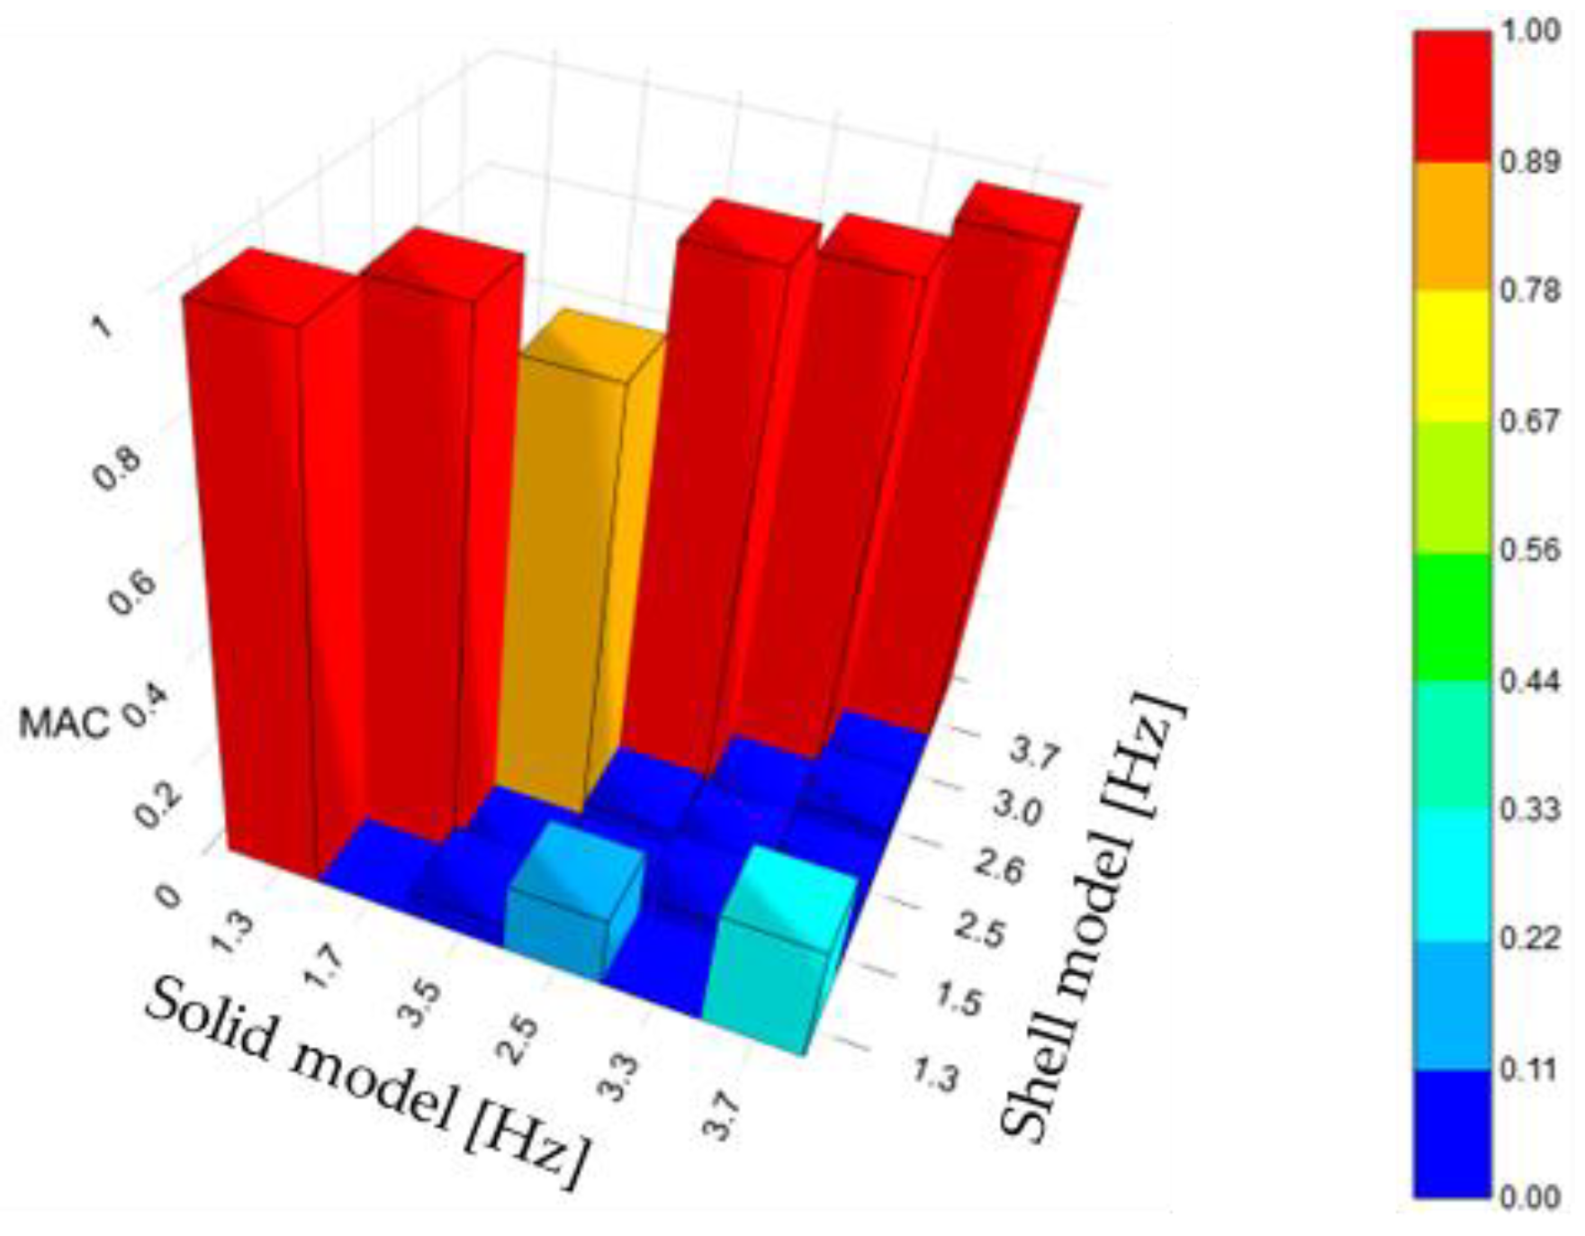
The MAC matrix for the solid model vs. the shell model is generated using the ANSYS 2023 R1 NVH MAC Toolkit. The MAC index indicates the similarity between two mode shapes: the closer the index is to one, the greater the similarity between the mode shapes is. It is plotted against their corresponding modal frequencies, as shown in
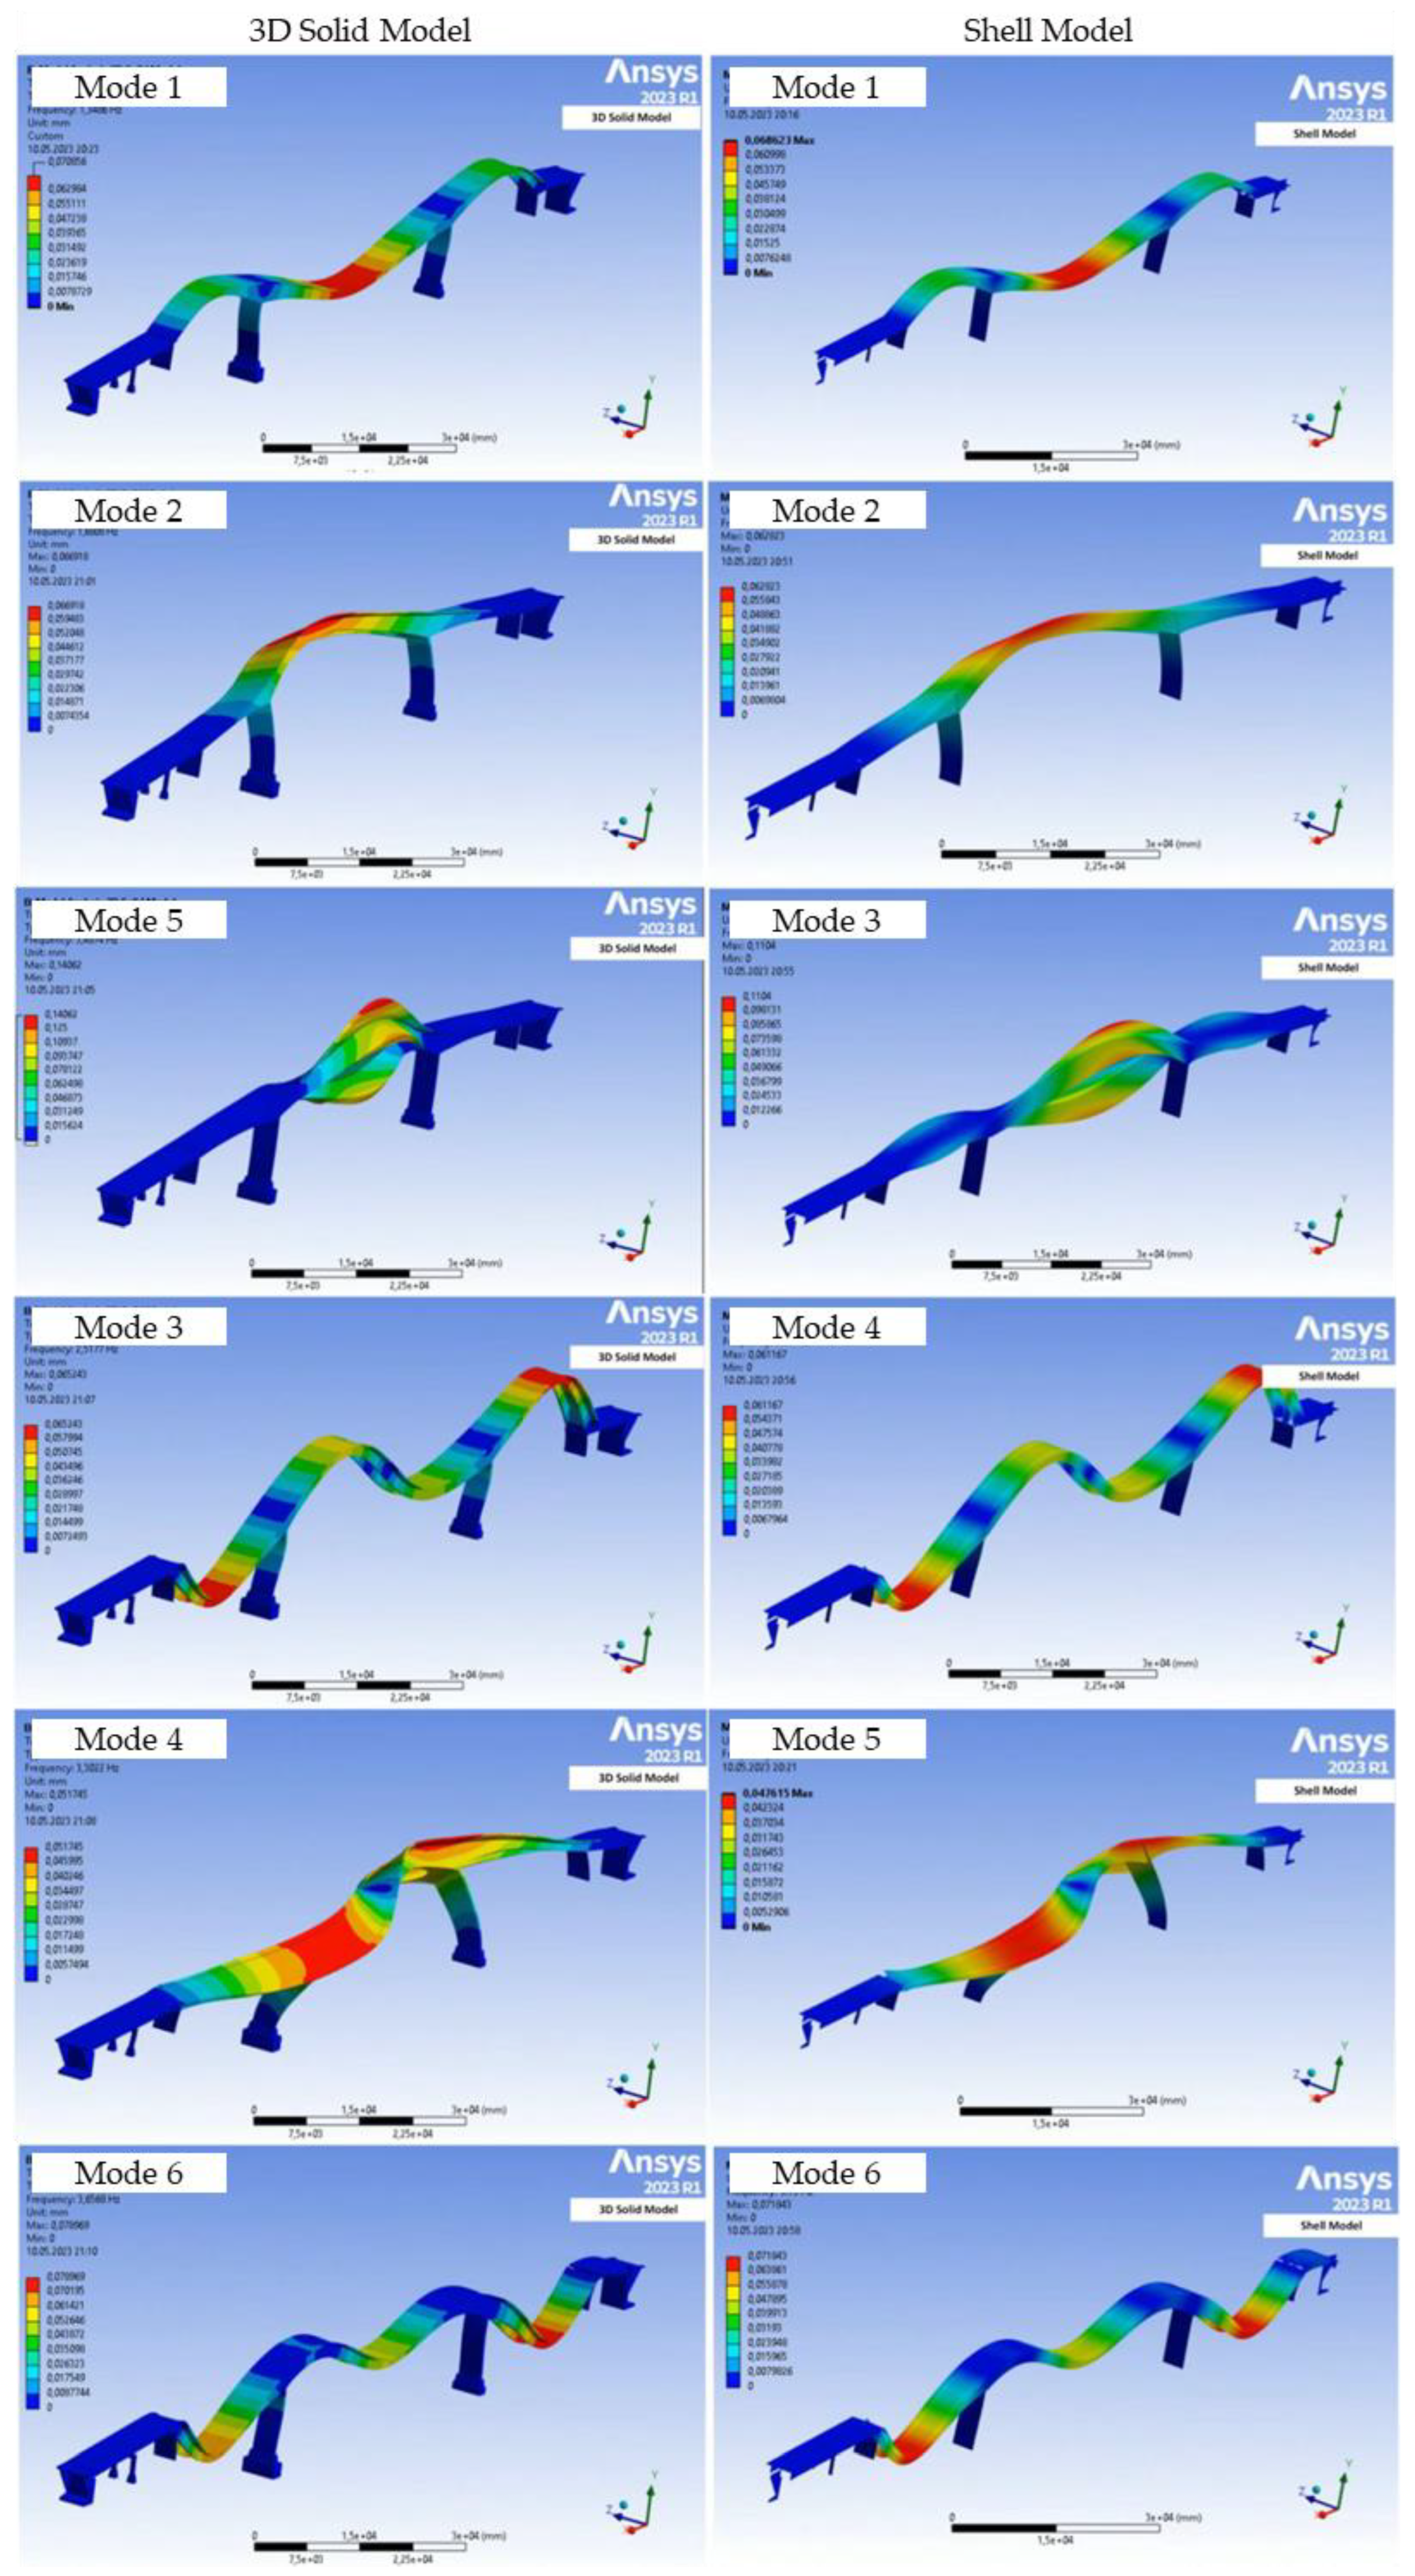
Figure 8. A similarity percentage in the MAC between 0.8 and 1 is considered a good agreement between the two numerical models in the MAC analysis. The MAC values are highly sensitive to large differences in shapes. The comparison shows very low discrepancies in the mode shapes for the models being compared. Among the first six modes, higher (but still minor) discrepancies are found for the third mode. However, it is found that despite having a difference in the sequence of mode shape occurrence, the modal frequencies are in good agreement for both the models, with a maximum similarity of 100% for mode 2 (solid and shell) and a minimum similarity of 84% for mode 3.
The obtained numerical modes are listed in
Table 4 for both the 3D–solid and shell models, and the relevant mode shapes are depicted in
Figure 9. The fundamental or first bending mode frequencies depict the deformation at the lowest excitation energy, with a match percentage of 99% and an absolute frequency error of 0.07 Hz.
The first mode for solid and shell models is almost identical and has a high degree of similarity. Also, for the other modes, the agreement between the 3D–solid and shell models is very good, with the MAC values never lower than 0.84 and the maximum differences in the frequencies around 10%, except for the third shell mode (namely, the twist mode).
It is important to note that for structures such as Herøysund Bridge, the lowest frequencies are of the highest importance. The reason is that the energy of excitation required for these modes is low, which can primarily cause the induced frequencies by external loads and environmental conditions to coincide with the system’s natural frequencies [
26]. This can result in resonance or even structural failure; however, a detailed study is required to identify the system’s experimental frequencies to interpret the possibility of resonance.
6. Conclusions
The primary aim of this paper was to provide an in-depth numerical modal analysis of 3D–solid and shell models utilizing FEM for Herøysund Bridge. FEM was used to accurately predict the modes shapes and frequencies in this post-tensioned concrete bridge structure. Developing a 3D–solid model and extracting the shell model through mid-surfacing yielded a high similarity between the models. The shell model requires geometrical simplifications due to the different element types used in its numerical simulation. The mass and volume control for the models resulted in a percentage difference of 1.028%, which was negligible, demonstrating good matching between the two models.
The modal analysis revealed distinct mode shapes and modal frequencies for the 3D–solid and shell models. This study also explored differences in the modal frequencies across various modes, including the flexural, transverse bending, and twist modes. The MAC correlation for the shell model vs. the solid model found that the MAC for the first 6 modes out of 20 was in good agreement, around 84–100%. Although the mode shapes were almost identical, it was also revealed that they appeared in different sequences for the shell model because of the mass distribution difference across different spans. Despite the comprehensive analysis, this study had limitations such as limited post-tensioned tendons’ details leading to assumption, the shell model’s geometrical limitations leading to a mass distribution difference, time constraints to diving deeper, and approximations when applying boundary conditions in ANSYS.
The findings were significant for Herøysund Bridge since the data obtained for both models significantly contribute to comparing experimental vibration data with numerical results. This study also signified the credibility of the shell model strategy for complex concrete structures such as Herøysund Bridge. Finally, the insights derived in this study underscored the importance of FEM in revolutionizing bridge design, leading to efficient and more reliable structures
Future work could extend the current research by incorporating different load scenarios, exploring other types of FEM modeling, or applying the methods to other bridge structure. Moreover, the numerical results obtained in this work could be compared with experimental outcomes (e.g., Operational Modal Analyses (OMA) results) to validate the resonant frequencies of the physical structure.
Author Contributions
Conceptualization, H.S. and V.N.; methodology, Z.A., H.S., and V.N.; software, Z.A.; formal analysis, Z.A.; data curation, Z.A.; writing—original draft preparation, Z.A.; writing—review and editing, H.S. and V.N.; visualization, H.S. and V.N.; supervision, H.S. and V.N. All authors have read and agreed to the published version of the manuscript.
Funding
This work is supported by the project “Herøy FoU”, project ID: 100397. This research is funded by Nordland Fylkeskommune and Statens Vegvesen. There are three partners of this project: NTNU, SINTEF, and UiT—The Arctic University of Norway. Project duration: September 2022–December 2024.
Data Availability Statement
Data are contained within the article.
Acknowledgments
We want to thank Per Ove Ravatsås from NFK, Daniel Cantero from NTNU, Karla Hornbostel from Statens Vegvesen, and Roy Antonsen from Sintef Narvik for sharing necessary technical documentation that was used to carry out this work. We are especially thankful to Per Johan Nicklasson, Guy Beeri, and Andreas Seger for their generous advice and suggestions, which have improved the final version of this paper. Special thanks to NFK for providing a picture of Herøysund Bridge.
Conflicts of Interest
The authors declare no conflicts of interest.
References
- Tangrand, K.; Singh, H. Analysis of civil engineering infrastructure in Norway with solutions based on structural health monitoring and artificial intelligence. J. MESA 2023, 14, 613–631. [Google Scholar]
- Singh, H.; Grip, N. Recent trends in operation modal analysis techniques and its application on a steel truss bridge. Nonlinear Stud. 2019, 26, 911–927. Available online: https://www.semanticscholar.org/paper/Recent-trends-in-operation-modal-analysis-and-its-a-Singh-Grip/061da7942a89d2f53949dbc4a7b40eac2b13223f (accessed on 13 November 2023).
- Barton, R.M. Prestressed Precast Concrete Railroad Bridges. J. Struct. Div. 1968, 94, 2885–2912. [Google Scholar] [CrossRef]
- W. on H. Ltd. Composite Bridges|Design & Construction. Available online: https://www.steel-bridges.com/composite-beam-bridge.html (accessed on 13 November 2023).
- Pipinato, A. Innovative Bridge Design Handbook, 2nd ed.; Butterworth-Heinemann: Oxford, UK, 2021; Available online: https://shop.elsevier.com/books/innovative-bridge-design-handbook/pipinato/978-0-12-823550-8 (accessed on 13 November 2023).
- Hassanein, M.; Shao, Y.; Zhou, M. Behavior and Design of Trapezoidally Corrugated Web Girders for Bridge Construction, 1st ed.; Elsevier: Amsterdam, The Netherlands, 2022; Available online: https://shop.elsevier.com/books/behavior-and-design-of-trapezoidally-corrugated-web-girders-for-bridge-construction/hassanein/978-0-323-88437-2 (accessed on 13 November 2023).
- Aurier, L.; Hassan, M.; Jaworski, J.; Guizani, L. Review of Accelerated Bridge Construction Systems for Bridge Superstructures and Their Adaptability for Cold Weather. CivilEng 2023, 4, 83–104. [Google Scholar] [CrossRef]
- midasBridge Team. Construction Analysis of Precast Bridge. Available online: https://www.midasbridge.com/en/blog/casestudy/construction-analysis-of-precast-bridge (accessed on 13 November 2023).
- Shanghai Metal Corporation. Historical Development and Description of Box Girder. Available online: https://www.shanghaimetal.com/929-929.htm (accessed on 13 November 2023).
- Haider, M.A.; Batikha, M.; Elhag, T. Precast versus cast in-situ concrete in the construction of post-tensioned box-girder bridges: Span effect. Struct. Concr. 2020, 21, 56–64. [Google Scholar] [CrossRef]
- Nicoletti, V.; Martini, R.; Carbonari, S.; Gara, F. Operational Modal Analysis as a Support for the Development of Digital Twin Models of Bridges. Infrastructures 2023, 8, 24. [Google Scholar] [CrossRef]
- Qin, S.; Han, S.; Li, S. In-situ testing and finite element model updating of a long-span cable-stayed bridge with ballastless track. Structures 2022, 45, 1412–1423. [Google Scholar] [CrossRef]
- Li, S.; Yang, Y.; Pu, Q.; Yang, D.; Sun, B.; Li, X. Three-dimensional nonlinear creep and shrinkage effects of a long-span prestressed concrete box girder bridge. Struct. Concr. 2019, 20, 638–649. [Google Scholar] [CrossRef]
- Souza Hoffman, I.; Manica Lazzari, B.; Campos, A.; Manica Lazzari, P.; Rodrigues Pacheco, A. Finite element numerical simulation of a cable-stayed bridge construction through the progressive cantilever method. Struct. Concr. 2022, 23, 632–651. [Google Scholar] [CrossRef]
- Broo, H.; Plos, M.; Lundgren, K.; Engström, B. Non-linear finite-element analysis of the shear response in prestressed concrete bridges. Mag. Concr. Res. 2009, 61, 591–608. [Google Scholar] [CrossRef]
- Pathak, P.; Zhang, Y.X. Nonlinear finite element analyses of fiber-reinforced polymer-strengthened steel-reinforced concrete beams under cyclic loading. Struct. Concr. 2017, 18, 929–937. [Google Scholar] [CrossRef]
- Nicoletti, V.; Gara, F. Modelling Strategies for the Updating of Infilled RC Building FEMs Considering the Construction Phases. Buildings 2023, 13, 598. [Google Scholar] [CrossRef]
- Sintef. Herøysund Bru. Available online: https://www.sintef.no/prosjekter/2022/heroysund-bru/ (accessed on 13 November 2023).
- Solid World Group. SOLIDWORKS CAD3D. Available online: https://www.solidworld.it/soluzioni/software-3d/solidworks/ (accessed on 13 November 2023).
- Ansys SpaceClaim. 3D CAD Modeling Software. Available online: https://www.ansys.com/it-it/products/3d-design/ansys-spaceclaim (accessed on 13 November 2023).
- Statens Vegvesen. Bruer, Ferjekaier og Andre Bærende Konstruksjoner. Available online: https://www.vegvesen.no/fag/publikasjoner/handboker/handboker-etter-hovedtema/bruer-ferjekaier/ (accessed on 13 November 2023).
- SOLID186. Available online: https://www.mm.bme.hu/~gyebro/files/ans_help_v182/ans_elem/Hlp_E_SOLID186.html (accessed on 13 November 2023).
- SOLID187. Available online: https://www.mm.bme.hu/~gyebro/files/ans_help_v182/ans_elem/Hlp_E_SOLID187.html (accessed on 13 November 2023).
- SHELL281. Available online: https://www.mm.bme.hu/~gyebro/files/ans_help_v182/ans_elem/Hlp_E_SHELL281.html (accessed on 13 November 2023).
- Top 5 Features in Ansys Mechanical 2023 R1. Available online: https://www.ansys.com/it-it/blog/mechanical-2023-r1 (accessed on 13 November 2023).
- Balageas, D.; Fritzen, C.; Güemes, A. (Eds.) Structural Health Monitoring; Wiley: Hoboken, NJ, USA, 2006. [Google Scholar] [CrossRef]
| Disclaimer/Publisher’s Note: The statements, opinions and data contained in all publications are solely those of the individual author(s) and contributor(s) and not of MDPI and/or the editor(s). MDPI and/or the editor(s) disclaim responsibility for any injury to people or property resulting from any ideas, methods, instructions or products referred to in the content. |
© 2023 by the authors. Licensee MDPI, Basel, Switzerland. This article is an open access article distributed under the terms and conditions of the Creative Commons Attribution (CC BY) license (https://creativecommons.org/licenses/by/4.0/).


