2.1. Designing the Simulation Model with Real Baseline Data, Constraints, and Assumptions
This study uses a discrete event simulation model to study the effects of physician allocation between clinic and surgery on the total indirect patient wait time between clinic referral and clinic visit, and between clinic visit and surgical procedure. The primary variable in the analysis is physician allocation; that is, what is the effect of changing the amount of time in clinic seeing new/follow-up patients versus the amount of time in surgery on the total indirect wait time for the total patient population? A secondary variable is patient scheduling, both in the clinic and in surgery, though this will be changed as a result of physician allocation and is not truly independently variable. Specifically, as a physician’s availability varies between clinic and surgery, the time available for patients for each activity is changed as a result.
One calendar year of real data was analyzed to establish baseline patterns to use in defining the details of the simulation model. Calendar year 2019 was considered “typical”, in that it did not suffer from pandemic-induced volume fluctuations. The data were studied to establish the breakdown of visit type by provider, the percentage of visits by provider that generate surgeries, and the breakdown of surgery types by provider. Additionally, time distributions for both visit type and surgery type were established. Data for clinic visit allocation, surgical case allocation, and time distributions for each physician (anonymized) are shown in
Table 1. Note, of the 14 clinic physicians, only seven perform surgeries.
The current rate of clinic referrals was assumed to remain constant. With an annual volume of 19,649 visits per year, 52 weeks per year, 5 days per week, and 9 clinic hours per day, this gives an average arrival rate of one patient entering the clinic queue every 7.15 min. There is a mix of patient visits in the ENT clinic, depending on the chief complaint, for example, cleft lip/palate, hearing loss, breathing difficulty, fever/swelling/pain, etc. The arrival rate of new requests remains constant, but the rate at which different visit/patient types clear the queue varies based on physician allocation.
This model assumes that surgical availability is limited only by block allocation and physician availability. It does not consider limitations outside ENT resources, such as surgical nurses, sedation or anesthesia resources, or post-operative care resources. This model does not affect the time allocated to physicians for teaching or research. Only the time allocation between clinic and surgery was varied.
One aspect of total patient wait time is patient preference. In many cases, even if a surgical slot is immediately available, the patient will prefer to wait for a later slot, due to scheduling conflicts, such as arranging time off from work. This model takes two different approaches to that aspect of the total wait. For baseline model validation, a minimum voluntary wait time was modeled, based on discussions with members of the Family Advisory Board, a group of parents and caregivers of patients and former patients at the hospital who meet regularly with hospital leadership as a sounding board for hospital policy and practice. These discussions found that patients will voluntarily wait an average of 20 days, distributed normally with a standard deviation of 20 days. For optimization, the minimum voluntary wait time was removed, and the model assumed that if a clinic or surgical appointment slot is available, the patient will accept the first available slot. After the optimized allocation is found, the schedule was checked with the minimum voluntary wait time for an “apples-to-apples” comparison.
Total wait time is the dependent variable to be minimized. This is defined as the difference between when a patient enters the system and when a patient leaves the system. The patient enters the system in two ways: upon referral from an outside physician, or as a follow-up visit to a prior visit in the ENT clinic. These events “start the clock”. A patient exits the system upon completion of their needed care. This could happen in two ways: the clinic visit could resolve their case, or a surgical visit could resolve the case. These events “stop the clock” (Either of these could potentially require a follow-up visit. If so, that would be considered a new encounter, and the clock would reset and the process repeat). The time is measured in days between referral and final encounter (either clinic visit, if no surgery is required, or surgical case).
Physician allocation between clinic and surgery is the independent variable to be changed. The ENT clinic sees patients five days per week. However, not every physician sees clinic patients every day. Physicians see clinic patients on a set schedule. This is typically in half-day blocks. A full day consists of two half-day blocks, morning and afternoon. The first part of the independent variable is how many half-day blocks are allocated to each physician to see patients in clinic. The ENT clinic operates six clinic rooms, five days per week. These blocks clear the clinic visit referral backlog, which addresses the first half of the patient wait time. They also generate new surgical cases. The rate of surgical case generation is determined by the historic data, driven by visit type. The ENT service is allocated fifteen full-day surgical blocks per week. That is, three operating rooms per day, five days per week, are reserved for ENT patients. Not each physician performs surgery in each block. Much like clinic visits, physicians typically work a number of half-day blocks, morning or afternoon, throughout the week. It is possible to mix the block allocation—to see clinic patients in the morning and surgical patients in the afternoon (or vice versa)—but this is not preferred as it runs the risk of delays in one block cascading into the next block. The allocation of clinic and surgery block allocation is varied in the model. Each physician has a set number of half-day blocks available. The theoretical maximum is ten (morning and afternoon, five days per week), but in practice, most physicians serve fewer blocks than the maximum. Each has duties outside clinic and surgery, such as in-patient care, teaching, and research. The baseline allocation of physician resources between clinic and surgery (anonymized) is shown in
Table 2.
The number shown in the “Total” column is how many half-day blocks each resource has available. A goal is to keep the total resource usage consistent; only the allocation between clinic and surgery is subject to change. The numbers in the “Clinic” and “Surgery” rows indicate how many half-day blocks are allocated to each per day. These are subject to change based on the optimization, subject to constraints on maximum utilization.
2.2. Baseline Model Validation
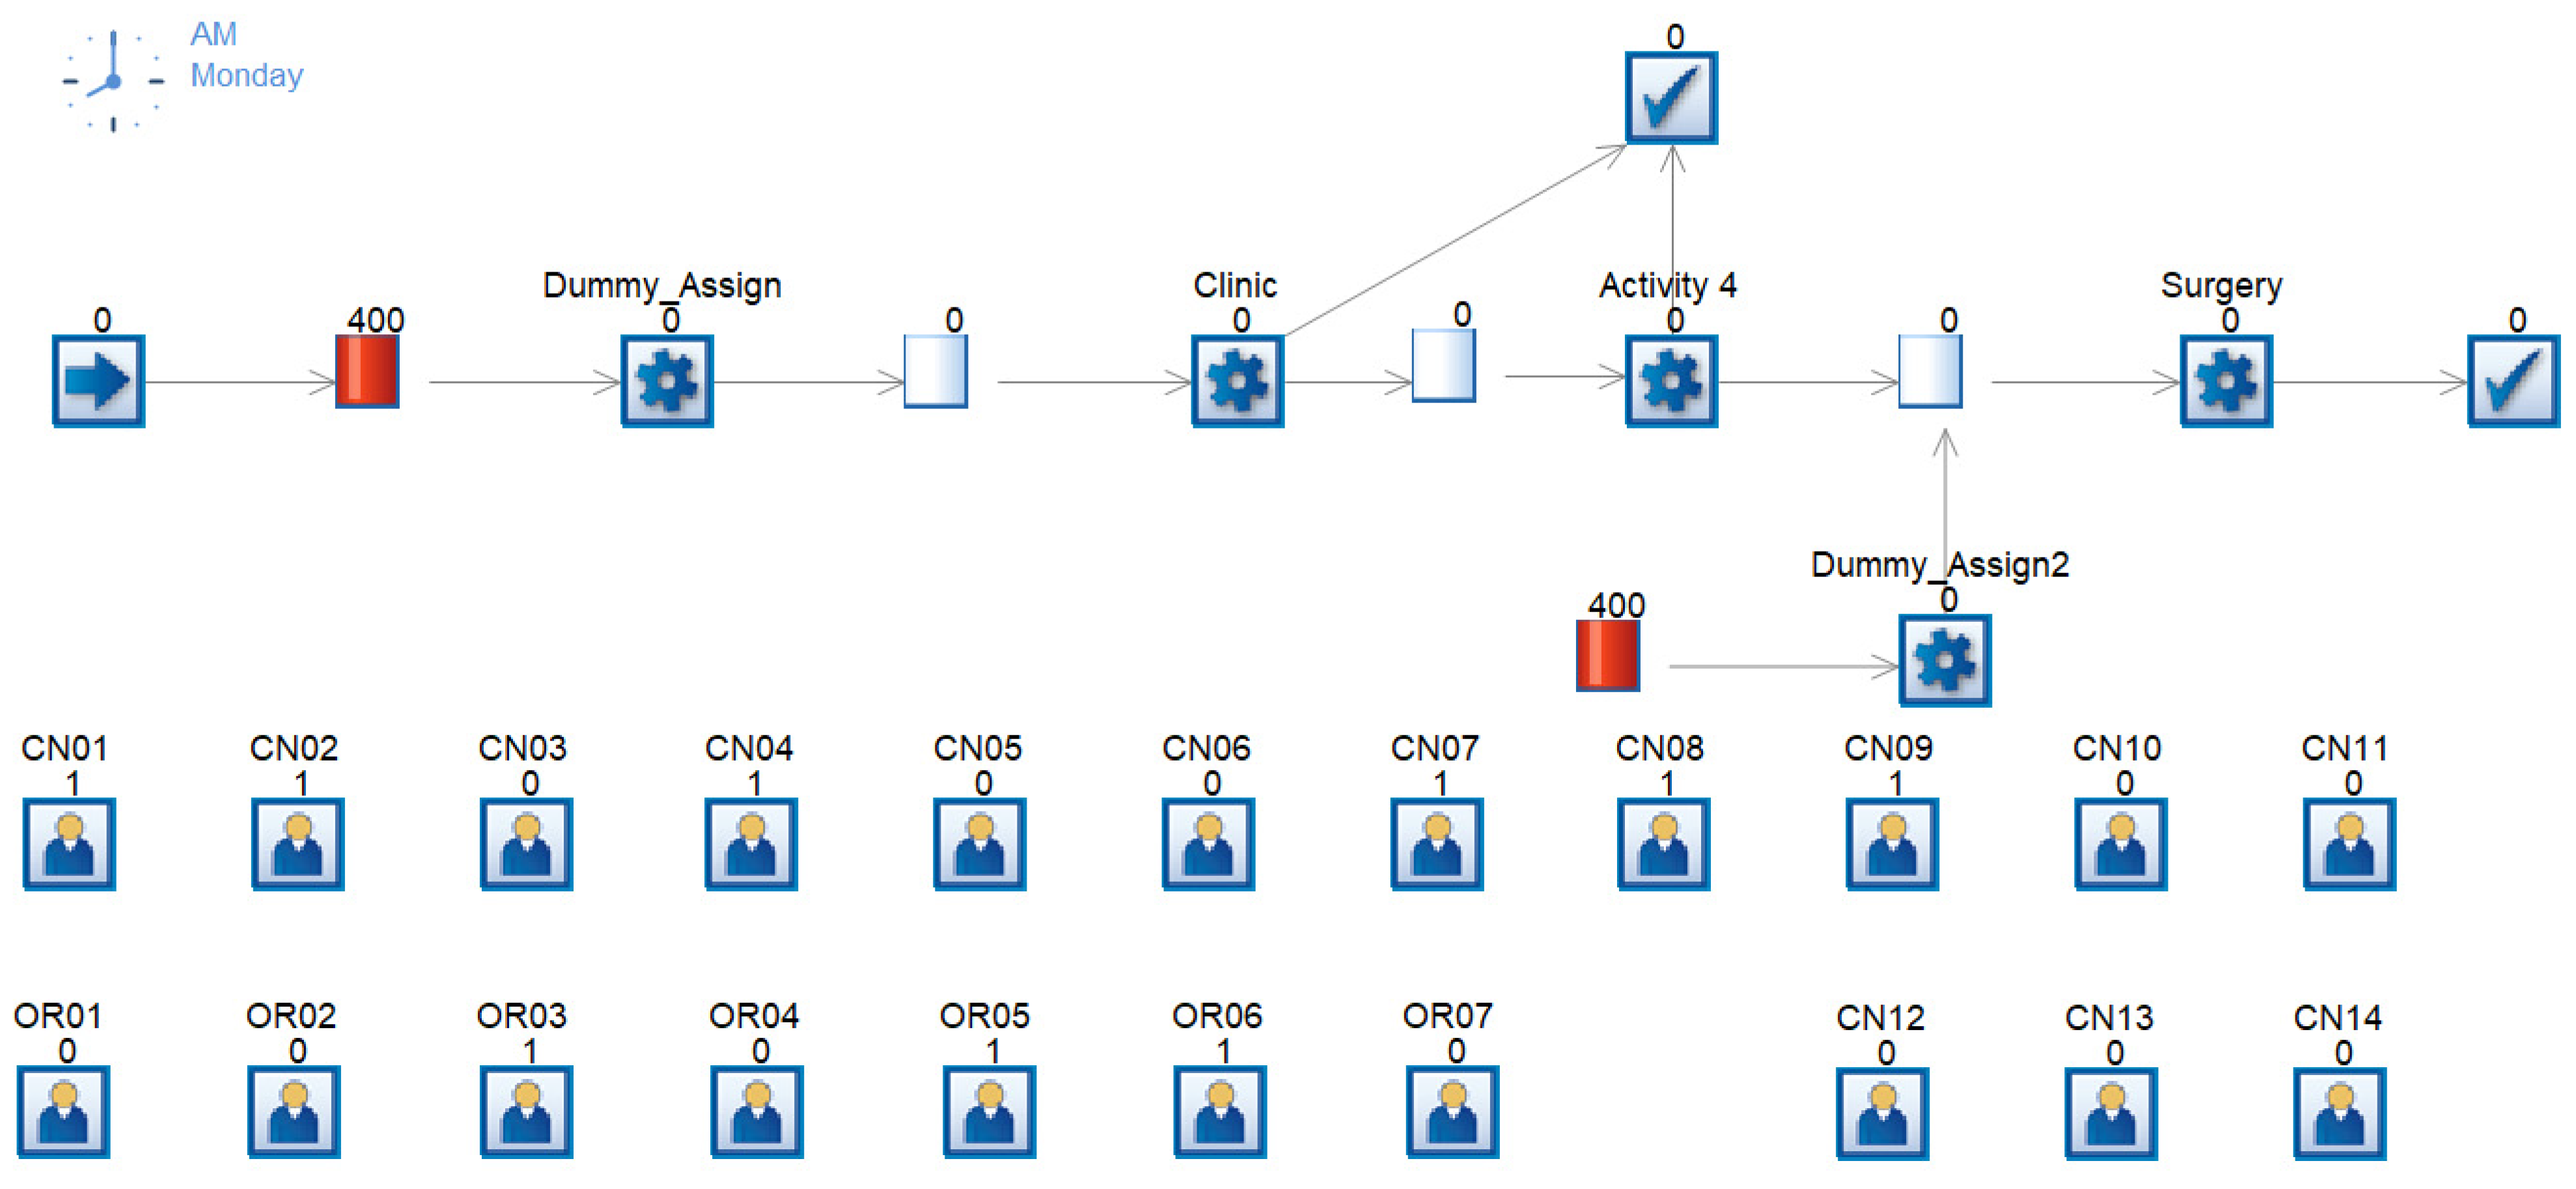
The model was built in the Simul8 2022 Professional discrete event modeling software, shown in
Figure 2. For more specific detail on the Simul8 model construction, please refer to the
Supplementary Materials.
The model is a high-level representation of the patient flow through the ENT clinic and surgical visit. Patients arrive at the start point with an average arrival rate of 1 every 7.15 min. Next is a queue with an initial volume of 400 patients. This is to front-load the simulation to account for steady-state operation and avoid beginning with a completely empty system, which would artificially speed the patient through, since they would not be waiting for prior patients to clear. Next is a “dummy” activity. This activity is assigned a duration of 0 min and is the step that assigns which physician will be seen by each patient. The probability of seeing any given physician is based on the historic data, as shown in
Table 1.
Next the patient enters the queue for the clinic visit. This is the traditional start of the patient journey. Here the patient waits for their clinic visit. This wait is determined by two factors: the minimum voluntary wait time and the physician availability. This minimum voluntary wait time is modeled as a distribution based on discussions with the Family Advisory Board. Many patients are willing and able to be seen almost immediately, but others have various social needs that necessitate a longer wait. As per the family feedback, the minimum wait time was modeled as a normal distribution with a mean and standard deviation of 4 weeks.
Next the patients are seen by their assigned physician. This task is replicated 6 times to account for the number of available exam rooms. Each physician is modeled as a separate resource, which can be assigned to either the clinic or surgery. If physician #1 is in clinic, the resource “CN01” equals 1, while resource “OR01” must equal 0, since the physician cannot be in both at the same time. This resource availability is defined in the Simul8 Resource Schedule tool, as per the defined baseline schedule from
Table 2. Each day and each physician are modeled separately.
The workflow is a “first in, first out” selection from the queue, once the minimum wait time has elapsed. This ensures that patients with extended visits or complex diagnoses are not made to wait an unreasonable amount of time. The minimum wait time models the probability of a longer wait for a more complex or less-common case, and avoids modeling in such a way that patients languish in the queue.
The clinic visit length is modeled per physician, as per the data from
Table 1. Based on the physician label assigned earlier in the flow, the average clinic visit time is assigned.
After the clinic visit, a series of activities determine which patients exit the system. Those patients seen by physicians 8 through 14 exit the system, as those physicians do not perform surgeries. Those seen by physicians 1 through 7 have a certain percentage exit the system, while the complement proceeds to the queue for surgery. The probability of a physician’s patient proceeding to surgery is as per the probability in
Table 1.
Also entering the queue for surgery is a prior queue with a set volume and another dummy activity. This is similar to the earlier dummy activity, seeding the surgical queue with patients so as to reach steady-state condition. The dummy activity assigns patients to a surgeon based on the probability in
Table 1.
When in the queue for surgery, much like the queue for clinic, there is a minimum voluntary wait time based on patient preference. This distribution was much more flexible than that for clinic, as a surgical visit entails a greater time commitment than a clinic visit, and therefore more advance planning. The minimum voluntary wait distribution was modeled as a normal distribution with a mean and standard deviation of 10 weeks.
Finally, the patient is seen by the assigned physician (surgeon). This activity is replicated three times, to account for the three operating rooms available for ENT surgeries each day. Much like clinic availability, surgical availability is modeled using the Resource Scheduler. Also as with clinic visits, the queue is a “first in, first out” selection, after the minimum wait time is reached. Surgery duration per physician is modeled from the data in
Table 1.
With the baseline model built, it was validated against historic data. In order to ensure a discrete event simulation model gives statistically significant results, multiple trials with different random variables must be run. This prevents encountering a fluke scenario that is statistically improbable (but still possible) and outside statistical limits. Simul8 has a Trial Calculator feature that evaluates how many trials are necessary to return a statistically significant result. Based on the baseline model running for one year, the number of independent trials required to reach a significant result for total patient time in system is 4, as shown in
Figure 3.
The baseline model was validated against historic performance data. A trial of four runs was conducted and the composite results compared to existing baseline data.
From historic baselines, the mean wait time for a clinic visit is 40.5 days with a standard deviation of 43.3 days. The simulation results gave a mean clinic wait time of 40.7 days with a standard deviation of 32.4 days. Similarly, the mean wait time for a surgical procedure historically was 64.4 days with a standard deviation of 64.3 days. The simulation results have a surgery wait time of 65.2 days with a standard deviation of 48.4 days. As will be discussed in
Section 3, the simulation results are not statistically significantly different from historic data. From these two results, it can be concluded that the results from the simulation are an accurate reflection of actual system performance, and that any changes from the simulation can reasonably be expected to predict actual system performance changes.
2.3. Schedule Optimization
Next, the OptQuest for Simul8 (ver 7.0) tool was integrated with the Simul8 model to find the optimal physician schedule in a constraint-reduced feasible region search. OptQuest is an optimization plug-in that integrates with many discrete event simulation tools. It uses a proprietary machine learning algorithm to optimize (minimize or maximize) an outcome variable given a set of input variables and optional constraints. OptQuest then uses the variables and constraints and runs various trials of the simulation model, studying and learning how the input variables affect the output variable, seeking an optimal solution. It should be noted that unless one is willing to exhaust all possible combinations of input variables, it is not possible to absolutely guarantee a global optimum over the input variable set. However, the machine learning tools it employs increase the likelihood of finding a solution that is close to optimal. The number of trials necessary to reach a satisfactory solution is dependent on several factors, but the one with the largest impact is the number of input variables. From the software developer, as the number of input variables increases, so too does the minimum number of required trials, as shown in
Table 3 [
23].
The OptQuest optimization program interfaces with the simulation model and variables defined in Simul8. The first step in the optimization process is defining all the variables, as well as the minimum, maximum, and suggested values for each. For this, the total number for each physician resource was defined as a variable. The clinic-only physicians had their minimum, maximum, and suggested values set to be the same value. This ensured that the clinic-only physicians do not have their allocations affected. For the clinic and surgery physicians, their minimum for both surgery and clinic was set to 1. That is, they must have at least one half-day in each. The maximum was set to their total work time minus 1; that is, they cannot be fully assigned to either. The Suggested Value was the baseline allocation, an even split between clinic and surgery.
After defining the variables, the constraints must be defined. For this project, the sum of the clinic allocation and surgery allocation cannot exceed the total allocation. If physician #1 has 8 total blocks available, then the sum of clinic allocation and surgery allocation cannot exceed 8. For this model, the constraint was set to “equal to” ensuring that no physician will lose any work compared to the baseline allocation. Additionally, the total number of clinic blocks cannot exceed the maximum number of clinic rooms, and the total number of surgical blocks cannot exceed the maximum number of operating rooms.
Finally, the objective function is selected. This project used Total Time in System. This is the complete patient experience time, from entry in the queue for clinic, through clinic visit, to queue for surgery, to finally exiting the system after surgery. This combines all aspects of the patient journey, including the two primary indirect and voluntary wait times, clinic wait and surgery wait, into one simplified variable. This was set to be minimized.
OptQuest then runs the simulation for either a set time, a set number of trials, or until all feasible input variable combinations have been tested. This project was set to run for 1,000,000 simulated minutes. This arbitrarily long time will allow the tool to complete enough trials to reach a reasonable conclusion, as discussed in [
18]. The number of simulation runs per trial is variable. This project used four runs per trial, as per the results of the Trial Calculator discussed previously.
OptQuest begins with the Suggested Value for each variable, runs the simulation trial, and records the value of the output variable. It then systematically begins new trials with variables set to extreme (minimum or maximum) values and studies the effect on the output variable. Proprietary machine learning algorithms in the tool find patterns in the input variables and begin to hone in on an optimum solution. Each “best” solution is logged as it proceeds, and the value for each input variable is recorded.
Mathematically, the analysis is a constraint-reduced feasible region. The objective function of the search is:
Subject to the following constraints:
where:
WCn = Wait time from referral to clinic visit for patient n
WSn = Wait time from clinic visit to surgery for patient n
n = patient index, the nth patient
n = total number of patients visiting the clinic
m = physician index, the mth physician
i = index for half-day block, 1–10 (1 = Monday morning, 2 = Monday afternoon, 3 = Tuesday morning, … 10 = Friday afternoon)
BCim = binary variable, is the mth physician booked in the clinic during the ith block
BSim = binary variable, is the mth physician booked in surgery during the ith block
TBm = total blocks allocated to physician m
Equation (1) is the objective function of the search. It seeks to minimize the average total wait time experienced by a patient in the ENT clinic. Equation (2) limits the total number of blocks available to each physician. There are 10 half-day blocks in a week. The absolute maximum number of blocks that can be assigned is 10. However, each physician has a different number of total blocks available. They have time reserved for research, teaching, in-patient care, etc., that reduces the time available to see patients in clinic and surgery, and that time available is physician-specific. Equations (3) and (4) set limits on how many physicians can be in clinic or surgery in one block. There can be a maximum of 6 physicians in clinic at any one time, and a maximum of 3 physicians in surgery. Equation (5) ensures that a physician is not double-booked into both clinic and surgery during the same block. Equations (6) and (7) limit the total number of clinic and surgery blocks in a given week.
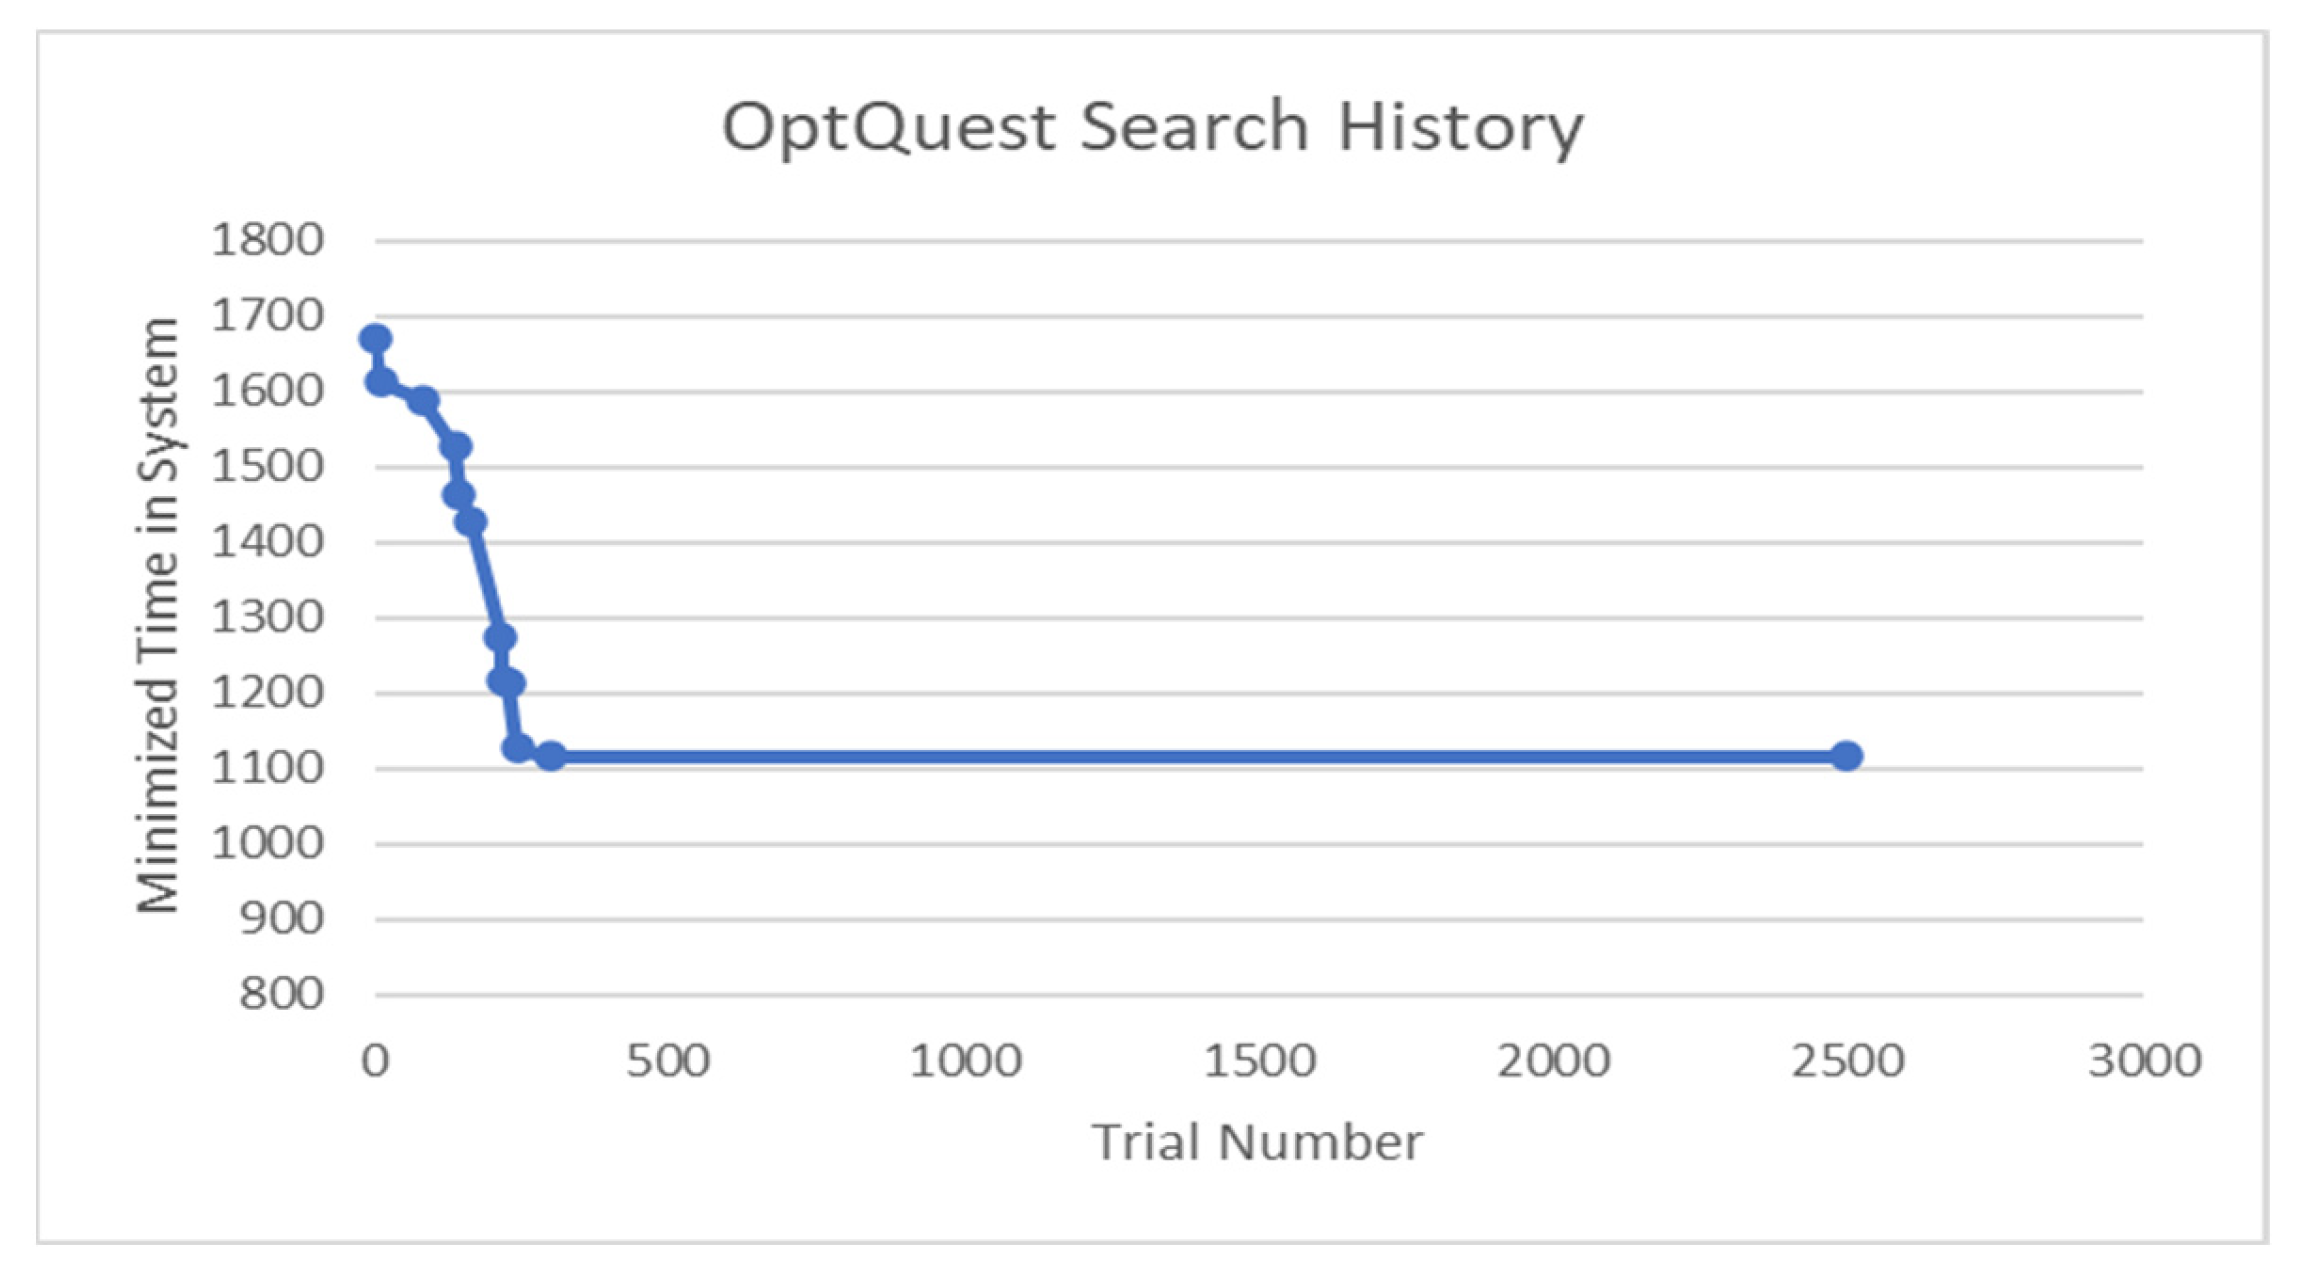
After 2500 trials, the optimization was terminated. As per [
18], this would be well over the minimum number of trials required. With 7 decision variables, the minimum recommended number of trials is 100. Therefore, 2500 trials would be sufficient for over 25 decision variables. The search took 8.5 days to complete, with an average of 4.9 min per trial. The search history is shown in
Figure 4.
As the OptQuest tool iterated, it recorded the total time in the system, studied the results, changed the input variables based on its internal machine learning algorithm, and continued the search. If the resultant time was less than the previous “best” those input variables were recorded and that trial became the new basis for comparison. The overall best trial was trial number 299. No combination of input variables gave a better result for over 2000 more trials. Therefore, while this result cannot be guaranteed to be a global optimum, it is the best that was found over the space of input variables in a large number of simulation trials, and superior to the baseline scenario. The optimized output compared to baseline is shown in
Table 4.


