Article

Consideration of Complexity in the Management of Construction and Demolition Waste Flow in French Regions: An Agent-Based Computational Economics Approach

by
Fenintsoa Andriamasinoro
* and
Daniel Monfort-Climent
BRGM, 3 Avenue Claude Guillemin, CEDEX 9, 45060 Orléans, France
*
Author to whom correspondence should be addressed.
Modelling 2021, 2(3), 385-405; https://doi.org/10.3390/modelling2030021
Submission received: 29 June 2021 / Revised: 11 August 2021 / Accepted: 20 August 2021 / Published: 25 August 2021
(This article belongs to the Special Issue Agent-Based Modelling)

Abstract

:
For each region of France, there is currently a program to implement a plan for regional prevention and management of construction and demolition waste (CDW) used in the buildings and public works (e.g., roads) sector, also called the BTP (from the French Bâtiment et Travaux Publics) sector. To implement such a plan, its complexity must be considered; i.e., account (a) for how different scales are endogenously connected and (b) for decision-making rules at each scale being introduced. However, this complexity has rarely been taken into account in the literature. Using the PACA region as a case-study, this paper presents the first results of modelling that determines a hypotheses for the geographic distribution of the road renovation rate in each municipality (microscale) and Department (mesoscale) in a region of France. Such a renovation requires recycled aggregates (gravel) and asphalt supplies simultaneously. To consider this endogenous connection between scales, the model at the micro-scale must also be calibrated so the simulated values emerging at a higher-scale approach a supply–demand balance. We also discuss the transposition of the model to another French region (Ile-de-France). The method we used is the Agent-based Computational Economics (ACE) modelling approach. In addition, the coherent interplay between scales is determined by an approach called pattern-oriented modelling (POM). Our research revealed, at a thematic level, that for a circular economy to develop, the network of facilities in the territory is very important, and effective commercialization of secondary resources is major in the areas that group together recycling platforms and nearby asphalt plants. At a methodological level, our research revealed that in any multi-level modelling exercise, POM can be seen as an essential approach to accompany the ACE approach, particularly for a macroeconomic (here macro = regional) looping of a model designed at a microscale. However, convincing the BTP sector to integrate ACE/POM as a full part of a methodological support for regional prevention and management of CDW remains a challenge

1. Introduction

1.1. Planning and Managing Waste in a Region in France: A Complex System

In accordance with the French “Loi Notre” of 7 August 2015 [1] on the reorganization of French Republic territories, the decree effective 17 June 2016 [2] required the 18 French regions to implement a regional prevention and management plan for waste called PRPGD (Plan Régional de Prévention et de Gestion des Déchets). This plan is reviewed every 6 years. This waste includes that from work sites (construction, renovation), also called construction and demolition waste (CDW). Such waste is part of the buildings and public works (e.g., roads) sector, also called the BTP (Bâtiment et Travaux Publics) sector, the value-chain of which includes both primary (natural aggregates, concrete, asphalt, etc.) and secondary circuits (CDW, recycled aggregates, etc.).
Many PRPGD plans have already been published. These include those from the Ile-de-France [3], Provence-Alpes-Côte d’Azur or PACA [4] and Nouvelle-Aquitaine [5] regions. They have been implemented at the same time as the regional quarry scheme called SRC (Schémas regionaux des Carrières), regional quarry plans for identifying material deposits in a region. Each PRPGD plan may have specificities. However, if one focuses only on cases of road renovation, the principal post-consumer use of recycled aggregates (called “gravel” in the rest of this document) as a road base, the following questions arise:
  • (Q0—demand) What is the annual renovation rate of roads in the region?
  • (Q1—supply) What are the material needs for gravel, natural aggregates, and asphalt?
  • (Q2—territorial foresight) How might the situation change over time?
Building such a plan is complex. “Complexity” refers here to two definitions [6]. First, from its multi-scale angle: “a system is complex if it can be represented efficiently by different models at different scales”. This also means that a model at a higher scale (space or time) is not representative enough to describe a model at a lower scale, necessitating the presence of both in the same system [7]. Secondly, from its multi-stakeholder and heterogeneity angles: “complexity of a system is the number of difficulties a viewer encounters while trying to understand it”. This inevitably involves multiple stakeholders perceiving the same system differently. Both definitions apply to the French regions.
The first definition applies because, although the plan is designed to help make regional decisions, the reality is some material mobilizations also come from decisions made on smaller scales [8]; i.e., at the site scale (narrower), municipalities, or agglomerations (micro) and departments (meso). These narrower decisions cannot, therefore, be ignored in planning. Conversely, juxtaposing solutions that are meant to operate locally do not solve regional problems since interactions between territories are important. Plans must therefore take into account geographical differences and the interplay between scales.
The second definition also applies. Indeed, if one takes the PACA region as an example, it is a multi-scale territory and heterogeneous in one or more scales, at least in terms of (a) locations of inert waste sites (recycling platforms) and asphalt plants, and (b) population distribution by municipality, as Figure 1 shows. Moreover, studying complexity implies that regardless of scale, representing the material flows along the processing chain is not sufficient. At each respective scale, it should also be possible to describe the decision-making rules that led to the flows (interactions) among those in the chain [9].

1.2. Purpose of This Paper

Given the necessity of considering the complexity, and by using the PACA region as a case study, the work presented in this article aims to present the first results regarding the development of a model that answers the question (Q0).
It should be noted that, although the application model described throughout the paper is focused on the PACA region, the general discussion has been extended to Ile-de-France. This was prompted by the idea of applying the PACA result to another region as soon as possible.
The remainder of this paper is organised as follows: Section 2 describes the materials and methods used, including the boundary of the work, the limits of the state of the art, and the details of the proposal. Section 3 presents the results, which are discussed in Section 4. Finally, Section 5 contains conclusions and perspectives.

2. Materials and Methods

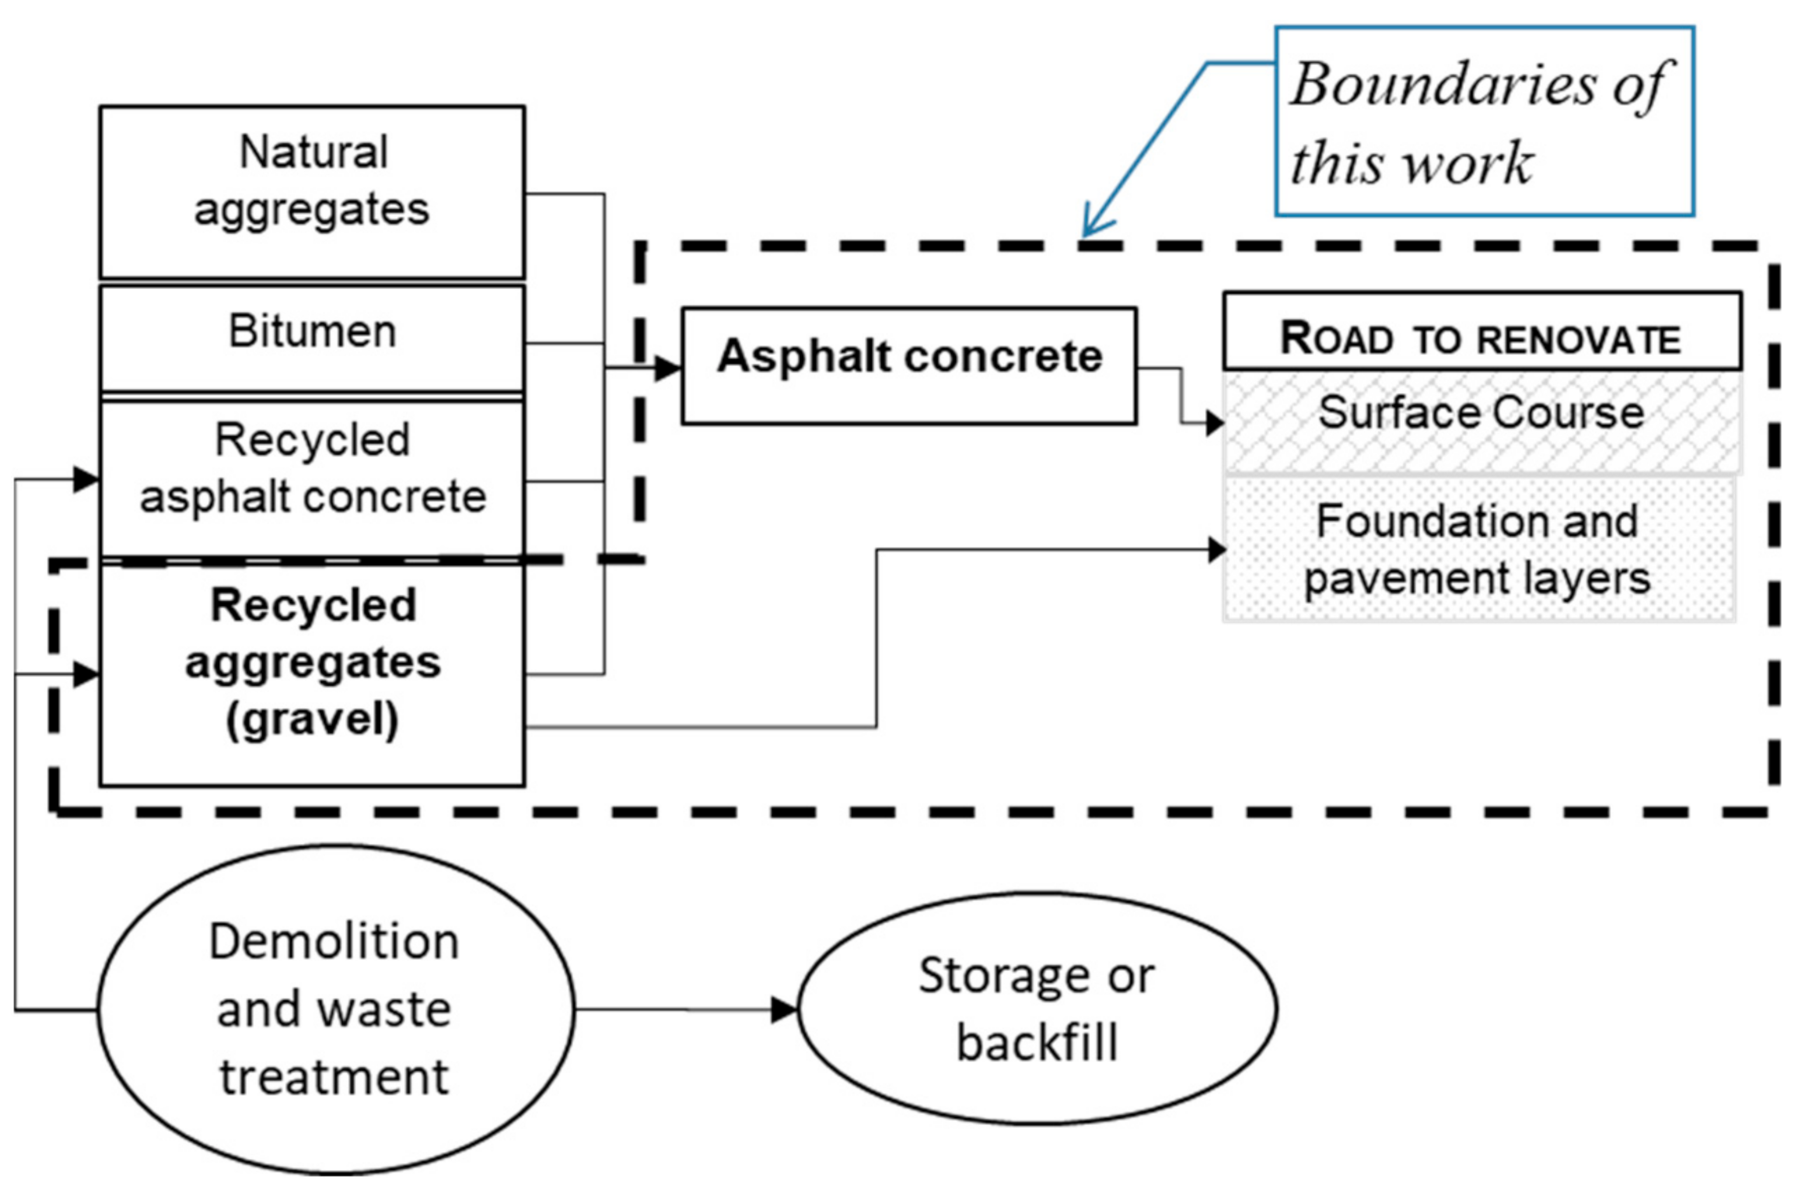
2.1. Boundaries of the Work and Reasons

The first boundary of this work is that it is focused only on road renovation. This is not a unique representation of demolition waste planning and management. In fact, in French regions, generally there are at least three destinations of demolition waste [10]:
  • Recycling: for road renovation, road construction, concrete design mixes using recycled aggregates [11], etc.
  • Valorization: for reuse on the same demolition place, quarry backfill, etc.
  • Storage: for example, in the inert waste storage or ISDI (Installation et Stockage des Déchets Inertes)
The second boundary is that the road renovation model developed here departs from the strong hypothesis that renovation of roads by territories does not depend on factors other than the availability of gravel and the location of nearby asphalt plants (Figure 1). The model also ignores all the upstream stages of processing demolition wastes resulting in these materials. Consequently, it currently ignores the study of important parameters such as variability [12] and the recycling potential of the materials in these wastes.
The third boundary is that the work currently ignores other waste potential destinations (backfill and storage).
Figure 2 summarises the boundaries.
In addition, as previously mentioned, we focus on only 2 French regions (of a total of 18 regions) because these are the ones that we have studied to date: PACA, for the modelling application, and Ile-de-France, for the discussion extension.
The boundaries are mainly a result of our modelling methodology: the modelling cycle approach proposed by Railsback and Grimm [13] was found useful for designing our complex system (Figure 3). These cycle authors outline the process as follows: “the modelling is a cyclical and an iterative process, …it must be started with the simplest model possible, because we want to develop understanding gradually, while iterating through the cycle. …It is wise to have a model implemented as soon as possible, even if it is ridiculously simple. But the simpler the model is, the easier it is to implement and analyse, and the sooner we are productive”. With that approach, when the current version of a model malfunctions, it is “easier” to find the last cycle in which the model was stable to restart the model improvement from that point instead of from the beginning [7].
The work reported in this paper corresponds to the communication task (Figure 3) of the first modelling cycle which is already complex on its own.

2.2. State of the Art

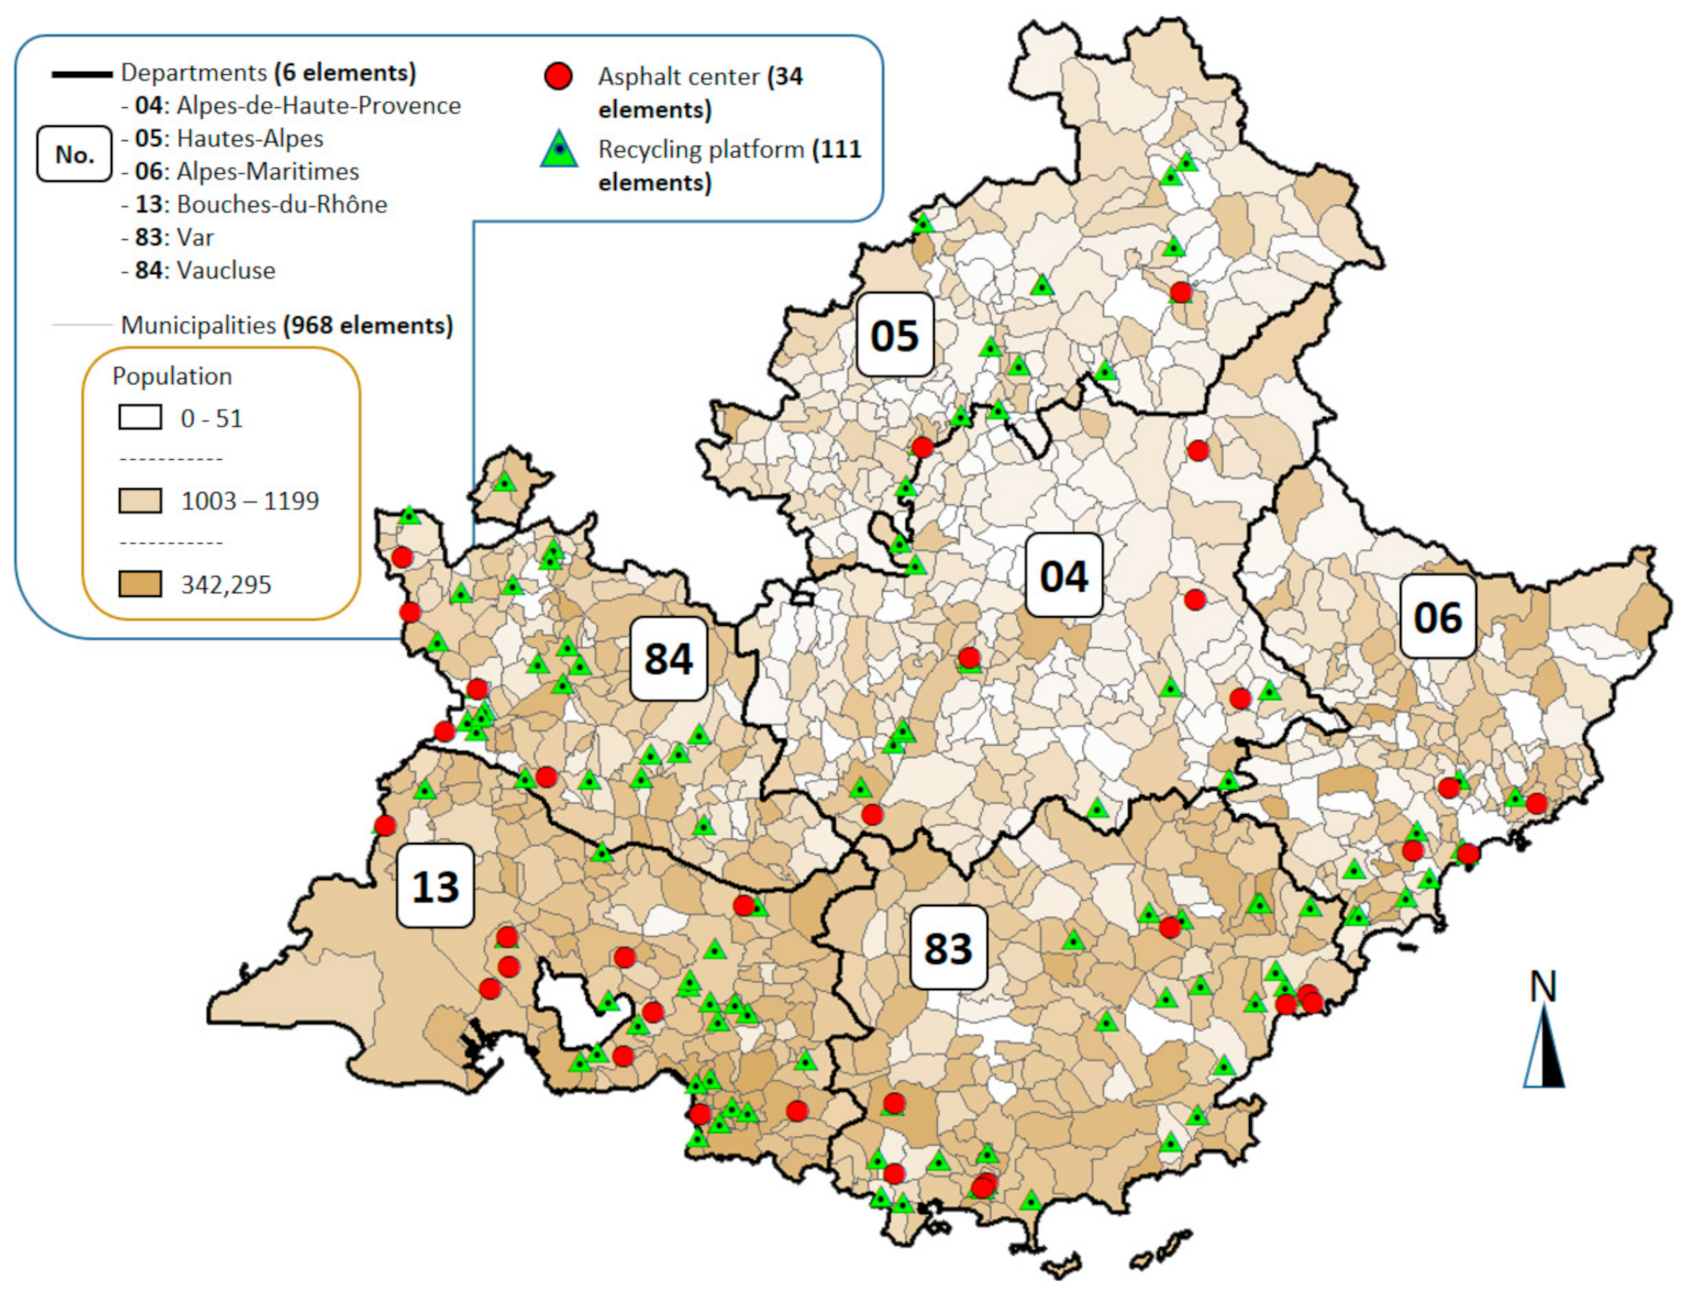
2.2.1. The Previous Situations in the PACA Region

In 2017, work was conducted by the PACA region for PRPGD and covered various cooperative workshops [14,15] that were, among other things, to answer questions (Q0) and (Q1). Future scenarios (Q2) had not been taken into account. The answer to (Q1) is global gravel and asphalt production estimated from the 2015 survey and other sources [16]. Table 1 shows how this production is split.
From the data in Table 1, and with knowledge of the surface area of the region’s roads [16,17], the workshops estimated a global road renovation rate of about 3.7%. Furthermore, beyond this global study, these workshops also integrated the results of a survey on a more detailed scale (sites) conducted in 2017 with operators in the region. These surveys related to a 2015 survey of inert waste activity from demolition in construction and the production and consumption of asphalt and gravel. The response rate was only 75%; 25% of sites did not respond with their production and flow data.
The main limitation of the work carried out during these initial workshops was that in PACA, one major issue in CDW management and planning was transport constraints associated with the heterogeneous distribution of places that these CD wastes could be processed in the entire territory: for reuse (e.g., in quarries for backfilling), recycling (in platform sites), or storage (e.g., in ISDIs). More specifically, in France, material transport cost doubles every 30 km [18]. However, this major issue was not considered by the model developed in the initial PACA workshops [14,15]. The workshops only considered global (i.e., regional) material demand and the corresponding available global supply (cf. Table 1). They did not detail the sufficiency of supplies to meet the demands when considering the transport cost constraint. It is often difficult to accommodate this constraint because the locations of waste generation (from demolition due to municipal planning, for example) and waste consumption—e.g., quarries (for backfill)localised only where geological resources are available—may be distant from each other. Therefore, by staying at a global level, there are high uncertainties of the traceability of the destination of real wastes. This is something neither a planner nor a firm is concerned about.
The Centre for Study and Expertise on Environmental Risks, Mobility and Development or CEREMA (From the French Centre d’Études et d’expertise sur les Risques, l’Environnement, la Mobilité et l’Aménagement) in PACA has developed a mapping tool for Mineral Resources Management named GEREMI-PL (GEstion des REssources MInérales—Prospective et Logistique) [19]. This lists the deposits and compares prospective material flow scenarios (question (Q2) of this paper) for road renovation, among others. This CEREMA tool, although a decision-aid tool used at a regional level, came more from SRC rather than from PRPGD. Additionally, it does not contain decision-making rules between players.

2.2.2. Beyond PACA: The BTP Sector in General

To provide a wider spectrum of what exists in the BTP sector in general, we also briefly discuss the state-of-the-art beyond the single PACA context. The works selected in this subsection include those which were carried out on a territorial scale in France, of course, but also some in other European countries. The review itself evaluates the extent to which the multi-level (vertical interplay), the flow (horizontal interplay), and the decision-making aspects have been integrated by this work.
Regarding the “multi-level” aspect, we can cite, inter alia, the work of team of Fevre-Gautier and Fraj, A.B [20,21] or that of Augiseau and Eunhye [22], carried out in France only. Augiseau and Barlès [23] as well as the team of Ioannidou [24] considered France and other European countries while the work of the team of Göswein [11] was carried out in Portugal. The common theme of the “multi-level” aspect of these works is that the endogenous interplay between different levels was not considered for the same geographical area. For example, in [20], the multi-level consideration consisted of taking two studies at different levels in France: one in Orléans (municipality level) and one in Bouches-du-Rhône (department level). Neither is in the same region of France. Only the team of Ioannidou [24], with its study on natural aggregates, included complete coverage of three levels of France: national, departmental, city. But even in that work, the interplay is limited to the geographical visual superposition of these three levels, via a GIS tool. There was no endogenous interplay.
None of the abovementioned works took the “flow” aspect into account. For example, the work of Augiseau and Eunhye [22] was focused only on the stock analysis in the Paris region (Paris and its peripherals), a sub-region of the Île-de-France region. That work, however, recognised the flow analysis as one of its perspectives. The work of the team of Ioannidou [24], which included complete geographical coverage of three levels of France, was also only mainly focused on the location of natural aggregates and their accessibility, not on the flows of natural aggregates sent to the concrete manufacturer. Nonetheless, some works considered the “flow” aspect. Those works can be divided into two categories regarding the accuracy reached in flow quantification. The first category considers the geographical distances between the source and destination of the studied material, while the second did not. In the first category, we can cite inter alia the work of Fraj and Idir [21], and in the second case, we can refer to most of the works listed in the review paper of Augiseau and Barlès [23]. However, when the geographical distances are calculated, they are not actual itinerary distances; they are only an average distance obtained from the whole distances between source and destination in the entire studied territory. Averaging distances can be a problem for the accuracy of the transport costs of material since this cost doubles every 30 km [18]. Thus, if this average distance is above 30 km, any trip less than 30 km in the real territory will still have its cost doubled in the model. Also noteworthy is that all models considering the “flow” aspect have a common limit: the non-consideration of the decision-making rules that led to the flows, as suggested by Ponte and Sturgeon [9]. As a result, these models can hardly be used to carry out a territorial foresight [25]; i.e., to answer in an endogenous manner, the future question (Q2) introduced in this paper: the evolution in the territory over time. Yet, answering Q2 in an endogenous manner is necessary because the present study on complexity considers at least the municipalities in a French region (around 1000 on average). Therefore, it is impossible to interpret this study only exogenously, especially when the horizon chosen for the oversight is the medium term.
The team of Schleifer [26] developed a market model of aggregates supply at a regional level (Ile-de-France). However, in addition to the fact that the model came more from the regional quarry scheme (SRC)—i.e., the primary circuit—than from the recycled aggregates scheme (PRPGD), i.e., the secondary circuit, it used a unique central optimization engine to connect producers and consumers of the whole regional market as has been methodologically done by Gomez [27]. It then assumed (a) that the market is driven on a global (i.e., regional) scale—which is not the case in the French regions—and (b) that via the optimisation process, a market equilibrium may be reached. This implies that consideration of decision rules at local scales and the endogenous interplay between the scales is not necessary.
All in all, complexity has rarely been taken into account in the literature.

2.3. Proposal

2.3.1. Refinement of the Question

To better consider complexity, we think it is necessary to extend the initial global model estimation obtained from PACA workshops to a more refined and more complex model. More precisely, the question (Q0) in the introduction is refined as follows (Q0’—demand): for 2015, what would have been, for PACA, the possible geographic hypothetical distribution per municipality and department of the quantity behind this global road renovation rate of 3.7 % (Section 2.2.1)?
In addition, considering the interplay between scales, the lower model (municipality) must also be calibrated so the simulated value emerging at a global (i.e., regional) level approaches the supply–demand balance the workshop participants determined for the region (3.7%). The complexity inherent in the model is to use the existing network of recycling platforms and asphalt plants (Figure 1), considering the length of roads in each municipality [16] and the typical composition of the asphalt.

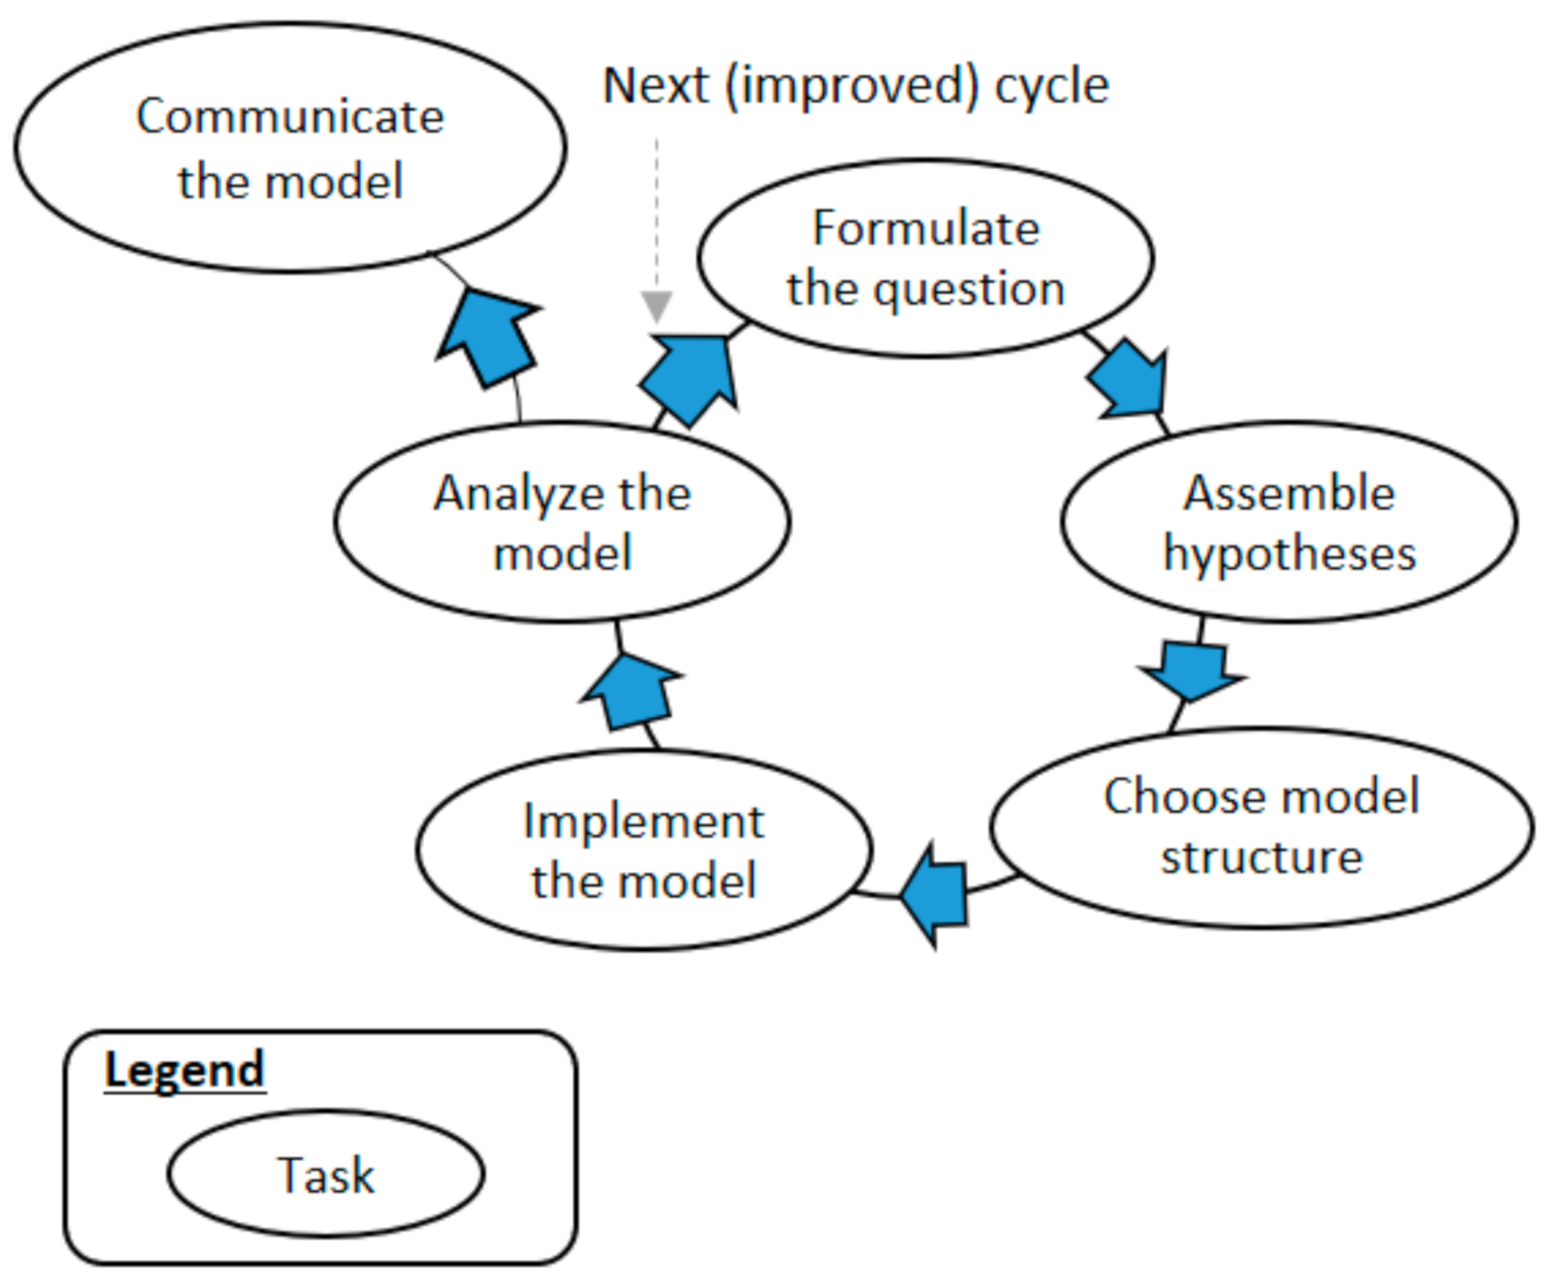
2.3.2. Methodology Proposal

To deal with the complexity of the PRPGD, we propose using ACE modelling; i.e., a modelling and computer simulation of economic processes as dynamic systems of interacting agents [28,29]. In short, an ACE model is an economic simulation model implemented in a form of collective intelligence. ACE (applied here to PACA) can be seen in the same manner: an ACE market model is composed of autonomous economic decision-making agents in PACA, sites, municipalities, and departments, interacting in parallel considering they have only partial perception of the other agents and the whole system. Vis-à-vis, the state-of-the-art, and as far as we know, the ACE approach (although it is one of the rare approaches toward managing complexity) have never been applied to either a CDW management or aggregates resources management in general. The spectrum of the state-of-the-art must be extended to the more abstract field of mineral resources (a subfield of which is aggregates resources) to determine works adopting the agent-based approach. More precisely, the agent-based approach is more often applied to another category of mineral resources: metals (used predominantly for the vehicle and phone sectors, etc.; not for the BTP sector). Even in that case, the multi-level aspect is represented as an interplay between international and global levels (excluding the regional level) and the flow aspect mainly covers only primary metal resources circuits, not the recycled metals circuit. We can cite the work of the team of Knoeri and Riddle [30,31] or that of the team of Yuan [32] as rare examples of these works. The date of the latter work (between 2013 and 2021) and the state-of-the-art regarding the BTP sector confirms that the application of the ACE on mineral resources is still at its early stages.
In addition, whereas our model is developed using ACE, the interplay between scales is determined by an approach called pattern-oriented modelling or POM [33], in which the workshop results from the global pattern to be reproduced. The lever for this “micro–macro fit” section is based on an estimation of production at the sites that did not respond to the survey. More precisely, we assigned the same value for all of them and for each respective material so that we could evaluate the global phenomenon.
In place of the dual ACE/POM approach, another possible idea to answer (Q0’) would have been to mathematically normalise all municipalities to the same road renovation rate (3.7%). To verify the potential of that approach, let us consider the fictive example of two different municipalities in Table 2.
Column E in Table 2 shows that when one normalises heterogeneous municipalities to the same renovation rate (3.7%), the difference between the initial data and the calculated values, in terms of the road length to renovate, is high for the respective municipalities (452% and 56%, respectively). Our conclusion here is that the normalisation approach cannot accommodate complexity.

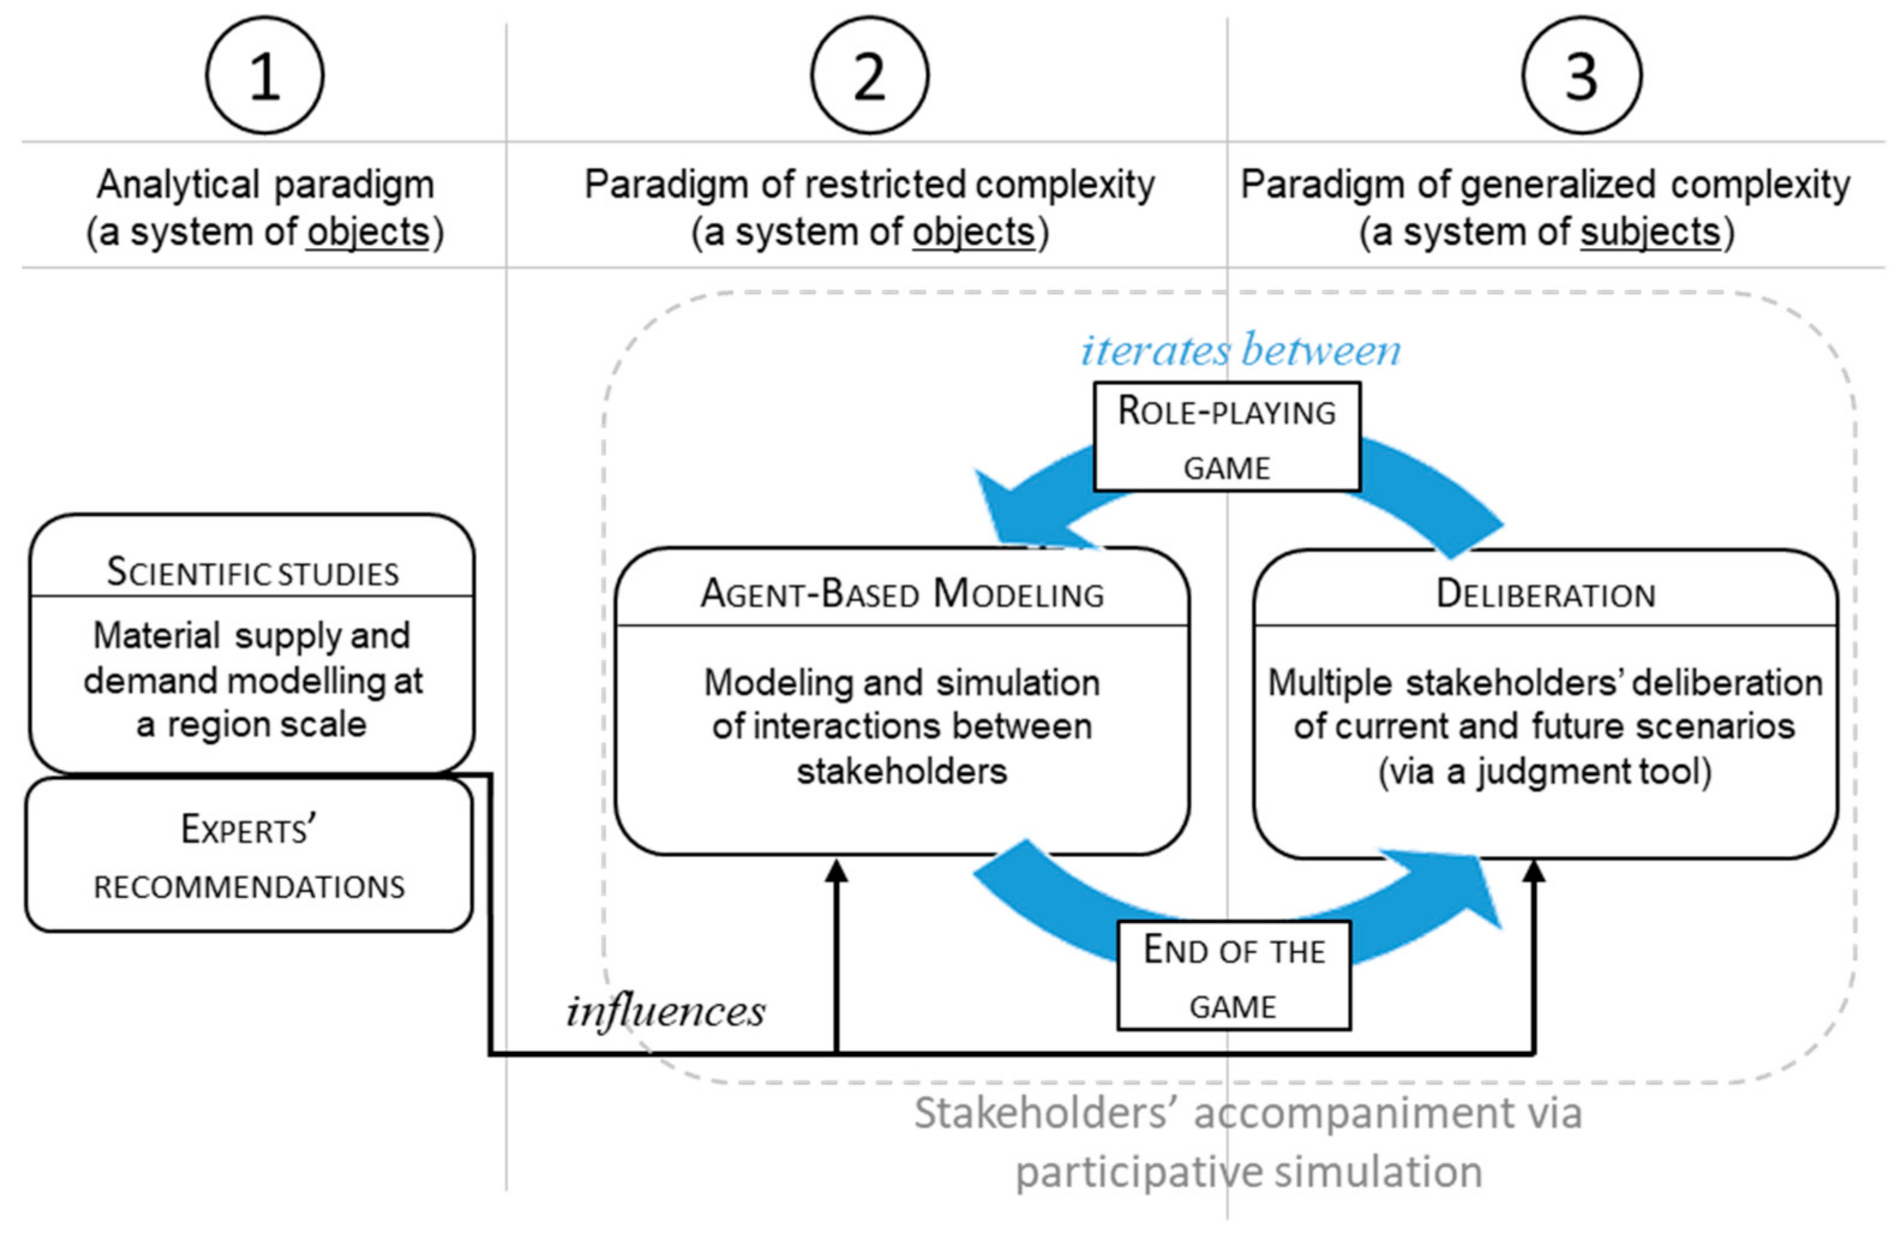
2.3.3. The Complexity Paradigms

To evaluate the actual place of ACE on planning and management of waste from the point of view of complexity, let us first explain the complexity paradigms.
According to Rossignol [34], for modelling, there are three levels of complexity paradigm (Figure 4):
  • the analytical paradigm
  • the restricted complexity paradigm
  • the generalised complexity paradigm
Figure 4. The three levels of the complexity paradigm of a system, adopted by this paper to deal with the complexity of the PRPGD. The ACE modelling approach is in Paradigm 2. Source: the three paradigms’ basic scheme is drawn from [34].
Modelling 02 00021 g004
The details of the three paradigms in Figure 4 are described subsequently.
The analytical paradigm (Paradigm 1) is the classic top-down type of paradigm. Experts generally act at this scale and analyse a system at a global level. The associated modelling approach is mathematical or statistical. This paradigm does not generally integrate complexity. As stated by the team of Arthur [35], the mathematical tools economists customarily use cannot provide a deep understanding of adaptive non-linear networks that the economy, an evolving complex system, represents. One of the reasons for this is that these tools exploit linearity, fixed points and systems of differential equations.
The restricted complexity paradigm (Paradigm 2) is the start of the bottom-up paradigm, which accounts for particularities in a system being modelled. ACE models are examples. They are a particularly appropriate methodology for examining an economy as a complex adaptive system [36]. Further, this approach is among the rarest—or may be unique according to Fromm [6]—in being able to represent the decision-making rules of those involved individually, the interactions between them, and interactions between the scales. It is therefore a modelling approach suited to our problem in understanding the complexity of the PRPGD.
The generalised complexity paradigm (Paradigm 3) is the one in which those involved (stakeholders) are committed to creating a discussion space with a deliberative perspective via a constructed dialogue [37] for the territory’s future scenarios. In this paradigm, everything is subjective, and the scientific method no longer applies. The decision in Paradigms 2 and 3 is made by collective intelligence. The difference is that Paradigm 2 uses software agents (implemented in an ACE model) while Paradigm 3 uses human agents (stakeholders). Role-playing games, in the form here of serious games [38], can serve as a tool acting as an intermediary between the two paradigms.
Ideally, to discuss a problem on a territory-wide scale (like PRPGD), these three paradigms ought to be connected, as follows: deliberating on future scenarios (paradigm 3) using a model that accounts for the complexity and/or a set of roles (paradigm 2) and which integrates the expert (paradigm 1) to explain the reflection and the group’s decision.
Currently, what has been done is that most works listed in the previous state-of-the-art subsections are predominantly situated in Paradigm 1. In fact, in the case of Ile de France, Paradigm 3 has already been considered [10], as have role-playing games [39]. However, these works were carried out independently of each other. In the case of PACA, even though the PACA workshops collected data at different scales, they did not consider paradigm 2 at all, but only paradigms 1 and 3 (deliberation by experts from a global model). Even in this case, future scenarios were not taken into account in the deliberation.
In line with the development of the ongoing process to connect the three paradigms in the context of PRPGD, the work reported in this article aims to introduce paradigm 2 for PACA.

2.4. Model Description

In this article, we give only the information necessary for understanding the results and discussions. The complete version of our model is described in the Supplemental Materials. That complete description follows the Overview, Design concepts, and Details (ODD) protocol [40] and more precisely the ODD + D protocol [41], which is an extension of the ODD protocol to represent human-decision making in an ABM (here, an ACE model).

2.4.1. List of Decision-Making Entities

Table 3 details the list of decision-making entities for the model and the goals to be met in making those decisions (one entity may require several decisions in different contexts). By contrast with Figure 1 which shows the elements manipulated (e.g., recycling platform), the ACE approach shows the agents (e.g., recyclers) performing the manipulation.
Moreover, the model contains a unit called “MacroManager”. This is more of a technique than a thematic feature: it synchronises exchanges between units.

2.4.2. Interaction Sequences

To answer question (Q0’), the model follows the following sequence.
From the length of the various types of roads in the municipality and ratios of gravel and asphalt that are used for a road to be renovated, PMs evaluate their respective material needs (gravel and asphalt). Then they look, in a given radius, for the closest suppliers (recycler and asphalt producer) that have stock available. The type of material produced by each site can be seen in Figure 1. If there are two supplier sites found, they prepare the two associated orders and send them to the MacroManager. If they do not find two sites, this means there was no renovation for this PM’s municipality (this is the resolution hypothesis chosen). In this case, no material order is made. Whether there is an order or not, the PM notifies the MacroManager of the situation. Once all the notifications have arrived, the MacroManager processes the order to the head of the line for each material.
The recycler receiving an order makes an offer to the ordering PM. The asphalt producer does the same.
The PM then determines whether the material supplies have arrived and, when no proposals have been made, a more distant site is accessed. The absence of proposals indicates other orders of this material were received before this PM’s order. If no other site has been found at this stage, the PM returns the material that is available to its producer. This material is unusable as both are needed for the renovation.
When an unusable material is returned from the PM, it is added to the stock for sale and the MacroManager is notified. The next order is then processed.

2.4.3. Model Data Source and Evaluation

The survey of operators conducted in PACA is of their 2015 production activity and inert waste management from deconstruction. The response rate was only 75% (25% did not respond). This is the survey that was used to refine our model.
More precisely, for the model to be able to identify the location of these operators’ sites (whether they responded or not), the results of the survey were coupled with the layers of the corresponding geographic information system (GIS). These layers have been provided by the Regional Directorate for Environment, Development, and Housing in PACA (Direction Régionale de l’Environnement, de l’Aménagement et du Logement, DREAL) [42]. Concerning the 25% of sites that did not respond to the survey, the production by default for the respective materials was determined using pattern-oriented modelling or POM [33]. The value of the default production (the same for a given type of material) of these sites (municipality scale) was estimated so that global production for the entire region, per type of material, approaches the actual data for PACA in 2015 (Table 1).
Finally, the transport data used by the model is presented in the form of a matrix of distances, extracted from the compilation of the Route 120® national data [43] but delineated over PACA. This matrix attributes for each municipality in the region (968 in all, see Figure 1), the minimum road distance to all other municipalities in the region. For each municipality, the list of distances is sorted in increasing order. The reference point is the municipality capital (generally the location of the town hall). Accordingly, the tables for the entire PACA region contain about 940,000 entries. Table 4 shows only a partial view of this matrix of distances for Department 04. This table for Department 04 contains about 190,000 entries.

2.4.4. Simulation Platform

The model has been implemented under the agent-based platform called Is@Tem [44]. While many simulation platforms exist in the agent field, this platform has been chosen because of its ability to display and simulate geographic data having a vector form (polygon, line, circle). This allows us to import our GIS shape data as-is (i.e., no pre-transformation needed) and to display our simulation results in a form immediately close to Figure 1, thus simplifying the resultant interpretation.

2.5. Sensitivity Analysis

The experimental plan proposed for the analysis aims to find the level of influence of the inputs:
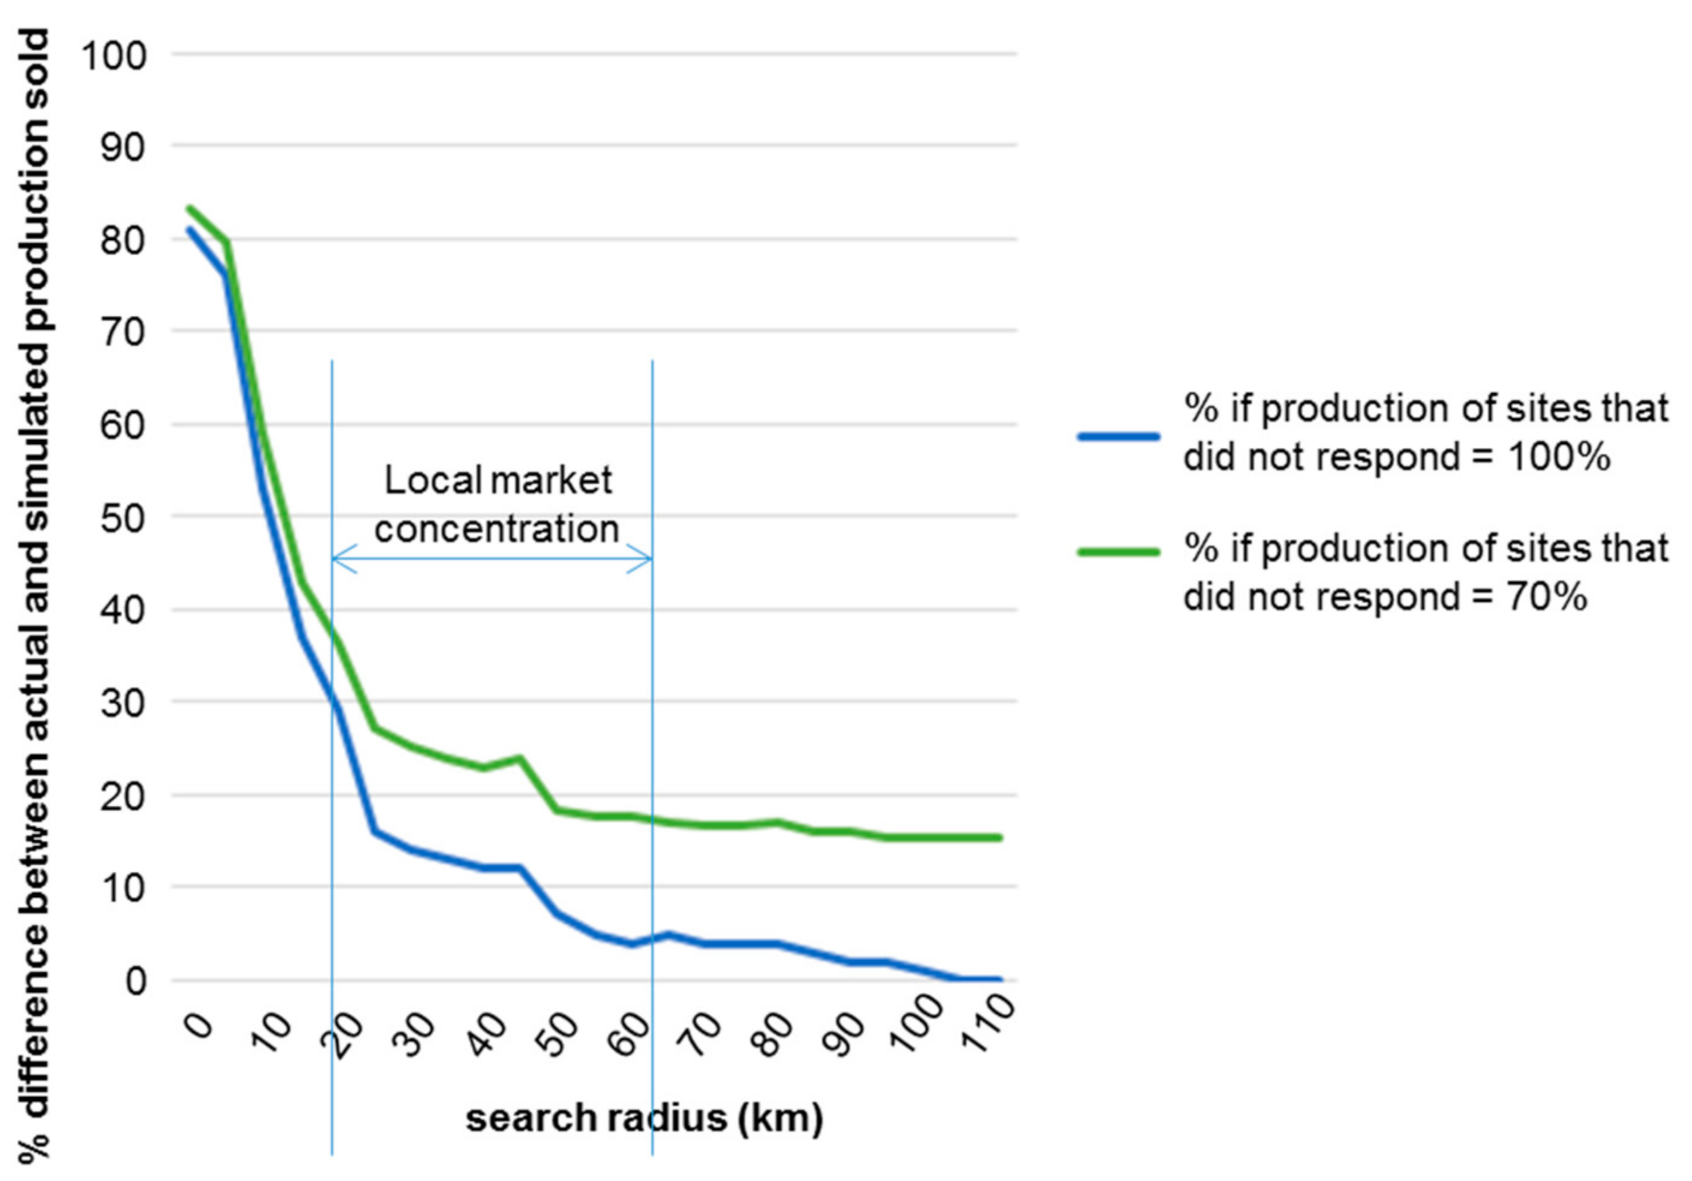
  • (a) search radius of suppliers and (b) production rates at sites that did not respond to the 2015 survey;
  • Regarding the outputs: (i) regional production difference in material between the actual global value for 2015 (Table 1) and the value from the simulation, and (ii) distribution of renovation rate.
    The first output aims to validate the model and the second aims to use the model thematically.
    The plan covers the following experiments:
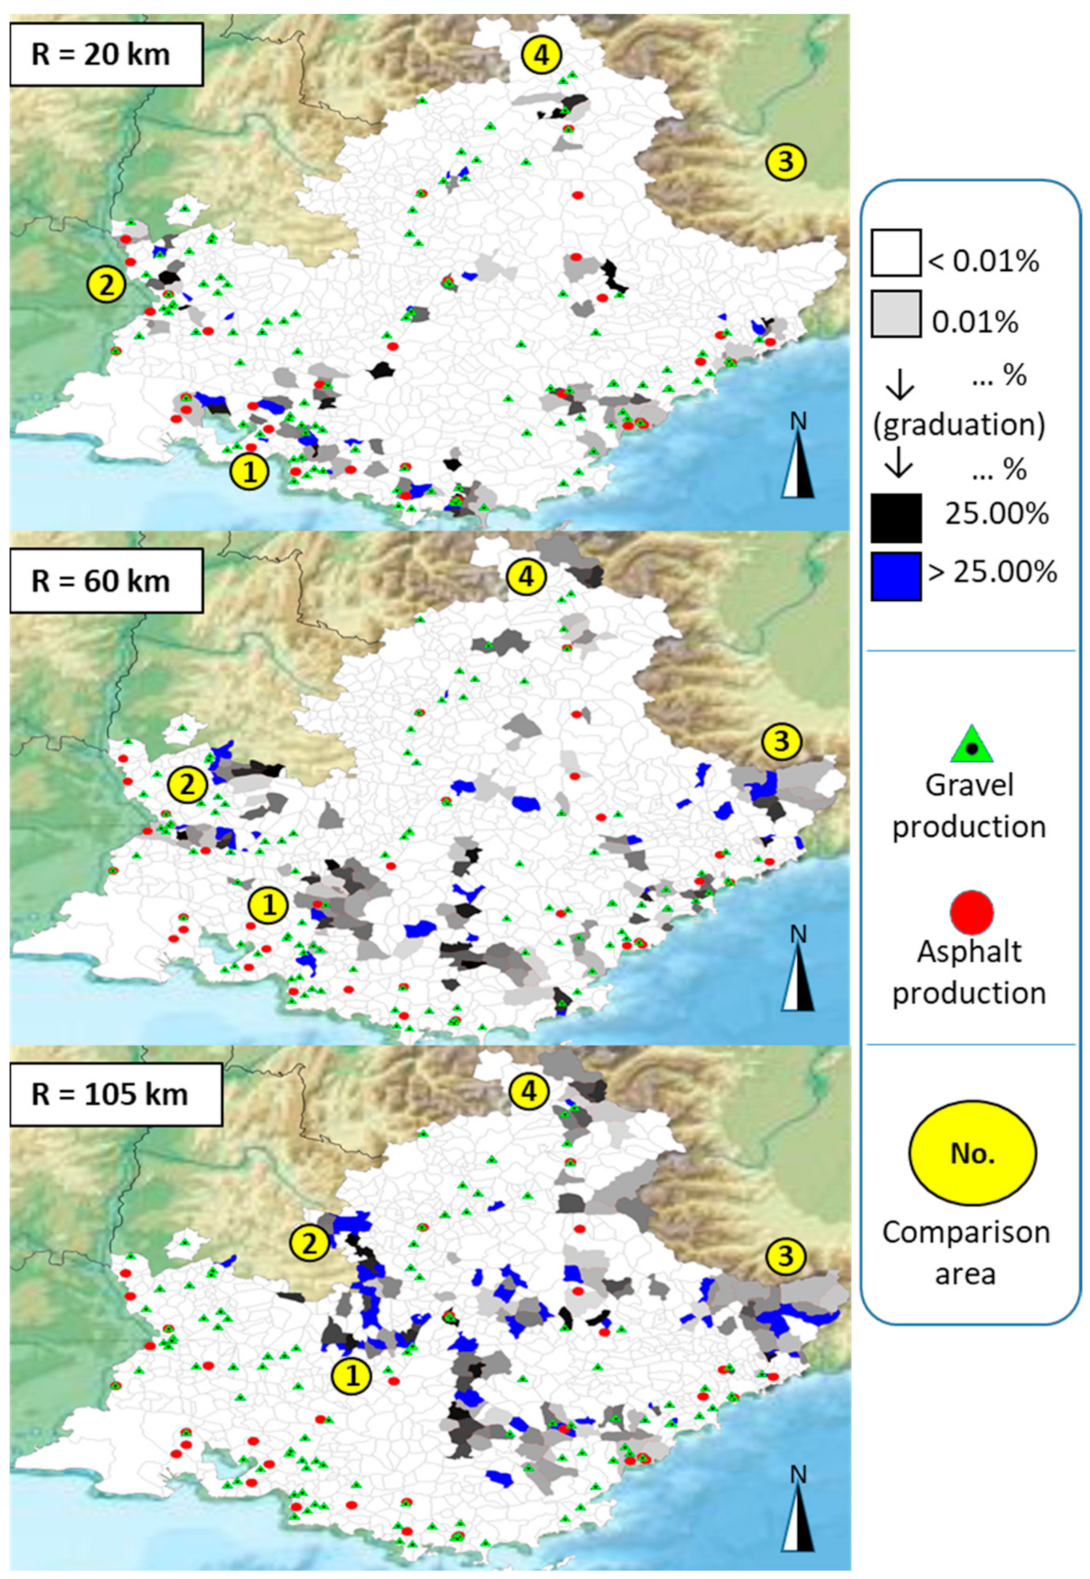
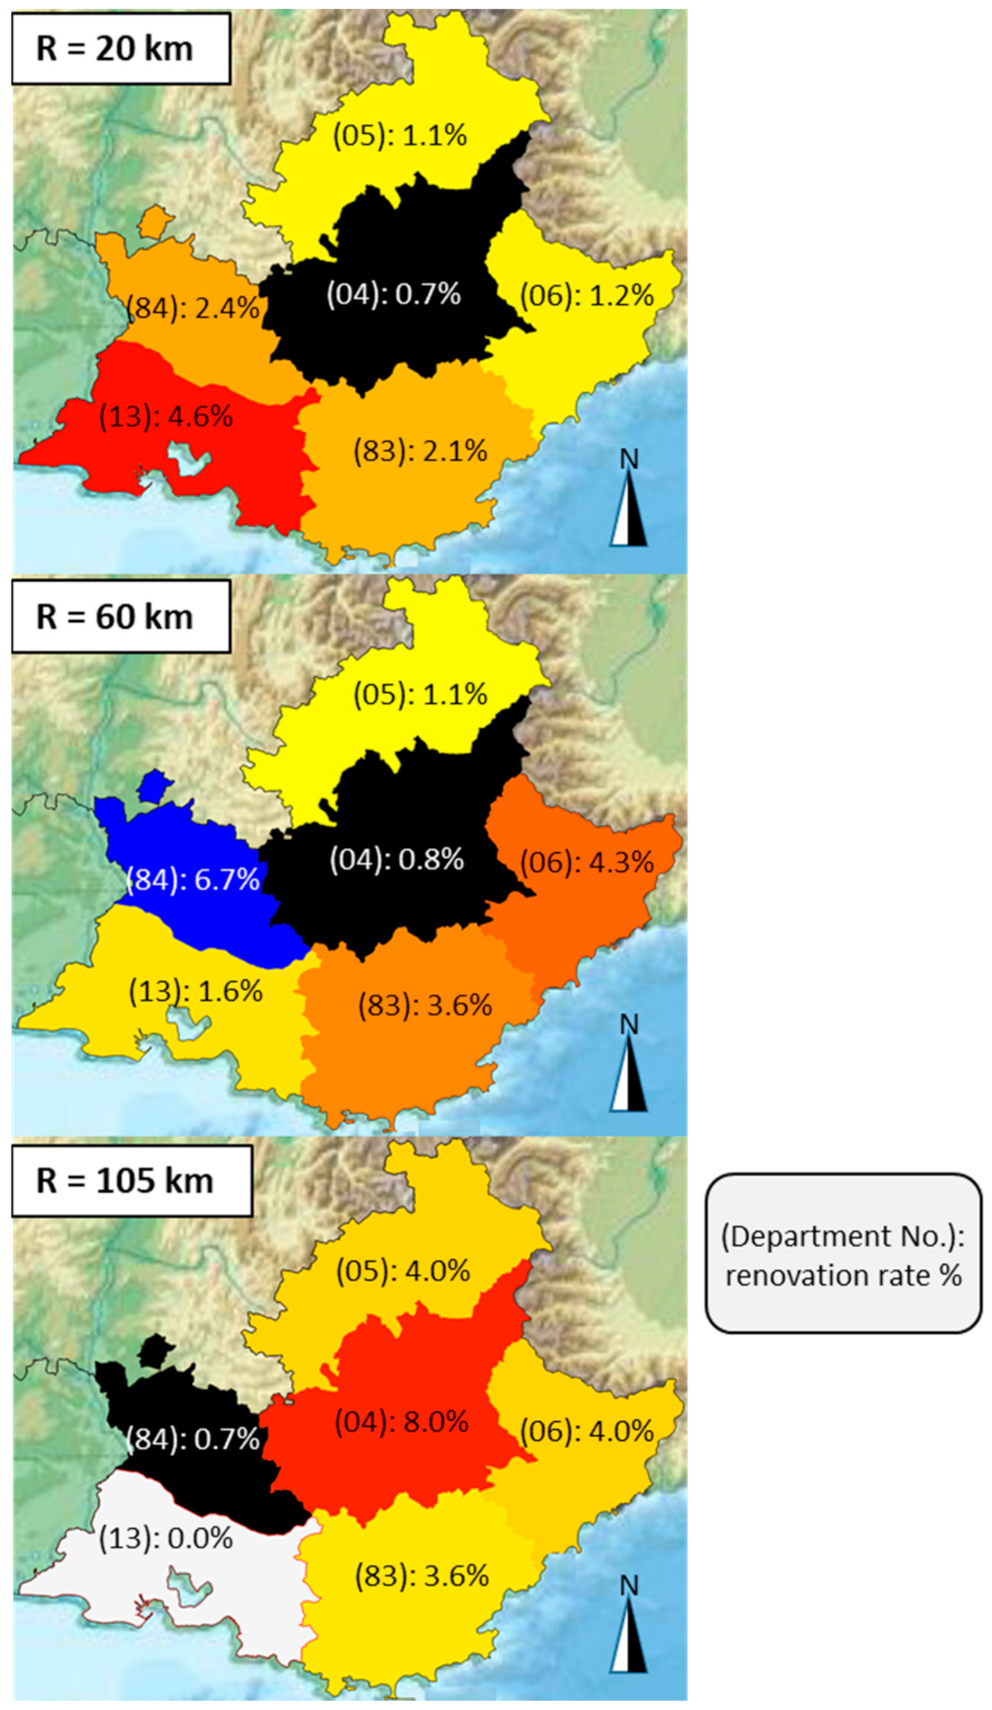
  • Varying the search radius between 0 and 170 km in 5 km steps. In France, materials will not generally be transported more than 170 km [18].
  • For the production rate of sites that did not respond to the survey, entering first 100% (the default scenario: maximum production), then 70%. The 70% in the figure does not correspond to any field need. It is purely hypothetical and used to test the model’s sensitivity if the production were 30% less than the default value of 100% obtained via POM.

3. Results

The effects of the inputs on production differences are shown in Figure 5. For visual simplification, the upper limit of the search radius (x-axis) in the Figure is 110 km instead of the 170 km noted in the experiment plan, as the y-axis value approaches and remains at zero.
The decrease in the curves (Figure 5) followed by stagnation shows a local market concentration within a radius of about 20–60 km, which corresponds to reality on the ground [18], even though mathematically, these radii do not correspond to the balance at a global (i.e., regional) level (there is still a 5–30% difference). The mathematical balance lies around 105 km. Its existence corresponds less to reality on the ground. However, it does show a scientific advance in the resolution of connections in a complex market (microscale), where stakeholders are involved in the exchange and reuse of waste.
Figure 6 gives the distribution hypotheses for the renovation rate by a municipality for the respective search radius scenarios of 20, 60, and 105 km. For legibility reasons as there are 968 municipalities (Figure 1), the values are shown in colour as follows:
  • below 0.01% → white
  • 0.01% → light grey
  • 25% → black
  • between 0.01% and 25 % → gradual variation between light grey and black
  • above 25% → blue
Figure 6. Distribution hypotheses for the renovation rate of each municipality as a function of the simultaneous search radius for gravel and asphalt suppliers. Source: this work.
Modelling 02 00021 g006
The colours are generally assigned according to the statistical distribution of the data to be displayed. The values below the minimum or above the maximum are often statistically isolated.
In Figure 6, if one looks at the areas numbered 1 to 4 and how they move when the search radius is increased, one sees that the renovation work in the northeast area intensifies to the detriment of the southwest area. The explanation for this is scientific: the algorithm developed in this paper favours, for now, the municipalities that placed orders first and will immediately look farther away if they do not find what they need nearby. This occurs to the detriment of orders that have not yet been processed and therefore may find their nearest site out of stock because of earlier orders (see Section 2.4.2 Interaction Sequences). Yet, data supplier IGN [17] physically stored the data for municipalities in PACA according to the order of the administrative codes for the municipalities, i.e. from the Northeast (Department 04, then 05, etc.) to the Southwest. This storage mechanism influenced results illustrated in Figure 6. This situation can be seen as the current limit of the proposed algorithm (first-in, first-out type). Nonetheless, the effects of this limit are low for a low search radius.
One also sees from Figure 6 that the recycling platforms and asphalt plants that are close together create a sort of “renovation effect” for neighbouring municipalities, in contrast to the platforms or plants that are isolated. Sometimes the calculation goes as far as estimating municipalities that renovate 25% of their roads or more, which seems an unrealistically high rate. This corresponds to situations where a municipality monopolises production from an asphalt-plant–gravel-platform pair. The greater the radius of influence, the greater this effect. If transport is no longer a constraint on this scale, the first region to order is the first-served, and it can be greedy. If the hypothesis is used that in reality, the entire territory conducts roadwork on some of its roads every year, these results show that the radii of plants’ influence are actually variable from territory to territory. The results further show that the primary resources provide support where secondary deposits are low or non-existent and, as described previously, the amount of work undertaken depends on other factors—in particular, the project manager’s roads budget—that have not yet been considered in this work (Section 2.1).
Finally, Figure 7 gives a distribution hypothesis for the renovation rate at the department scale after averaging the results of municipalities; a hypothesis using the same scenarios and explanations as those in Figure 6.
In Figure 7, the results for 20 km make clear that departments with the best supplies in platforms and plants (13, 83, and 84) do more work. As for the results for 105 km, this scenario did not correspond to any reality but was interesting as a mathematical exercise of searching for market balance in a complex system. In reality, a municipality will sometimes consume nearby natural material instead of looking for recycled material as far as 105 km away (natural/recycled mechanism to be integrated into future work).
Unfortunately, the results in the maps cannot at this time be contrasted with actual data of road renovation by departments because this data does not exist. In other words, the POM’s fit adopted by our model only currently applies between the microscale and the region directly.

4. Discussion

4.1. Contribution/Limitation of the Work Regarding Waste Flow Modelling in PACA

In our work, we show that adding the complexity paradigm analysis (in addition to the workshop results analysis) would be more conducive to waste management in PACA. Our model (Paradigm 2, bottom-up, according to Figure 4) aims to progress towards that complexity addition. We agree that, at this stage, it does not bring this about in the whole value chain of the waste circuit (refer to the work boundaries in Figure 2). Nonetheless, the first step in our modelling cycle (Figure 3) has allowed us to put the first basis complex algorithms (material market establishment at different levels, GIS data management, big transport data management, etc.) necessary for the next step. The latter consists of implementing the ISDIs (at site level), quarries (at site level), and demolition location (at municipality level) parameters. The more the demolition locations are modelled accurately (considered on a case-by-case basis), the more wastes circulating from one node to another along the waste value-chain would be traceable, especially in a heterogeneous territory like PACA. By ”traceable”, we do not mean that all wastes could be physically followed in reality. Instead, we mean that uncertainties in mathematical modelling of the waste flow are more reduced.
Obviously, like gravel and asphalt elements in this first cycle, all these (new) elements will next be implemented at a departmental level as well because end-users prefer to carry out their analysis at that more aggregated level.

4.2. Regarding the Acceptance of Complexity

A model is only valid if it has been validated/accepted subjectively by the parties: statistical fitness does not suffice [45,46]. As a corollary, a model that is not grounded in reality can be valid for and accepted by users.
Regarding our case, when our model was presented to the PACA stakeholders, the bottom-up aspect interested them (flexible feedback). Nevertheless, the PACA stakeholders, mostly experts (therefore paradigm 1), decided it is too early to appropriate our model. The complex model seems to be premature as it does not integrate all of the complexity of the supply chain. Passing from Paradigm 1 to 2, then, requires raising more awareness. Furthermore, there is the problem of validation of the model, which has beset agent-based modellers and users for many years [47]. Although, according to us, this can be also seen as a critique of circumstance as there are also models of Paradigm 1, such as the dynamic stochastic general equilibrium or DSGE adopted for example by Fagiolo and Roventini [48], that are not always correctly validated but are nevertheless accepted. Computer performance is also a parameter for rejection of appropriation (the PACA ACE model takes 20 seconds to load and 8 seconds to run one step). This calculation cost has already been revealed by Rahmandad and Sterman [49] as one of the negatives of ACE.
Despite these negative aspects, the means of progressive acceptance of complexity exist. One approach would be instilling in user-deciders the decorrelation that exists between “calculation scale” (complex, such as the municipality scale) and “feedback scale” (simple, such as the regional scale). Indeed, since municipalities are the finest scale of French administrative branches, the entire calculation can be first made at this level. Next, the model presents the results back to users in a flexible way, according to each decider’s scale of interest: municipalities, departments, regions, or any other specific group that comes from aggregations of municipalities. This decorrelation was requested, for example, by the policy-maker Hamill [50]. Regarding the negatives of ACE, (i) gradual advances in artificial intelligence (ACE is a branch of AI) in our daily life [51] combined with (ii) increasing computer power over time and (iii) the strengthening of the ODD + D protocol (also used in this paper) as a standard mode for writing agent models in different thematic areas [52,53] could be events that will eventually decrease these. More generally, and beyond the PACA case, the following non-exhaustive recommendations could be adopted:
  • Continuing communication in regard to the interest in the approach to the BTP sector, but supporting its usefulness with arguments uniquely when this proves to be necessary.
  • Reinforcing the coupling of ACE with the conventional approach, instead of model development in a purely agent framework. This would enable the sector to be more easily convinced that the ACE approach is complementary and not competitive [49]. This would increase the chances of it interesting them.
  • When the application so requires, systematic use of maps of geological and/or urban mine extraction areas of these resources (if they are available) during simulations. In fact, in the geosciences field, maps constitute one of the most important decision aids [54,55]. It is thus incumbent on ACE simulation, for better acceptance of its usefulness, to justify its added value in enriching the thematic content of maps (and not the opposite).
  • Systematic communication of the machine time of the simulations carried out, to enable entities not specialised in ACE to understand the real performance of this type of method and to correct preconceived ideas (e.g.,: a simulation which could last a week, etc.).
Let us also note that, though the PACA stakeholders are not yet motivated to use the simulation model, they have been inclined to use another form of complexity: a role-playing game (another possible way to move from Paradigm 2 to 3 in Figure 4) on a perimeter of the department Hautes-Alpes (05 in Figure 1). This could be an entry point to acceptance of ACE because ACE and a role-playing game can be designed from the same conceptual model [56].

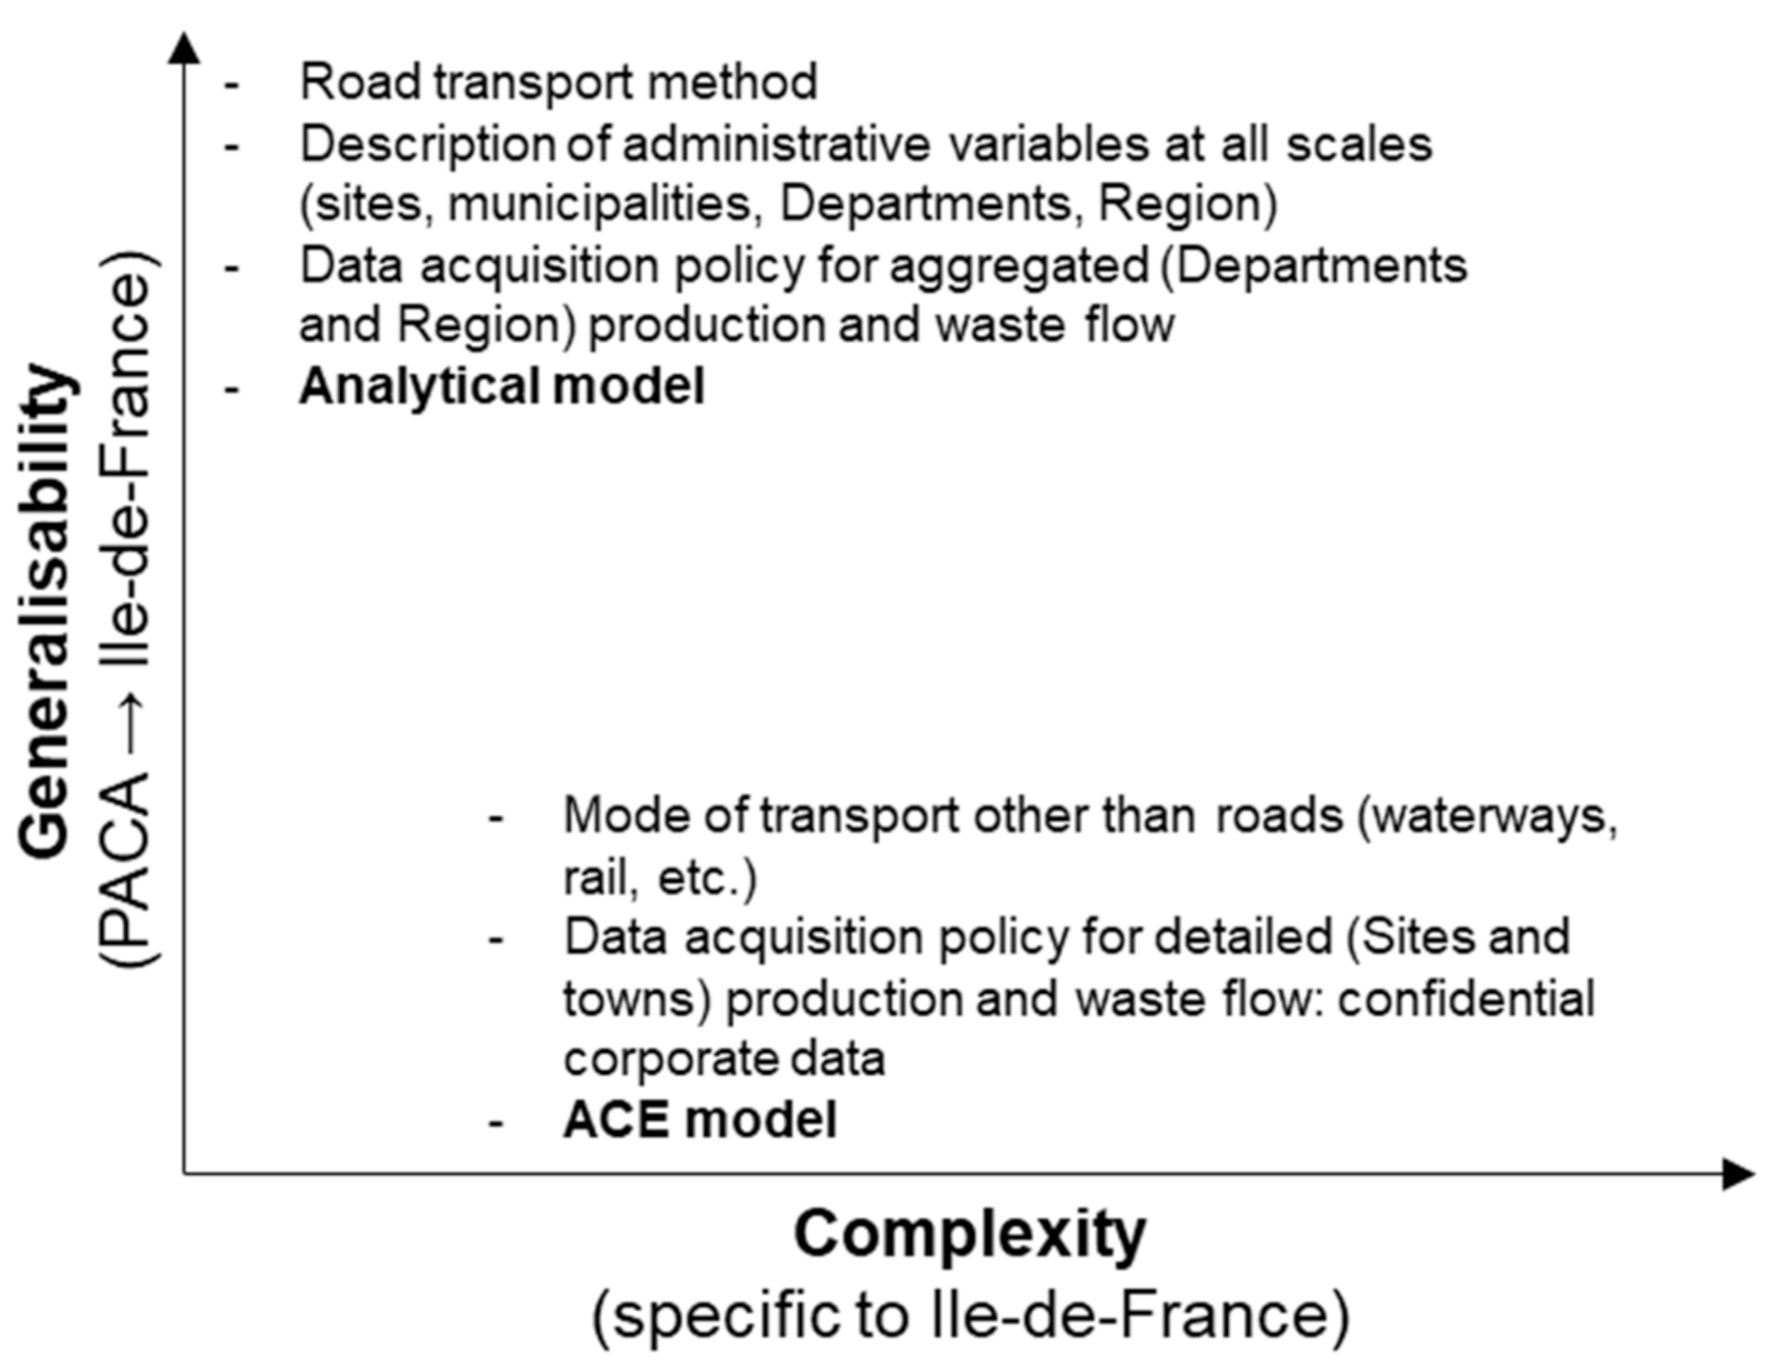
4.3. How Can the PACA Region Results Be Transposed to Ile-de-France

As stated by Fromm [6], or Rahmandad and Sterman [49], or Rand and Rust [57], complex models are more difficult to generalise than analytical models. To build the Ile-de-France model, Figure 8 shows that there is a list of parameters that can be transposed from the PACA study and others that cannot be since they are specific to Ile-de-France. This is not an exhaustive list.
So transposition to other regions depends on many factors. To make it possible, different works [45,49] have suggested finding a compromise between complexity and generalization as soon as possible.

5. Conclusions

This paper tackled complexity in terms of how a regional prevention and management plan for waste (PRPGD) is developed in PACA, and, scientifically, how we connect paradigms related to complexity (Figure 4). More particularly, inside an ongoing iterative and incremental modelling cycle of complexity (Figure 3), the first goal of the current exercise (which corresponds to the first iteration of the cycle) was to determine whether, at a complex level (micro) in PACA, (a) a search radius existed mathematically for materials suppliers (gravel and asphalt) from which all stocks produced would be sold (mathematical market balance) and that (b) multi-scale connection and coherency is possible. This step was taken from a set of hypotheses (Figure 5). In any case, the results show that for a circular economy to develop, the network of facilities in a territory is very important. Additionally, effective commercialisation of secondary resources is significant in the areas that group together recycling platforms and asphalt plants nearby.
After carrying out this modelling exercise, we have learned two things at a methodological level: (a) information regarding the interest of coupling ACE and POM and (b) information regarding the future position of the BTP sector vis-à-vis the approach adopted.
Regarding (a), we think that in any multi-level modelling, POM can be seen as an essential approach to accompany the ACE approach. Indeed, if the positive image given to the ACE is that it can easily represent the complexity of interactions between agents, a looping at a macroeconomic level (here macro = regional) of a model designed at a micro-scale (more heterogeneous) would increase confidence in this type of model, especially in terms of public policy evaluation. This looping ensures that all flows come from somewhere and go somewhere, and thus avoids a lack of holes in the detailed model. In our context, the use of POM “forces” us to check that at a microscale, all supplied materials found receivers (existence of an equilibrium state). Indeed, if a recycling platform has been set up somewhere, it is because corresponding demands exist, even if they may be geographically distant. POM is therefore a mechanism for verifying the overall logical coherence of a model that, as stipulated by the team of Caiani [58], any macroeconomic model should have as a property. Furthermore, because Paradigm 1 generally acts at a global level, POM can be also viewed as a bridge between Paradigm 2 and Paradigm 1.
Regarding (b), we think, however, that convincing the BTP sector to integrate the ACE/POM dual as a full part of a methodological support for regional prevention and management of a CDW remains a challenge. The workshop conducted in PACA was a participatory approach (Paradigm 3), but at a modelling level, the accepted modelling approach remains the initial one used by the experts from the workshop (Paradigm 1). In summary, Paradigm 2 was discarded. Section 4.2 gives possible reasons for this and gives means to move the BTP sector in general and the PACA CDW managers in particular towards progressive acceptance of complexity in the medium term.

Perspectives

Future work will concern the second and following modelling cycles. In the short term, we will improve the limits of the interaction algorithm we proposed to give an even more realistic radius (i.e., distributed in a heterogeneous way as in reality) when looking for the closest material suppliers. We will also integrate separate decision-making rules for the departmental and regional levels. At this time, these are intended only for multiscale calibration. In the medium term, we will answer the question (Q2territorial foresight) of how the situation might change over time. The system cannot be operational for the current PRPGD plans (2020) but probably could be when the plan is reviewed in 6 years. Nevertheless, we think the approach merits further work to evaluate the complex character of a waste management plan, the need for which has already been explained.
Finally, another challenge we plan to address is the reinforcement of the environmental evaluation of our model. Indeed, recycling/valorising of CDW flows first aims to lower the environmental impacts of CD activities [20]. This reinforcement can be done by coupling ACE, representing decisions, with two approaches: LCA (Life-Cycle Analysis) [20], for evaluating environmental impacts of these decisions, and MFA (Material-Flow Analysis) [23], as representing flows (quantities, price, energy, etc.) generated by these decisions. To implement this, the coupling scheme ACE/LCA/MFA suggested by the team of Andriamasinoro [59] for the metal sector is an interesting reference. Moreover, since LCA and MFA are also well-known and frequently used approaches for Paradigm 1, this coupling would increase the chances of ACE being of interest to that paradigm.

Supplementary Materials

The following is available online at https://www.mdpi.com/article/10.3390/modelling2030021/s1: The full description of the model using the ODD + D protocol.

Author Contributions

All authors contributed to the conception and design of the study. In particular, material preparation, model design, and part of data collection were performed by F.A., a specialist in the Agent-based Computational Economics approach. Part of data collection, as well as model analysis, were performed by D.M.-C., a specialist in Waste Management. Both authors have read and agreed to the published version of the manuscript.

Funding

This work was funded by the French Research National Agency (ANR) through the AGREGA project [Grant number ANR-13-ECOT-0008].

Institutional Review Board Statement

Not applicable.

Informed Consent Statement

Not applicable.

Data Availability Statement

Data is available at Andriamasinoro, Fenintsoa (2021), “AGREGA-PACA project”, Mendeley Data, V2, http://dx.doi.org/10.17632/kntcs23h4z.2, last access on 1 June 2021

Acknowledgments

Thank you to everyone who has contributed to this work. In particular, we want to thank Barbara Cholley, of PACA, and all the colleagues who contributed in one way or another to supplying our “Waste Management at a Regional Scale” during the past 4 years: Céline Blanc, Stéphane Vaxelaire, Anne-Lise Gaultier, Audrey Hohmann, Kathy Bru, and Michèle Pascale.

Conflicts of Interest

The authors declare that they have no conflict of interest/competing interests to declare that are relevant to the content of this article. The funders had no role in the design of the study; in the collection, analyses, or interpretation of data; in the writing of the manuscript; or in the decision to publish the results.

References

  1. LOI n° 2015-991 du 7 Août 2015 Related to the Reorganization of French Republic territories. Available online: https://www.legifrance.gouv.fr/eli/loi/2015/8/7/2015-991/jo/texte (accessed on 1 December 2019). (In French).
  2. Décret n° 2016-811 du 17 Juin 2016 Related to the Regional Prevention and Management Plan for Waste. Available online: https://www.legifrance.gouv.fr/eli/decret/2016/6/17/2016-811/jo/texte (accessed on 1 December 2019). (In French).
  3. Conseil Régional Île-de-France. PREDEC: A Plan for Regional Prevention and Management of Construction and Demolition Waste Used in the Buildings and Public Works Sector; Conseil Régional Île-de-France: Paris, France, 2015. [Google Scholar]
  4. DREAL PACA. PRPGD: A Regional Prevention and Management Plan for Waste—PACA. 2017. Available online: http://www.paca.developpement-durable.gouv.fr/IMG/pdf/2_20170914_presentationdiag_prpgd.pdf (accessed on 1 December 2019). (In French).
  5. Conseil Régional Nouvelle Aquitaine. A Regional Plan to Optimise Waste Management in Nouvelle Aquitaine. 2019. Available online: Available online: https://fr.calameo.com/read/00600927104716d822372?page=1 (accessed on 1 December 2019). (In French).
  6. Fromm, J. The Emergence of Complexity; Kassel University Press: Kassel, Germany, 2004; p. 200. [Google Scholar]
  7. Andriamasinoro, F.; Danino-Perraud, R. Use of artificial intelligence to assess mineral substance criticality in the French market: The example of cobalt. Miner. Econ. 2019, 1–19. [Google Scholar] [CrossRef]
  8. Augiseau, V. The material dimension of urbanisation: Construction materials flows and stock in the Île-de-France region. Ph.D. Thesis, Université Paris 1 Panthéon-Sorbonne, Paris, France, 2017. [Google Scholar]
  9. Ponte, S.; Sturgeon, T. Explaining governance in global value chains: A modular theory-building effort. Rev. Int. Political Econ. 2014, 21, 195–223. [Google Scholar] [CrossRef] [Green Version]
  10. Douguet, J.M.; Morlat, C.; Lanceleur, P.; Andriamasinoro, F. Subjective evaluation of aggregate supply scenarios in the Ile-de-France region with a view to a circular economy: The ANR AGREGA research project. Int. J. Sustain. Dev. 2019, 22, 123–157. [Google Scholar] [CrossRef]
  11. Göswein, V.; Gonçalves, A.B.; Silvestre, J.D.; Freire, F.; Habert, G.; Kurda, R. Transportation matters—Does it? GIS-based comparative environmental assessment of concrete mixes with cement, fly ash, natural and recycled aggregates. Resour. Conserv. Recycl. 2018, 137, 1–10. [Google Scholar] [CrossRef]
  12. Praticò, F.G.; Vaiana, R.; Giunta, M.; Iuele, T.; Moro, A. Recycling PEMs back to TLPAs: Is that Possible Notwithstanding RAP Variability? Appl. Mech. Mater. 2012, 253–255, 376–384. Available online: https://doi.org/10.4028/www.scientific.net/amm.253-255.376 (accessed on 1 December 2019). [CrossRef]
  13. Railsback, S.F.; Grimm, V. Agent-Based and Individual-Based Modeling: A Practical Introduction, 2nd ed.; Princeton University Press: Princeton, NJ, USA, 2019; p. 360. [Google Scholar]
  14. DREAL PACA. Workshop Related to the Evaluation of Material Needs And Prospective. Available online: http://www.paca.developpement-durable.gouv.fr/IMG/pdf/20170519_src_introatelierbesoins_dreal.pdf (accessed on 1 December 2019). (In French).
  15. DREAL PACA, Workshop of September 14, 2017— Waste Management and Secondary Resources. Available online: http://www.paca.developpement-durable.gouv.fr/atelier-du-14-septembre-2017-dechets-du-btp-et-a11422.html (accessed on 1 December 2019).
  16. Région PACA. Sustainable Public Works. Available online: https://www.frtppaca.fr/sites/paca/files/content/page/tp_durables_v2_paca_v12_0.pdf (accessed on 1 January 2020). (In French).
  17. IGN Carto Admin. Admin Express. Available online: http://professionnels.ign.fr/adminexpress (accessed on 1 December 2019).
  18. Rodriguez-Chavez, M.-L. Anticipation of the Access to the Aggregate Resource by Breaking Present Schemes in the Long Term. Ph.D. Thesis, MINES ParisTech, Paris, France, 2010. [Google Scholar]
  19. Le Turdu, V. From a database to a tool for a rational use of mineral resources. Available online: https://www.cerema.fr/system/files/documents/2017/12/20171128_CoTITA%20Rennes%20GeReMi-PL%20Cerema%20Ouest%20V%20LE%20TURDU.pdf, Rennes GeReMi-PL Cerema Ouest (accessed on 1 January 2020). (In French).
  20. Fevre-Gautier, A.-L.; Beylot, A.; Boutin, M.; Michel, P.; Rouvreau, L.; Vaxelaire, S.; Villeneuve, J. Construction And Demolition Waste: A Systemic Analysis To Improve Recycling. In Proceedings of the 4th International Conference on Engineering for Waste and Biomass Valorisation, Porto, Portugal, 10–13 September 2012. [Google Scholar]
  21. Fraj, A.B.; Idir, R. Concrete based on recycled aggregates—Recycling and environmental analysis: A case study of Paris’ region. Constr. Build. Mater. 2017, 157, 952–964. [Google Scholar] [CrossRef]
  22. Augiseau, V.; Eunhye, K. Spatial characterization of construction material stocks: The case of the Paris region. Resour. Conserv. Recycl. 2021, 170. [Google Scholar] [CrossRef]
  23. Augiseau, V.; Barles, S. Studying construction materials flows and stock: A review. Resour. Conserv. Recycl. 2017, 123, 153–164. [Google Scholar] [CrossRef]
  24. Ioannidou, D.; Nikias, V.; Brière, R.; Zerbi, S.; Habert, G. Land-cover-based indicator to assess the accessibility of resources used in the construction sector. Resour. Conserv. Recycl. 2015, 94, 80–91. [Google Scholar] [CrossRef]
  25. Hernáez, O.; Destatte, P.; Arlé-Roëls, C.; Van Cutsem, M.; Zugasti, I. An Initial Assessment of Territorial Forward Planning/Foresight Projects in the European Union; European Union/Committies of the Regions: Brussels, Belgium, 2011. [Google Scholar]
  26. Schleifer, J.; Tessier, B.; Thenevin, I.; Deneuve, C.; Mallens, C.; Goethals, L. The AGREGA project: Towards a pedagogical and playful tool to simulate aggregates resources market in the Île-de-France region. Ann. Des Mines Responsab. Et Environ. 2019, 4, 107–119. (In French) [Google Scholar]
  27. Gomez, J. Stochastic global optimization algorithms: A systematic formal approach. Inf. Sci. 2019, 472, 53–76. [Google Scholar] [CrossRef] [Green Version]
  28. Tesfatsion, L. Agent-based computational economics: A constructive approach to economic theory. In Handbook of Computational Economics; Tesfatsion, L., Judd, K., Eds.; Elsevier: Amsterdam, The Netherlands, 2006; Chapter 16; Volume 2, pp. 831–880. [Google Scholar]
  29. Nardone, C. Agent-Based Computational Economics and Industrial Organization Theory. In Information and Communication Technologies (ICT) in Economic Modeling; Springer: Berlin/Heidelberg, Germany, 2019; Chapter 1; pp. 3–14. [Google Scholar] [CrossRef]
  30. Knoeri, C.; Wäger, P.A.; Stamp, A.; Althaus, H.J.; Weil, M. Towards a dynamic assessment of raw materials criticality: Linking agent-based demand with material flow supply modelling approaches. Sci. Total. Environ. 2013, 461, 808–812. [Google Scholar] [CrossRef]
  31. Riddle, M.E.; Tatara, E.; Olson, C.; Smith, B.J.; Irion, A.B.; Harker, B.; Pineault, D.; Alonso, E.; Graziano, D.J. Agent-based modeling of supply disruptions in the global rare earths market. Resour. Conserv. Recycl. 2021, 164, 105193. [Google Scholar] [CrossRef]
  32. Yuan, Y.; Yellishetty, M.; Muñoz, M.A.; Northey, S.A. Toward a dynamic evaluation of mineral criticality: Introducing the framework of criticality systems. Ind. Ecol. 2019, 1–14. [Google Scholar] [CrossRef]
  33. Grimm, V.; Railsback, S.F. Pattern-oriented modelling: A ‘multi-scope’ for predictive systems ecology. Philos. Trans. 2012, 367, 298–310. [Google Scholar] [CrossRef] [Green Version]
  34. Rossignol, J.-Y. Complexity: Essentials for Students and Practitioners Use, 1st ed.; EDP Sciences-Collection: Paris, France, 2018; p. 262. (In French) [Google Scholar]
  35. Arthur, W.B.; Durlauf, S.; Lane, D. Introduction: Process and Emergence in the Economy. In The Economy as an Evolving Complex System II; Arthur, W.B., Durlauf, S., Lane, D., Eds.; Westview Press: Nashville, TN, USA; Santa Fe Institute Series: Santa Fe, NM, USA, 1997; Chapter 1; pp. 1–11. [Google Scholar]
  36. Sherwood, J.; Ditta, A.; Haney, B.; Haarsma, L.; Carbajales Dale, M. Resource Criticality in Modern Economies: Agent-Based Model Demonstrates Vulnerabilities from Technological Interdependence. Biophys. Econ. Resour. Qual. 2017, 2, 1–22. [Google Scholar] [CrossRef] [Green Version]
  37. Frame, B.; O’Connor, M. Integrating valuation and deliberation: The purposes of sustainability assessment. Environ. Sci. Policy 2011, 14, 1–10. [Google Scholar] [CrossRef]
  38. Andriamasinoro, F.; Hohmann, A.; Douguet, J.M.; Angel, J.M. Serious games as a social learning tool in formalizing the artisanal and small-scale mining sector in African territories. Extr. Ind. Soc. 2020, 7, 1108–1120. [Google Scholar] [CrossRef]
  39. Le Port, J.P. Management: The ANR AGREGA project simulates the stakes. Mines et Carrières 2017, 245, 40–42. (In French) [Google Scholar]
  40. Grimm, V.; Berger, U.; DeAngelis, D.L.; Polhill, J.G.; Giske, J.; Railsback, S.F. The ODD protocol: A review and first update. Ecol. Model. 2010, 221, 2760–2768. [Google Scholar] [CrossRef] [Green Version]
  41. Müller, B.; Bohn, F.; Dreßler, G.; Groeneveld, J.; Klassert, C.; Martin, R.; Schlüter, M.; Schulze, J.; Weise, H.; Schwarz, N. Describing human decisions in agent-based models—ODD + D, an extension of the ODD protocol. Environ. Model. Softw. 2013, 48, 37–48. [Google Scholar] [CrossRef]
  42. DREAL Provence-Alpes-Côte d’Azur. Available online: http://www.paca.developpement-durable.gouv.fr/ (accessed on 1 December 2019).
  43. IGN Carto Route 120. ROUTE 120®. Available online: http://professionnels.ign.fr/route120 (accessed on 1 December 2019).
  44. Andriamasinoro, F.; Cassard, D.; Martel-Jantin, B. ISATEM: An Integration of Socioeconomic and Spatial Models for Mineral Resources Exploitation. In Computational Science and Its Applications—ICCSA 2010, Part I, LNCS 6016; Taniar, D., Gervasi, O., Murgante, B., Pardede, E., Apduhan, B.O., Eds.; Springer: Berlin/Heidelberg, Germany, 2010; pp. 476–490. [Google Scholar] [CrossRef] [Green Version]
  45. Janssen, M.A.; Ostrom, E. Empirically Based, Agent-based models. Ecol. Soc. 2006, 11, 37. Available online: http://www.ecologyandsociety.org/vol11/iss2/art37/ (accessed on 1 December 2019). [CrossRef] [Green Version]
  46. Augusiak, J.; Van den Brink, P.J.; Grimm, V. Merging validation and evaluation of ecological models to ’evaludation’: A review of terminology and a practical approach. Ecol. Model. 2014, 280, 117–128. [Google Scholar] [CrossRef]
  47. An, L.; Grimm, V.; Turner, B.L., II. Editorial: Meeting Grand Challenges in Agent-Based Models. J. Artif. Soc. Soc. Simul. 2019, 23. [Google Scholar] [CrossRef]
  48. Fagiolo, G.; Roventini, A. Macroeconomic Policy in DSGE and Agent-Based Models. In Agent-Based Models and Economic Policy; OFCE University of Paris: Paris, France, 2012; Chapter 4; Volume 5, pp. 67–116. [Google Scholar] [CrossRef] [Green Version]
  49. Rahmandad, H.; Sterman, J. Heterogeneity and Network Structure in the Dynamics of Diffusion: Comparing Agent-Based and Differential Equation Models. Manag. Sci. 2008, 54, 998–1014. [Google Scholar] [CrossRef] [Green Version]
  50. Hamill, L. Agent-based modelling: The next 15 years. J. Artif. Soc. Soc. Simul. 2010, 13. [Google Scholar] [CrossRef]
  51. Bradley, R. 16 Examples of Artificial Intelligence (AI) in Your Everyday Life. Available online: https://themanifest.com/development/16-examples-artificial-intelligence-ai-your-everyday-life (accessed on 1 January 2021).
  52. Polhill, G. ODD Updated. J. Artif. Soc. Soc. Simul. 2010, 13. [Google Scholar] [CrossRef]
  53. Kremmydas, D.; Athanasiadis, I.N.; Rozakis, S. A review of Agent Based Modeling for agricultural policy evaluation. Agric. Syst. 2018, 164, 95–106. [Google Scholar] [CrossRef]
  54. Bouchot, V.; Kaboré, E.; Itard, Y.; Courtois, N.; Somé, S.; Sy, A.T.; Récoché, G. Burkina Faso, georesources and society: A North-South scientific project at the service of rational management of georesources in intertropical Africa. Vertigo la Rev. Électronique en Sci. de l’Environnement 2012. [Google Scholar] [CrossRef]
  55. Cassard, D.; Billa, M.; Lambert, A.; Picot, J.-C.; Husson, Y.; Lasserre, J.-L.; Delor, C. Gold predictivity mapping in French Guiana using an expert-guided data-driven approach based on a regional-scale GIS. Ore Geol. Rev. 2008, 34, 471–500. [Google Scholar] [CrossRef]
  56. Le Page, C.; Bazile, D.; Becu, N.; Bommel, P.; Bousquet, F.; Etienne, M.; Mathevet, R.; Souchère, V.; Trébuil, G.; Weber, J. Agent-Based Modelling and Simulation Applied to Environmental Management. In Simulating Social Complexity; Edmonds, B., Meyer, R., Eds.; Springer: Berlin/Heidelberg, Germany, 2013; Chapter 19; pp. 499–540. [Google Scholar] [CrossRef]
  57. Rand, W.; Rust, R.T. Agent-Based Modeling in Marketing: Guidelines for Rigor. Int. J. Res. Mark. 2011, 28, 181–193. [Google Scholar] [CrossRef]
  58. Caiani, A.; Godin, A.; Caverzasi, E.; Gallegati, M.; Kinsella, S.; Stiglitz, J.E. Agent based-stock flow consistent macroeconomics: Towards a benchmark model. Econ. Dyn. Control. 2016, 69, 375–408. [Google Scholar] [CrossRef] [Green Version]
  59. Andriamasinoro, F.; Boubault, A.; Beylot, A.; Muller, S. A Dynamic and Endogenous Coupling of Environment and Economy as a Future Approach to Assessing Raw Material Criticality. Int. J. Environ. Sci. Nat. Resour. 2021, 27, 556212. [Google Scholar]
Figure 1. PACA region presented, with, in the form of a triangle, the 2015 locations of inert waste management sites (recycling platforms); in the form of a circle, asphalt plants; in the form of a polygon, the administration (Region, Department, Municipality); in the form of colours (from white to brown), population distribution per municipality.
Modelling 02 00021 g001
Figure 2. Boundaries of the work: focus on gravel and asphalt flows, used for road renovation applied to the PACA region. Source: [10] and this work.
Modelling 02 00021 g002
Figure 3. The development of a complex system should be cyclic and iterative, by starting with the simplest model possible. This paper presents the results of the first cycle. Source: [13].
Modelling 02 00021 g003
Figure 5. Sensitivity analysis and validation: effect of variation of the search radius and the production rate of sites that did not respond to the 2015 survey, on the difference between actual global production (2015) and simulated production of materials. Source: this work.
Modelling 02 00021 g005
Figure 7. Distribution hypotheses for the renovation rate of each Department as a function of the simultaneous search radius for gravel and asphalt suppliers. Source: this work.
Modelling 02 00021 g007
Figure 8. The compromise between generalization and complexity in constructing the Ile-de-France region model from the data that can be transposed from the PACA region model. Source: The initial diagram (in bold) is adapted from [57].
Modelling 02 00021 g008
Table 1. Global gravel and asphalt production estimated from 2015 in the PACA region.
Material ProductionValue (Mt)
Gravel production1,393,579
Asphalt production2,508,694
Source: [14,15,16].
Table 2. A fictive example showing the difference (in %) between data and calculated values of a road length in two different municipalities (M1 and M2) when using the normalisation approach.
ColumnABCDE
Municipality (M)Road total length (km)Length to renovate (km)Renovation rate (%)
based on data (=B/A * 100)
Length to renovate (km) after normalization (=A * 3.7%)Difference (%) between length from data and calculated values (=B/D * 100)
DataCalculus
M1152.516.60.55452
M21202.52.14.4456
Zone M1 + M213553.7
Source: this work.
Table 3. List of decision-making entities and their respective goals.
Subject (Agent)Decision ScalesObjectivesObject or Subject of the Decision
Recycler (waste consumer)SitesTransform the maximum amount of waste into “gravel” materials (stored and intended for sale)Waste
MunicipalitiesSell maximum amount of gravelStored gravel
Asphalt producer (waste consumer)MunicipalitiesSell maximum amount of asphaltStored asphalt
Project manager (PM)MunicipalitiesConduct roadwork (here road renovation)French Roads of different types:
-
freeway
-
“Departmentale” (roads managed at a departmental level only)
-
“nationale,” (roads managed at a national scale only)
-
“municipale”) (roads managed at a municipality scale only)
SitesIdentify the appropriate quantity of materials for renovationGravel and asphalt
Minimise the cost of transport from the supplierRecycler and asphalt producer
Source: this work.
Table 4. Partial view of the matrix of distances between municipalities in Department 04 (this is the end of the list for Braux and the start of the list for Montclar). For each municipality, the list of distances is sorted in increasing order. This table for Department 04 contains about 190,000 entries.
From Municipality Capital…To Municipality CapitalMinimum Distance (in km)
(…)(…)(…)
Braux (04032)Lamotte-Du-Rhone (84063)229.47
Braux (04032)Lapalud (84064)231.75
Braux (04032)Saintes-Maries-De-The-Mer (13096)246.80
Montclar (04126)Selonnet (04203)3.93
Montclar (04126)Seyne (04205)7.74
Montclar (04126)Saint-Vincent-Les-Forts (04198)7.96
Montclar (04126)Saint-Martin-Les-Seyne (04191)8.55
Montclar (04126)Le Lauzet-Ubaye (04102)13.57
Montclar (04126)La Breole (04033)14.96
Montclar (04126)Le Vernet (04237)18.07
Montclar (04126)Rousset (05127)20.66
Montclar (04126)Espinasses (05050)21.35
Montclar (04126)Meolans-Revel (04161)21.66
Montclar (04126)Le Sauze-Du-Lac (05163)21.79
Montclar (04126)Verdaches (04235)21.92
Montclar (04126)Auzet (04017)23.92
Montclar (04126)Theus (05171)24.90
Montclar (04126)Remollon (05115)26.18
(…)(…)(…)
Source: this work.
Publisher’s Note: MDPI stays neutral with regard to jurisdictional claims in published maps and institutional affiliations.

