Article

A Statistical Examination of Distinct Characteristics Influencing the Performance of Vector-Borne Epidemiological Agent-Based Simulation Models

by
Anna Paula Galvão Scheidegger
1,*,
Henrique dos Santos Maxir
2 and
Amarnath Banerjee
1
1
Industrial and Systems Engineering, Texas A&M University, College Station, TX 77843, USA
2
Departamento de Economia, Administração e Sociologia, Escola Superior de Agricultura “Luiz de Queiroz” da Universidade de São Paulo, Piracicaba-SP 13418-900, Brazil
*
Author to whom correspondence should be addressed.
Modelling 2021, 2(2), 166-196; https://doi.org/10.3390/modelling2020009
Submission received: 25 January 2021 / Revised: 9 March 2021 / Accepted: 19 March 2021 / Published: 24 March 2021
(This article belongs to the Special Issue Agent-Based Modelling)

Abstract

:
The spread of infectious diseases is a complex system in which pathogens, humans, the environment, and sometimes vectors interact. Mathematical and simulation modelling is a suitable approach to investigate the dynamics of such complex systems. The 2019 novel coronavirus (COVID-19) pandemic reinforced the importance of agent-based simulation models to quickly and accurately provide information about the disease spread that would be otherwise hard or risky to obtain, and how this information can be used to support infectious disease control decisions. Due to the trade-offs between complexity, time, and accuracy, many assumptions are frequently made in epidemiological models. With respect to vector-borne diseases, these assumptions lead to epidemiological models that are usually bounded to single-strain and single-vector scenarios, where human behavior is modeled in a simplistic manner or ignored, and where data quality is usually not evaluated. In order to leverage these models from theoretical tools to decision-making support tools, it is important to understand how information quality, human behavior, multi-vector, and multi-strain affect the results. For this, an agent-based simulation model with different parameter values and different scenarios was considered. Its results were compared with the results of a traditional compartmental model with respect to three outputs: total number of infected individuals, duration of the epidemic, and number of epidemic waves. Paired t-test showed that, in most cases, data quality, human behavior, multi-vector, and multi-strain were characteristics that lead to statistically different results, while the computational costs to consider them were not high. Therefore, these characteristics should be investigated in more detail and be accounted for in epidemiological models in order to obtain more reliable results that can assist the decision-making process during epidemics.

1. Introduction

Infectious disease outbreaks are among the largest and oldest challenges faced by humanity. Although the theme is old, characteristics of the current globalized world, such as interconnectivity and frequent movement of people, allow infectious diseases to spread further and more quickly nowadays. Moreover, due to cross-species transmission, there is also an increased risk for novel diseases to emerge.
Recently, the 2019 novel coronavirus (COVID-19) quickly spread around the globe, leading countries to activate emergency plans, travel restrictions, and quarantine [1]. Apart from the large number of cases and deaths, the outbreak led to anxiety, struggle in the health systems, and global economic slowdown as restrictions were imposed [2]. As highlighted by the World Health Organization [3], the year 2020 was the scenario we all had feared for decades, “a virus that spread quickly around the world”. This scenario shows the importance of studies to investigate infectious disease spread. Despite the acknowledged importance, investigating the problem and producing timely reliable information for an ongoing epidemic remains a challenge due to the involved complexities [4].
Infectious disease dynamics are affected by multiple socioeconomic, behavioral, environmental, and ecological factors. It is a complex system in which pathogens, humans, the environment, and sometimes vectors interact. According to the World Health Organization [5], the incidence and consequences of infectious diseases are not distributed randomly among the population. Level of education, income, gender, relationships with friends and family, culture, individual characteristics, behaviors, knowledge, and awareness play a key role in human health, especially with respect to infectious disease transmission [6,7,8,9,10,11,12,13,14,15,16,17].
The lack of empirical data and the inaccuracy or uncertainty of existent data are also major problems in studying the spread of infectious disease [4,6,7,18]. Conducting empirical studies to collect data can be expensive or difficult, if not impossible, due to the risks posed to the individuals. Moreover, information available at the early stages of an outbreak is usually uncertain and under- or over-estimated due to being collected on unrepresentative samples of the population [16].
Another challenge in studying infectious disease spread is that each epidemic alters the risk perceived by the population and triggers different behavioral responses in individuals, which, in turn, influence disease transmission [19]. According to the estimates of the World Health Organization [20], 50% of patients do not follow fully prescribed medical treatment, which extends the duration of treatment and increases drug resistance.
Many of the parameters that affect disease dynamics depend on the context and change rapidly over time or according to the geographic region, climate, type of disease, and various other factors [4]. An example of how the parameters change over time and different regions is the existence of multi-strain and multi-vector. In the past, it was common to have the circulation of only one strain of dengue virus and the existence of only one vector in endemic areas. Lately, the simultaneous circulation of all four dengue virus strains has become common and the adoption of innovative vector control population strategies, such as the release of Wolbachia-carrier mosquitoes and genetically modified mosquitoes, has introduced different disease vectors in endemic regions. The existence of different vectors and different strains of pathogens may have a substantial effect on the disease dynamics and, as such, it is another topic of investigation in this work.
Mathematical and simulation modelling is a suitable approach to investigate the dynamics of complex systems such as infectious disease spread [4]. With respect to vector-borne diseases, the majority of the studies include factors such as spatial/geographical parameters, human movements, temperature, and precipitation. More recently, human behavior has also been considered, but other factors such as multi-strain or new strategies to control the vector population have not been widely investigated. This means that vector-borne epidemiological models are usually bounded to single-strain and single-vector scenarios, where human behavior is modeled in a simplistic manner or ignored, and where data quality is usually not evaluated.
Considering the aforementioned background, investigating the possible impacts of data quality, human behavior, multi-strain, and multi-vector on the results of a vector-borne epidemiological model is, therefore, important. Researchers will be able to identify the relevant parameters and weigh the computational costs of including these parameters in the models. Within this context, the following research questions arise: (i) “What are the impacts of data quality on the results of an epidemiological model?”; (ii) “How can the spread of a vector-borne disease be affected by human behavior?”; (iii) “What are the epidemic impacts of simultaneous circulation of multiple virus strains in one region?”; (iv) “What are the epidemic impacts of different disease vectors cohabiting in one region?”; and (v) “What are the computational costs of considering human behavior, multi-strain, and multi-vector in epidemiological simulation models?”.
To provide a direction for these research questions, the present study aimed to develop an exploratory epidemiological simulation model to evaluate how the results of this model vary according to changes in the parameter values and to different scenarios including human behavior, multi-strain, and multi-vector. As a general goal, the study is expected to provide a better understanding of the importance of data quality, human behavior, multi-strain, and multi-vector in epidemiological simulation models. Such results can be used to guide the improvement of epidemiological simulation models in the future, increasing the value and accuracy of these models, and thus advancing these models from a theoretical tool to a health policy decision support tool.

2. Materials and Methods

The model developed in this work is based on several premises that made it simple, including the premise that the human population is homogeneous and closed. However, the goals of this study include modelling different virus strains, different vector populations, as well as human behavior. The agent-based simulation method allows for the representation of different populations, different rules, and different behaviors in an effective way and, therefore, is the method chosen in this work.
This work is based on infectious diseases transmitted by mosquitoes such as dengue fever, yellow fever, chikungunya, and Zika. These diseases have similar transmission dynamics when the mosquito bite is the means of transmission being considered. However, some of these diseases have other means of transmission such as vertical transmission from mother to fetus, transmission through sexual intercourse, and transmission through blood transfusion [21,22]. In this study, the mosquito bite is the only means of transmission considered because it is the primary means of transmission for all the aforementioned diseases. The Aedes aegypti mosquito is known to be the main vector of the aforementioned diseases and it is the vector species considered in this work.
Dengue fever is the disease chosen because besides being the mosquito-borne disease that infects more people in the Americas [23], it also presents some characteristics in comparison to yellow fever, chikungunya, and Zika, which makes it a more challenging disease to be modeled. Four virus strains cause dengue (DENV1, DENV2, DENV3, and DENV4). An individual that recovers from an infection is lifelong immune to that particular virus strain, but he/she is only partially and temporarily immune to other strains [24]. Meanwhile, for chikungunya, there is only one strain and immunity is lifelong following recovery. Moreover, in the case of dengue, subsequent infections by other dengue virus strains increase the risk of developing a severe case. The issue of severe cases gets worse because an individual may not even know he/she was infected in the past as the majority of dengue cases are asymptomatic [25].
Due to the similarities among various diseases transmitted by mosquitoes, the value of the parameters can be easily changed or new states can be added in the model to represent other mosquito-borne diseases more accurately.
AnyLogic (University version 8.2.3) was the simulation software chosen to build the simulation model. The simulation model involved 3 main agents: mosquito, human being, and the environment, which is the place where mosquitoes and humans live. Humans and mosquitoes are initiated in the model on the basis of their respective information on population size and initial number of infectious individuals.
To verify the simulation model, we ran it in the interactive mode with deterministic values and buttons added to test whether the states and parameters were being adequately represented. A test protocol was developed and followed during the verification, where each possible situation, that is, each possible state change, was tested in the model. For example, if the latent period in humans was 10 days, a human in the exposed compartment could not go into the infectious compartment within less or more than 10 days. Another example was the reduction of latent periods and the increase in the infectivity rates. Such a case should lead to a greater number of infected individuals more quickly. These cases and other similar situations were tested to verify that the model was accurately representing the disease dynamics.
The overview, design concepts, and details (ODD) protocol proposed by Grimm et al. [26] was used in this study to provide researchers with a rigorous structure and information that would allow them to systematically replicate the experiments in different contexts. The protocol is shown in Table 1.
Table 1. Overview, design concepts, and details protocol for the study.
OverviewPurposeThe model developed in this study, which represents a simplified abstraction of reality, was designed to investigate and highlight the importance of three different factors, namely, data quality, human behavior, and multi-strain, multi-vector, when developing epidemiological models. Rather than developing a detailed representation of an epidemic to predict the outcomes of future epidemics or to understand past epidemics, the goal was to call the attention of the academic community to the importance of investigating the aforementioned factors more in depth when developing epidemiological models.
State variables and scalesAgents: (i) humans, (ii) mosquitoes, and (iii) the environment.
In this simplified abstraction, individuals and mosquitoes were randomly distributed within the environment.
The epidemiological parameters, such as latent rate and recovery rate, were considered independent of age, gender, time, or any other parameters.
Detailed information about the parameters used in each model is provided in Section 2.1.
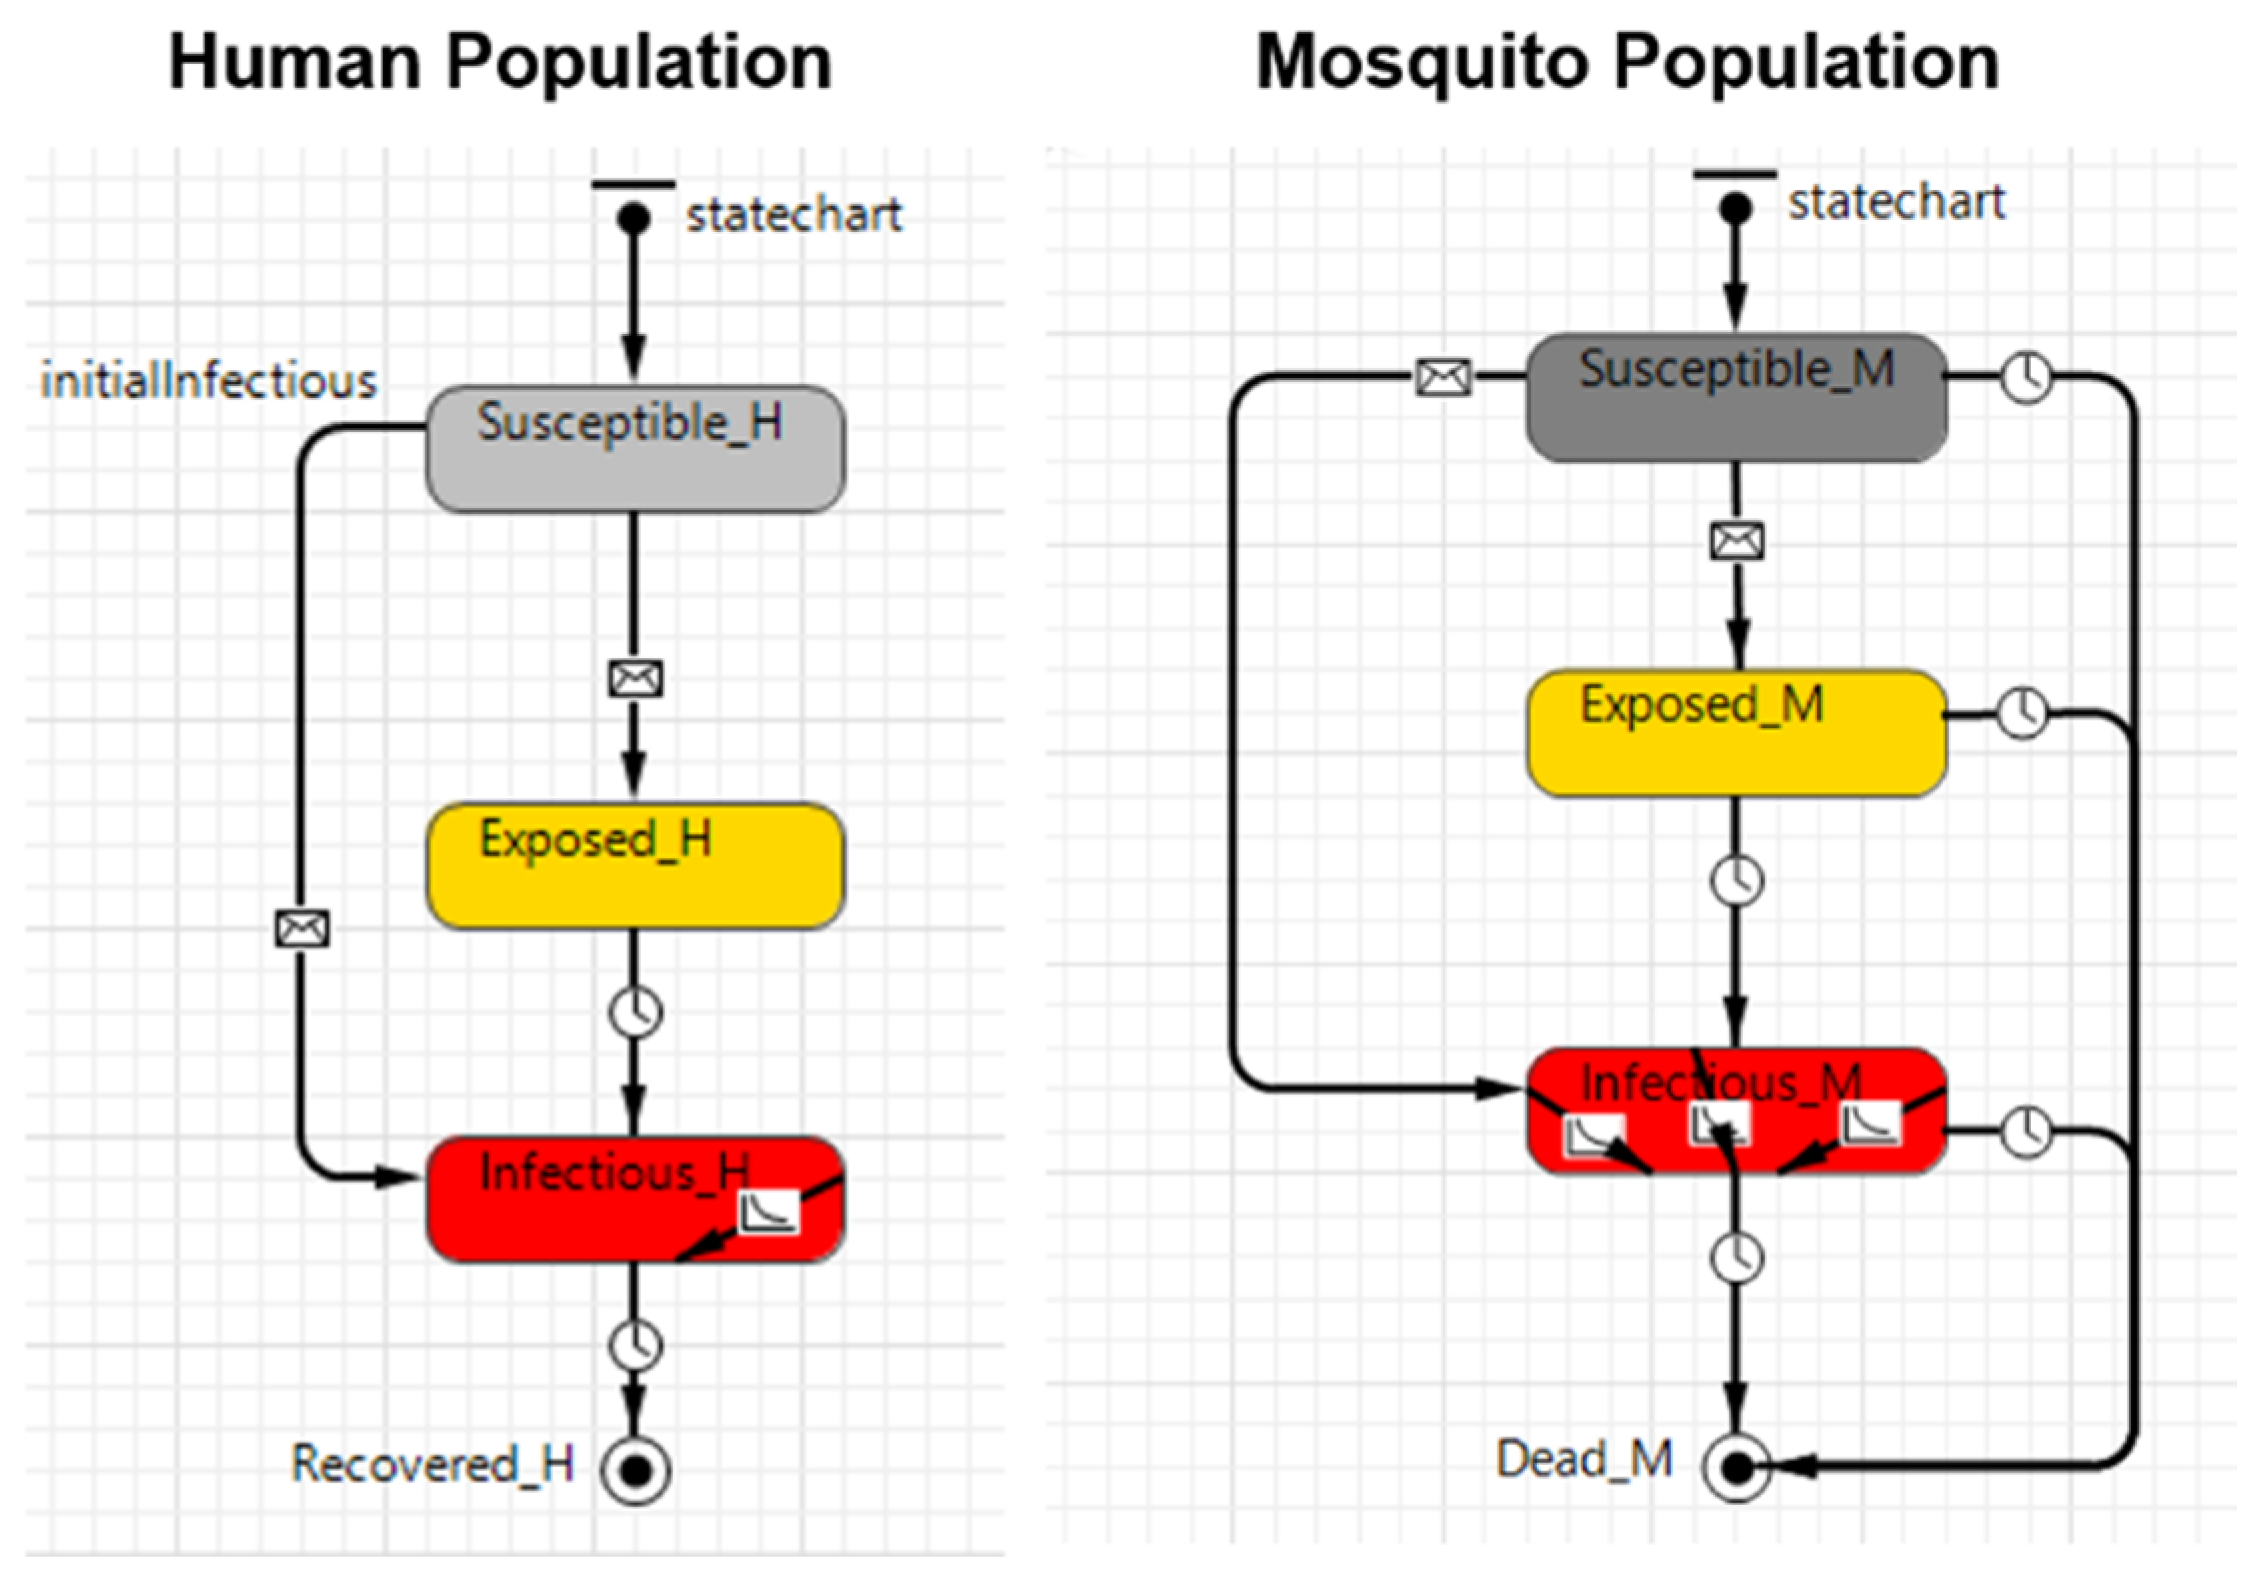
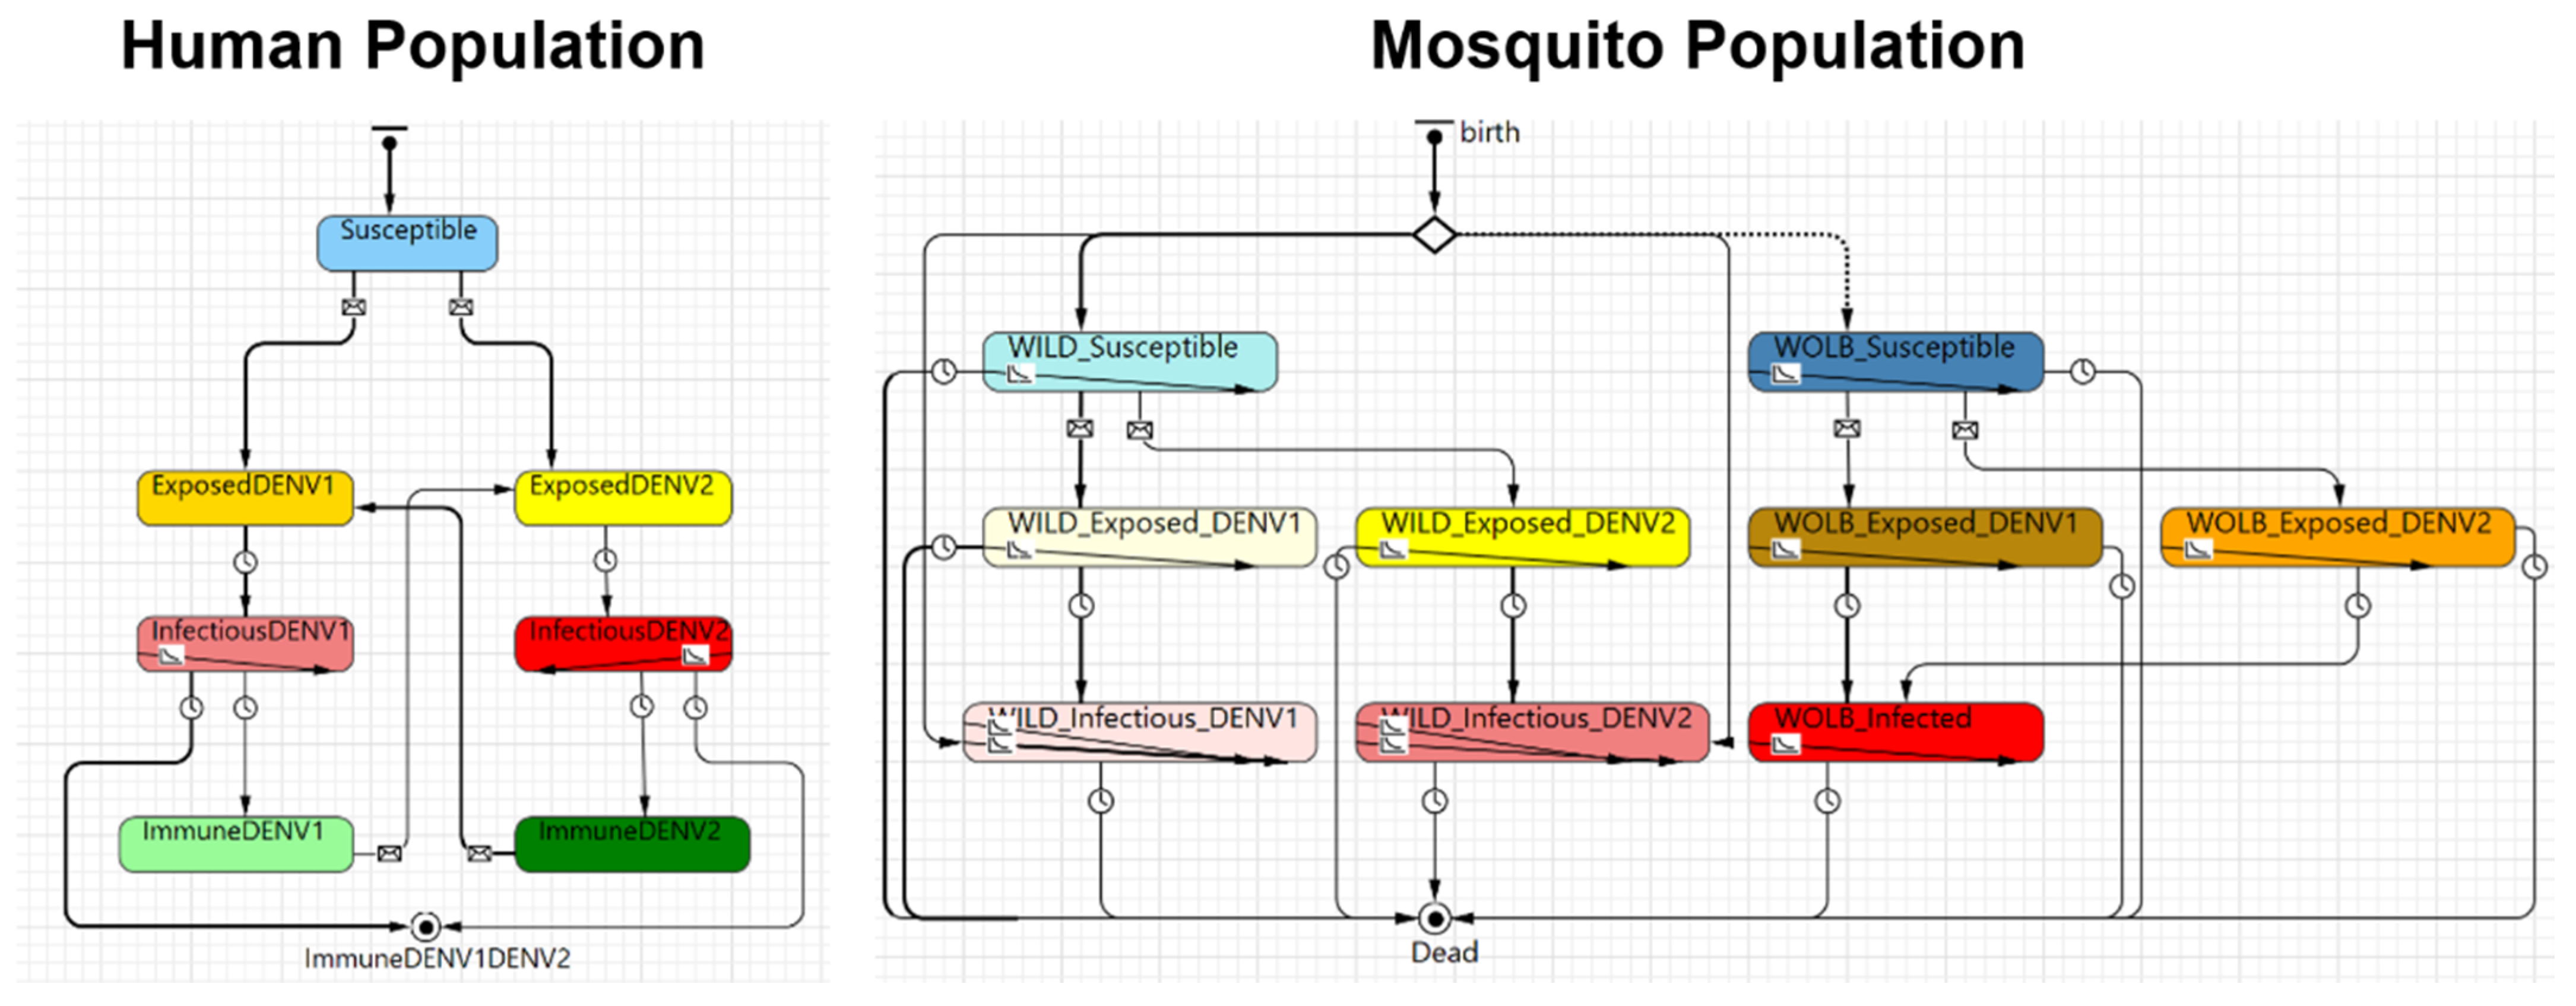
Process overview and schedulingIn vector-borne diseases, there are generally three types of agents: (i) the pathogen, which may be a virus or bacteria; (ii) the vector, in this work a mosquito that can be either Aedes aegypti or Aedes albopictus; and, (iii) the final host, a human in this case.
The model was built based on the traditional susceptible, exposed, infectious, and recovered (SEIR) and susceptible, exposed, and infectious (SEI) compartmental models. The SEIR model was used to represent humans, while the SEI model was used to represent the vector. The baseline conceptual model represented by the SEIR-SEI compartmental model is shown in Figure 1, and Table 2 provides the definition of the symbols presented in Figure 1.
The life cycle of the pathogen can be described in four stages:
(1) The pathogen is transmitted from an infectious mosquito (Mi) to a susceptible host (Hs) when the mosquito feeds on human blood.
(2) The pathogen infects the exposed host (He), who still has no ability to transmit the disease to another mosquito. After the latent period, the pathogen reaches sufficiently high densities in the blood of the infectious host (Hi), who is now able to infect another susceptible mosquito (Ms).
(3) Whenever a susceptible mosquito feeds on an infectious host, the susceptible mosquito inoculates the pathogen and becomes an exposed mosquito (Me). Similar to the host, the mosquito is not able to immediately transmit the disease to other susceptible hosts.
(4) After the latent period, the pathogen develops in the mosquito to the point that the pathogen becomes present in the salivary glands of the mosquito, who becomes an infectious mosquito (Mi) and can now transmit the disease by biting a susceptible host. After the recovery period, the host is considered to be recovered (Hr) and immune to the pathogen (this is not true for all mosquito-borne diseases but it is true for some of them, such as dengue with respect to the same virus strain and chikungunya). An infectious mosquito never recovers from the disease and will stay infectious until its death.
Three different models were developed in this work to meet the proposed goal. Each model works slightly differently and they are described in detail in Section 2.1.1, Section 2.1.2, Section 2.1.3 and Section 2.1.4. The description provided above refers to the baseline model (Model A). Figure 2, Figure 3 and Figure 4 shows the simulation model snapshot of the human population module and the mosquito population module of each one of these modules.
The transition between each state is based on the epidemiological parameters as shown in Figure 1 and described in Table 2 and Table 3. The data were collected at the end of each day on the basis of an event.
Design conceptsDesign conceptsStochasticity was considered in all models through the infectious disease parameters used as input. These data are provided in Table 4, Table 5, Table 6 and Table 7.
Adaptation was considered in Model C when humans changed their behavior in response to the total number of infected individuals, either instantaneously or after a specific amount of time. This was considered at an individual and a population level. In summary, human behavior was considered to change in four different situations, as described in Section 2.1.3.
DetailsInitializationHumans and mosquitoes were uniformly randomly distributed in the continuous space. The human and mosquito population size and the initial number of infectious humans and mosquitoes are provided in Table 4, Table 5, Table 6 and Table 7.
InputThe input data used in the model were defined within the model and they are provided in Table 4, Table 5, Table 6 and Table 7.
Sub-modelsThis consists of the “skeleton” of the model, as well as its description, which are provided in Figure 1, Figure 2, Figure 3 and Figure 4 and Section 2.
Table 2. Definition of the conceptual model symbols.
#SymbolDefinition
1ThHuman population size
2TmMosquito population size
3βhInfectivity rate from mosquito to human
4βmInfectivity rate from human to mosquito
5λhHuman latent rate
6λmMosquito latent rate
7γHuman recovery rate
8μMosquito mortality rate
9HsNumber of susceptible humans
10HeNumber of exposed humans
11HiNumber of infectious humans
12HrNumber of recovered and immune humans
13MsNumber of susceptible mosquitoes
14MeNumber of exposed mosquitoes
15MiNumber of infectious mosquitoes
Figure 1. Baseline conceptual model.
Modelling 02 00009 g001
Figure 2. Snapshot of the simulation Model A (baseline).
Modelling 02 00009 g002
Figure 3. Snapshot of the simulation Model C (coupled human behavior and dengue spread model).
Modelling 02 00009 g003
Figure 4. Snapshot of the simulation Model D (multi-strain, multi-vector dengue spread model).
Modelling 02 00009 g004

2.1. Experiment Design

The input data used in this study was taken from the World Health Organization [27,28], Araújo [29], and Yakob and Clements [30].
To answer the research questions discussed in the Introduction section, we considered 4 different models: (1) Model A or baseline (single-strain, single-vector dengue spread model); (2) Model B, which is the baseline model with different parameter values to investigate the impact of data quality; (3) Model C, coupling human behavior and dengue spread model; and (4) Model D, a multi-strain, multi-vector dengue spread model. The models were developed from modifications of the baseline model (Model A) in order to answer the research questions discussed in Section 1. The required modifications of each model are discussed in their respective sections.
The parameters used in each one of these models are presented in Table 3. Model A is the baseline model and contains the parameters as described in Section 3. Model B is also the baseline model with different parameter values to assess the impact of data quality on the results of the epidemiological model. In other words, there is no logic modification between Model A and Model B. Model C is the model where the impacts of human behavior are investigated. The parameters related to human behavior, such as population cautious factor and population time to switch behavior, are included. Finally, Model D is the model where the impacts of multi-strain and multi-vector are investigated. Parameters such as the daily human latent rate for DENV2 and the proportion of wild and Wolbachia-carrier mosquitoes are included. A more detailed discussion about each model and the number of parameters added in each model is presented below.
Table 3. Parameters used in each of the four models.
#AgentParameterIf the Parameter is Used in the Model:
ABCD
1HumanHuman population sizeXXXX
2HumanDaily human to mosquito infect rate for DENV1XXXX
3HumanDaily human latent rate for DENV1XXXX
4HumanDaily human recovery rate for DENV1XXXX
5MosquitoMosquito population sizeXXXX
6MosquitoDaily wild mosquito to human infect rate for DENV1XXXX
7MosquitoDaily wild mosquito latent rate for DENV1XXXX
8MosquitoDaily wild mosquito mortality/birth rateXXXX
9HumanDaily human to mosquito infect rate for DENV2 X
10HumanDaily human latent rate for DENV2 X
11HumanDaily human recovery rate for DENV2 X
12MosquitoDaily wild mosquito to human infect rate for DENV2 X
13MosquitoDaily wild mosquito latent rate for DENV2 X
14MosquitoDaily Wolbachia-carrier mosquito latent rate for DENV1 X
15MosquitoDaily Wolbachia-carrier mosquito latent rate for DENV2 X
16MosquitoDaily Wolbachia-carrier mosquito mortality/birth rate X
17MosquitoMosquito type (wild or Wolbachia-carrier) X
18MosquitoProportion of wild and Wolbachia-carrier mosquitoes X
19HumanInitial number of DENV1 infectious humansXXXX
20HumanInitial number of DENV2 infectious humans X
21MosquitoInitial number of wild DENV1 infectious mosquitoesXXXX
22MosquitoInitial number of wild DENV2 infectious mosquitoes X
23HumanExposed to DENV1 (0 or 1/no or yes) X
24HumanExposed to DENV2 (0 or 1/no or yes) X
25Human—PopulationInclude same behavior for the whole population [0—False, 1—True] X
26Human—IndividualInclude behavior for individual [0—False, 1—True] X
27HumanPercent of infectious individuals to trigger cautious behavior [%] X
28Human—PopulationPopulation cautious factor [%] X
29Human—IndividualIndividual cautious factor [%] X
30HumanInclude time to switch behavior [0—False, 1—True] X
31Human—PopulationPopulation time to switch behavior [days] X
32Human—IndividualIndividual time to switch behavior [days] X
Each model was run for 2 years (730 days), which was long enough for the epidemic to die out in all iterations and replications of the experiment. A total of 50 replications were performed and 3 output responses of interest were considered: (1) total number of infected individuals, (2) duration of the epidemic in days, and (3) number of epidemic waves. Three model measures were also collected: (1) runtime, (2) number of agents/entities, and (3) number of states.
Paired t-test with α = 0.05 was applied to the results of the computational models to investigate whether the results of Model A (baseline low-level versus baseline high-level) were statistically significantly different or not for each one of the three output responses and runtime. Multi-way analysis of variance (ANOVA) with α-level of 0.05 was used to investigate (i) in Model B, the impact of changing the values of the different inputs per baseline level (low or B1 and high or B2) on the three responses and runtime; (ii) in Model C, the impact of considering human behavior on the vector-borne disease model; and (iii) the impact of considering multi-strain and multi-vector on the vector-borne disease model. Next, the Tukey multiple comparison method was used to identify which pair of treatment (or inputs values) was significantly different among the inputs. The tests were performed using the software JMP.

2.1.1. Model A—Baseline (Single-Strain, Single-Vector Dengue Spread Model)

The baseline model was described in the process overview and scheduling row of Table 1. The parameter values used in the model are given in Table 4.
Table 4. Input parameter values of the baseline model.
#Input Data DescriptionScenario #01Scenario #02
1Mosquito population size2002000
2Initial number of infectious mosquitoes10100
3Mosquito daily latent rateUniform (0.083, 0.125)
4Mosquito daily mortality rateUniform (0.033, 0.05)
5Daily infectivity rate from mosquito to humanUniform (0.1, 0.18)
6Human population size1001000
7Initial number of infectious humans0
8Human daily latent rateUniform (0.1,0.25)
9Human daily recovery rateUniform (0.143, 0.45)
10Daily infectivity rate from human to mosquitoUniform (0.36, 0.44)
The assumptions adopted in this study are based on the work of Ross and Thomson [31], Kermack and McKendrick [32], Dumont et al. [33], and Yakob and Clements [30]. Such assumptions lead to a simplified model compared to reality. However, such limitation should not affect the objective of this work, since this study proposes to explore the importance of data quality, human behavior, multi-strain, and multi-vector in the results of disease spread models. Rather than foresee possible future epidemics or seek to understand past epidemics, the goal here is to draw the attention of researchers and experts in the field to the importance of these characteristics and to serve as a starting point for the elaboration of more detailed and more realistic models.

2.1.2. Model B (Data Quality)

In order to assess the impact of data quality on the model’s results, we decided to perform a sensitivity analysis on each of the factors of the baseline model. In the sensitivity analysis, the factors were varied one at a time. By varying the parameters one at a time, we were able to gain insight into the impact of the parameters on the model results, but it was not possible to assess the impact of the interaction between the parameters on the simulation responses.
Table 5 presents the parameter values used to assess the impact of the information quality. For all scenarios, the parameters were varied one at a time. Therefore, the experiment in this model had a total of 65 scenarios: (1) 3 different levels (C1, C2, and C3) for each of the 10 parameters of Table 5 for low- and high-level baselines (B1 and B2), except for level C3 of “initial number of infectious mosquitoes” for low-level baseline because it is not feasible. This gives a total of 3 × 10 × 2 − 1 = 59 scenarios. (2) Low-level (B1) of parameters “mosquito population size”, “initial number of infectious mosquitoes”, and “human population size” for high-level baseline (B2), which gives 3 scenarios. Finally, (3) high-level (B2) of parameters “mosquito population size”, “initial number of infectious mosquitoes”, and “human population size” for low-level baseline (B1), which gives 3 iterations. The justification for varying the value of each parameter is given below.
Table 5. Input parameter values of the simulation Model B.
#Input Data DescriptionParameter Level
B1B2C1C2C3
1Mosquito population size20020001005005000
2Initial number of infectious mosquitoes101002550500
3Mosquito daily latent rateUniform (0.083, 0.125)Uniform (0.05, 0.500)Uniform (0.125, 0.500)Uniform (0.05, 0.083)
4Mosquito daily mortality rateUniform (0.033, 0.05)Uniform (0.020, 0.07)Uniform (0.05, 0.07)Uniform (0.020, 0.033)
5Daily infectivity rate from mosquito to humanUniform (0.1, 0.18)Uniform (0.07, 0.22)Uniform (0.18, 0.22)Uniform (0.07, 0.1)
6Human population size100100050020005000
7Initial number of infectious humans01050100
8Human daily latent rateUniform (0.1,0.25)Uniform (0.05, 0.500)Uniform (0.25, 0.500)Uniform (0.05, 0.1)
9Human daily recovery rateUniform (0.143, 0.450)Uniform (0.070, 0.600)Uniform (0.450, 0.600)Uniform (0.070, 0.143)
10Daily infectivity rate from human to mosquitoUniform (0.36, 0.44)Uniform (0.20, 0.80)Uniform (0.44,0.80)Uniform (0.20,0.36)
  • Mosquito population size: variation in mosquito population size may represent either the adoption of control strategies (e.g., insecticide use), the elimination of mosquito breeding sites (e.g., cleaning pots with standing water), climatic variation (e.g., increased rainfall and temperature that favor the reproduction of mosquitoes), or errors in estimating the mosquito population through techniques such as mosquito trap.
  • Initial number of infectious mosquitoes: this parameter was varied to represent regions in which the disease is imported by travelers who bring infectious mosquitoes to the area and regions where the disease is endemic.
  • Mosquito daily latent rate, mosquito daily mortality rate, human daily latent rate, and human daily recovery rate: considered low and high rates, on the basis of the values found in the literature, as well as low and high variation. The variations of these rates represent the existence of several types of virus that can reproduce in mosquitoes and humans more slowly or quickly and, consequently, also affect the human recovery rate; the genetic and immune variation of humans and mosquitoes; the use of medical treatment that affects the recovery rate of individuals; and climatic variations and use of control measures, such as the use of screens in windows and insecticides, which may alter the mortality rate of mosquitoes.
  • Daily infectivity rate from mosquito to human: the variations of this rate are due to reasons similar to mosquito daily latent rate, such as the existence of different types of virus, and genetic and immune variation of mosquitoes.
  • Human population size: the size was varied to represent different neighborhoods or sizes of cities.
  • Initial number of infectious humans: this parameter was varied for reasons similar to mosquito population size and initial number of infectious mosquitoes. The scenarios in Table 5 with initial number of infectious humans equal to 0 are equivalent to an epidemic-free population where a new epidemic is normally carried by a mosquito brought from an epidemic area. Besides representing an epidemic-free society and a society in which the disease is endemic, the variation may also represent large events, such as big sporting events, music events, or refugee entry into a region, which can lead to several cases imported at a single time.
  • Daily infectivity rate from human to mosquito: the variations of this rate were for reasons similar to mosquito daily latent rate and daily infectivity rate from mosquito to human, such as the existence of different types of virus, genetic and immune variation of humans, and use of medical treatment.

2.1.3. Model C (Coupled Human Behavior and Dengue Spread Model)

Despite the impacts of human behavior in the course of an outbreak, many disease spread models still ignore the human behavior factor. Lack of data on human behavior during outbreaks and the difficulty in quantifying some human behaviors may be one of the primary reasons for not including human behavior in disease spread simulation models. Moreover, to incorporate behavior in simulation models, it is necessary to have a more detailed model that makes use of agents, which requires more processing power, especially when the agent population is large.
Human behavior is considered in this study in 4 different situations: (1) situation 1, where the whole population adopts the same cautious behavior after the epidemic has reached a specific threshold; (2) situation 2, where each individual adopts his/her own cautious behavior after the epidemic has reached a specific threshold; (3) situation 3, where the whole population adopts the same cautious behavior after the epidemic has crossed the specific threshold for a specific amount of time; and (4) situation 4, where each individual adopts his/her own cautious behavior after the epidemic has crossed the specific threshold for a specific amount of time.
Compared to the baseline, the population behavior model and the individual behavior models (situations 1 and 2 of Model C) have two extra varying parameters each, namely, the percentage of infected individuals to trigger cautious behavior and the population/individual cautious factor. Compared to both previous situations, the inclusion of time to change population or individual behavior adds 1 extra parameter in each case. A total of 3 states had to be added to represent the change in human behavior. Table 6 presents the parameter values used to investigate the coupled human behavior.
Table 6. Input parameter values of the simulation Model C.
#Input Data DescriptionInput Data Value
1Mosquito population size2002000
2Initial number of infectious mosquitoes10100
3Mosquito daily latent rateUniform (0.083, 0.125)
4Mosquito daily mortality rateUniform (0.033, 0.05)
5Daily infectivity rate from mosquito to humanUniform (0.1, 0.18)
6Human population size1001000
7Initial number of infectious humans0
8Human daily latent rateUniform (0.1,0.25)
9Human daily recovery rateUniform (0.143, 0.45)
10Daily infectivity rate from human to mosquitoUniform (0.36, 0.44)
11Percent of infectious individuals to trigger cautious behavior [%]515515515515
12Cautious factor [%] *Uniform (0.6, 0.9)Uniform (0.8, 0.9)Uniform (0.6, 0.9)Uniform (0.8, 0.9)
13Time to switch behavior [days]Uniform (1,3)Uniform (1,7)Uniform (1,3)Uniform (1,7)
* When the time to switch behavior is considered, the cautious factor is always Uniform (0.6, 0.9).

2.1.4. Model D (Multi-Strain, Multi-Vector Dengue Spread Model)

Usually, dengue is modeled as a single-strain, single-vector disease. This can be represented by the traditional SEIR-SEI compartmental model discussed in Model A—baseline. This was realistic in the past when only one virus strain was encountered in the endemic regions, and when multiple strains existed, they were not simultaneously encountered. However, nowadays many countries, including Brazil, have 2 or more dengue virus strains at the same time. Moreover, countries are investigating new vector control methods, such as Wolbachia-carrier mosquitoes and genetically modified mosquitoes, as possible alternatives to contain the spread of the disease. Wolbachia-carrier mosquitoes can become infected by feeding on infectious humans, but they cannot further transmit the disease to susceptible humans [34].
In this study, we consider the possibility that 2 virus strains coexist and the use of Wolbachia-carrier mosquitoes as an alternative method for disease prevention. Currently, Wolbachia-carrier mosquitoes are Aedes aegypti mosquitoes that have been altered in a laboratory and are introduced into the environment on the basis of health policy decisions made by government agencies. This altered mosquito has already been approved as a safety Aedes aegypti control strategy in different countries after empirical studies have been successfully conducted [35].
To represent this multi-strain, multi-vector context, some changes had to be made in the baseline model. For the human population, 4 extra states were added and 1 of the existent states was modified. Six states were added for the mosquito population. Table 7 presents the parameter values used to investigate the coupled human behavior.
Table 7. Input parameter values of the simulation Model D.
#Input Data DescriptionInput Data Value
1Multi-strain onlyMosquito population sizeWild100200800100020008000
Wolbachia-carrier0
2Initial number of wild infectious mosquitoes [%]DENV12.52.52.52.52.52.5
DENV22.52.52.52.52.52.5
1Multi-vector onlyMosquito population sizeWild5010040050010004000
Wolbachia-carrier5010040050010004000
2Initial number of wild infectious mosquitoes [%]DENV15104050100400
DENV20
1Multi-strain-multi-vectorMosquito population sizeWild5010040050010004000
Wolbachia-carrier5010040050010004000
2Initial number of wild infectious mosquitoes [%]DENV12.52.52.52.52.52.5
DENV22.52.52.52.52.52.5
3Mosquito daily latent rateUniform (0.083, 0.125)
4Mosquito daily mortality rateUniform (0.033, 0.05)
5Daily infectivity rate from mosquito to humanUniform (0.1, 0.18)
6Human population size1001000
7Initial number of infectious humans0
8Human daily latent rateUniform (0.1,0.25)
9Human daily recovery rateUniform (0.143, 0.45)
10Daily infectivity rate from human to mosquitoUniform (0.36, 0.44)

3. Results

3.1. Baseline

As discussed in Section 2.1, paired t-test with α = 0.05 based on the high-level baseline (B2)—low-level baseline (B1) was applied to investigate whether the results of Model A were statistically significantly different or not for each one of the three output responses and runtime. The test results comparing the low- and high-levels of the baseline model for each of the output responses and for runtime are presented in Table 8, followed by a discussion of the results.
As is expected, the total number of infected individuals was statistically different due to the larger human population in the high-level baseline. The results also show that in the larger population, the epidemics lasted longer, but the number of epidemic waves was not statistically different than in the smaller population, which was the first interesting observation from this study. As also expected, the runtime when modelling a larger population was statistically greater due to the increase in the number of agents in the agent-based model.
Figure 5 and Figure 6 show the boxplot of the output responses. One can see that the variability was greater for the total number of infected individuals on the high-level of the baseline, while the opposite was observed for the number of epidemic waves. For the response duration of the epidemic, the variability did not seem to change considerably in terms of the human and mosquito population sizes. Figure 7 shows the evolution of the epidemic on a large population. In Figure 7, it is possible to observe the total number of humans and mosquitoes in each epidemiological state (susceptible, exposed, infectious, and recovered).

3.2. Impact of Data Quality

Multi-way analysis of variance (ANOVA) with an α-level of 0.05 was used to investigate the impact of changing the values of the different inputs per baseline level (low or B1 and high or B2) on the three responses of interest and runtime. First, ANOVA was used to identify whether there was a relationship between the output and the inputs, that is, whether the model was statistically significant. Next, ANOVA was used to identify which inputs were statistically significant for the model. Finally, for the inputs found to be statistically significant, the Tukey multiple comparison method was used to identify, among the inputs, which pair of treatment (or inputs values) was significantly different. The ANOVA results can be found in Table 9 and the Tukey multiple comparison results can be found in Table 10.
As shown in Table 9, in all the experiments performed, there was statistically significant evidence of relationship of at least one of the inputs and each of the outputs at α-level of 0.05. In general, the inputs were not statistically significant for the runtime per replication when a low population (low number of agents) was considered. Human population size and the initial number of infectious humans were the only inputs that were shown to be statistically significant in this case. In a small population scenario, a few factors also appeared to not be significant for the number of epidemic waves, such as the mosquito population size, the daily infectivity rate from mosquito to human, and the daily infectivity rate from human to mosquito. Interestingly, mosquito population size was also not significant for the responses total number of infected individuals and duration of the epidemic in days on the small population baseline level. This can lead to discussion and further investigation of the effectiveness of control measures, such as controlling mosquito population by the elimination of mosquitoes’ habitats such as bottles, tires, and fountains versus reducing the personal contact with mosquitoes by using window and door screens, mosquito repellents, long sleeve clothes, etc.
A detailed discussion of the results is presented below.
  • Mosquito population size:
The mosquito population size appeared to have a higher impact on the epidemic responses for larger human population size. While in the low-level baseline, the mosquito population size was not a significant input for any of the responses considered, in the high-level baseline, 9 out of 10 comparisons were statistically different with respect to the total number of infected individuals, and at least 4 comparisons were also statistically different for duration of the epidemic in days and number of epidemic waves. The output response “total number of infected individuals” appeared to be the most sensitive to the size of the mosquito population, followed by runtime per replication, number of epidemic waves, and last by the duration of the epidemic in days.
The mosquito population size had an opposite impact on the pair of output responses “total number of infected individuals” and “duration of the epidemic”—an increase in the mosquito population size increased the total number of infected individuals, but it reduced the duration of the epidemic in days. A similar characteristic was observed for the pair of output responses “total number of infected individuals” and “number of epidemic waves”. This was possibly due to the herd immunity effect, where the majority of the population has more quickly become infected and immune to the disease, shortening the duration of the epidemic and the number of epidemic waves.
With respect to runtime, by increasing the mosquito population size, there was an increase in runtime. An average increase of 10.87 s per replication from the baseline was observed when the human population size was large.
2.
Initial number of infectious mosquitoes:
The initial number of infectious mosquitoes appeared to have a great impact on the results of epidemiological models, especially for the high-level baseline. The input appeared to not be as significant for runtime, wherein the low-level baseline was not considered significant, and in the high-level baseline, only a few pairs (5 out of 10) were found to be significant. The input also appeared to be less significant for the total number of infected individuals in small populations, where only two pairs were found to be significant. For larger populations, with the exception of one pair for the output response “duration of the epidemic in days” and one pair for “number of epidemic waves”, both in the high-level baseline, all pairs were statistically different for the output responses “total number of infected individuals”, “number of epidemic waves”, and “duration of the epidemic in days”. The impact of this parameter was similar to parameter #1—an increase in the initial number of infectious mosquitoes led to an increase in the total number of infected individuals, but in a reduction of the duration of the epidemic and in the number of epidemic waves.
An average increase of 7.50 s per replication from the baseline was observed when the human population size was large. This increase in runtime is probably explained by the increase in the number of state changes in the simulation model—with the increase in the initial number of infectious mosquitoes, there was an increase in the total number of infected individuals and, hence, the humans went through more state changes (from susceptible to exposed to infectious to recovered).
3.
Mosquito daily latent rate:
This parameter appears to impact all three output responses, with the output response “total number of infected individuals” being the one most sensitive to variations in the mosquito daily latent rate and the “number of epidemic waves” the least sensitive. The output response “duration of the epidemic” did not appear to be as sensitive in the low-level baseline as it was in the high level. The runtime decreased with the increase in the mosquito daily latent rate. The reduction in runtime can be explained following similar logic to parameter #2—there was a lower number of state changes in the simulation model and consequently a reduction in runtime.
It is worth pointing out that, contrary to parameters #1 and #2, a reduction in this parameter led to a decrease in all three output responses. This indicates the need to direct research on reducing the mosquito daily latent rate (i.e., increasing the latent period), because contrary to what happened when reducing the mosquito population size, reducing the mosquito daily latent rate had a positive effect, that is, reduces all three output responses being investigated.
4.
Mosquito daily mortality rate:
This parameter impacted the epidemiological model results similar to parameter #3 above. First, the mosquito daily mortality rate appeared to impact all three output responses, with the output response “total number of infected individuals” being the one most sensitive to variations in the parameter and the “number of epidemic waves” the least sensitive. Similar to parameter #3, the output response “duration of the epidemic” did not appear to be as sensitive in the low-level baseline as it was in the high level. The runtime also decreased with the increase in the mosquito daily mortality rate. Finally, an increase in the mosquito mortality rate led to a reduction in all three output responses. This may indicate that more important than controlling the birth of new mosquitoes is assuring that the mosquito lifetime is shortened, which has been the focus of some new strategies such as the release of genetically modified mosquitoes.
The results of this parameter also agree with what is known about mosquito-borne diseases. For instance, it is known that temperature, rainfall, and mosquito density in the environment are factors that have a considerable impact on the lifetime of mosquitoes and, therefore, disease epidemics such as dengue are stronger in summer months and weaker in winter months, when the mosquito lifetime is shorter. Using this finding, it is important that researchers, especially entomologists, conduct more empirical experiments to know more accurately the mosquito mortality rate and how this parameter varies int erms of climatic and population factors. The variability of the parameter also seems important, because tests that compared scenarios with less variability (e.g., B1-C2) resulted in larger statistical differences.
5.
Daily infectivity rate from mosquito to human:
This parameter impacts the epidemiological model results similar to parameter #3. It is important to mention that for small population size, this parameter was not significant for the output response “number of epidemics waves” and there were only one or two pair comparisons where the parameter was shown to be significant for the output response “number of epidemic waves” for large population sizes and the response “duration of the epidemic in days” in both small and large population sizes.
6.
Human population size:
Contrary to parameter #1, an increase in the human population size led to an increase in all three output responses and vice versa. This is expected and, unfortunately, it was not as useful in terms of control strategies. However, it indicates the need for research that investigates the impact of quarantine and isolation in controlling dengue. These strategies have been discussed at length during the investigation of airborne and direct contact transmitted diseases, such as influenza, but the strategies have not been extensively explored in terms of mosquito-borne diseases.
The runtime was highly affected by the number of humans or agents in the model. Human population size affected runtime regardless of the population size, and there was only one pair comparison that was not statistically significant, which indicates that runtime was very sensitive to this parameter.
Another result was that larger populations prolonged the epidemic (since more individuals are transmitting the pathogen). However, it is important to investigate whether these results remain in epidemics in which the pathogen is transmitted more slowly or more rapidly. With epidemics that spread too quickly, the total number of infected individuals will most likely still increase with the increase in the human population size, but the duration may decrease because all individuals will quickly become infected, as discussed in parameter #1. On the other hand, with epidemics that spread slowly, the epidemic may end before it infects many individuals, which would lead to a decrease in the total number of infected individuals, as well as the duration of the epidemic.
7.
Initial number of infectious humans:
As expected, an increase in the initial number of infectious humans led to an increase in the total number of infected individuals for large population size. However, the increase in the initial number of infectious humans led to a decrease in the duration of the epidemic and the number of epidemic waves for large population size. For a small population, initially, an increase in the parameter led to an increase in the total number of infected individuals, duration of the epidemic, and the number of epidemic waves. However, a further increase of the parameter led to a reduction of all three output responses. This was likely due to the disease spreading more quickly over all the population and it may also indicate an interaction among the parameters. This also highlights the importance of investigating the quality of parameters values because the output responses do not monotonically increase or decrease as a function of the parameter. The output response “total number of infected individuals” appeared to be the most sensitive to this parameter.
8.
Human daily latent rate:
This parameter had a similar impact on the model results as parameter #3. However, it is important to highlight two main differences. First, this parameter was not found to be significant for the total number of infected individuals, while parameter #3 was considered significant for the total number of infected individuals. The second difference is that conversely to parameter #3, where an increase in the parameter led to an increase of the total number of infected individuals only and a reduction in the duration of the epidemic and number of waves. Here, an increase in this parameter led to a decrease in the total number of infected individuals, but also to an increase in the duration of the epidemic and the number of waves. This can be intuitively explained—since the individuals become infectious faster, the total duration of the epidemic for one individual is shorter, and, therefore, there may not be enough time to infect many mosquitoes and, consequently, other humans. However, the epidemic may last longer and have more waves due to sporadic cases here and there. This parameter is another important factor for future control actions.
9.
Human daily recovery rate:
Similar to parameter #4, an increase in the human daily recovery rate led to a reduction in the total number of infected individuals and in the duration of the epidemic. However, in this case, the number of epidemic waves increased. According to the Tukey multiple comparison test, in a large population, the human daily recovery rate resulted in a different number of infected individuals, different duration of the epidemic, and different number of epidemic waves in almost every test performed. For small population size, the output responses appeared to not be as sensitive to the variation in the parameter, but the parameter was still found to be significant in many pair comparisons. Thus, due to the impacts of this parameter on the epidemiological model results, health agencies must investigate the recovery rate of each disease to provide accurate information to researchers working on disease spread models. Likewise, due to the impact of the human recovery rate on the epidemic responses, the population must follow the treatment prescribed by doctors and health agents to maximize the recovery rate. During the recovery period, it is also important to follow the guidelines in adopting control measures, such as protecting against mosquito bites, in order to avoid infecting new mosquitoes.
10.
Daily infectivity from human to mosquito:
The results were similar to parameters #3 and #5 with respect to the total number of individuals infected. However, the duration of the epidemic and the number of epidemic waves were not as sensitive to this parameter, with only 3 comparisons out of 24 being statistically different.
Overall, initial number of infectious mosquitoes (#2), mosquito daily latent rate (#3), mosquito daily mortality rate (#4), human population size (#6), initial number of infectious humans (#7), and human daily recovery rate (#9) were the parameters that appeared to have a greater impact on the three output responses considered simultaneously. However, it is worth noting that initial number of infectious mosquitoes had an opposite impact on the output responses—an increase in the parameter increased the “total number of infected individuals” and decreased the “duration of the epidemic in days” and the “number of epidemic waves”.
The mosquito population size (#1) for small population size, the human daily recovery rate (#8), and the daily infectivity rate from human to mosquito (#10) were the parameters that appeared to have less impact on the three output responses considered simultaneously.
Figure 8 shows the results discussed above in a succinct way. It is possible to identify that parameters #1 and #10 were the ones that led to less variation in the results when compared to other parameters in the low-level baseline, while parameter #8 was the one that led to less variation in the high-level baseline. On the other hand, parameter #6 was the one that led to the highest variation in both levels, followed by parameters #2, #3, #4, #7, and #9.

3.3. Impact of Human Behavior

Multi-way analysis of variance (ANOVA) with an α-level of 0.05 was used to investigate the impact of considering human behavior on the vector-borne disease model. The human behavior was considered through different scenarios: (i) individual versus population level, (ii) with and without time to switch behavior, (iii) with different thresholds of the total number of infectious individuals to trigger cautious behavior, and (iv) different human cautious behaviors. The ANOVA results can be found in Table 11. A discussion of the results is presented below.
From the results shown in Table 11, it is observed that including human behavior in epidemiological models did not impact the runtime for small population sizes. However, in any of the cases, the difference was not greater than 20 s per replication, which is a reasonable increase when considering the trade-off between accuracy and computational needs.
For the parameter values used in the experiments of this work, all three output responses were not found to be sensitive to the different coupled human behavior and dengue spread models investigated when the population was large. When the population was small, all the output responses were found to be sensitive to the coupled human behavior, with the total number of infected individuals appearing to the most sensitive response, followed by the duration of the epidemic in days, and lastly by the number of epidemic waves. Although the number of results that were statistically different was not large, the existence of a few differences already shows the importance of human behavior in the results of epidemiological models. Moreover, this is just one model with specific parameters.
A work of [36] also investigated the impacts of human behavior on the results of the epidemiological model. The authors tested the same scenarios mentioned in this work, but the model mimicked the spread of the chikungunya disease and, hence, the parameter values were slightly different. In that work, Scheidegger and Banerjee [36] found that the total number of infected individuals and the duration of the epidemic were statistically different in every comparison of the coupled human behavior disease spread model against the baseline model with a larger population. The authors also found a few differences in the low-level baseline.
Tukey multiple comparison test was used to investigate whether the results from the population-based Model C were statistically different from the individual-based Model C. With a few exceptions (three scenarios for the total number of infected individuals, one scenario for the duration of the epidemic, and one scenario for the number of epidemic waves), the results of the population-based Model C were not statistically different from the results of the individual-based Model C. This indicates that in some cases and depending on the parameter values and the response of interest, human behavior may be accurately represented at the population level, instead of at the individual level.
The differences found in this work and the work of Scheidegger and Banerjee [36] may indicate an interaction between the disease parameter values and human behavior. This highlights the importance of considering the impacts of both data quality and human behavior on the results of epidemiological models—while including human behavior may improve the accuracy of the results, the improvement may be compromised if the disease data are not accurate. More investigation in this area is needed to better understand the impacts of human behavior on vector-borne disease dynamics.

3.4. Impact of Multi-Vector and Multi-Strain

Multi-way analysis of variance (ANOVA) with an α-level of 0.05 was used to investigate the impact of considering multi-strain and multi-vector on the vector-borne disease model. Multi-strain and multi-vector were considered through different scenarios: (i) multi-strain model versus baseline model, (ii) multi-vector model versus baseline model, and (iii) multi-strain and multi-vector model versus baseline. The ANOVA results can be found in Table 12. A discussion of the results is presented below.
The multi-strain, multi-vector model against the baseline had a statistically different total number of infected individuals, duration of the epidemic in days, number of epidemic waves, and runtime for all the scenarios investigated: multi-strain only, multi-vector only, and multi-strain and multi-vector for both small and large populations.
From the results, one can observe that in terms of runtime the differences decrease when the population increase. For a large population, a significant difference was only observed among the high-level baseline and the multi-strain, multi-vector model, but no difference was observed when considering multi-strain only or multi-vector only. This indicates that in large populations, the increase in runtime caused by adding these characteristics in the model may not be as big as the increase in runtime caused by the increase in the number of agents, as discussed in Section 3.2. Moreover, in any case, the increase in runtime was not greater than 18 s, which is a reasonable increase considering the significant differences in the other three output responses.
As the ANOVA results showed, every scenario considering multi-strain and multi-vector, or multi-strain or multi-vector individually was statistically different than the baseline model at either low or high level. Including multi-strain and/or multi-strain and multi-vector led to an increase in the total number of infected individuals and duration of the epidemic, but a decrease in the number of epidemic waves. The increase in the total number of infected individuals and duration of the epidemic was expected as there were different strains of virus circulating simultaneously and people are immune to specific strains only.
As previously discussed, Wolbachia-carrier mosquitoes are laboratory-modified mosquitoes that can be infected by the dengue virus but cannot transmit the disease to other humans. Contrary to what one would expect from such a disease control strategy, the introduction of the Wolbachia-carrier mosquitoes led to a reduction in the duration of the epidemic and in the number of waves, but it increased the total number of infected individuals in comparison to the baseline. However, using Tukey multiple comparison test, we could check that using multi-vector strategy was significantly capable to lower the total number of infected individuals and the duration of the epidemic in scenarios with multi-strain, although there was no evidence to reduce the number of epidemic waves in comparison to the multi-strain scenario. This may indicate that the Wolbachia-carrier mosquitoes may not be a good strategy for regions where there is the circulation of only one strain of the dengue virus, but it may be a promising strategy for regions with a simultaneous circulation of multiple virus strains. We recognize that this is one model with specific parameters. Therefore, more studies must be performed to check whether this recommendation is valid for different contexts.

4. Discussion

From the discussion of the above results, some general inferences can be made. First, it was possible to observe that the variation of the parameter values had a greater impact on the total infected individuals than on the total duration of the epidemic or the number of epidemic waves. While 94 out of 140 comparisons led to statistically different results for the total number of infected individuals, 76 were statistically different for the duration of the epidemic, and 66 for the number of epidemic waves.
Parameters #1 and #8 were the ones that had the least impact on the total number of infected individuals, while parameters #1, #5, and #10 on the duration of the epidemic, and parameters #1 and #10 on the number of epidemic waves. On the other hand, parameters #6, followed by different parameters such as #2 and #7 were the most impactful for the output responses.
This allows us to emphasize two findings: first, the importance of defining the response of interest in epidemiological models, and second, the importance of accurately estimating the parameters. While some parameters may lead to little to no change to one output response, that same parameter may cause large changes in another output response.
Moreover, as discussed in Section 3.2, in some cases, a change in the parameter led to a decrease in the total number of infected individuals and an increase in the duration of the epidemic and/or in the number of epidemic waves. Thus, before implementing control measures, it is important to clearly define the priority for the population and the health system: reducing the total number of infected individuals, reducing the duration of the epidemic, or reducing the number of epidemic waves. In general, it is believed that the total number of infected individuals is more important than the duration of the epidemic. However, a long epidemic can generate greater rumors and fear among the population, as well as it potentially leading to a lower awareness of the population over time, which can reduce adherence to control measures and, consequently, increase the total number of infected individuals later. Depending on the control measures adopted, a longer epidemic may also have other long-term and unexpected consequences, such as economic losses and psychological impacts. The contrary results that the same input parameter has on the output responses highlight the importance of adequately estimating disease parameters such as the disease latent rate and the infectivity rate, which have a positive effect on all three output responses discussed in this work. Although important, many epidemiological models use estimates for these parameters without relying on empirical studies or some scientific support. It is recognized that it is difficult to perform experiments to define these parameters, but we call for more multidisciplinary attention to these parameters and for greater investment in the area.
Figure 9 and Figure 10 show the relationship between the output responses per parameter. According to Figure 9, it is possible to verify that, with exception of parameters #6 and #7, there was no apparent correlation between the total number of infected individuals and the duration of the epidemic, and between the total number of infected individuals and the number of epidemic waves. On the other hand, according to Figure 10, except for parameter #9, there appeared to exist a positive correlation between the duration of the epidemic and the number of epidemic waves.
Figure 11 shows the relation between the output responses as well, but the response total number of infected mosquitoes was included. As it can be seen, the total number of infected mosquitoes was highly correlated with the total number of infected individuals and slightly correlated with the duration of the epidemic. The runtime did not seem to be correlated with any of the output responses.

5. Conclusions

The main conclusions that can be derived from this work are as follows:
(i) The data quality is indeed an important factor and must be investigated in more detail by researchers and simulation specialists modelling disease spread. In fact, we suggest that a data quality impact analysis should be included as a section of any rigorous epidemiological simulation model study to acknowledge the uncertainties that might underly the model responses.
(ii) Variations in the parameters were shown to have a greater impact on the total number of infected individuals than on the duration of the epidemic or the number of epidemic waves.
(iii) Variations in the parameters may lead to divergent results of what is desired in an epidemic, i.e., a variation may lead to a reduction in the total number of infected individuals and an increase in the duration of the epidemic and the number of epidemic waves or vice versa.
(iv) Some parameters were shown to be significant in low population size, while others were shown to be significant in large population size only. This reinforces the importance of investigating the accuracy of data in epidemiological studies and considering the different contexts that exist, such as different population sizes, different geographies, different human behavior, how disease parameters change over time, etc.
(v) Similar to the item (iv), the responses appeared to not monotonically increase or decrease as a function of some of the parameters. This also reflects the importance of investigating the data accuracy on epidemiological studies, as a slight change in the value of the parameters may bring opposite effects on the responses of interest.
(vi) Human behavior appears to be appropriately mimicked in either the individual-based level or in the population-based level, which could save some computational resources.
(vii) Human behavior appears to present a strong interaction with the parameter values, which indicates that although in some cases it may not impact the results, it must be investigated to make the appropriate modelling decision.
(viii) Wolbachia-carrier mosquitoes, which is a recent control strategy being investigated, appear to be a promising control strategy to regions with a simultaneous circulation of multiple virus strains, but it may increase the total number of infected individuals in regions with a single virus strain.
While discussing mosquito-borne diseases, one of the first recommendations given by health agencies is to control the mosquito population growth. As discussed here, although reducing the mosquito population size reduces the total number of infected individuals, it increases the duration of the epidemic and the number of epidemic waves. Therefore, a recommendation that seems more important is to ensure humans follow the proper treatment to make the recovery process from the disease faster in order to reduce the life span of the mosquitoes, as well as to search for strategies that would increase the latent period of the disease in mosquitoes. These three parameters, for instance, lead to positive changes in all three output responses discussed here. Following this suggestion, the introduction of genetically modified mosquitoes that have a shorter lifecycle should be further investigated in epidemiological models. Contrary to what one expects for mosquito-borne diseases, quarantine and isolation that would make the human population size of the endemic region temporarily smaller appears to be useful, due to the positive effects on all three output responses, and should also be further investigated.
We recognize that the model developed in this work is a large simplification of the real world. However, the focus of this work was not to develop a model for epidemic prediction. Instead, we wanted to illustrate the possible impacts of data quality, human behavior, multi-strain, and multi-vector on epidemiological results, and to attract the attention of the academic community to the importance of not overlooking these characteristics when modelling disease spread.
We also wanted to assess the trade-off between model accuracy and the required computational power. As the results indicate, due to the impacts on the results and the generally low to no increase in runtime when considering human behavior, multi-vector, or multi-strain, it appears beneficial to include those characteristics in the models. Although the model developed in this work is simple, the results align with what is known in this field of research, which indicates that modelling is a suitable tool for exploratory research and it is a good start point for showing the cost–effect of mimicking the reality more accurately.
Due to the simplicity of the model, further investigation is needed to evaluate whether these results would persist for larger human populations, for different values of the parameters, and for more detailed models. Therefore, several suggestions for future research can be made, such as (i) to repeat the same analyses, but using a larger number of replications to verify whether with a larger sample and consequently greater accuracy, the results will be similar or not; (ii) to repeat the same analyses for other human population sizes and other variations of the parameters and verify whether the results are similar; (iii) to carry out more experiments, possibly with complete or at least fractional factorial planning to evaluate the interaction between factors; (iv) to increase the level of detail of the model to more accurately represent reality; (v) to include genetically modified mosquitoes; and (vi) to perform similar analysis on different rules for behavior inclusion, such as change in behavior in terms of the number of infected individuals within a specific distance or in terms of the number of infected individuals in a social network (emotional proximity).

Author Contributions

Conceptualization, A.P.G.S. and H.d.S.M.; methodology, A.P.G.S., H.d.S.M., and A.B.; software, A.P.G.S.; validation, A.P.G.S., H.d.S.M., and A.B.; formal analysis, A.P.G.S.; investigation, A.P.G.S., H.d.S.M., and A.B.; data curation, A.P.G.S.; writing—original draft preparation, A.P.G.S. and H.d.S.M.; writing—review and editing, A.P.G.S. and A.B.; supervision, A.B. All authors have read and agreed to the published version of the manuscript.

Funding

The A.P.G.S. was funded by the Science without Borders program through CAPES (Coordenação de Aperfeiçoamento de Pessoal de Nível Superior)—Brazil, and by PECEGE—Luiz de Queiroz College of Agriculture—University of São Paulo.

Institutional Review Board Statement

Not applicable.

Informed Consent Statement

Not applicable.

Data Availability Statement

The data presented in this study are available on request from the corresponding author. This study also used data available in previously published studies as appropriately cited.

Acknowledgments

The authors would like to thank the editors and the reviewers for the suggestions given to improve the work and the quality of this paper.

Conflicts of Interest

The authors declare no conflict of interest. The funders had no role in the design of the study; in the collection, analyses, or interpretation of data; in the writing of the manuscript; or in the decision to publish the results.

References

  1. Santos, C.F. Reflections about the impact of the SARS-COV-2/COVID-19 pandemic on mental health. Braz. J. Psychiatry 2020, 42, 329. [Google Scholar] [CrossRef] [Green Version]
  2. Landry, M.D.; Geddes, L.; Moseman, A.P.; Lefler, J.P.; Raman, S.R.; van Wijchen, J. Early reflection on the global impact of COVID19, and implications for physiotherapy. Physiotherapy 2020, 107, A1–A3. [Google Scholar] [CrossRef]
  3. World Health Organization. A Year without Precedent: WHO’s COVID-19 Response. Available online: https://www.who.int/news-room/spotlight/a-year-without-precedent-who-s-covid-19-response (accessed on 18 January 2021).
  4. Venkatramanan, S.; Lewis, B.; Chen, J.; Higdon, D.; Vullikanti, A.; Marathe, M. Using data-driven agent-based models for forecasting emerging infectious diseases. Epidemics 2018, 22, 43–49. [Google Scholar] [CrossRef] [PubMed]
  5. World Health Organization. Health in 2015: From MDGs, Millennium Development Goals to SDGs, Sustainable Development Goals. Available online: https://apps.who.int/iris/bitstream/handle/10665/200009/9789241565110_eng.pdf?sequence=1&isAllowed=y (accessed on 17 November 2020).
  6. Lamb, A.; Paul, M.J.; Dredze, M. Investigating Twitter as a Source for Studying Behavioral Responses to Epidemics. In Proceedings of the AAAI Fall Symposium: Information Retrieval and Knowledge Discovery in Biomedical Text, Arlington, VA, USA, 2–4 November 2012; Citeseer: Princeton, NJ, USA, 2012. [Google Scholar]
  7. Gozzi, N.; Perrotta, D.; Paolotti, D.; Perra, N. Towards a data-driven characterization of behavioral changes induced by the seasonal flu. PLoS Comput. Biol. 2020, 16, e1007879. [Google Scholar] [CrossRef]
  8. World Health Organization. Sierra Leone: A Traditional Healer and a Funeral. Available online: https://www.who.int/csr/disease/ebola/ebola-6-months/sierra-leone/en/ (accessed on 18 January 2021).
  9. vom Steeg, L.G.; Klein, S.L. SeXX matters in infectious disease pathogenesis. PLoS Pathog. 2016, 12, e1005374. [Google Scholar] [CrossRef] [PubMed] [Green Version]
  10. Tolhurst, R.; De Koning, K.; Price, J.; Kemp, J.; Theobald, S.; Squire, S.B. The challenge of infectious disease: Time to take gender into account. J. Health Manag. 2002, 4, 135–151. [Google Scholar] [CrossRef]
  11. Stemple, L.; Karegeya, P.; Gruskin, S. Human rights, gender, and infectious disease: From HIV/AIDS to Ebola. Hum. Rights Q. 2016, 38, 993–1021. [Google Scholar] [CrossRef]
  12. Zhou, M.; Zhang, N.; Zhang, M.; Ma, G. Culture, eating behavior, and infectious disease control and prevention. J. Ethn. Foods 2020, 7, 1–7. [Google Scholar]
  13. Evans, J.C.; Silk, M.J.; Boogert, N.J.; Hodgson, D.J. Infected or informed? Social structure and the simultaneous transmission of information and infectious disease. Oikos 2020, 129, 1271–1288. [Google Scholar] [CrossRef]
  14. Agaba, G.O.; Kyrychko, Y.N.; Blyuss, K.B. Mathematical model for the impact of awareness on the dynamics of infectious diseases. Math. Biosci. 2017, 286, 22–30. [Google Scholar] [CrossRef] [PubMed] [Green Version]
  15. Greenhalgh, D.; Rana, S.; Samanta, S.; Sardar, T.; Bhattacharya, S.; Chattopadhyay, J. Awareness programs control infectious disease–multiple delay induced mathematical model. Appl. Math. Comput. 2015, 251, 539–563. [Google Scholar] [CrossRef] [Green Version]
  16. Lipsitch, M.; Santillana, M. Enhancing Situational Awareness to Prevent Infectious Disease Outbreaks from Becoming Catastrophic. In Global Catastrophic Biological Risks; Inglesby, T.V., Adalja, A.A., Eds.; Springer International Publishing: Cham, Switzerland, 2019; pp. 59–74. [Google Scholar]
  17. Huaman, M.A.; Araujo-Castillo, R.V.; Soto, G.; Neyra, J.M.; Quispe, J.A.; Fernandez, M.F.; Mundaca, C.C.; Blazes, D.L. Impact of two interventions on timeliness and data quality of an electronic disease surveillance system in a resource limited setting (Peru): A prospective evaluation. BMC Med. Inform. Decis. Mak. 2009, 9, 16. [Google Scholar] [CrossRef] [PubMed] [Green Version]
  18. Thomas, J.C.; Sampson, L.A. High rates of incarceration as a social force associated with community rates of sexually transmitted infection. J. Infect. Dis. 2005, 191, S55–S60. [Google Scholar] [CrossRef] [Green Version]
  19. Marathe, M.V.; Ramakrishnan, N. Recent advances in computational epidemiology. IEEE Intell. Syst. 2013, 28, 96–101. [Google Scholar] [CrossRef] [PubMed] [Green Version]
  20. World Health Organization. Medicines in Health Systems: Advancing Access, Affordability and Appropriate Use. Available online: https://apps.who.int/iris/bitstream/handle/10665/179197/9789241507622_eng.pdf?sequence=1&isAllowed=y (accessed on 15 November 2020).
  21. Centers for Disease Control and Prevention. Epidemiology: Transmission of the Dengue Virus. Available online: https://www.cdc.gov/dengue/epidemiology/index.html (accessed on 9 September 2017).
  22. European Centre for Disease Prevention and Control. How is Zika Virus Transmitted? Available online: https://ecdc.europa.eu/en/publications-data/how-zika-virus-transmitted (accessed on 10 September 2017).
  23. Pan American Health Organization. Tool for the Diagnosis and Care of Patients with Suspected Arboviral Diseases. Available online: https://iris.paho.org/handle/10665.2/33895 (accessed on 12 November 2017).
  24. Aguiar, M.; Stollenwerk, N.; Halstead, S.B. The risks behind Dengvaxia recommendation. Lancet Infect. Dis. 2016, 16, 882–883. [Google Scholar] [CrossRef]
  25. Ferguson, N.M.; Rodríguez-Barraquer, I.; Dorigatti, I.; Mier-y-Teran-Romero, L.; Laydon, D.J.; Cummings, D.A.T. Benefits and risks of the Sanofi-Pasteur dengue vaccine: Modeling optimal deployment. Science 2016, 353, 1033–1036. [Google Scholar] [CrossRef] [Green Version]
  26. Grimm, V.; Berger, U.; Bastiansen, F.; Eliassen, S.; Ginot, V.; Giske, J.; Goss-Custard, J.; Grand, T.; Heinz, S.K.; Huse, G.; et al. A standard protocol for describing individual-based and agent-based models. Ecol. Model. 2006, 198, 115–126. [Google Scholar] [CrossRef]
  27. World Health Organization. Dengue: Guidelines for Diagnosis, Treatment, Prevention and Control. Available online: https://apps.who.int/iris/bitstream/handle/10665/44188/9789241547871_eng.pdf?sequence=1&isAllowed=y (accessed on 15 November 2020).
  28. World Health Organization. Dengue Control. Available online: http://www.who.int/denguecontrol/human/en/ (accessed on 20 November 2017).
  29. Araújo, H.R.C.D. Caracterização Morfológica dos Hemócitos do Aedes Aegypti e do Aedes Albopictus e a Resposta Imune dos Hemócitos do Aedes Aegypti Após a Infecção pelo Dengue Virus. Ph.D. Thesis, Fundação Oswaldo Cruz, Centro de Pesquisas René Rachou, Belo Horizonte/MG, Brazil, 2011. [Google Scholar]
  30. Yakob, L.; Clements, A.C. A mathematical model of chikungunya dynamics and control: The major epidemic on Reunion Island. PLoS ONE 2013, 8, e57448. [Google Scholar] [CrossRef] [PubMed]
  31. Ross, R.; Thomson, D. Some enumerative studies on malarial fever. Proc. R. Soc. Lond. 1910, 83, 159–173. [Google Scholar] [CrossRef]
  32. Kermack, W.O.; McKendrick, A.G. A contribution to the mathematical theory of epidemics. Proc. R. Soc. Lond. A Math. Phys. Eng. Sci. 1927, 115, 700–721. [Google Scholar]
  33. Dumont, Y.; Chiroleu, F.; Domerg, C. On a temporal model for the Chikungunya disease: Modeling, theory and numerics. Math. Biosci. 2008, 213, 80–91. [Google Scholar] [CrossRef] [PubMed]
  34. World Mosquito Program. Wolbachia. Available online: http://www.eliminatedengue.com/our-research/wolbachia (accessed on 10 October 2017).
  35. Murray, J.V.; Jansen, C.C.; De Barro, P. Risk Associated with the Release of Wolbachia-Infected Aedes aegypti Mosquitoes into the Environment in an Effort to Control Dengue. Front. Public Health 2016, 4, 1–12. [Google Scholar] [CrossRef] [PubMed] [Green Version]
  36. Scheidegger, A.P.G.; Banerjee, A. An agent-based model to investigate behavior impacts on vector-borne disease spread. In Proceedings of the 2017 Winter Simulation Conference (WSC), Las Vegas, NV, USA, 3–6 December 2017; IEEE: Piscataway, NJ, USA, 2017. [Google Scholar] [CrossRef]
Figure 5. Boxplot of output responses: (a) total number of infected individuals; (b) duration of the epidemic.
Modelling 02 00009 g005
Figure 6. Boxplot of total number of epidemic waves.
Modelling 02 00009 g006
Figure 7. Evolution of epidemic in a large population: (a) total number of individuals per state; (b) total number of mosquitoes per state.
Modelling 02 00009 g007
Figure 8. Summary of output responses means per baseline level: (a) low-level baseline; (b) high-level baseline.
Modelling 02 00009 g008
Figure 9. The relation between the output responses per parameter: (a) duration of the epidemic vs. the total number of infected individuals; (b) number of waves vs. the total number of infected individuals.
Modelling 02 00009 g009
Figure 10. The relation between the number of waves vs. the duration of the epidemic per parameter.
Modelling 02 00009 g010
Figure 11. The relation between the output responses.
Modelling 02 00009 g011
Table 8. Results of the paired t-test for the baseline model.
Output Responsep-Value95% Confidence IntervalConclusion
Total number of infected individuals<0.0001[545.849, 564.511]Statistically different
Duration of epidemic in days<0.0001[55.313, 82.127]Statistically different
Number of epidemic waves0.1429[−1.734, 0.254]Not statistically different
Runtime per replication in seconds<0.0001[59.794, 62.100]Statistically different
Table 9. ANOVA results for Model B (data quality) per baseline level. Bold font denotes statistical significance at α-level of 0.05.
#Input Data DescriptionTotal Number of Infected IndividualsNumber of Epidemic WavesDuration of the Epidemic in DaysRuntime Per Replication in Seconds
B1B2B1B2B1B2B1B2
Model p-ValueModel p-ValueModel p-ValueModel p-ValueModel p-ValueMODEL P-VALUEModel p-ValueModel p-Value
<0.001<0.001<0.001<0.001<0.001<0.001<0.001<0.001
Input p-ValueInput p-ValueInput p-ValueInput p-ValueInput p-ValueInput p-ValueInput p-ValueInput p-Value
1Mosquito population size0.9502<0.00010.9747<0.00010.9759<0.00010.0504<0.0001
2Initial number of infectious mosquitoes0.0001<0.0001<0.0001<0.0001<0.0001<0.00010.8953<0.0001
3Mosquito daily latent rate<0.0001<0.00010.00080.00160.0249<0.00010.0714<0.0001
4Mosquito daily mortality rate<0.0001<0.0001<0.00010.0003<0.0001<0.00010.0767<0.0001
5Daily infectivity rate from mosquito to human<0.0001<0.00010.20340.03060.01590.01910.0799<0.0001
6Human population size<0.0001<0.0001<0.0001<0.0001<0.0001<0.0001<0.0001<0.0001
7Initial number of infectious humans<0.0001<0.0001<0.0001<0.0001<0.0001<0.0001<0.0001<0.0001
8Human daily latent rate0.98930.14350.00010.0046<0.0001<0.00010.0626<0.0001
9Human daily recovery rate<0.0001<0.0001<0.0001<0.0001<0.0001<0.00010.0790<0.0001
10Daily infectivity rate from human to mosquito0.0117<0.00010.40500.34050.08910.00520.0829<0.0001
Table 10. Tukey multiple comparison results for Model B (data quality) per baseline level. Bold font denotes statistical significance at α-level of 0.05.
Model Baseline LevelInputPair Level Being Tested for the InputTotal Number of Infected IndividualsNumber of Epidemic WavesDuration of the Epidemic in DaysRuntime Per Replication in Seconds
Level 1Level 2p-Valuep-Valuep-Valuep-Value
B11B1B2N/AN/AN/AN/A
B1C1N/AN/AN/AN/A
B1C2N/AN/AN/AN/A
B1C3N/AN/AN/AN/A
B2C1N/AN/AN/AN/A
B2C2N/AN/AN/AN/A
B2C3N/AN/AN/AN/A
C1C2N/AN/AN/AN/A
C1C3N/AN/AN/AN/A
C2C3N/AN/AN/AN/A
B21B2B1<0.00010.04640.07580.0004
B2C1<0.00010.36390.44050.9997
B2C2<0.00010.29300.62520.0125
B2C3<0.00010.00130.00750.0002
B1C1<0.0001<0.00010.00020.0008
B1C20.00030.92730.76900.8825
B1C30.97070.82160.93870.9998
C1C2<0.00010.00160.01710.0234
C1C3<0.0001<0.0001<0.00010.0004
C2C3<0.00010.32740.29600.7983
B12B1B20.0001<0.0001<0.0001N/A
B1C10.11600.00160.0328N/A
B1C20.0023<0.0001<0.0001N/A
B1C3N/AN/AN/AN/A
B2C10.17190.00510.0072N/A
B2C20.88370.38700.5617N/A
B2C3N/AN/AN/AN/A
C1C20.55540.30700.2213N/A
C1C3N/AN/AN/AN/A
C2C3N/AN/AN/AN/A
B22B2B1<0.0001<0.0001<0.0001<0.0001
B2C1<0.0001<0.00010.19210.1167
B2C2<0.0001<0.0001<0.00010.0678
B2C3<0.0001<0.0001<0.00010.9978
B1C1<0.0001<0.0001<0.00010.0055
B1C2<0.00010.99510.00760.0117
B1C3<0.0001<0.0001<0.0001<0.0001
C1C2<0.0001<0.0001<0.00010.9995
C1C3<0.0001<0.0001<0.00010.0525
C2C3<0.0001<0.0001<0.00010.0280
B13B1C10.04990.10760.9168N/A
B1C20.01490.00840.8261N/A
B1C30.18820.00080.0201N/A
C1C20.97520.79930.9966N/A
C1C3<0.00010.40400.1111N/A
C2C3<0.00010.91690.1755N/A
B23B2C1<0.00010.08360.0402<0.0001
B2C2<0.00010.00530.0003<0.0001
B2C3<0.00010.9882<0.0001<0.0001
C1C20.05060.78280.49410.9996
C1C3<0.00010.17230.04560.0035
C2C3<0.00010.01520.62880.0025
B14B1C10.51570.88340.2250N/A
B1C20.0140<0.0001<0.0001N/A
B1C30.00110.67970.6794N/A
C1C2<0.0001<0.0001<0.0001N/A
C1C30.08370.25030.8584N/A
C2C3<0.00010.0006<0.0001N/A
B24B2C1<0.00010.91590.4339<0.0001
B2C2<0.00010.0014<0.0001<0.0001
B2C3<0.00010.01240.0700<0.0001
C1C2<0.00010.0138<0.00010.0048
C1C3<0.00010.07720.00050.5340
C2C3<0.00010.9269<0.0001<0.0001
B15B1C10.9636N/A0.9985N/A
B1C20.0703N/A0.9970N/A
B1C30.0319N/A0.0433N/A
C1C20.2040N/A0.9833N/A
C1C30.0072N/A0.0275N/A
C2C3<0.0001N/A0.0733N/A
B25B2C10.62240.56440.7787<0.0001
B2C2<0.00010.08360.0292<0.0001
B2C3<0.00010.99390.0755<0.0001
C1C2<0.00010.70750.26520.6238
C1C3<0.00010.40350.46080.0728
C2C3<0.00010.04290.98460.0017
B16B1B2<0.0001<0.0001<0.0001<0.0001
B1C1<0.0001<0.0001<0.0001<0.0001
B1C2<0.0001<0.0001<0.0001<0.0001
B1C3<0.0001<0.0001<0.0001<0.0001
B2C1<0.00010.0040<0.0001<0.0001
B2C2<0.00010.5257<0.0001<0.0001
B2C3<0.00010.0061<0.0001<0.0001
C1C2<0.0001<0.0001<0.0001<0.0001
C1C3<0.0001<0.0001<0.0001<0.0001
C2C30.00030.34510.0029<0.0001
B26B2B1<0.0001<0.0001<0.0001<0.0001
B2C1<0.0001<0.0001<0.00010.0989
B2C2<0.0001<0.0001<0.0001<0.0001
B2C3<0.0001<0.0001<0.0001<0.0001
B1C1<0.00010.4023<0.0001<0.0001
B1C2<0.00010.9912<0.0001<0.0001
B1C3<0.0001<0.0001<0.0001<0.0001
C1C2<0.00010.1777<0.0001<0.0001
C1C3<0.0001<0.0001<0.0001<0.0001
C2C3<0.0001<0.0001<0.0001<0.0001
B17B1C10.72410.96100.94070.0573
B1C2<0.0001<0.0001<0.00010.0317
B1C3<0.0001<0.0001<0.00010.0657
C1C2<0.0001<0.0001<0.0001<0.0001
C1C3<0.0001<0.0001<0.00010.9999
C2C3<0.0001<0.0001<0.0001<0.0001
B27B2C1<0.0001<0.0001<0.0001<0.0001
B2C20.00370.23180.0897<0.0001
B2C30.00830.60370.0651<0.0001
C1C2<0.0001<0.0001<0.00010.3773
C1C3<0.0001<0.0001<0.00010.0786
C2C3<0.00010.0008<0.00010.8586
B18B1C1N/A0.64300.8663N/A
B1C2N/A0.02970.0932N/A
B1C3N/A0.37020.1223N/A
C1C2N/A0.38700.4082N/A
C1C3N/A0.02730.0155N/A
C2C3N/A<0.0001<0.0001N/A
B28B2C1N/A0.46200.3110<0.0001
B2C2N/A0.33070.0008<0.0001
B2C3N/A0.44220.0060<0.0001
C1C2N/A0.99590.15150.9987
C1C3N/A0.0168<0.00010.9998
C2C3N/A0.0082<0.00010.9999
B19B1C10.95980.85770.9324N/A
B1C20.45920.69780.0010N/A
B1C30.0007<0.00010.2521N/A
C1C20.20310.2372<0.0001N/A
C1C30.0043<0.00010.5968N/A
C2C3<0.0001<0.0001<0.0001N/A
B29B2C10.34650.48220.8990<0.0001
B2C2<0.00010.0042<0.0001<0.0001
B2C3<0.0001<0.00010.4452<0.0001
C1C2<0.0001<0.0001<0.00010.2078
C1C3<0.0001<0.00010.12840.3175
C2C3<0.0001<0.0001<0.00010.0015
B110B1C10.7481N/AN/AN/A
B1C20.0981N/AN/AN/A
B1C30.8307N/AN/AN/A
C1C20.5636N/AN/AN/A
C1C30.2495N/AN/AN/A
C2C30.0090N/AN/AN/A
B210B2C1<0.0001N/A0.9998<0.0001
B2C2<0.0001N/A1.0000<0.0001
B2C3<0.0001N/A0.0171<0.0001
C1C2<0.0001N/A0.99980.8493
C1C3<0.0001N/A0.02200.4090
C2C3<0.0001N/A0.01730.0855
Table 11. ANOVA results for Model C (coupled human behavior and dengue spread model) per baseline level. Bold font denotes statistical significance at α-level of 0.05.
FactorTotal Number of Infected IndividualsNumber of Epidemic WavesDuration of the Epidemic in DaysRuntime per Replication in Seconds
Low Baseline (B1)High Baseline (B2)Low Baseline (B1)High Baseline (B2)Low Baseline (B1)High Baseline (B2)Low Baseline (B1)High Baseline (B2)
Model p-valueModel p-valueModel p-valueModel p-valueModel p-valueModel p-valueModel p-valueModel p-value
0.00020.08370.03980.54390.04410.56210.9999<0.0001
Factor p-valueFactor p-valueFactor p-valueFactor p-valueFactor p-valueFactor p-valueFactor p-valueFactor p-value
Individual behavior, no time to switch behavior, low percentage of infectious individuals to trigger behavior, low cautious factor0.3478N/A0.3251N/A0.3412N/AN/A0.0954
Individual behavior, no time to switch behavior, high percentage of infectious individuals to trigger behavior, low cautious factor0.0398N/A0.7511N/A0.6404N/AN/A0.5011
Individual behavior, no time to switch behavior, low percentage of infectious individuals to trigger behavior, large cautious factor0.0123N/A0.3251N/A0.2149N/AN/A0.4266
Individual behavior, no time to switch behavior, high percentage of infectious individuals to trigger behavior, large cautious factor0.0604N/A0.2421N/A0.5538N/AN/A0.0541
Individual behavior, low time switch behavior, low percentage of infectious individuals to trigger behavior0.7592N/A0.8468N/A0.5492N/AN/A<0.0001
Individual behavior, low time switch behavior, high percentage of infectious individuals to trigger behavior0.5851N/A0.0114N/A0.2764N/AN/A0.3715
Individual behavior, large time switch behavior, low percentage of infectious individuals to trigger behavior0.6930N/A0.8582N/A0.0358N/AN/A<0.0001
Individual behavior, large time switch behavior, high percentage of infectious individuals to trigger behavior0.3519N/A0.2956N/A0.5883N/AN/A0.0326
Population behavior, no time to switch behavior, low percentage of infectious individuals to trigger behavior, low cautious factor0.0005N/A0.3565N/A0.3951N/AN/A0.5968
Population behavior, no time to switch behavior, high percentage of infectious individuals to trigger behavior, low cautious factor0.0567N/A0.6591N/A0.0147N/AN/A<0.0001
Population behavior, no time to switch behavior, low percentage of infectious individuals to trigger behavior, large cautious factor0.2410N/A0.0131N/A0.0287N/AN/A0.0779
Population behavior, no time to switch behavior, high percentage of infectious individuals to trigger behavior, large cautious factor0.5890N/A0.8099N/A0.5041N/AN/A0.0873
Population behavior, low time switch behavior, low percentage of infectious individuals to trigger behavior0.6930N/A0.6591N/A0.9993N/AN/A<0.0001
Population behavior, low time switch behavior, high percentage of infectious individuals to trigger behavior0.0011N/A0.2127N/A0.6046N/AN/A<0.0001
Population behavior, large time switch behavior, low percentage of infectious individuals to trigger behavior0.8657N/A0.9942N/A0.5766N/AN/A<0.0001
Population behavior, large time switch behavior, high percentage of infectious individuals to trigger behavior0.6871N/A0.1352N/A0.2518N/AN/A0.9207
Table 12. ANOVA results for Model D (multi-strain, multi-vector dengue spread model) per baseline level. Bold font denotes statistical significance at α-level of 0.05.
FactorTotal Number of Infected IndividualsNumber of Epidemic WavesDuration of the Epidemic in DaysRuntime Per Replication in Seconds
Low Baseline (B1)High Baseline (B2)Low Baseline (B1)High Baseline (B2)Low Baseline (B1)High Baseline (B2)Low Baseline (B1)High Baseline (B2)
Model p-valueModel p-valueModel p-valueModel p-valueModel p-valueModel p-valueModel p-valueModel p-value
<0.0001<0.0001<0.0001<0.0001<0.0001<0.0001<0.00010.0429
Factor p-valueFactor p-valueFactor p-valueFactor p-valueFactor p-valueFactor p-valueFactor p-valueFactor p-value
Multi-strain model<0.0001<0.0001<0.0001<0.0001<0.0001<0.0001<0.00010.4606
Multi-vector model<0.0001<0.0001<0.0001<0.0001<0.0001<0.0001<0.00010.2959
Multi-strain, multi-vector model<0.0001<0.0001<0.0001<0.0001<0.0001<0.0001<0.00010.0334
Publisher’s Note: MDPI stays neutral with regard to jurisdictional claims in published maps and institutional affiliations.

