For the theoretical performance analysis and identification of various influencing parameters, literature values were used. The model parameters from
Table 3 were applied as the initial parameters and compared with other literature values. A wide range of values was established in order to visually represents the governing equations. The name identifier for the literature values in the figures can be found in
Table A1. For the purpose of finding a suitable and well performing thick electrode, the best value for each parameter variation was identified and carried over to the next parameter study, as long as the parameter was not given by the preliminary study [
39]. The discharge curve and the normalised Li-ion concentration in the particles (lithiation) along the electrode when reaching the cut-off voltage were considered as quality criteria. Since many literature values are based on model fits, the suitability was critically examined for some parameters, especially with regard to thick electrodes.
3.2. Performance Tests
The performance of the battery depends not only on the design parameters but also on external circumstances such as the charge/discharge current or the temperature. Consequently, it is advisable to define the desired operating range of the battery first and then to determine the best possible parameters within the limits. As the main purpose here is to show tendencies, which should be taken into account in modelling and optimisation, a comparatively selected small current range between C/4 and 4C was used (for comparison: the smallest current in the LFP models noted C/25 [
62] and the largest 50C [
67]). As for the temperature, the range was limited to the parameters studied by Valøen [
41].
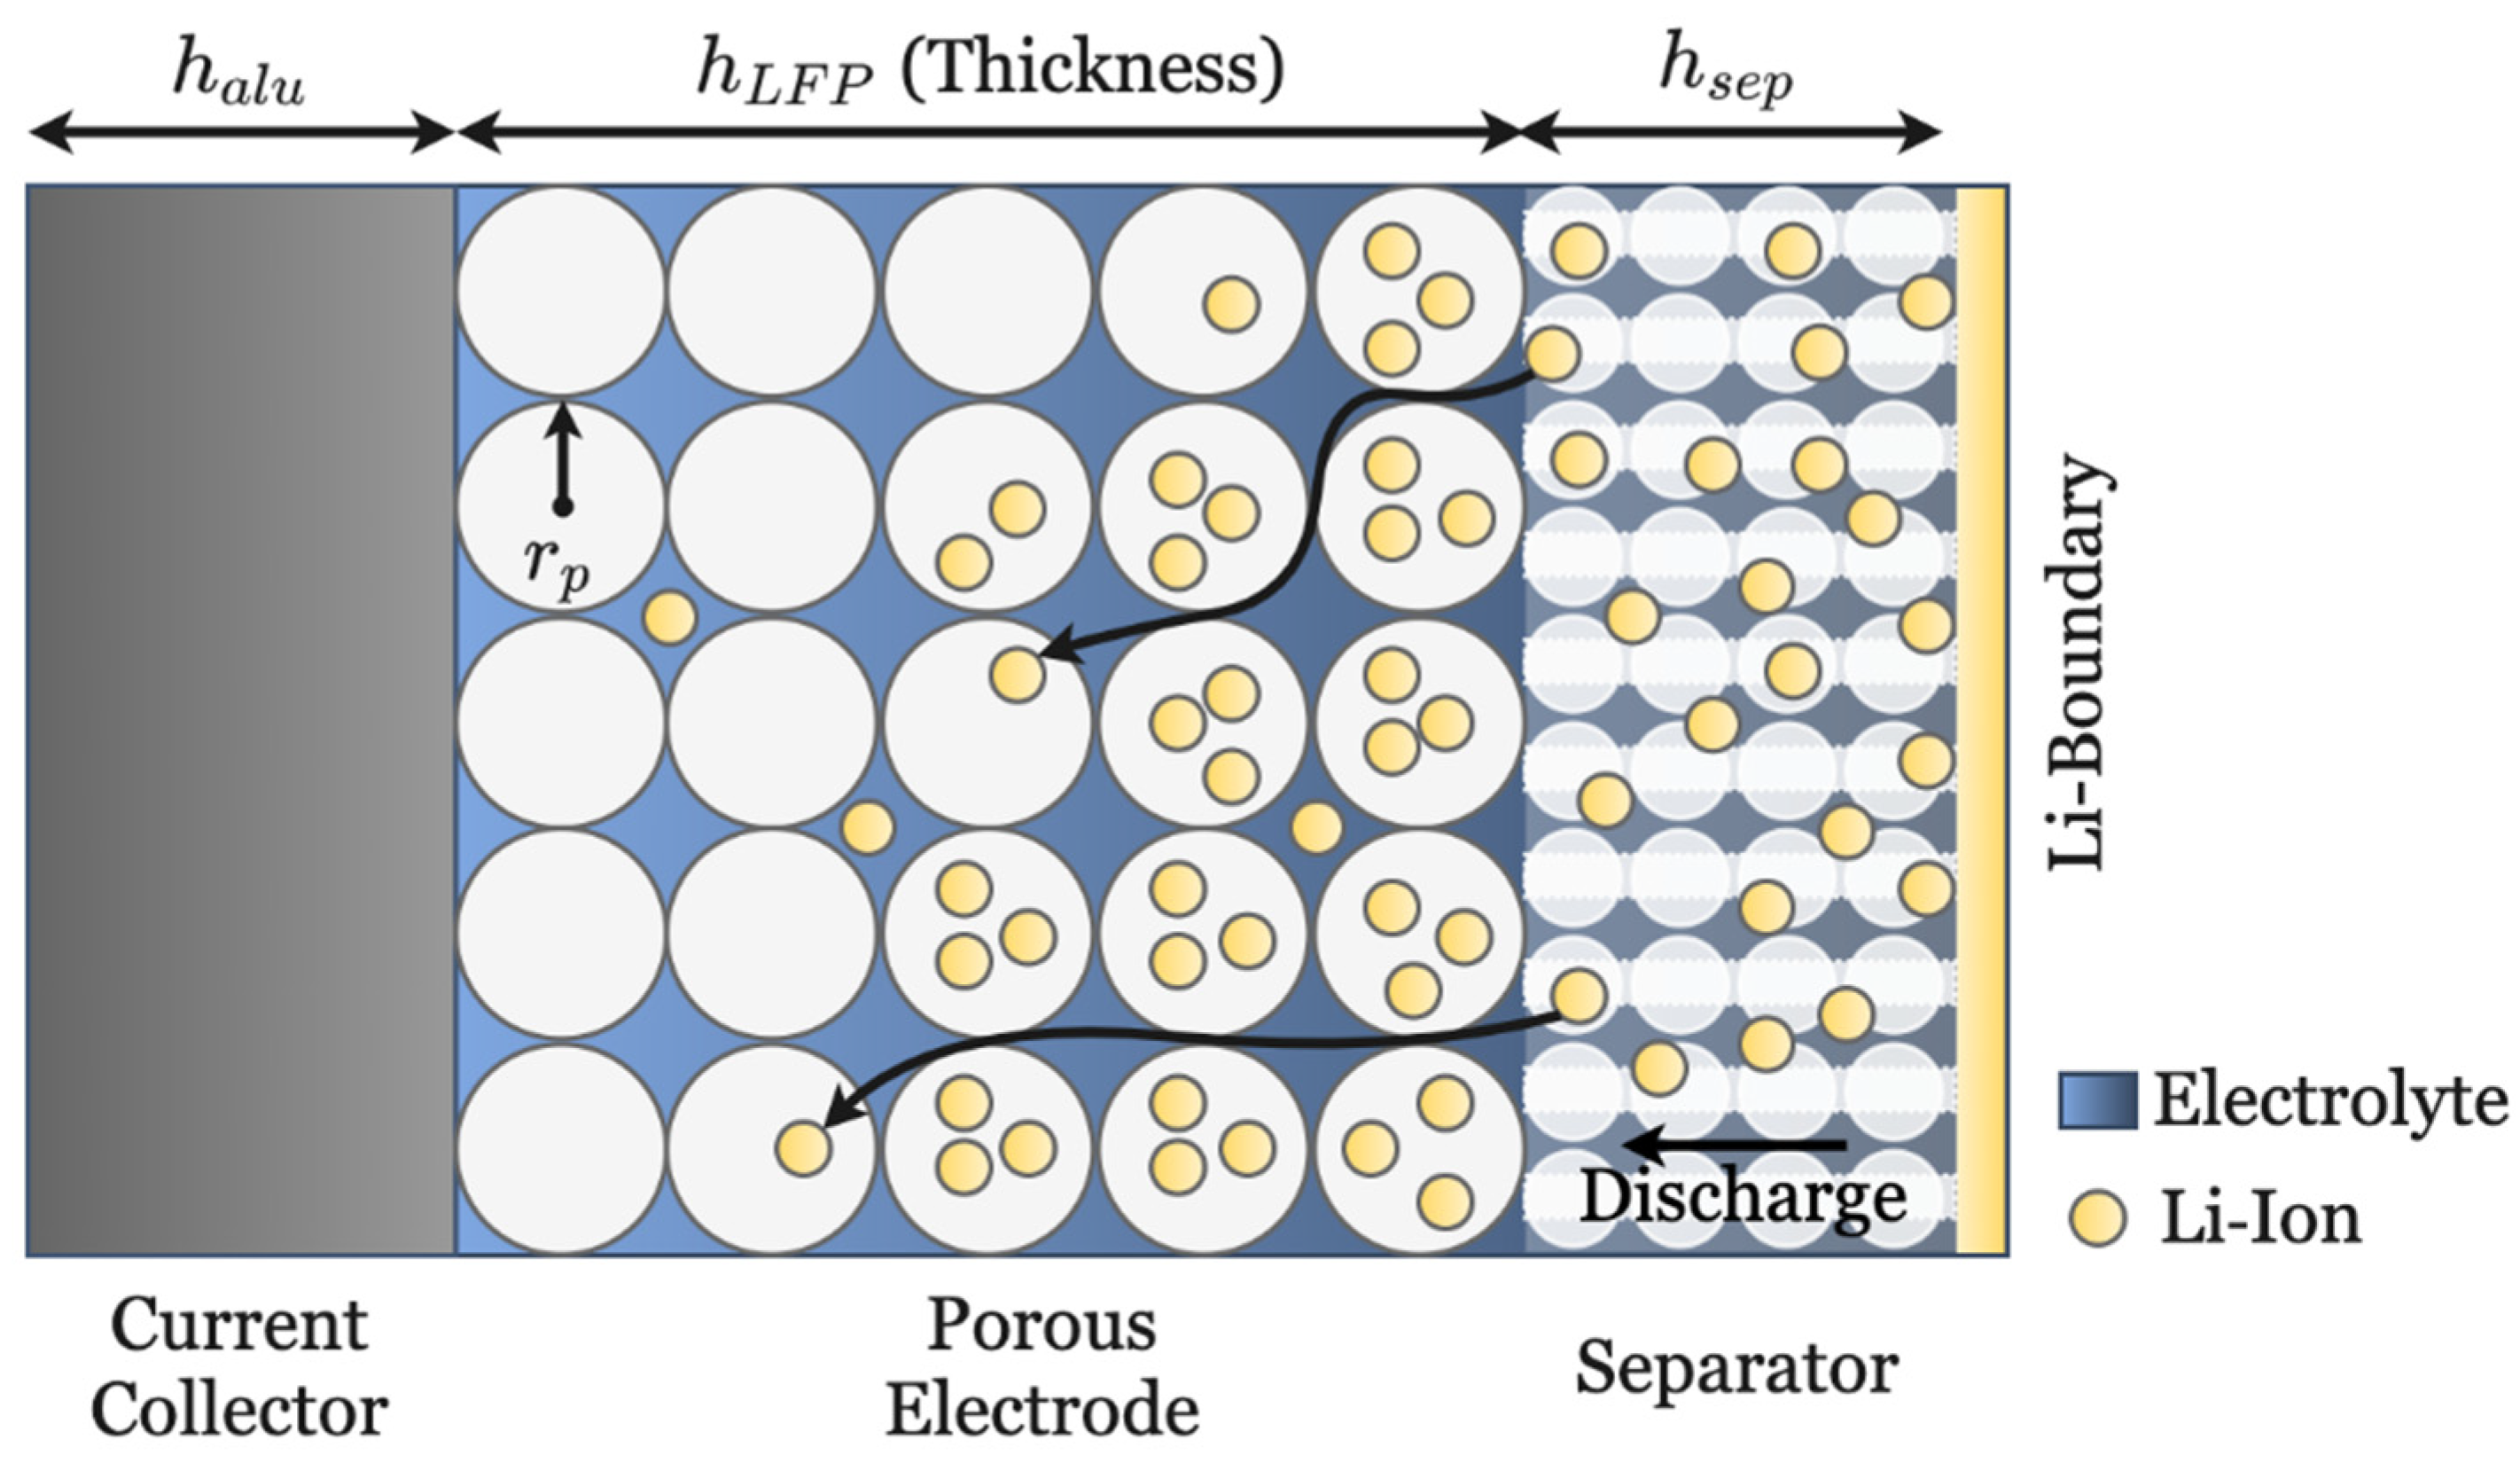
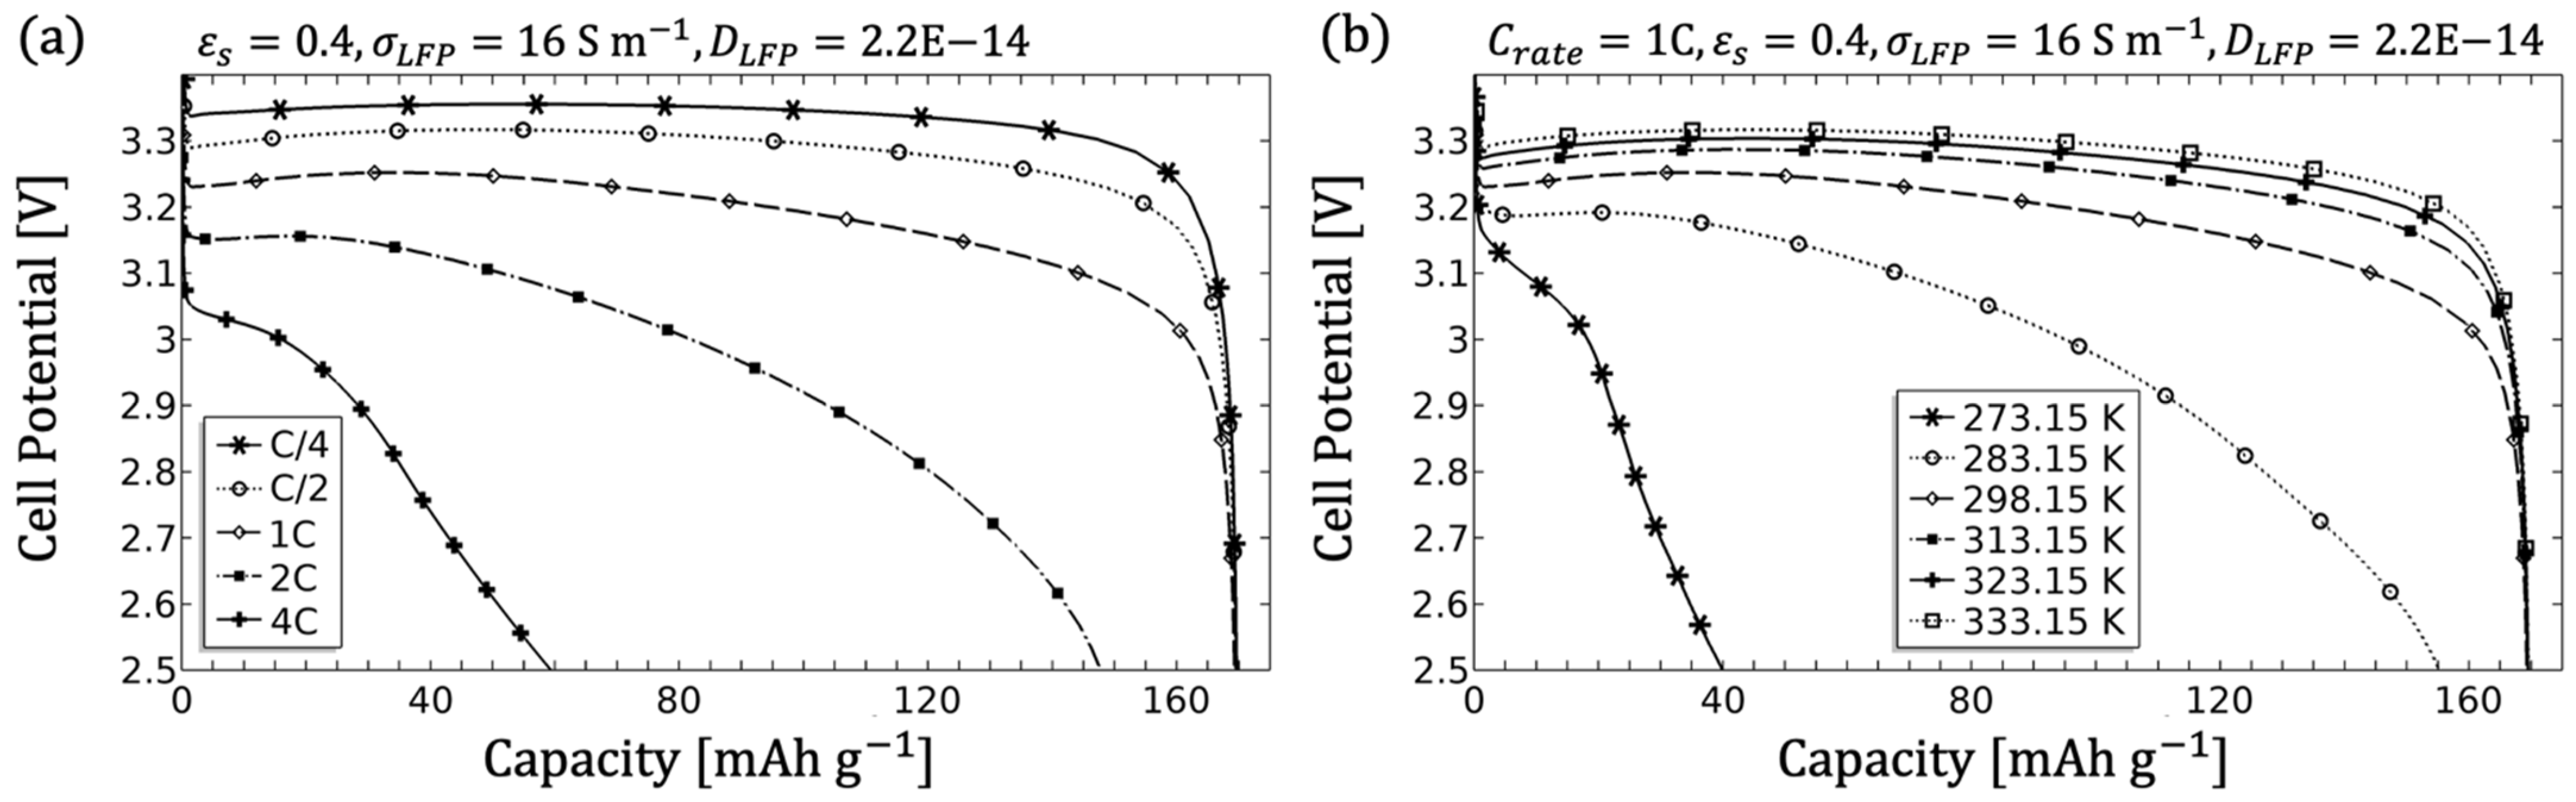
The single-structured electrode related to
Figure 2a, containing only spherical particles, was analysed in
Figure 14. The applied currents are coupled by the electroneutrality condition and influence both the electrode current density governed by Ohm’s law and the electrolyte current density and thus smaller currents show a better performance (shown in
Figure 14a). Moreover, higher currents lead to non-uniform lithiation with a stronger incidence near the separator, which increasingly inhibits the flow of ions into the electrode and finally results in a loss of capacity. As discussed for LCO by Kumaresan et al. using Valøen’s approach, the temperature cannot be neglected due to its influence on transport kinetics in both the electrolyte and the electrode [
71]. Although there is a macroscopic influence of the temperature (see
Figure 14b), some models disregard this dependence for the electrolyte [
14,
24,
26,
49,
53,
54,
62]. This is possibly due to the small effect of ~25 mV difference in the ohmic overpotential between 298 and 313 K (shown in
Figure 14b), which includes all temperature dependencies for the P2D approach. Li et al. emphasised the heat generation of a cylindrical 26650 LFP cell during discharge, which is mainly driven by the positive electrode [
27]. At 1C, the average cell temperature increased from 298 to 310 K and at an applied current of 5C, the temperature exceeded 333 K. This is outside the comfortable range between 288 and 308 K and can lead to rapid degradation and other unwanted side effects [
72], and the models are expected to result in unrealistic behaviour without appropriate temperature dependencies. Temperatures below 298 K decrease the ionic conductivity and diffusivity in both the electrolyte and in the electrode, resulting in visibly reduced capacity and average cell potential (depicted in
Figure 14b).
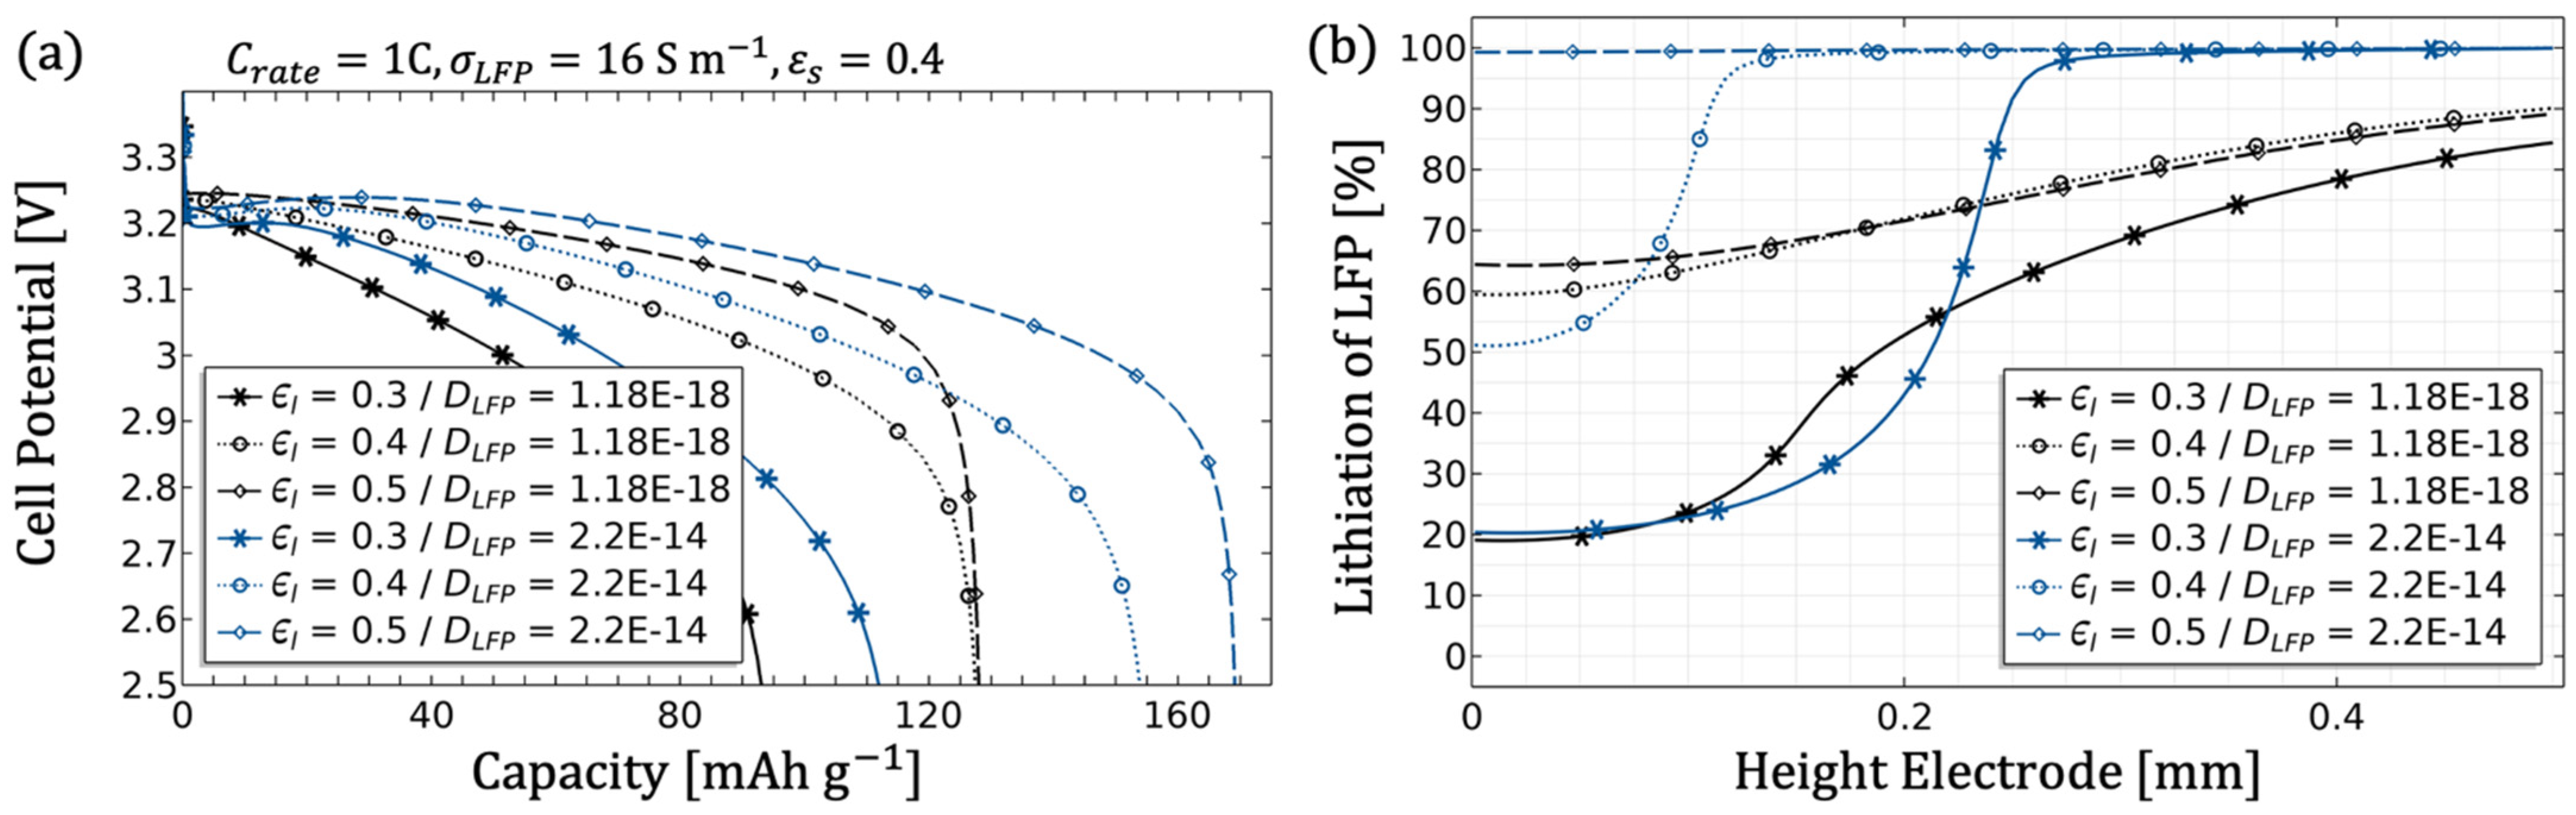
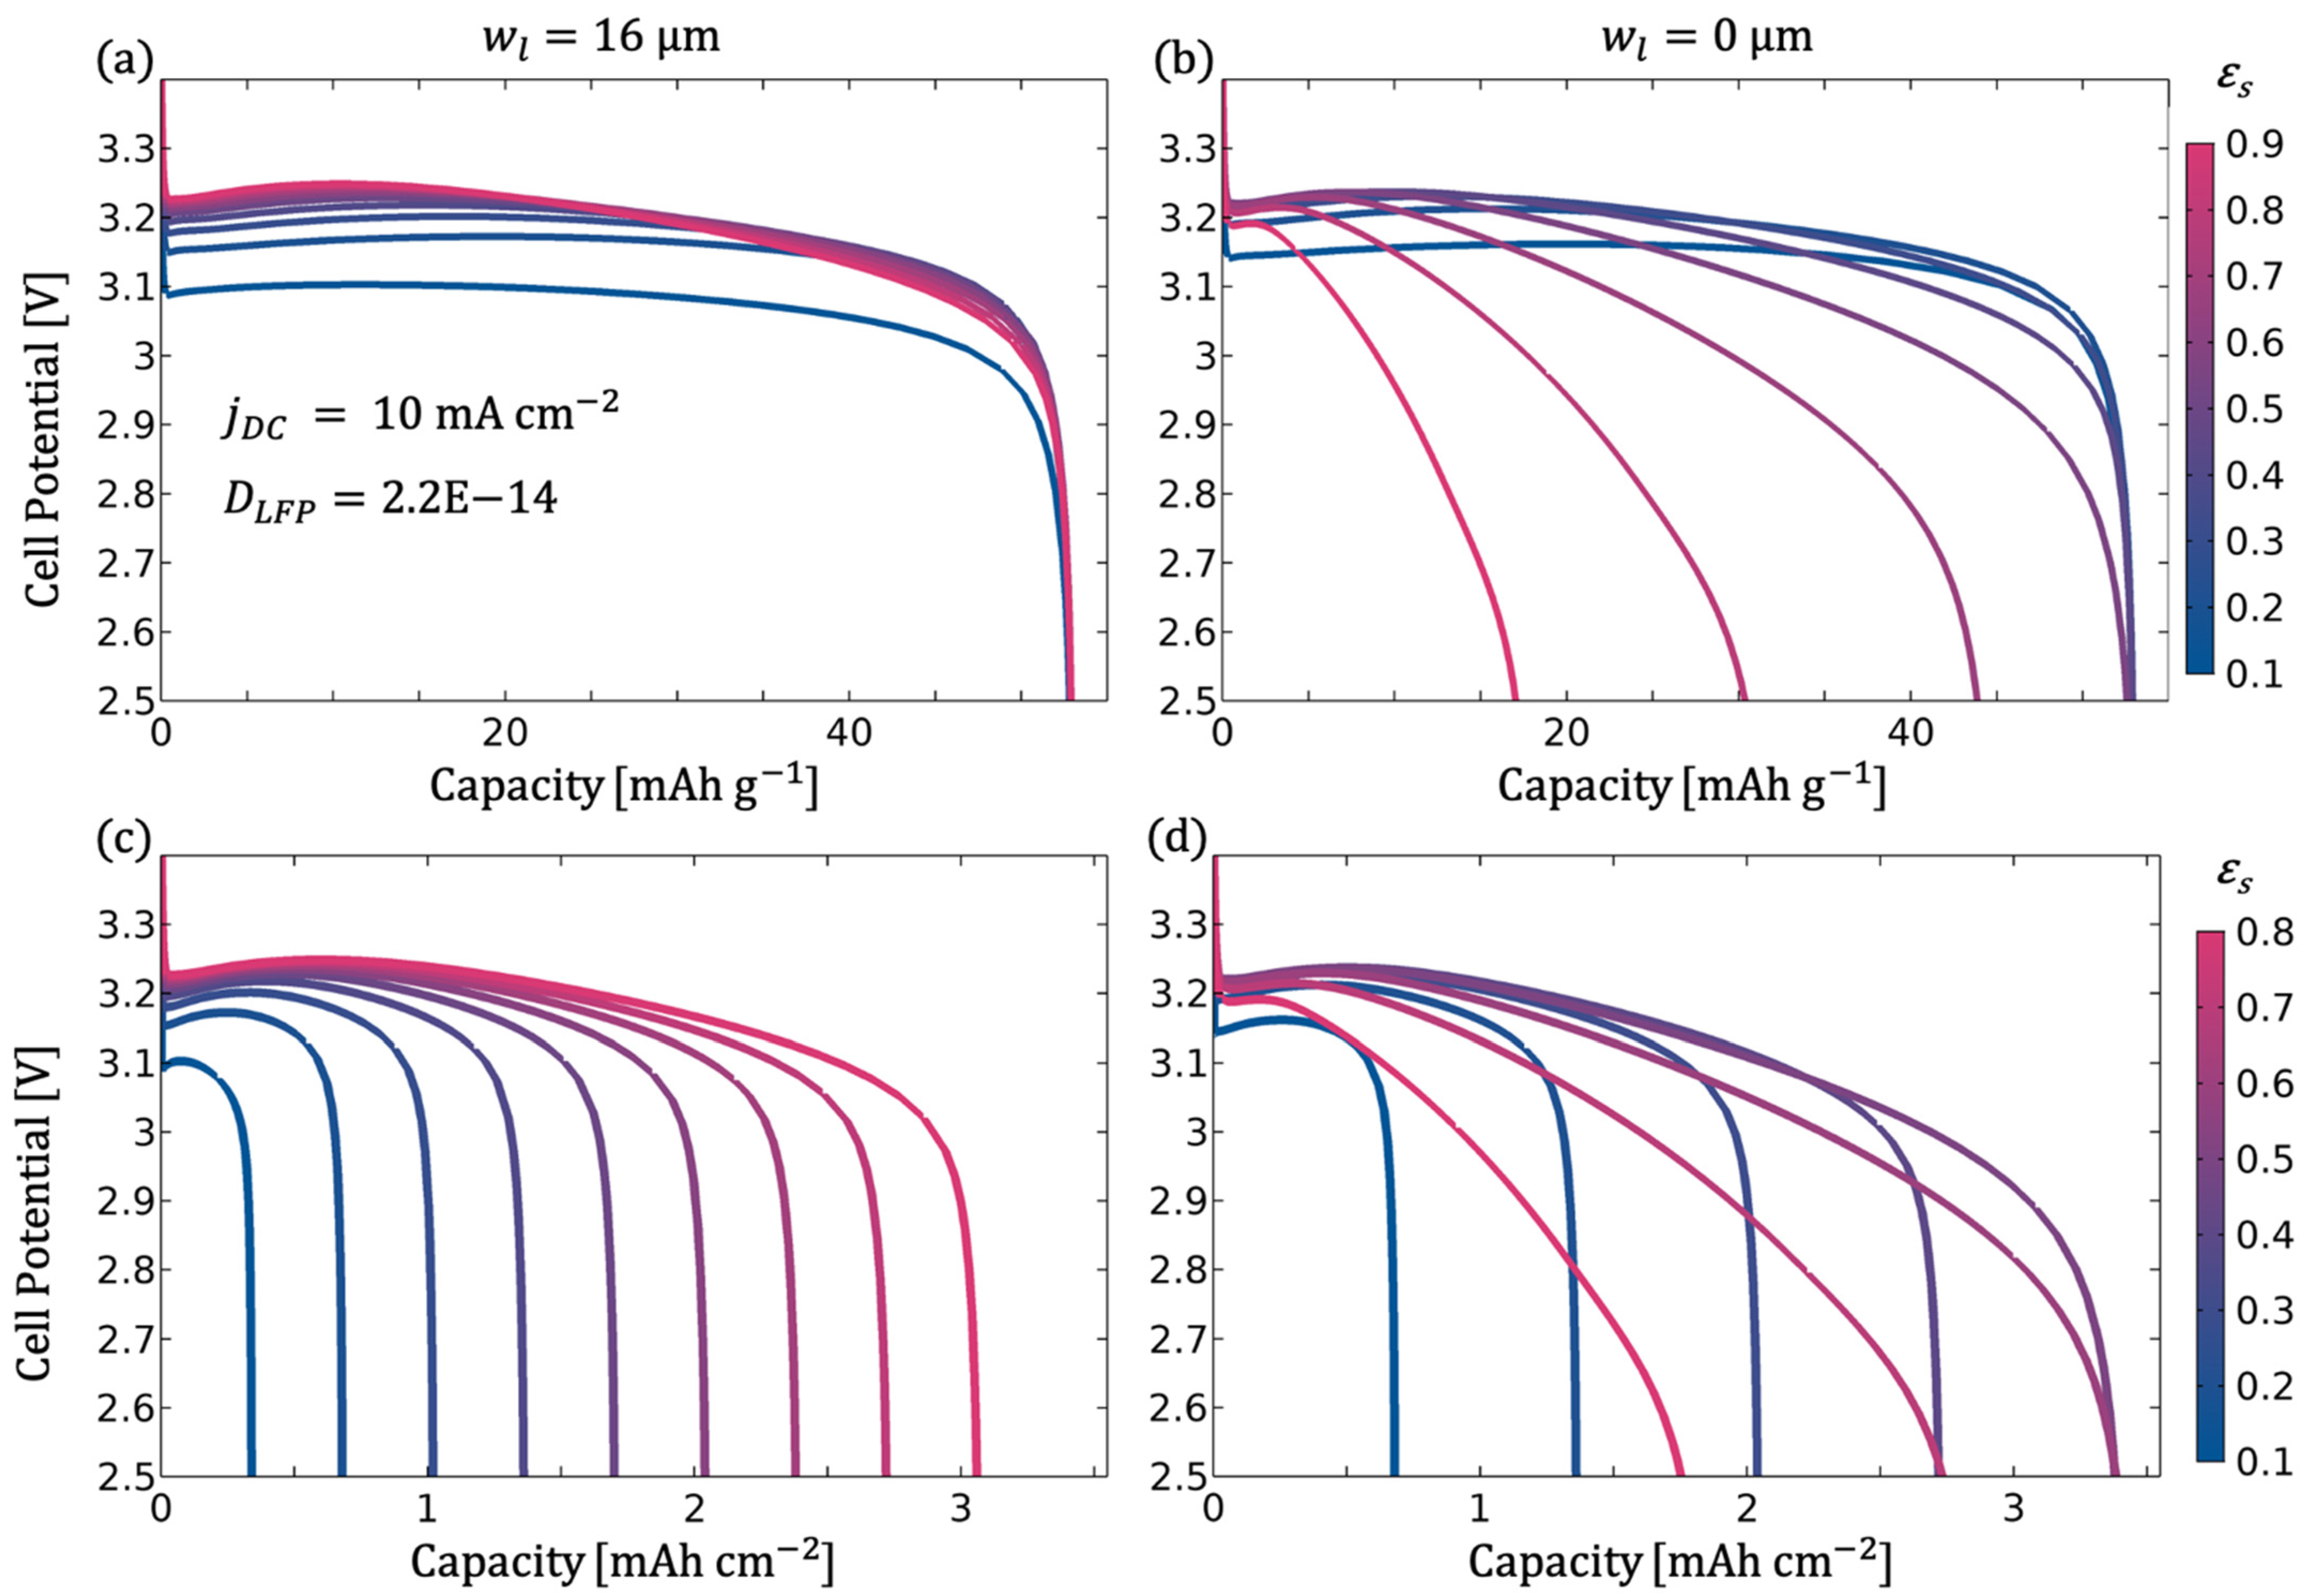
Since a significant influence of macrostructure and microstructure was noticeable during the simulation of the individual parameters, especially with regard to the optimisation of the LFP electrode, the parameter combination of porosity and electrolyte channel width is discussed in more detail below.
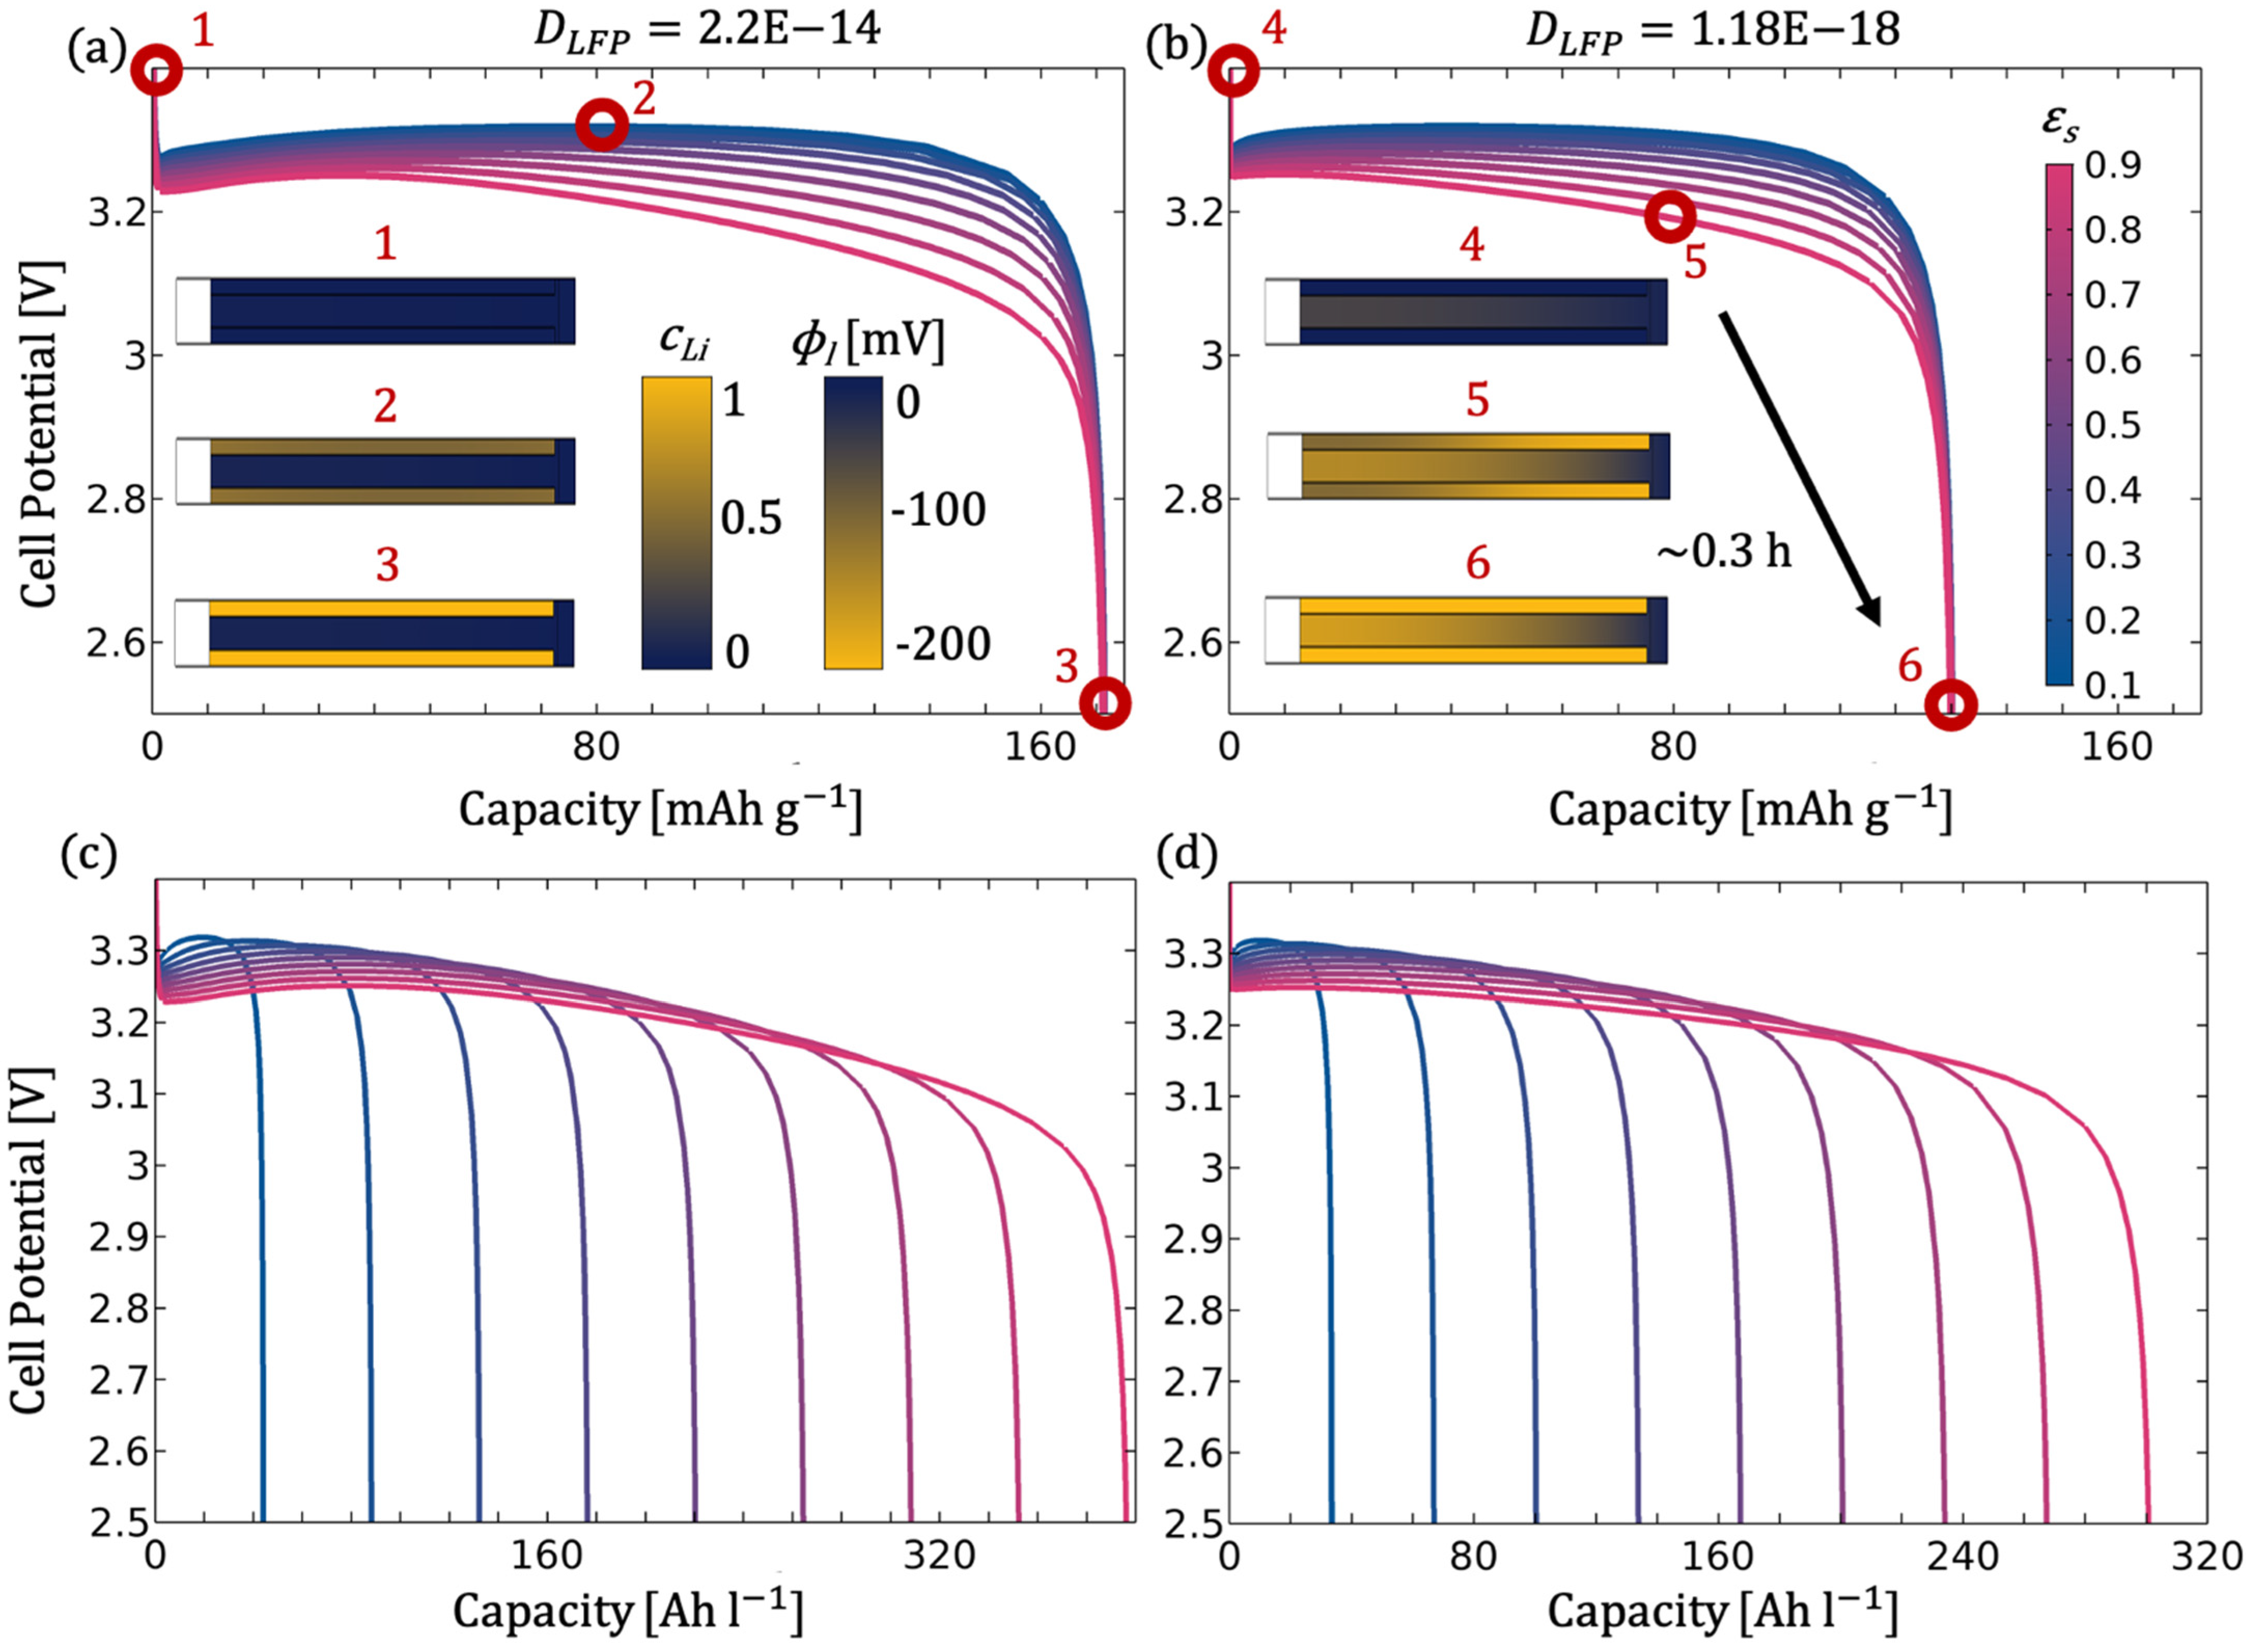
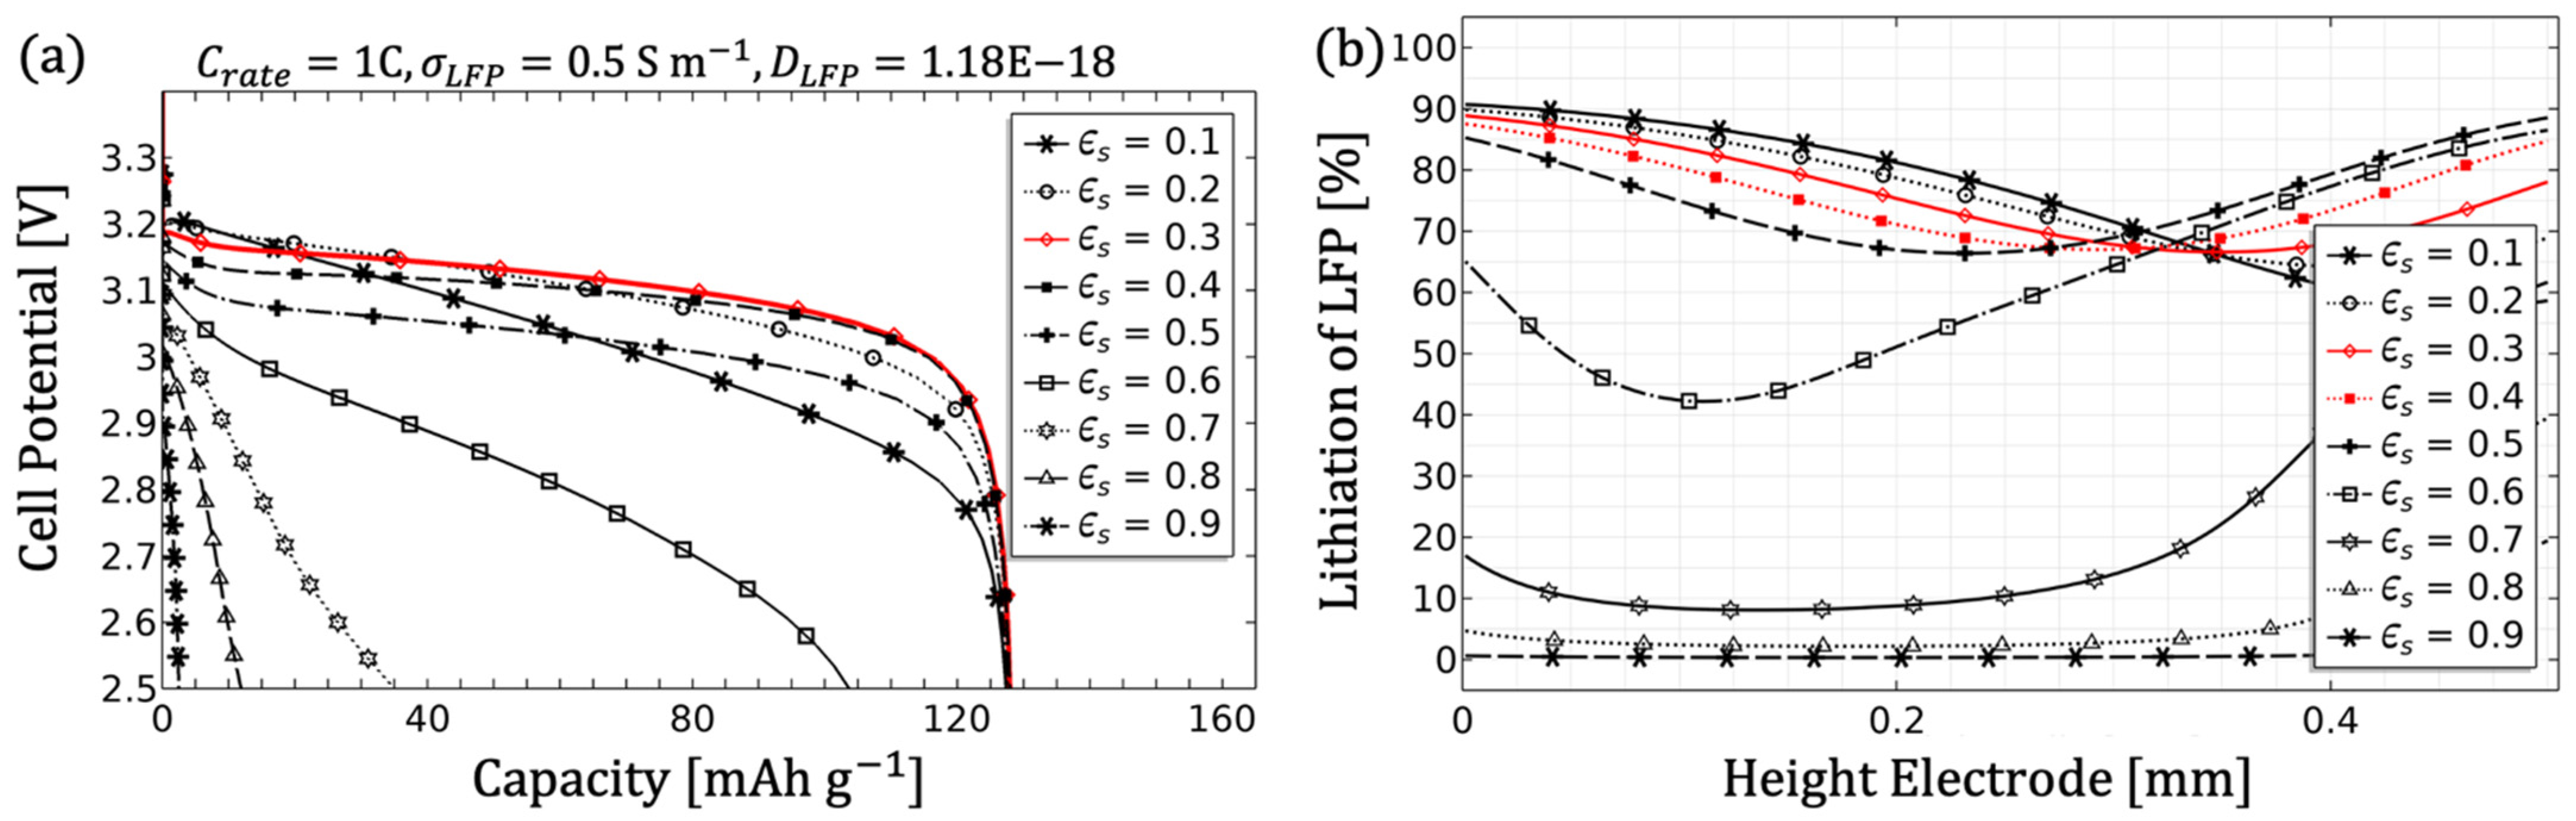
By reducing the porosity from 0.9 to 0.1, the simple relationship
proportionally increases the solid content of the electrode, when the filler content, e.g., binder, additives, etc., is neglected. More active mass means a higher capacity, but in theory and contrary to
Figure 3, the gravimetric energy density related to the active mass is not influenced. If the volume of the electrode does not change and the increase in material results from densification, an increase in volumetric capacity follows, as illustrated in the simulation in
Figure 15c,d). The loss of gravimetric capacity can be explained on the basis of the C-rate. In order to achieve 1C, the current is set by the amount of active material and increases accordingly with more LFP content. Thick and dense electrodes, however, are unsuitable for higher currents [
70], which leads to the aforementioned capacity loss by reducing the porosity (microstructure). Furthermore, an increased current also results in a higher ohmic overpotential (cf.
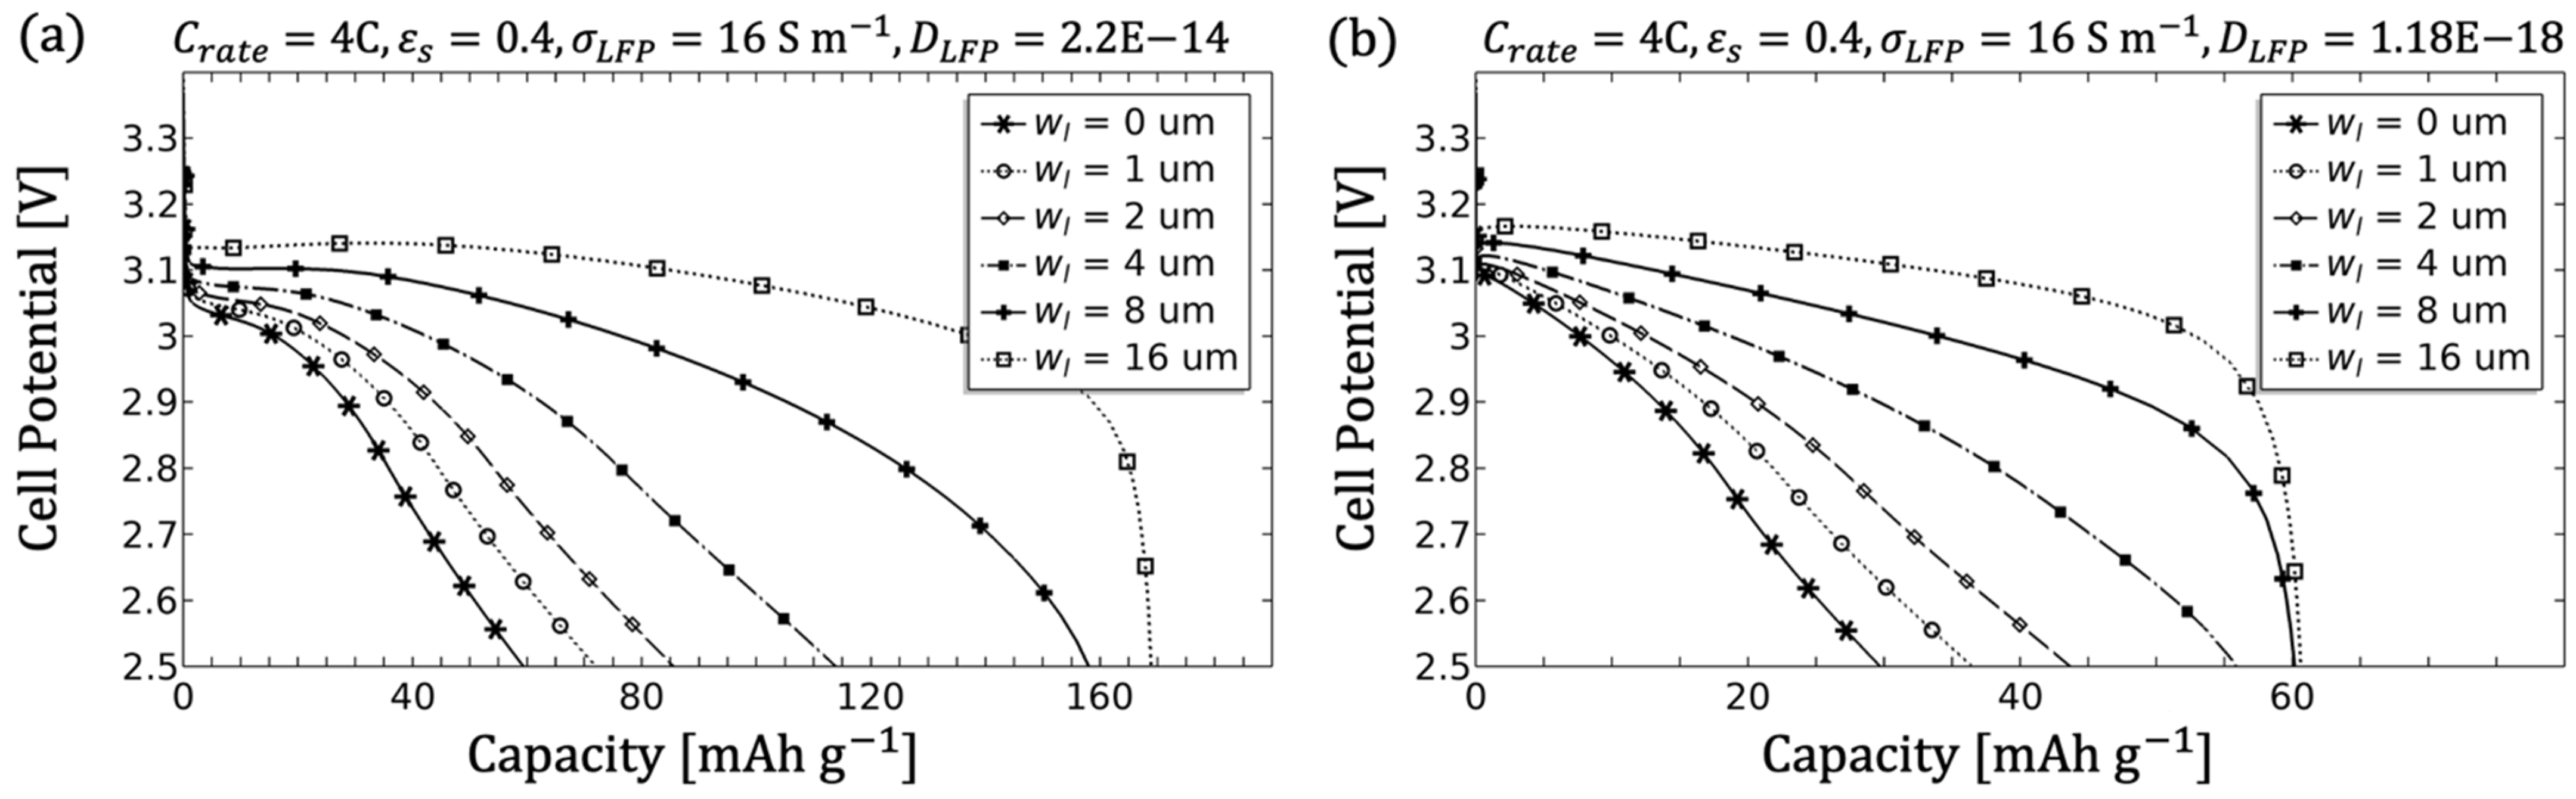
Figure 14a). By using a superimposed macrostructure, such as the given example of two lamellae, the latter can be completely lithiated for both a poor (
Figure 15b-6) and a good (
Figure 15a-3) solid diffusion coefficient. The microstructure with a solid content of 90% (
Figure 15b-5) further affects the uniformity of lithiation from the separator to the electrode, creating a concentration gradient in the electrolyte, which leads to an increase in overpotential up to 200 mV. The gravimetric capacity, however, remains unaffected due to the additional transport channel for Li ions.
The effect of the higher-level macrostructure is particularly evident when a specific performance of an application is required. If sufficient ion transport is ensured through the electrode or if adequate replenishment zones exist, densification of the active material in the substructure can even increase the performance and the capacity in relation to the cell area (see
Figure 16a,c).
However, in relation to the area or volume, a superimposed structure causes an increase in the porosity of the entire electrode (here at
µm this corresponds to
). As shown in
Figure 16b, a single structure with optimised parameters and a solid content of approx. 50% can even slightly improve the surface capacity (
Figure 16d), and the gravimetric capacity reaches the same value. Although the surface area is halved compared to the two-structure electrode, the surface capacity is not doubled. The effects on performance are more difficult to estimate, and the influence of tortuosity increases, which leads to additional uncertainty [
7,
40].
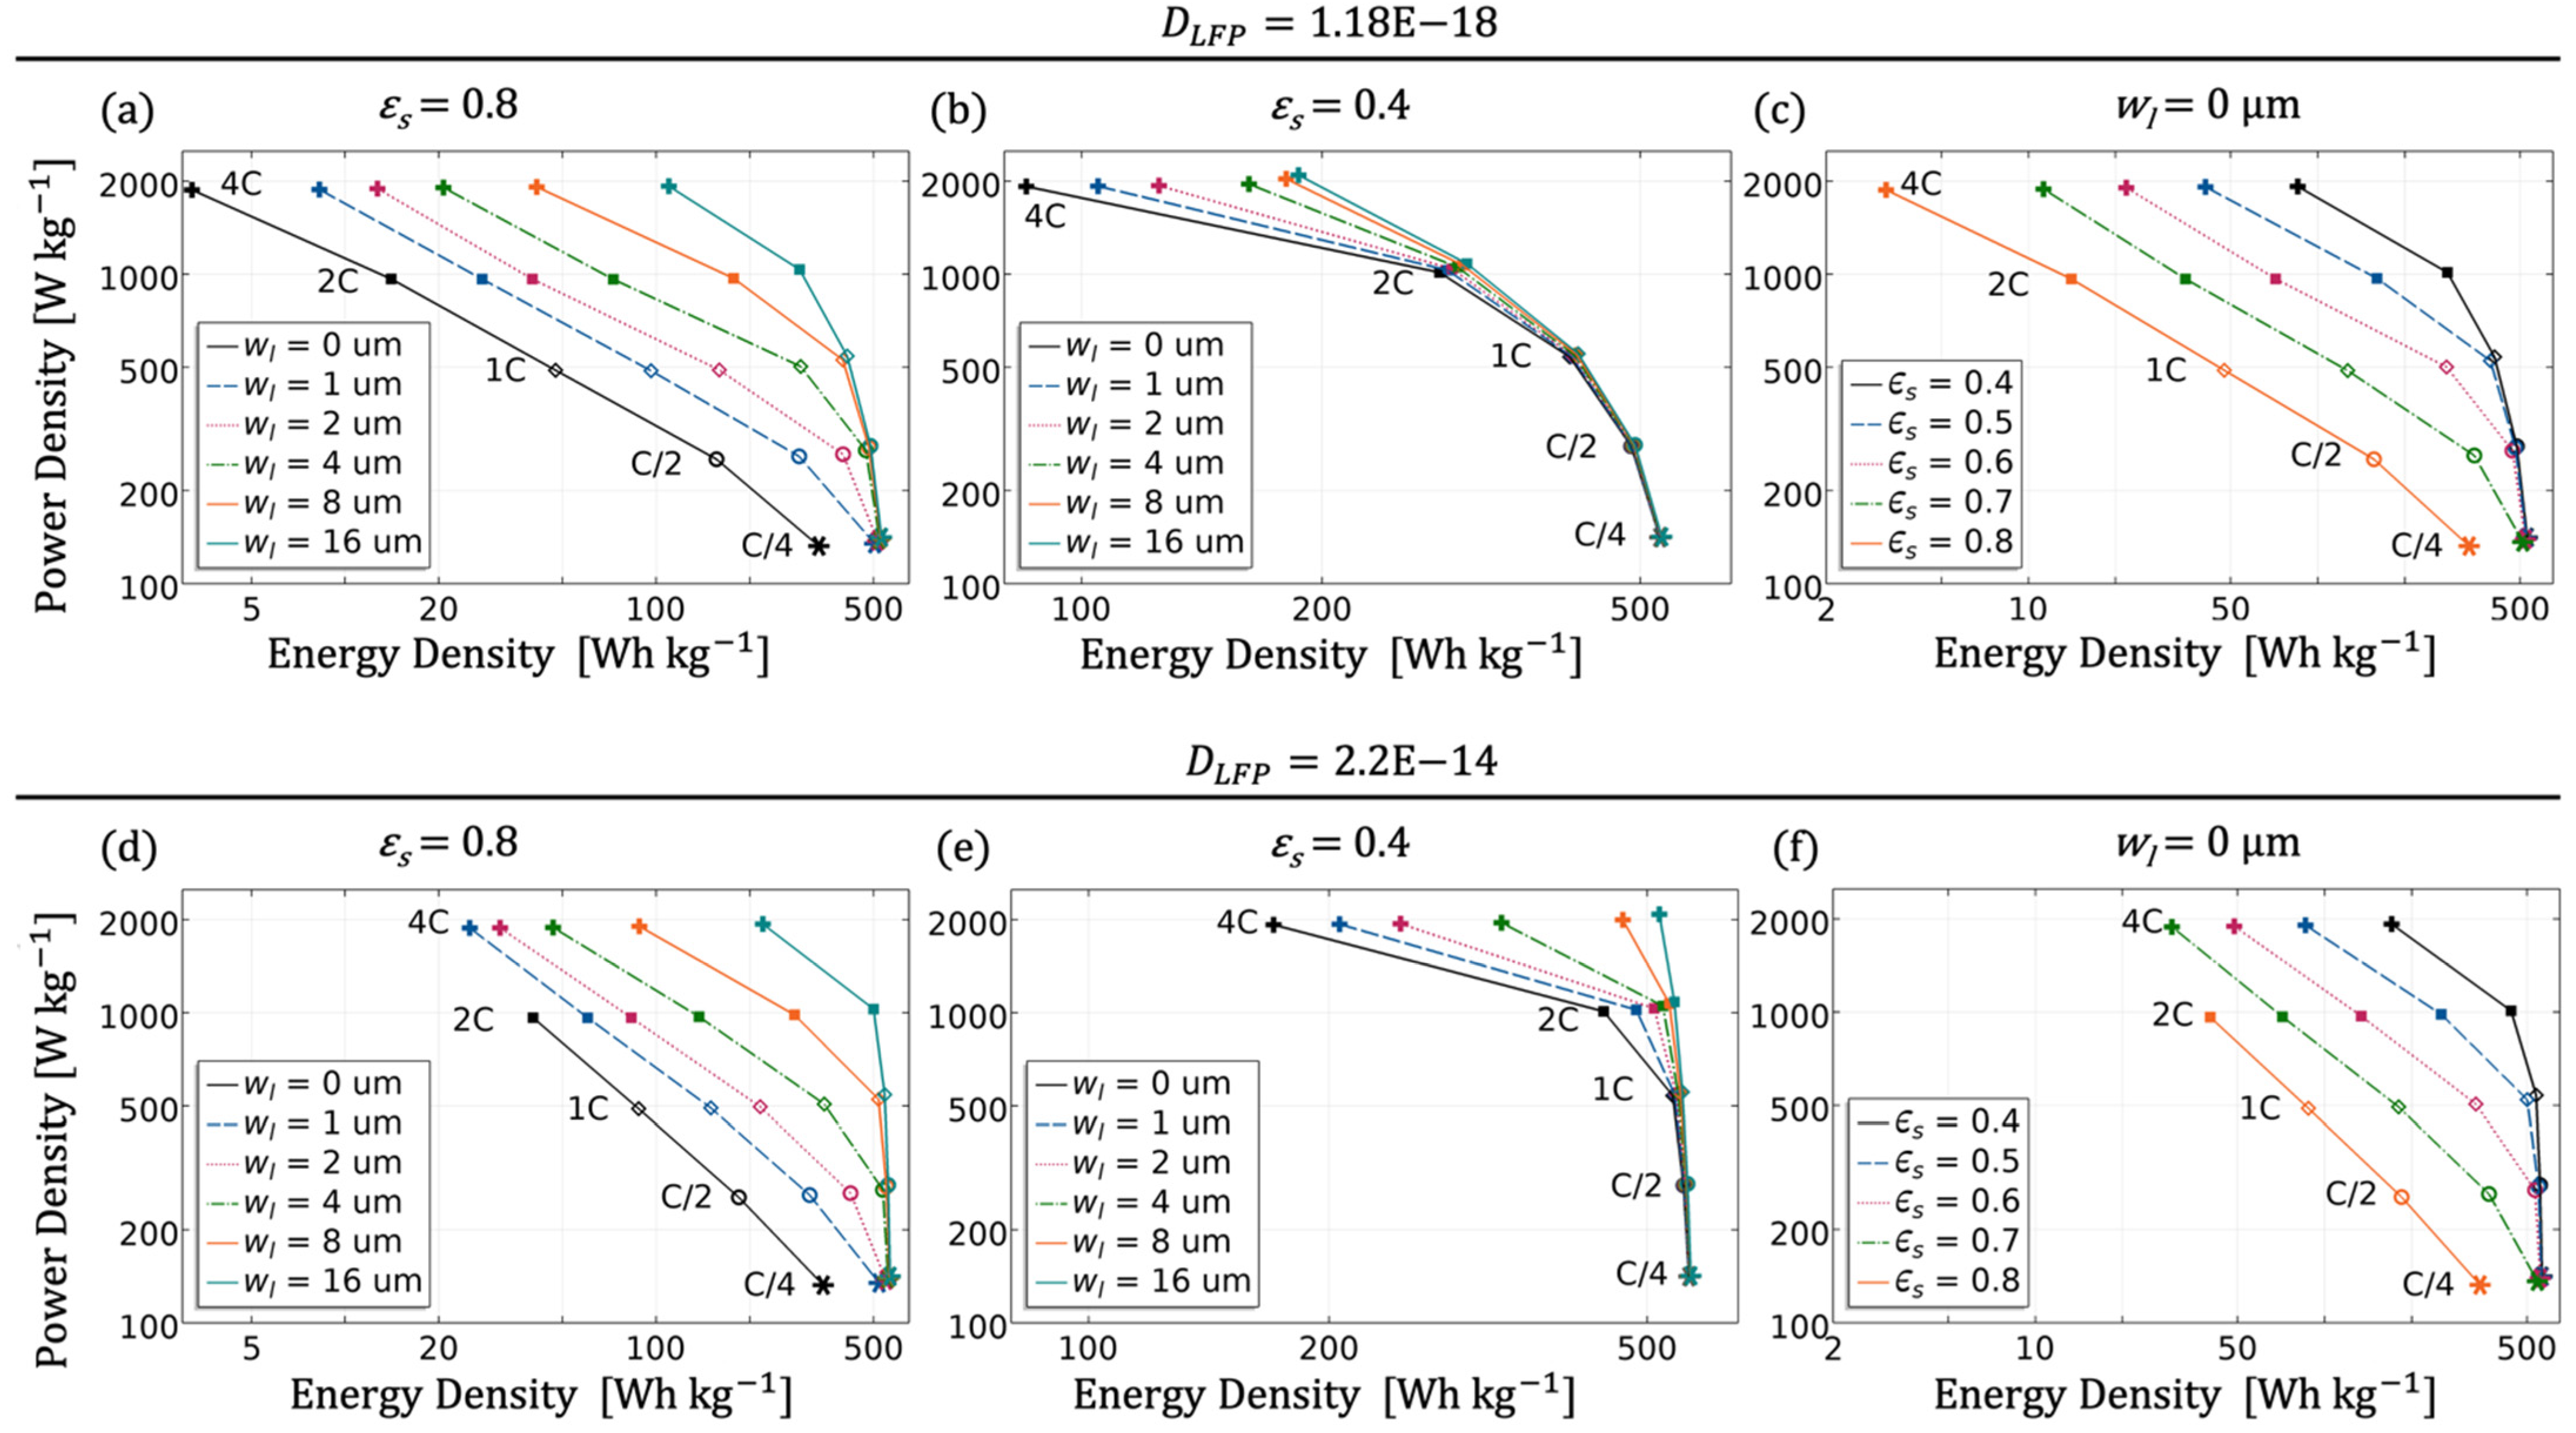
When looking for the best electrode in terms of cost optimisation, the potential of the active material should be fully utilised. In terms of the cell, this means a high power and energy density and, in the best case, a higher stability against higher current rates. Only for LFP, the possible achievable gravimetric capacity is about 170 mAh g−1. With a nominal cell voltage of 3.2 V, this results in a formal energy density of 544 Wh kg−1 and at 4C in a power density of 2176 W kg−1. In the following, the time average of the voltage curve was used to calculate the power and energy density instead of considering the nominal cell voltage.
Analysing
Figure 17, it is noticeable that at low currents of 0.25C the parameter variations of macrostructure and microstructure are negligible. A special case is the single structure (
) with very high density (
), which has both lower power and lower energy density. A higher porosity ensures better Li-ion transport in the electrolyte due to the reduction of tortuosity within the electrode, and consequently higher currents can be applied without any loss of power [
7]. In case of the thick single electrode with a porosity of 60%, currents up to 2C cause an energy loss of ~20%, and at 4C the loss is even ~70%. The situation becomes more dramatic if, in addition, the lithiation is hindered by a lower solid diffusion, which means a loss of 85% at 4C. The best performance was identified for the lamellar structure with the widest electrolyte channel and a solid content of 40%, resulting in an overall porosity of 80%. The combination of the two structures enables an almost constant energy density (510~550 Wh kg
−1) with increasing current up to 4C, provided there is sufficient solid diffusion. As already discussed, a high content of active material leads to a reduction in power and energy density. The electrolyte channel can counteract this in a similar way, e.g., through increasing the porosity in the single structure. Thus, a lamellar structure offers more adjustment parameters for designing an optimised electrode especially intended for high currents. For small currents up to 1C, it is rather unimportant whether the necessary increase in porosity for a good performance with thick electrodes occurs through the macrostructure or through the microstructure, as long as the overall porosity remains approximately the same (as depicted in
Figure 17a,c). This statement could be relativised in that sense as real tortuosities are used for the microstructure, and they are often significantly larger [
25]. The validation in the next subsection also shows the limitation of the idealised P2D approach, since although the cellular structure presented, i.e., comparable to a highly porous electrode, had a similar porosity to the lamellar structure, the performance of the lamellar structure was significantly better.
3.3. Validation and Usability
The geometric modelling was based on preliminary studies in which two LFP electrode structures (cellular and lamellar) were fabricated by freeze casting [
39]. The two structures showed different discharge performances. Those structures were classified only by the total porosity and the achievable gravimetric capacity, which makes modelling difficult due to the many degrees of freedom. In the following, a procedure is proposed on how to use the already shown simulations to approximate the modelling and the experiment when the uncertainty of the model parameters is high and only geometric values are given:
All physical parameters that are verified, e.g., by the manufacturer’s specifications or experiments, must be taken into account.
The best parameter set related to the theoretical study should be chosen for the undetermined parameters in order to start without any limitations.
The external circumstances such as the discharge or charging current and the temperature must be clearly defined.
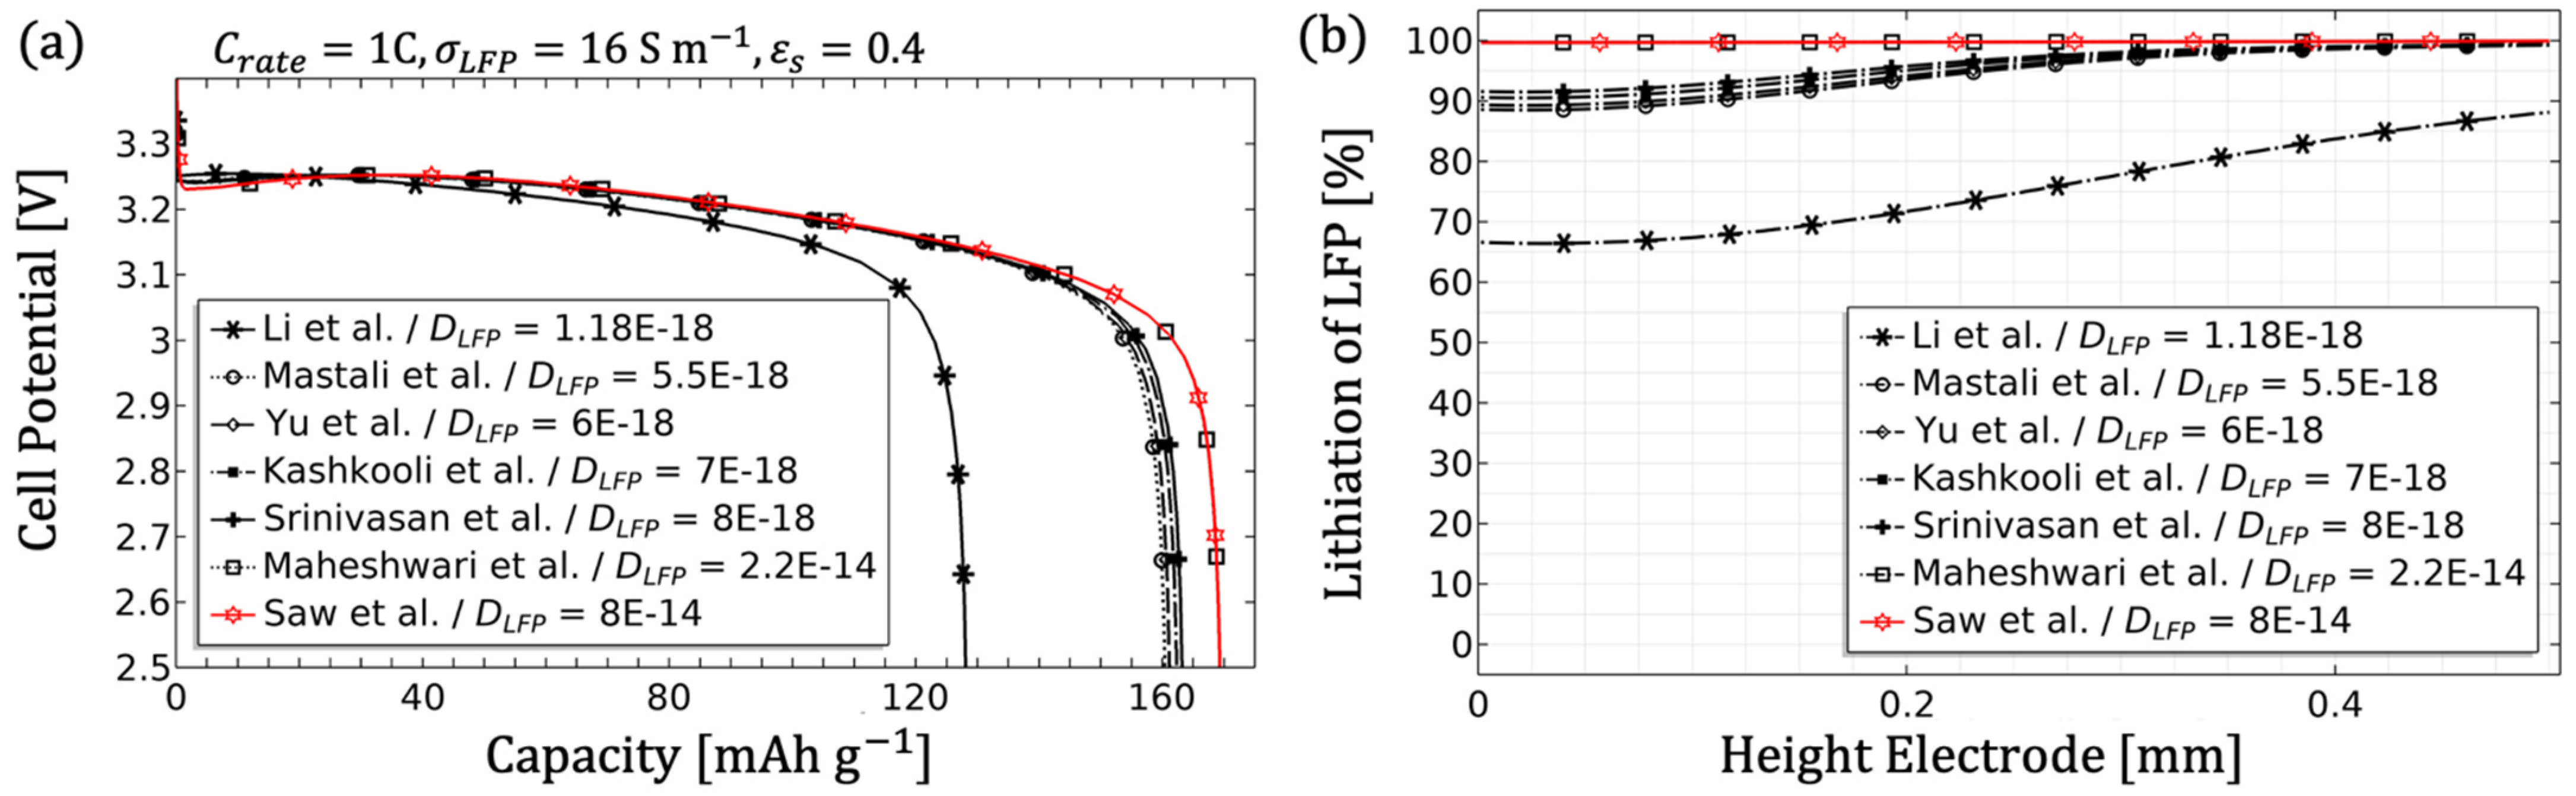
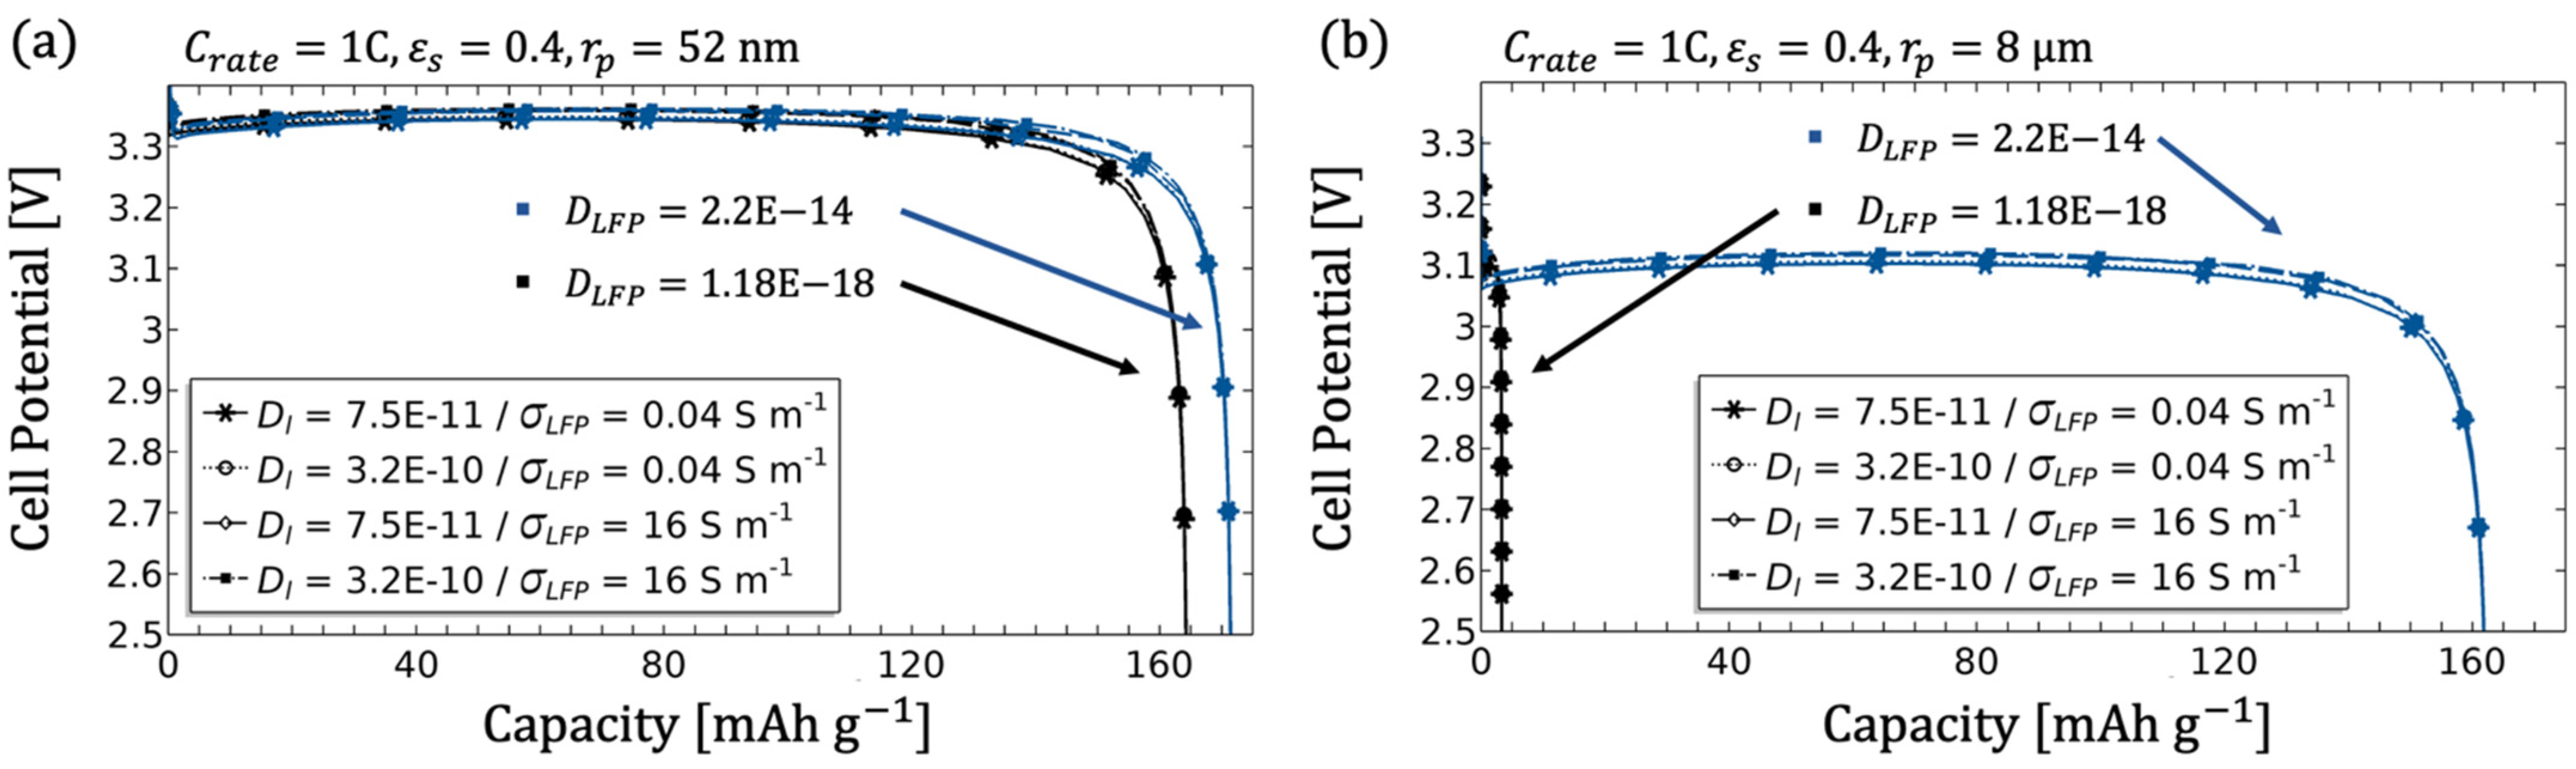
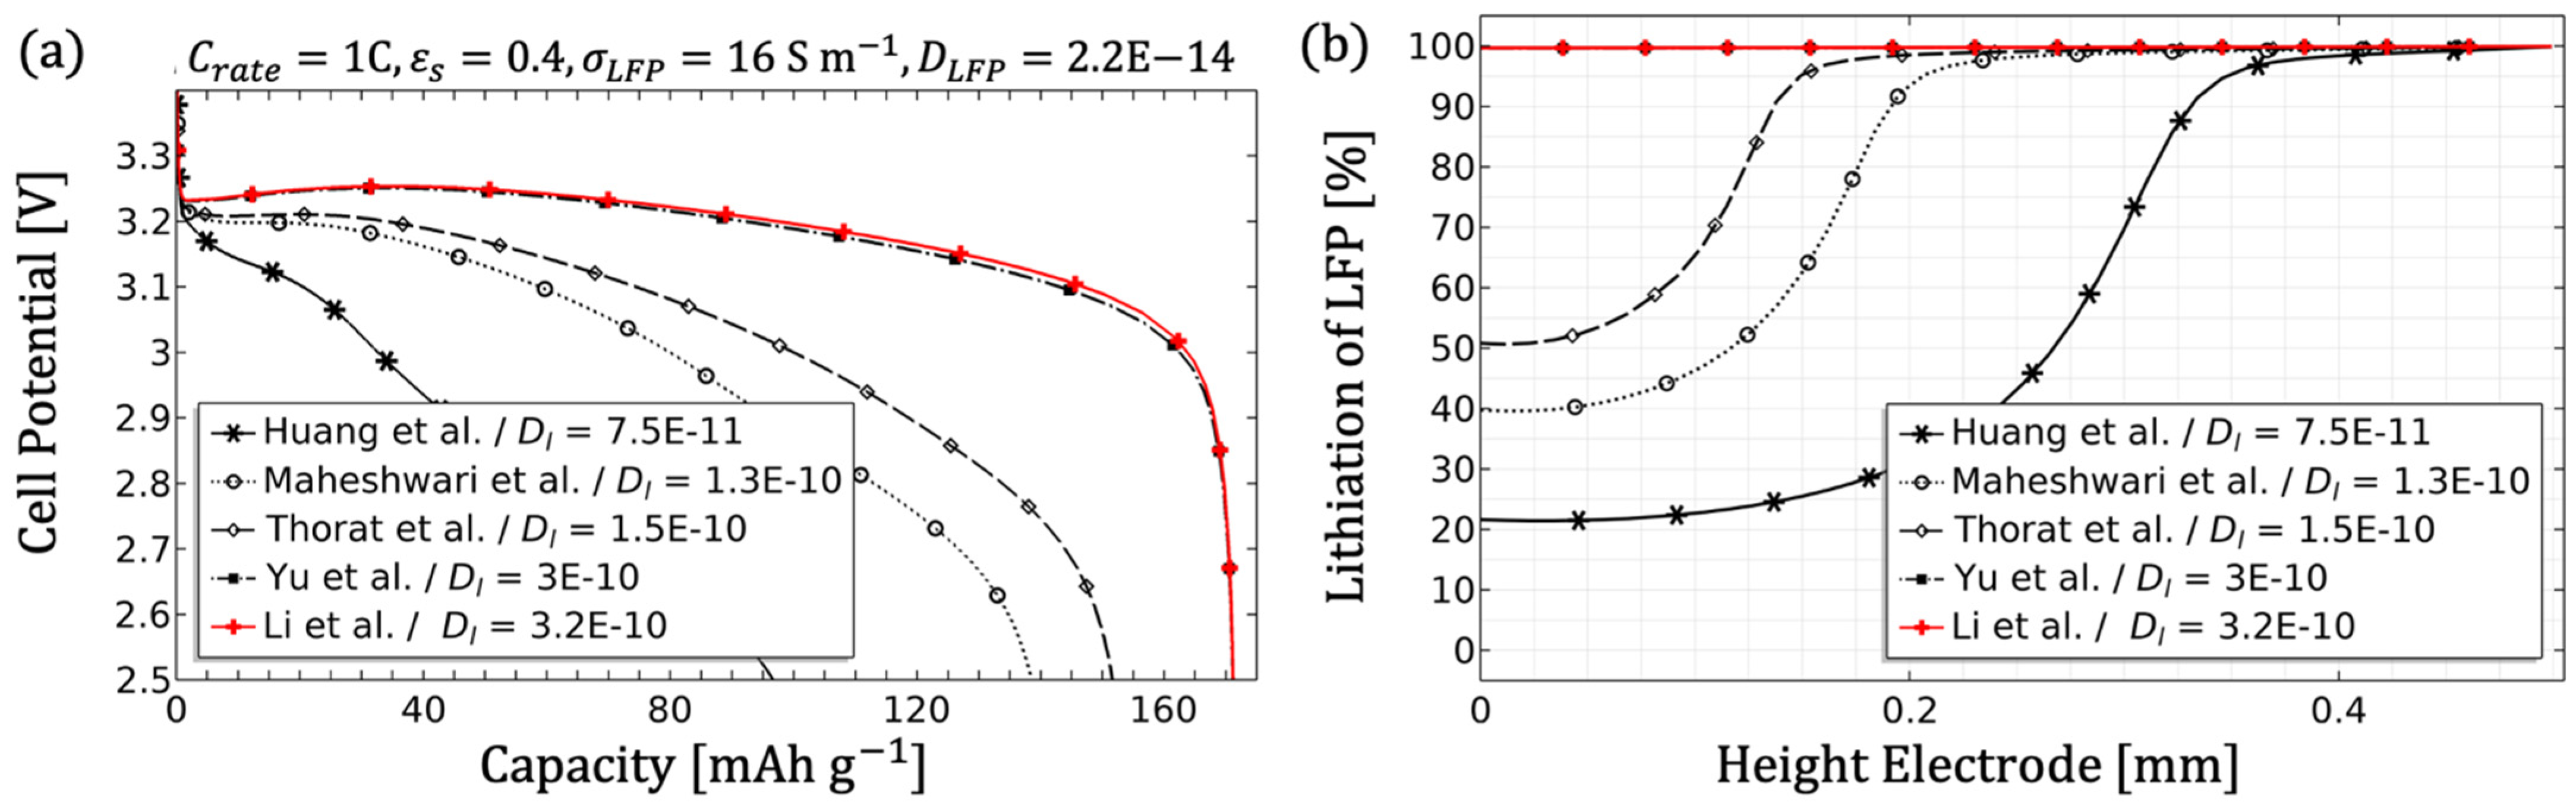
The electrode diffusion coefficient should be determined to scale the achievable capacity (see
Figure 5).
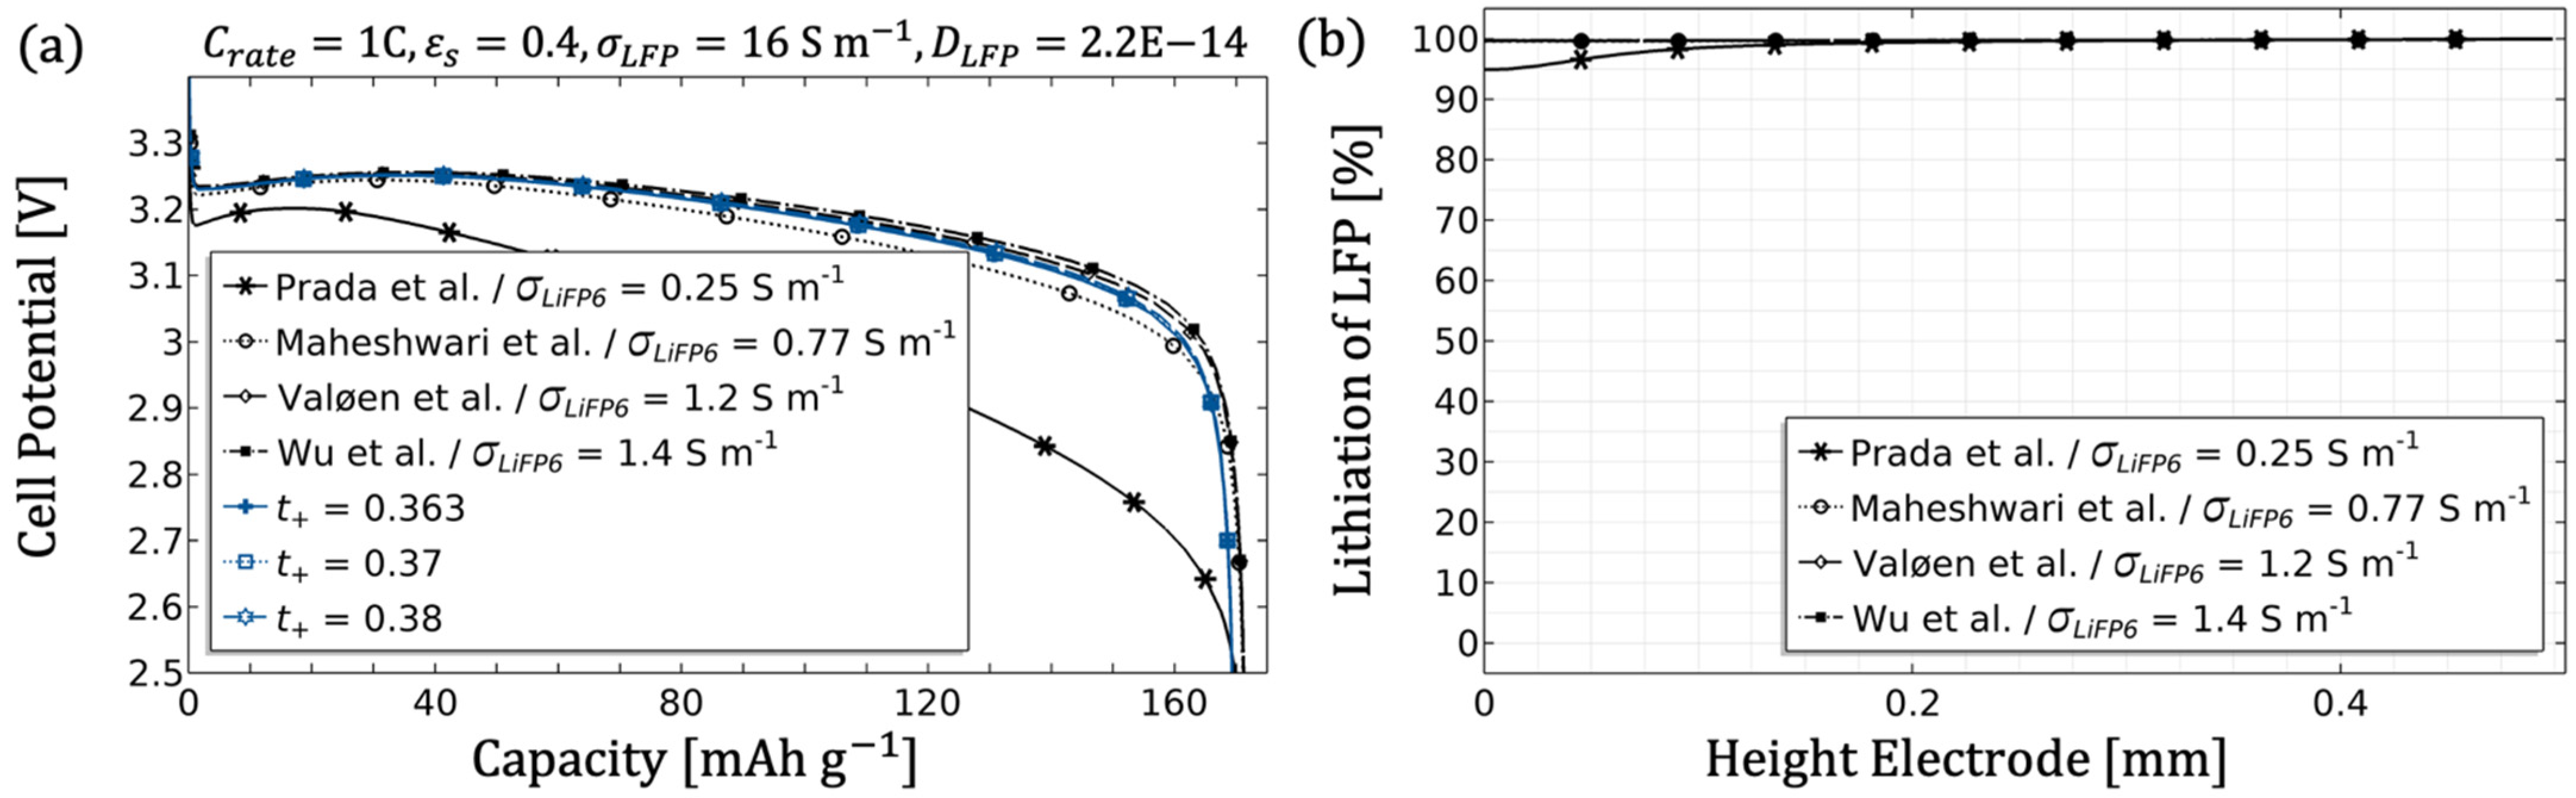
An adjustment of the inhomogeneities can be done by the diffusivity as well as the conductivity of the electrolyte. Since in the porous electrode these two parameters are influenced by the microstructure (see Equations (8) and (9)), an adjustment of the microstructure would likewise be target-oriented (see
Figure 7,
Figure 8 and
Figure 9).
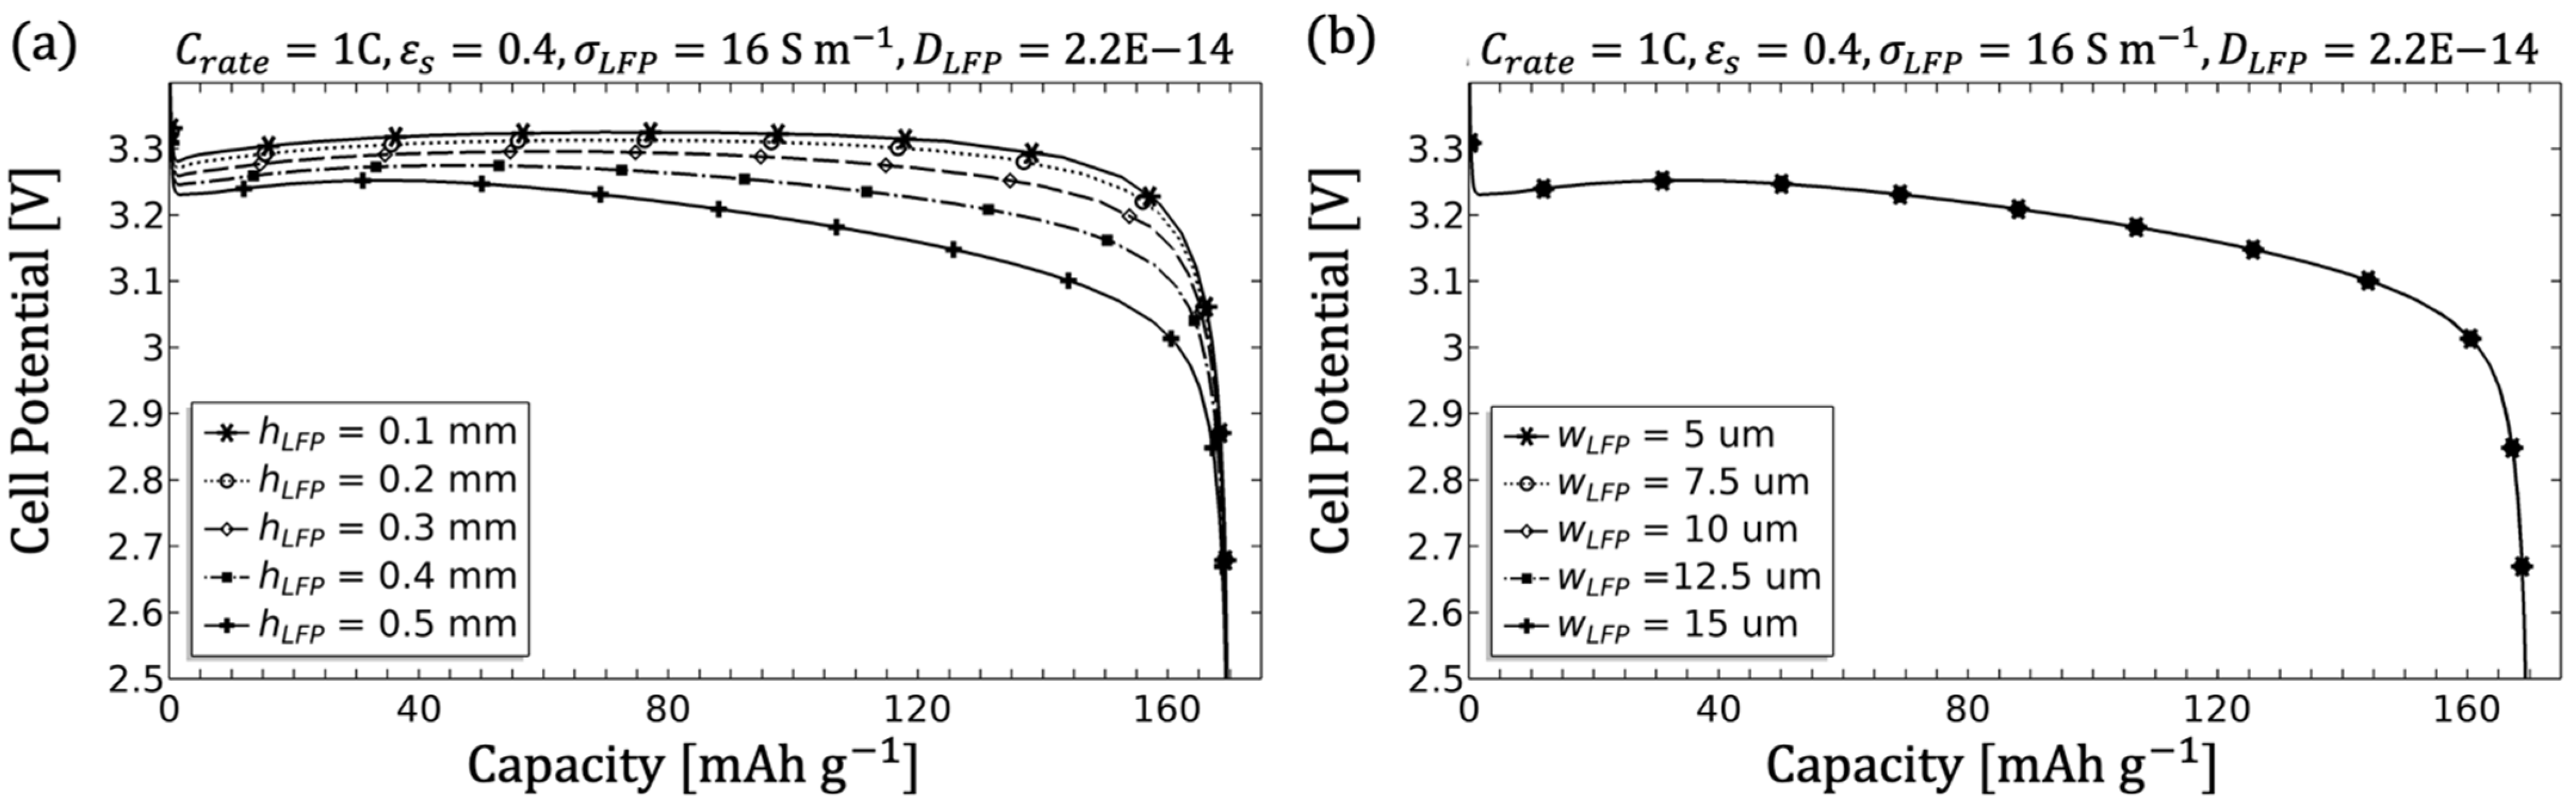
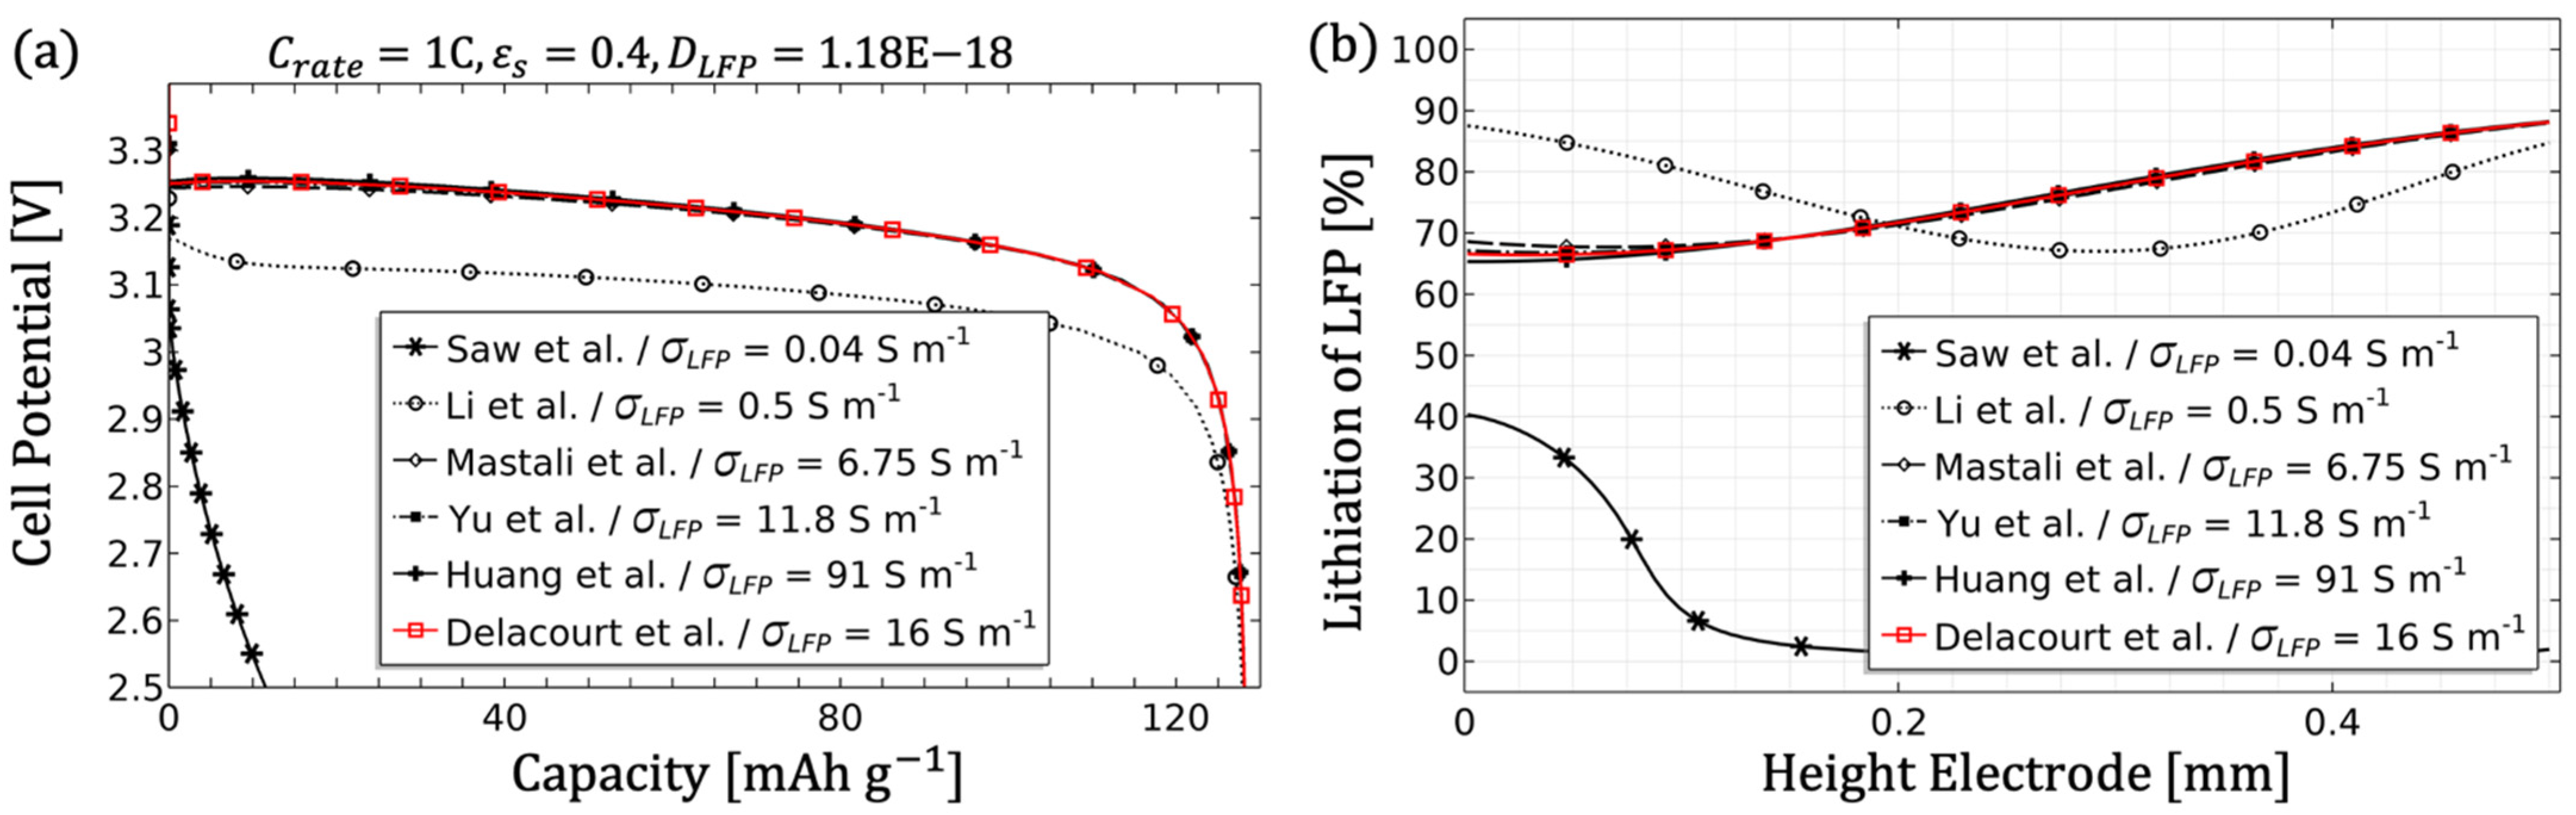
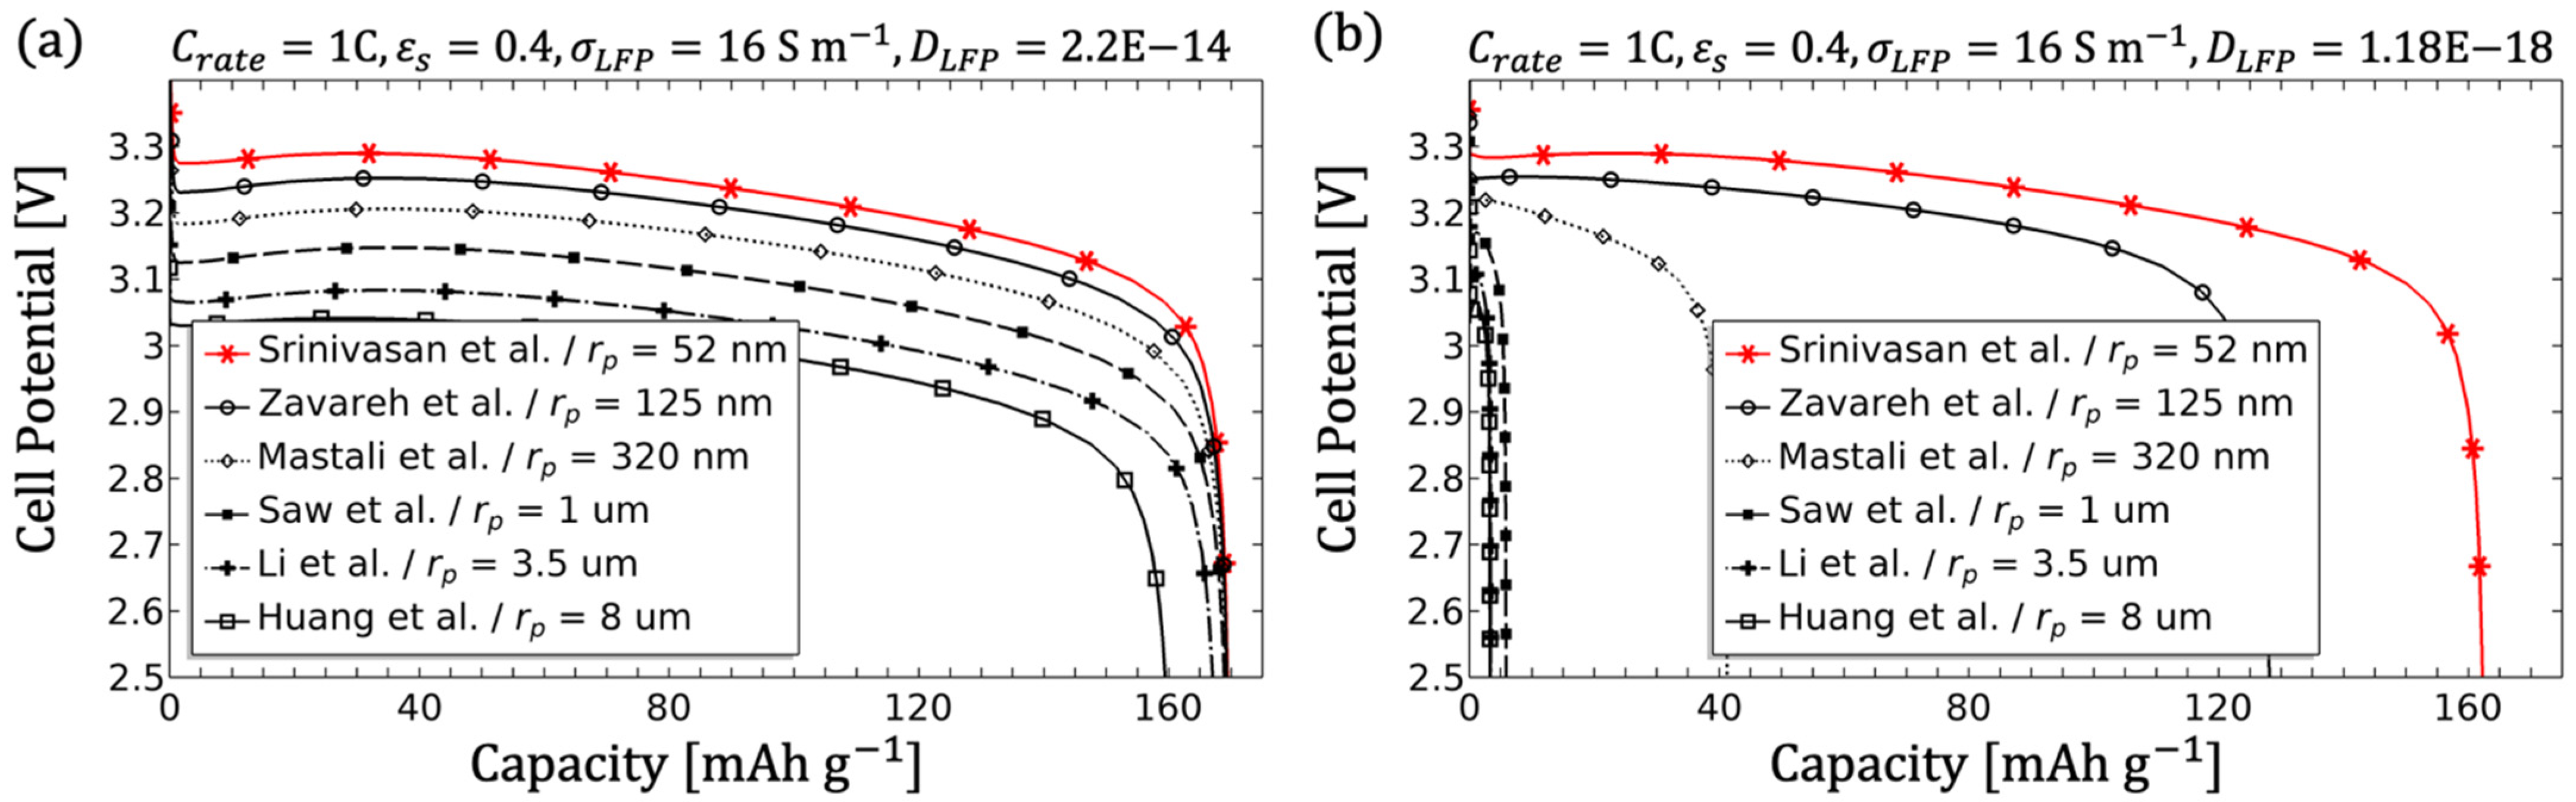
By reducing the conductivity of the electrode (see
Figure 4) or the particle radius (see
Figure 6), the ohmic overpotential can be adjusted.
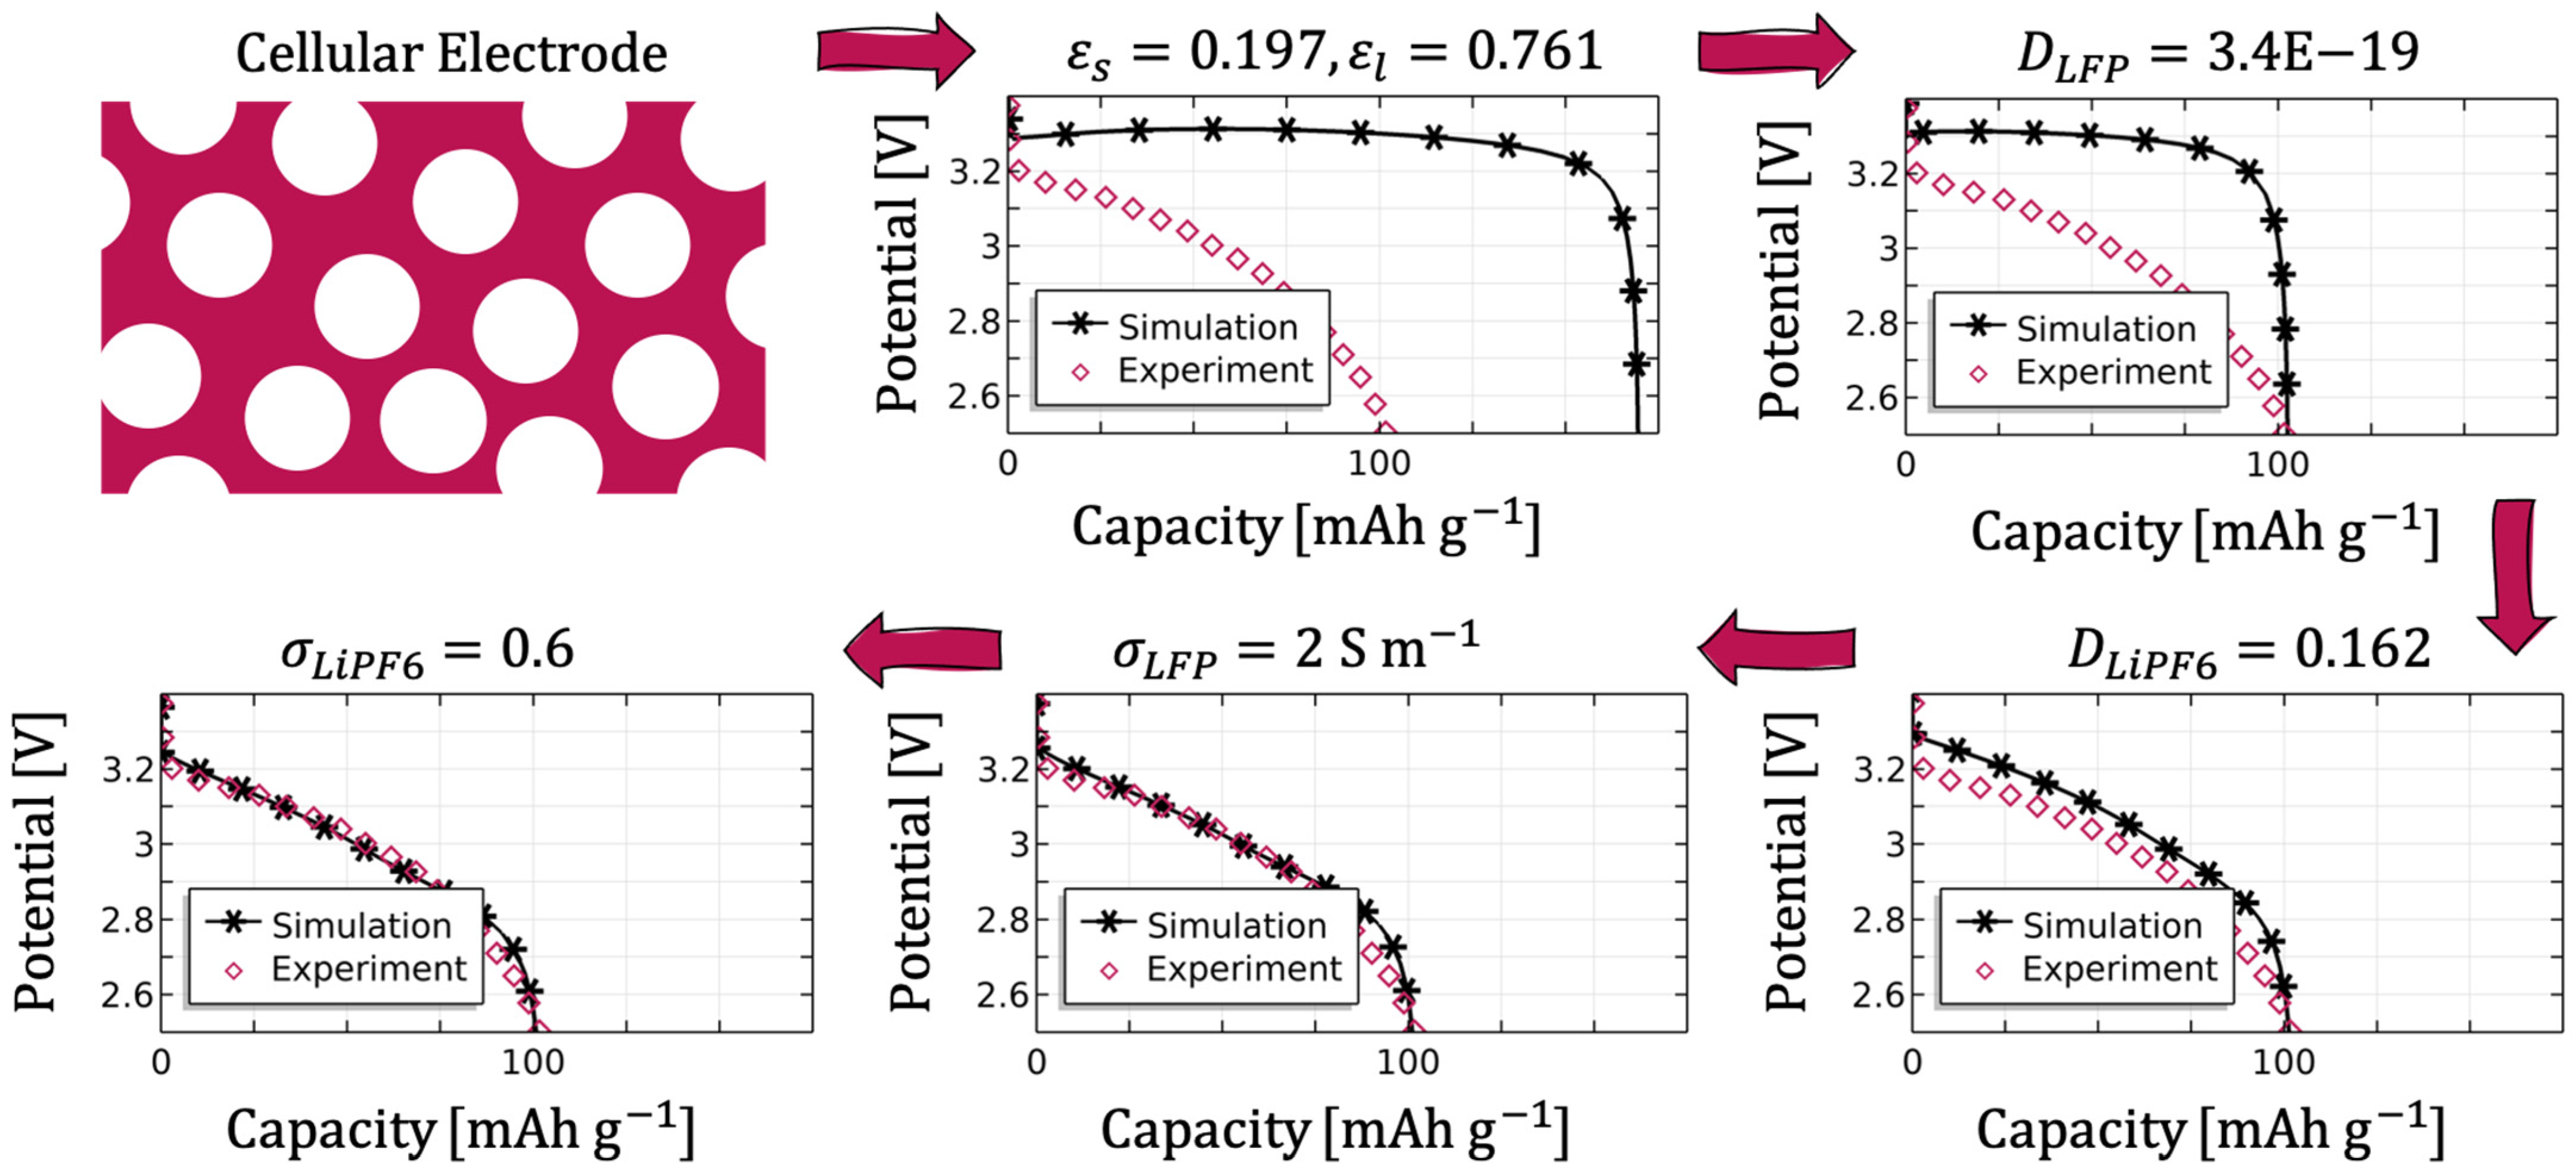
Figure 18 shows the usability of the procedure for the cellular structure from [
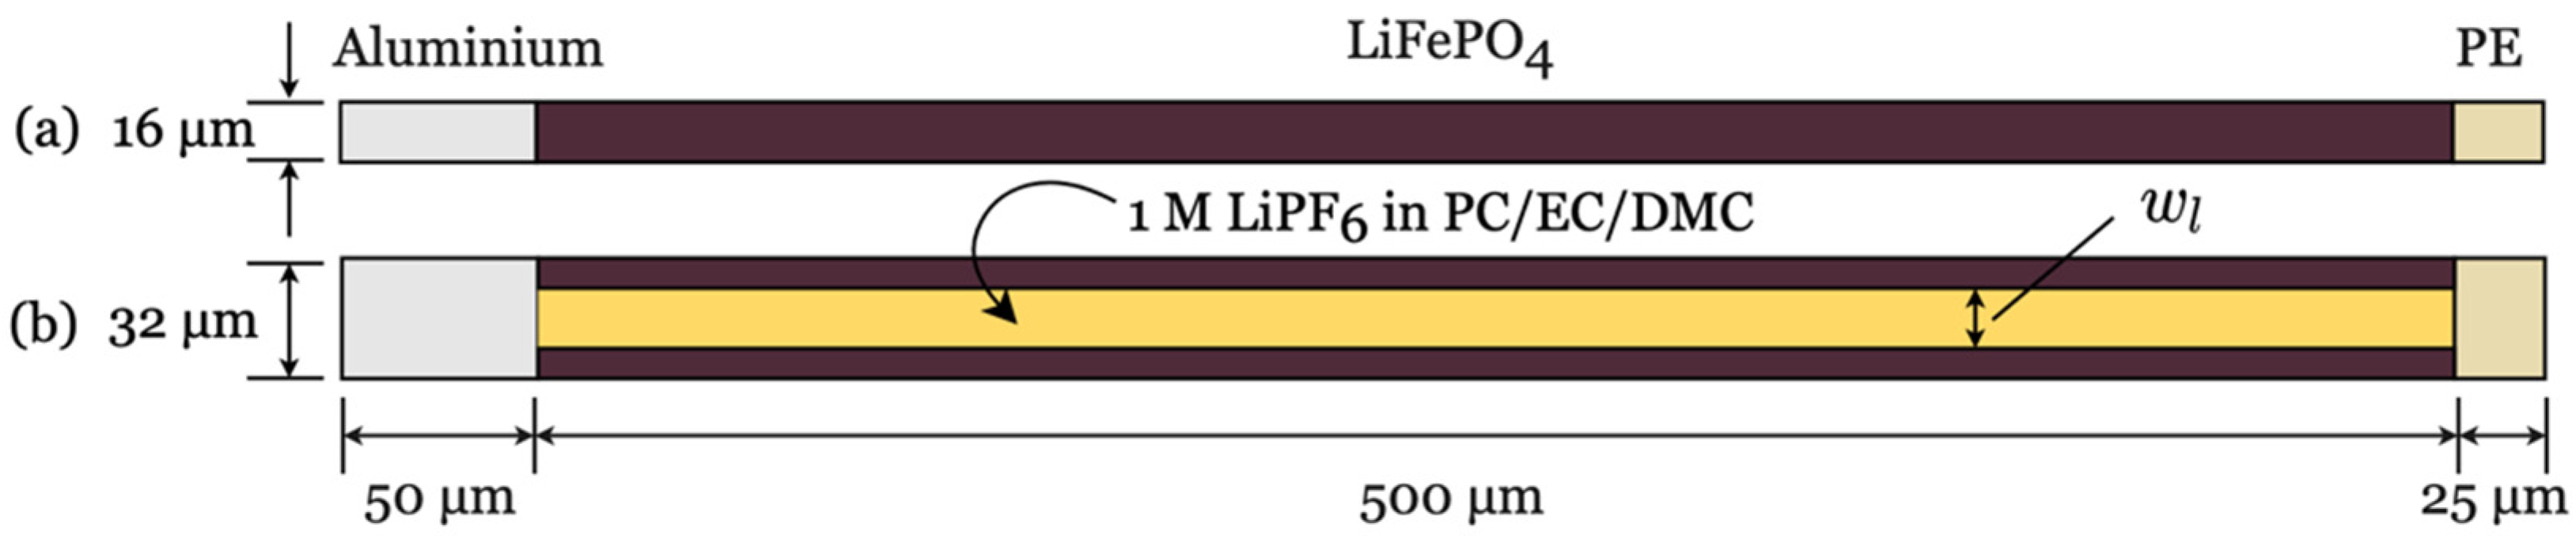
39]. The geometric approach from
Figure 2a was taken for this purpose, the height of the electrode was adjusted to 800 µm, and the values for the calculated solid and electrolyte volume fractions were used. The remaining parameters were taken from the evaluated parameter set, and the discharge current was set to 0.5C at 298 K. First, the solid diffusion prefactor was determined as
Next, the electrolyte diffusion prefactor was reduced until the shape of the discharge curve was achieved. The ohmic overpotential was subsequently fine-tuned by means of the conductivity of both the electrode and the electrolyte.
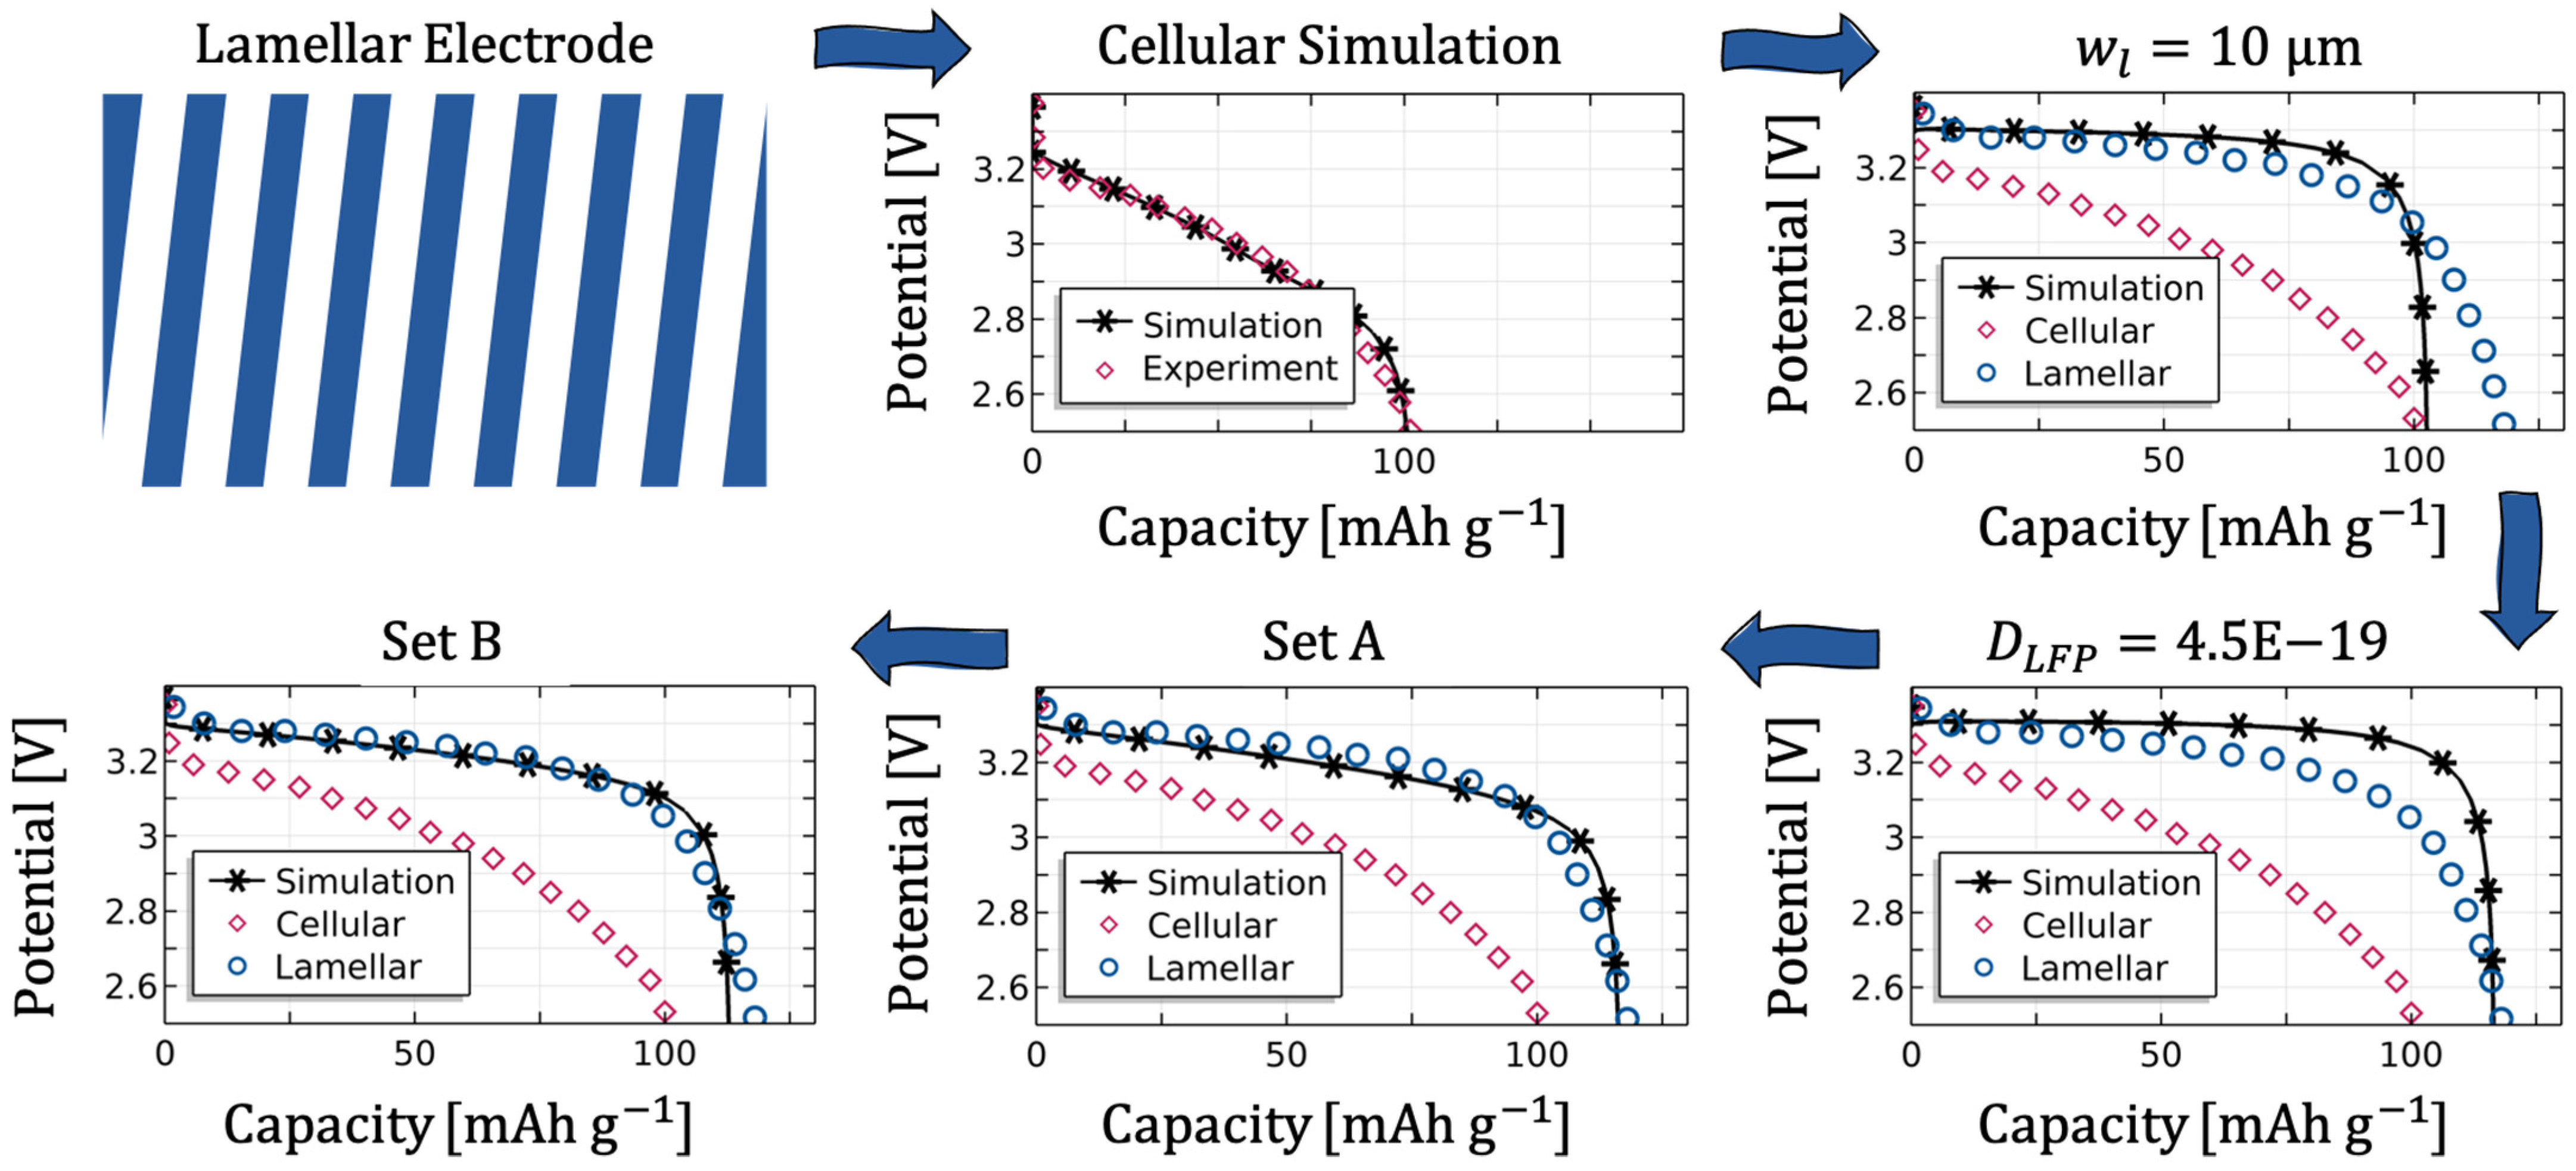
For the validation of the obtained parameters, the parameter set was applied to the lamellar structure using the geometric model from
Figure 2b with an electrolyte channel width of
µm.
Figure 19 shows that the parameters are generally applicable, but the solid diffusion prefactor was chosen insufficiently to achieve the higher gravimetric capacity of ~120 mAh g
−1. Hence, a new solid diffusion prefactor was determined with
. Nevertheless, the measurement compared to the simulation reveals that the mass transport is hindered with decreasing State-of-Charge. According to the procedure, it is obvious to fit the curve next by the electrolyte diffusion coefficient. However, this would counteract the idea of the proposed procedure, as the lamellar and cellular parameter set would no longer be validated among each other. Therefore, it is more obvious to make an adjustment via the microstructural parameters, which are different for the lamellar structure as shown in [
39]. The obtained parameter set A is shown in
Table 4. Due to the measured porosities, an even higher solid content in the lamella is assumed (see
Table 4 parameter set B), and the solid diffusion prefactor had to be modified. This in turn reiterates the importance of microstructure, which has already been emphasised several times, as it has a significant influence on validation.
For more accurate simulations, the microstructure should either be modelled, or the tortuosity and spherical particle assumption should be corrected by appropriate methods or measurements.


