Article

Urinary Mitochondrial DNA Is Related to Allograft Function in Living Donor Kidney Transplantation—An Observational Study of the VAPOR-1 Cohort

by
Lucas Gartzke
1,2,†,
Julia Huisman
1,3,†,
Nora Spraakman
3,
Fernanda Lira Chavez
2,
Michel Struys
3,4,
Henri Leuvenink
1,
Robert Henning
2 and
Gertrude Nieuwenhuijs-Moeke
3,*
1
Department of Surgery, University of Groningen, University Medical Center Groningen, Hanzeplein 1, 9713 GZ Groningen, The Netherlands
2
Department of Clinical Pharmacy and Pharmacology, University Medical Center Groningen, Hanzeplein 1, 9713 GZ Groningen, The Netherlands
3
Department of Anesthesiology, University of Groningen, University Medical Center Groningen, Hanzeplein 1, 9713 GZ Groningen, The Netherlands
4
Department of Basic and Applied Medical Sciences, Ghent University, C. Heymanslaan 10, 9000 Ghent, Belgium
*
Author to whom correspondence should be addressed.
These authors contributed equally to this work.
Transplantology 2025, 6(3), 20; https://doi.org/10.3390/transplantology6030020
Submission received: 29 April 2025 / Revised: 1 June 2025 / Accepted: 17 June 2025 / Published: 26 June 2025
(This article belongs to the Section Organ and Tissue Donation and Preservation)

Abstract

Background: Ischemia–reperfusion injury (IRI) is a key contributor to graft dysfunction in kidney transplantation. Cell-free mitochondrial DNA (mtDNA) is increasingly recognized as a damage-associated molecular pattern (DAMP) and biomarker in IRI, but its prognostic role in living donor kidney transplantation (LDKT) remains unclear. Methods: This post hoc analysis of the VAPOR-1 study evaluated urinary mtDNA (UmtDNA) in 57 LDKT recipients. MtDNA levels (ND1, ND6, and D-loop) were measured at five early timepoints post-transplantation using qPCR. Associations between early UmtDNA and long-term graft function, defined by estimated glomerular filtration rate (eGFR) at 1, 12, and 24 months, were analyzed. Results: Higher UmtDNA levels in the first urine after reperfusion were significantly associated with improved eGFR at 12 months and a positive change in eGFR between month 1 and 24. These associations were not attributable to urine creatinine levels or mitochondrial copy number. Conclusions: In this LDKT cohort, elevated early UmtDNA may reflect a well-functioning graft capable of clearing systemic mtDNA rather than ongoing tubular injury. These findings suggest that the biological interpretation of mtDNA as a biomarker is context-dependent and call for careful reconsideration of its role in early transplant monitoring.

1. Introduction

Ischemia–reperfusion injury (IRI) confers major damage in kidney transplantation and increases the risk of delayed graft function (DGF) and primary non-function (PNF) [1,2,3]. Furthermore, IRI sensitizes the allograft to acute rejection and interstitial fibrosis and tubular atrophy (IFTA), thereby impairing graft and patient outcomes [4,5]. During IRI, mitochondria-derived reactive oxygen species (ROS) react with cellular components, causing mitochondrial membrane leakage and the release of mitochondrial damage-associated molecular patterns (DAMPs) like mitochondrial DNA (mtDNA) into the extracellular space [6,7,8,9]. MtDNA activates the innate immune system via the Toll-like receptor 9 (TLR-9), the NLRP3 inflammasomes, and the cyclic GMP–AMP synthase (cGAS), culminating in NFκB activation and downstream pro-inflammatory cascades leading to renal damage [7,10,11].
Accurate assessment of IRI-induced damage is challenging. In clinical practice, urine production and creatinine clearance are used as surrogate markers; however, when urine production is too low to assess clearance, additional invasive and time-intensive diagnostics are required to identify the cause. Cystatin C is often suggested as an alternative indicator, but as a functional biomarker like creatinine, it can only detect damage after the injury is inflicted [12,13,14,15,16,17]. Several injury biomarkers, including kidney injury molecule-1 (KIM-1), N-acetyl-β-D-glucosaminidase (NAG), and neutrophil gelatinase-associated Lipocalin (NGAL), have been proposed to predict graft function in the early stages after transplantation, as they are related to damage and/or repair mechanisms [18,19]. Although their urinary excretion rises post-transplant, studies show inconsistent predictive value for graft outcomes [20,21,22,23]. Therefore, there is a need to explore novel biomarkers for the evaluation of current and future graft function.
Plasma and urinary mtDNA (UmtDNA) are under investigation as biomarkers for detecting kidney damage after transplantation. The recent literature links donor plasma mtDNA to allograft function and rejection in recipients, and we have previously shown that recipient plasma mtDNA in the first week post-transplant predicts kidney function at one month [24,25,26]. MtDNA can accumulate in urine from either circulating plasma mtDNA through glomerular filtration or by being directly released into the urine from damaged or dying tubular cells [1,2,3,4,5,8,11,27,28]. This makes UmtDNA a candidate biomarker to predict transplant outcomes, particularly when urine production is sparse. Recent studies have demonstrated that UmtDNA levels in graft recipients—following both living and deceased donor transplantation—are associated with ischemia times, as well as the incidence of delayed graft function and rejection [10,11]. However, the long-term predictive value of UmtDNA in LDKT is unexplored. In this study, we analyzed the presence of UmtDNA in a living donor kidney transplantation (LDKT) cohort to explore a potential relationship with allograft outcomes. To our knowledge, this is the first study to assess recipient UmtDNA at multiple time points within the first week after LDKT. Herein, we report the temporal profile of UmtDNA and its association with graft function over two years, focusing on three mitochondrial genes: NADH ubiquinone oxidoreductase subunit 1 (ND1), NADH ubiquinone oxidoreductase subunit 6 (ND6), and displacement-loop (D-loop).

2. Materials and Methods

2.1. Study Population

This study was a post hoc analysis of the VAPOR-1 (Volatile Anesthetic Protection of Renal Transplants-1) trial, a prospective randomized controlled trial comparing the effect of two anesthetic agents (propofol vs. sevoflurane) on graft outcome in LDKT. The VAPOR-1 trial was conducted at the University Medical Center of Groningen between September 2010 and October 2014. The Institutional Review Board approved the study protocol (METc 2009/334), which was conducted in adherence with the Declaration of Helsinki and registered with ClinicalTrials.gov: NCT01248871. Details of the study have been published previously [29]. Inclusion criteria were age ≥ 18 years, donation of the left kidney, and written informed consent. Exclusion criteria were ABO-incompatible transplantation, altruistic donors, and a body mass index (BMI) ≤ 17 or ≥35 kg/m2. In total, 60 donor–recipient couples were initially included and randomly assigned to one of the following groups: PROP, propofol for the donor and recipient; SEVO, sevoflurane for the donor and recipient; and PROSE, propofol for the donor and sevoflurane for the recipient.

2.2. Outcome

The primary objective of this study was to assess the dynamics of mtDNA release into urine at multiple time points after transplantation. MtDNA levels were quantified using the quantification cycle (Cq) of three genes: ND1, ND6, and D-loop. ND1 and ND6 were selected because they encode respiratory chain proteins located on different strands of the mitochondrial genome (ND1 on the heavy strand; ND6 on the light strand). The D-loop was included as a representative non-coding region. While the clinical significance of differences between these subunits remains uncertain, our gene selection aimed to capture both structural and functional aspects of mitochondrial DNA relevant to injury and recovery.
Secondary outcomes were the associations of the levels of UmtDNA with graft function after transplantation, which was defined by several outcomes. Due to budgetary restrictions, a selection of mtDNA in the first urine and 2 h after transplantation was made for associations with secondary outcomes because these timepoints have not been reported in the existing literature. Kidney function, defined as estimated glomerular filtration rate (eGFR) as calculated using the CKD-EPI formula, measured at 1, 12, and 24 months after transplantation, was a secondary outcome. The difference in eGFR between 1 and 24 months after transplantation (ΔeGFR) was used to discriminate the progression of kidney function over time and could be either positive or negative. In order to prevent excessive testing, it was decided not to analyze eGFR at 3 and 6 months after transplantation. Other outcomes were the occurrence of DGF (defined as the need for dialysis in the first week after transplantation), acute rejection, graft loss, and patient mortality.

2.3. Timepoints

Timepoints for urine sampling were the first produced urine upon reperfusion, urine 2 h post-operatively, and on days 1, 2, and 6 after transplantation. Urine samples were collected from a splint in the ureter of the graft, exteriorized as a suprapubic catheter.

2.4. Nuclear and Mitochondrial DNA Analysis

Isolation of mtDNA and nuclear DNA (nDNA) from the supernatant was performed with a Maxwell® RSC cfDNA Plasma Kit (Promega, Madison, WI, USA), according to the manufacturer’s protocol. Quantitative polymerase chain reaction (qPCR) was performed to determine the presence of nuclear and mitochondrial DNA. Primers were designed using Clone Manager 9 software (Sigma Aldrich, Darmstadt, Germany) (Table 1). The isolated mtDNA was quantified and validated with a CFX384 Real-Time system (Bio-Rad, Hercules, CA, USA) targeting the mitochondrial genes ND1, ND6, and D-loop. Melting curve analysis was performed to confirm the specificity of the qPCR products. All reactions were carried out in duplicate, and the averaged Cq values were used for analysis. As the study focused on temporal trends and group-level comparisons, we employed a semi-quantitative approach. Cq values, which inversely reflect mtDNA abundance, served as the primary readout for relative quantification [30]. To account for urine concentration, mtDNA levels were normalized with urinary creatinine levels (measured at the clinical laboratory of the UMCG). Because Cq values are inversely related to the level of mtDNA, lower Cq values indicate higher levels of mtDNA.

2.5. mtDNA Copy Number Analysis

MtDNA copy number analysis was performed according to a protocol (method B; steps 16a and 17a) published by Quiros et al. (2017) [31]. Specifically, the number of mtDNA copies was calculated using a two-step formula based on the difference in Cq values between nuclear DNA (nDNA) and mtDNA, correcting for the multiple copies of mtDNA per nDNA:
ΔCq = Cq (nDNA gene) − Cq (mtDNA gene)
Copies of mtDNA = 2 × 2^ΔCq
This approach leverages quantitative PCR measurements of the respective copy numbers of mtDNA and nDNA and, as such, operates by treating urine as a tissue proxy, where nDNA serves as a stable marker of cell death. By comparing mtDNA to nDNA levels (ΔCq), this method helps to distinguish between isolated mtDNA release—which may result from filtration or secretion—and actual cell loss, which releases both nDNA and mtDNA. This distinction helps determine whether UmtDNA originates from renal tubular cells due to injury or primarily reflects the kidney’s filtration and clearance of circulating DAMPs.

2.6. Statistical Analysis

Statistical analyses were performed using SPSS version 28 and GraphPad Prism version 9.0.1. Normality of distributions was assessed using the Shapiro–Wilk test and visualized with QQ plots. Data are presented as the mean ± standard deviation (SD) for normally distributed variables, median (interquartile range, IQR) for non-normally distributed variables, and proportions (n) with corresponding percentages for categorical variables. Outliers were retained to reflect potentially significant patient cases. UmtDNA dynamics over time were analyzed using repeated-measures one-way ANOVA with Geisser–Greenhouse correction and the two-stage linear step-up procedure of Benjamini, Krieger, and Yekutieli (FDR = 0.05). Mitochondrial DNA copy number was analyzed using two-way ANOVA (REML) with the same FDR correction. The relationship between mtDNA and transplant outcomes was assessed using univariable linear regression. Since higher Cq values indicate lower mtDNA concentrations, B- and β-values in regression models are negative when mtDNA is positively associated with the outcome. Patient subgroups were created by calculating the mean of eGFR at 12 and 24 months after transplantation for each patient, and quartiles were used for stratification.

3. Results

3.1. Baseline Characteristics

After inclusion, three donor–recipient couples were excluded from the primary analysis due to violation of the surgical or immunosuppressive protocol, leaving 57 donor-recipient couples; their baseline characteristics are summarized in Table 2.

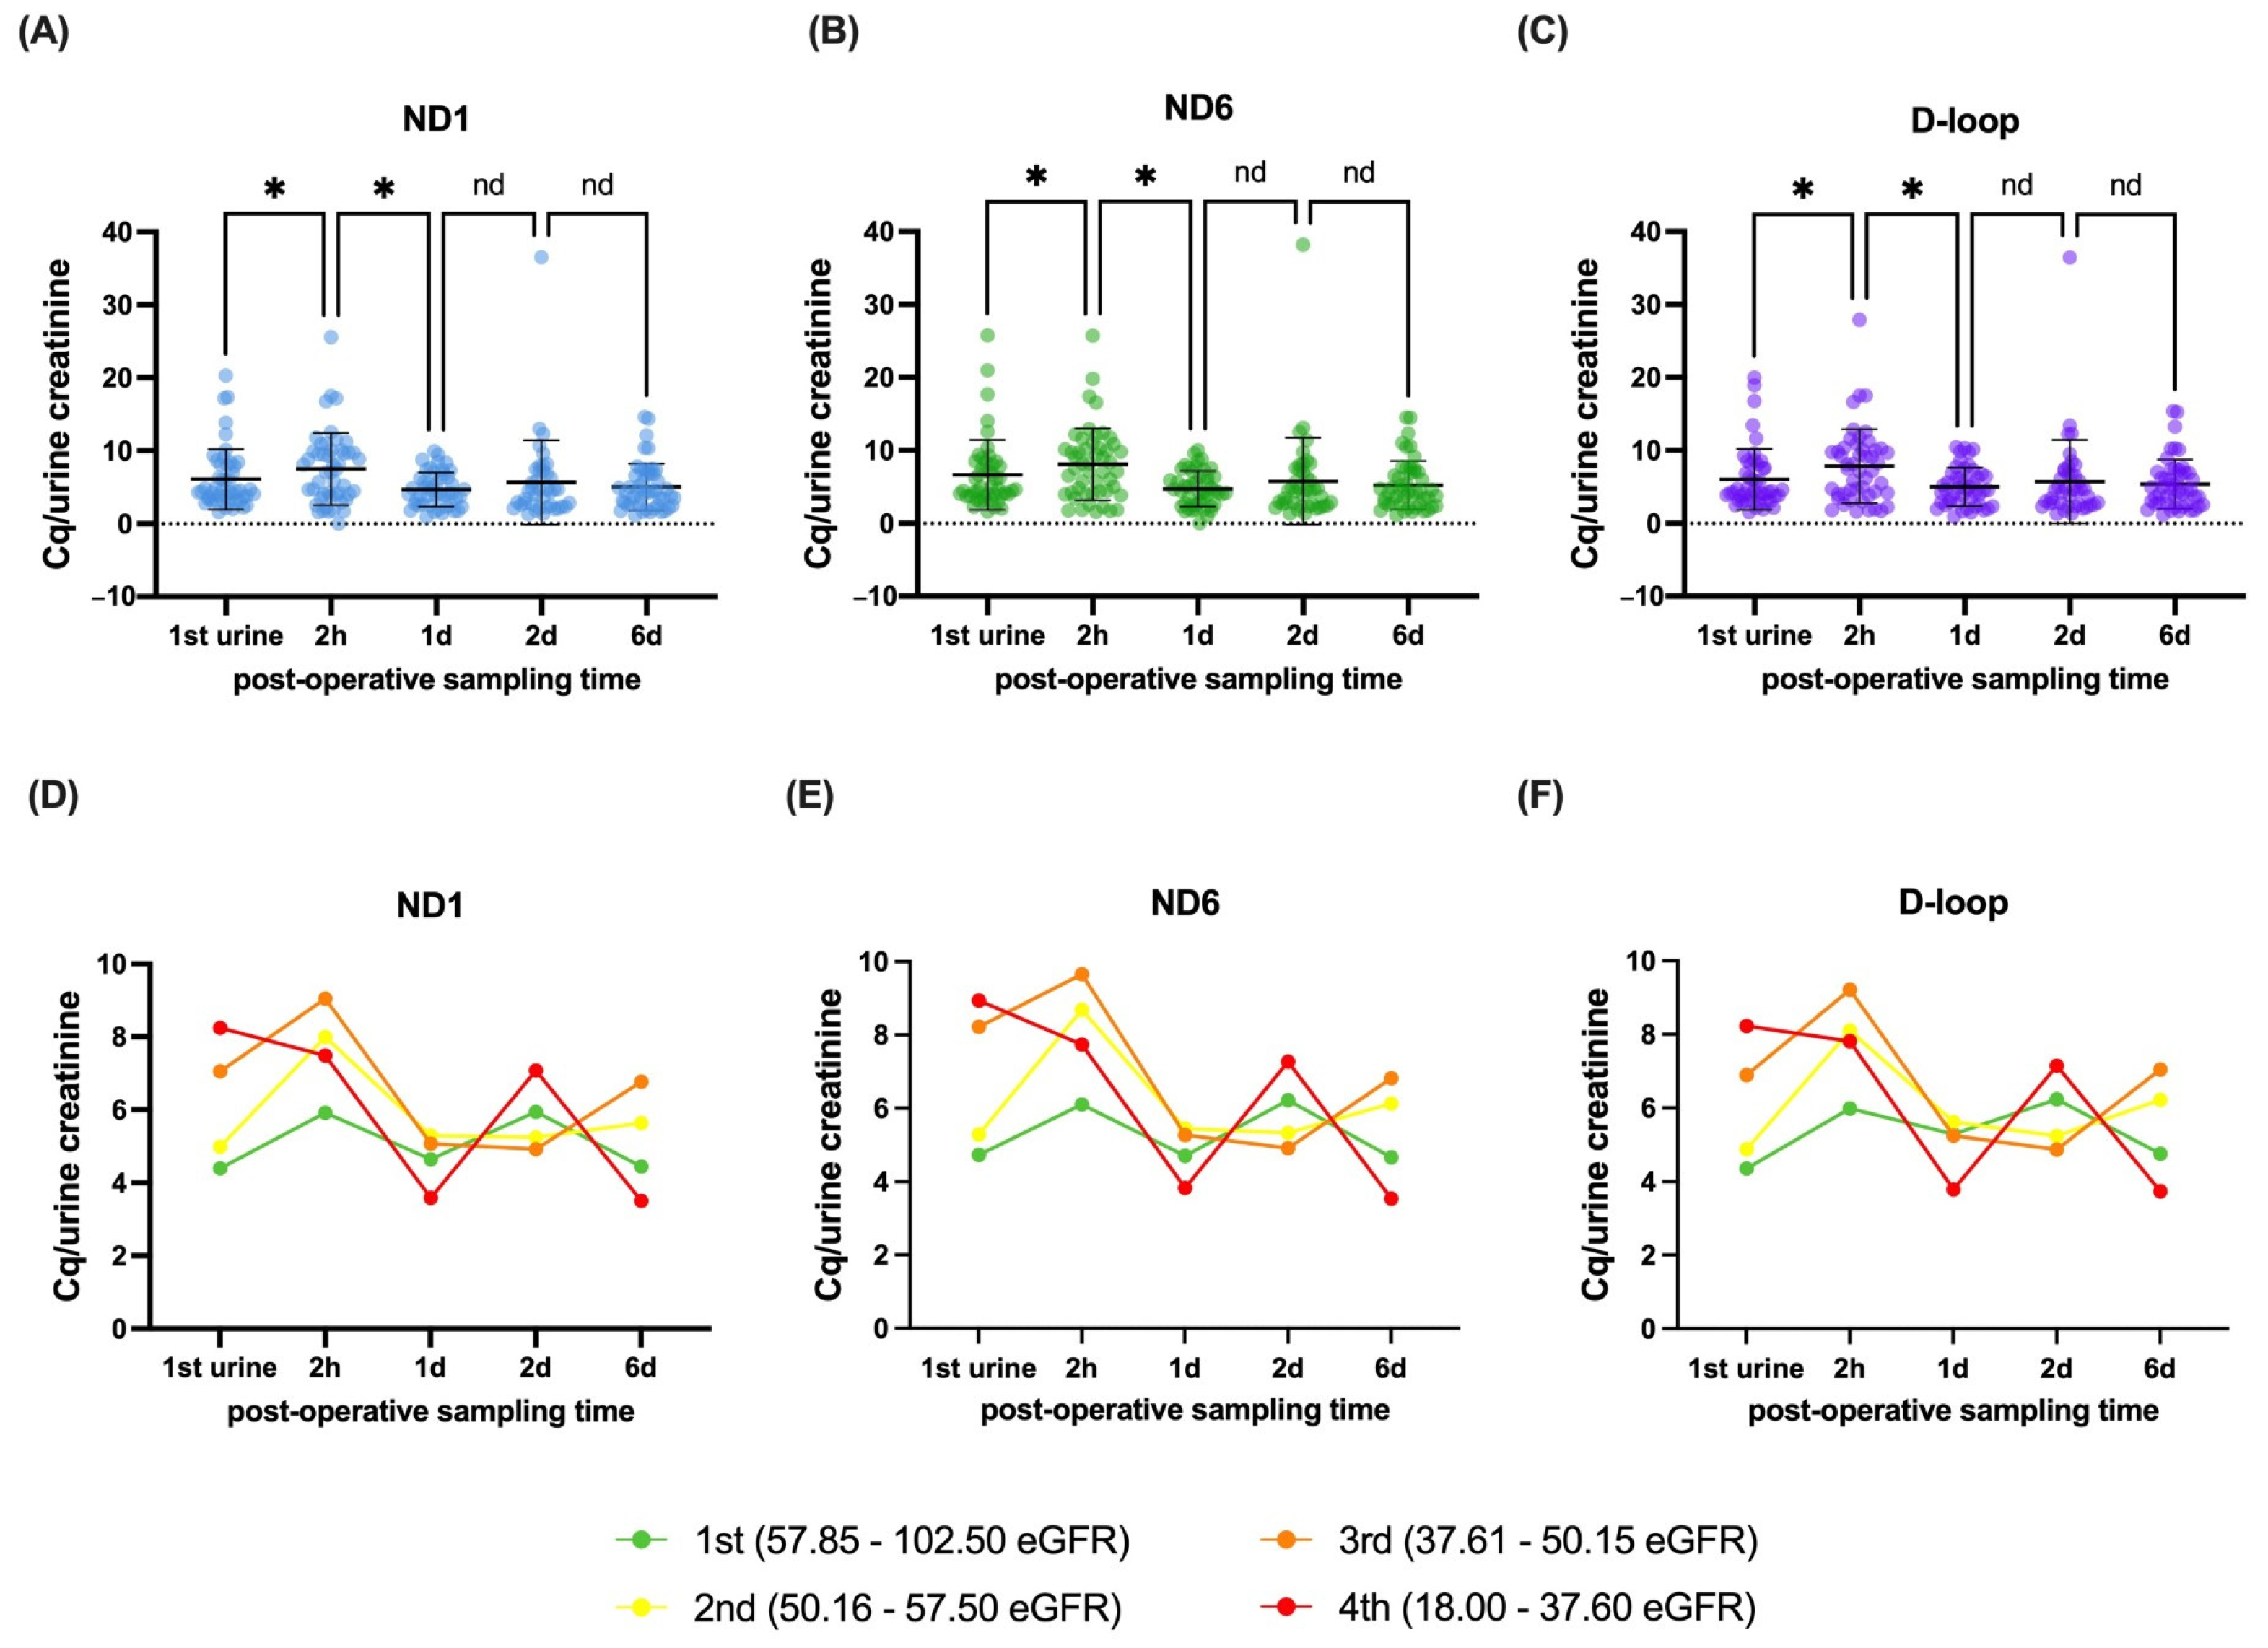
3.2. Dynamics and Stratification of mtDNA Genes in Recipients After Transplantation

The dynamics of the mtDNA genes are presented in Figure 1A–C. There was a significant decrease in the level of mtDNA between the first urine and two hours (ND1 individual p = 0.0259, q = 0.0408; ND6 individual p = 0.0268, q = 0.0422; D-loop individual p = 0.0088, q = 0.0093). This was followed by a significant increase in mtDNA level between 2 h post-operation and day 1 after transplantation (ND1 individual p < 0.0001, q < 0.0001; ND6 individual p < 0.0001, q < 0.0001; D-loop individual p < 0.0001, q < 0.0001), after which no significant differences were observed between day 1 and day 2 (ND1 individual p = 0.2643, q = 0.2776; ND6 individual p = 0.2511, q = 0.2637; D-loop individual p = 0.4315, q = 0.3020) and between day 2 and day 6 post transplantation (ND1 individual p = 0.5639, q = 0.4440; ND6 individual p = 0.6144, q = 0.4838; D-loop individual p = 0.7475; q = 0.3924).
To explore whether these dynamics relate to graft function, patients were grouped into quartiles based on their mean eGFR at 12 and 24 months. Figure 1D–F illustrate the mtDNA trajectories per quartile, providing a visual representation of differences in mtDNA levels over time across varying levels of long-term renal function. The average eGFR outcomes were 18.0–37.6 mL/min/1.73 m2 for the fourth quartile, 37.61–50.15 mL/min/1.73 m2 for the third quartile, 50.16–57.50 mL/min/1.73 m2 for the second quartile and 57.51–103 mL/min/1.73 m2 for the first quartile.
As a next step, we formally evaluated the relationship between UmtDNA and graft function outcomes using univariable regression models. These analyses are presented in the following section and detailed in Table 3.

3.3. The Additional Value of mtDNA Genes to Models for Renal Outcome

Univariable analysis of ND1, ND6, and D-loop showed several potential relations with eGFR after transplantation. A higher level of ND1 in the first urine after transplantation was significantly associated with higher eGFR at 12 months (p = 0.008, q = 0.030, B = −1.303) and an increase in eGFR between month 1 and 24 months after transplantation (p = 0.009, q = 0.030, B = −1.372) but not with eGFR at 1 month (p = 0.742, q = 0.515, B = 0.183) or 24 months after transplantation (p = 0.036, q = 0.052, B = −1.311). A higher level of ND1 2 h post-operatively was significantly associated with an increase in eGFR between month 1 and 24 months after transplantation (p = 0.007, q = 0.030, B = −1.188) but not with eGFR at 1 month (p = 0.479, q = 0.391, B = 0.335), 12 months (p = 0.250, q = 0.219, B = −0.512) and 24 months after transplantation (p = 0.064, q = 0.067, B = −1.029) (Table 3).
Furthermore, a higher level of ND6 in the first urine after transplantation was significantly associated with higher eGFR at 12 months (p = 0.016, q = 0.030, B = −1.050) and an increase in eGFR between month 1 and 24 months after transplantation (p = 0.015, q = 0.030, B = −1.141) but not with eGFR at 1 month (p = 0.752, q = 0.515, B = 0.154) or 24 months after transplantation (p = 0.046, q = 0.060, B = −1.098). A higher level of ND6 2 h post-operatively was significantly associated with an increase in eGFR between month 1 and 24 months after transplantation (p = 0.014, q = 0.030, B = −1.066), but not with eGFR at 1 month (p = 0.585, q = 0.439, B = 0.250), 12 months (p = 0.227, q = 0.210, B = −0.520), and 24 months after transplantation (p = 0.064, q = 0.067, B = −0.997).
Finally, a higher level of D-loop in the first urine after transplantation was significantly associated with higher eGFR at 12 months (p = 0.011, q = 0.030, B = −1.259) and an increase in eGFR between month 1 and 24 months after transplantation (p = 0.017, q = 0.030, B = −1.231) but not with eGFR at 1 month (p = 0.952, q = 0.625, B = 0.032) or 24 months after transplantation (p = 0.036, q = 0.052, B = −1.326). A higher level of D-loop 2 h post-operatively was significantly associated with an increase in eGFR between month 1 and 24 months after transplantation (p = 0.005, q = 0.030, B = −1.168) but not with eGFR at 1 month (p = 0.496, q = 0.391, B = 0.309), 12 months (p = 0.217, q = 0.210, B = −0.528), and 24 months after transplantation (p = 0.054, q = 0.065, B = −1.025).
To determine whether urinary creatinine alone was associated with graft outcomes, univariable regression analyses were performed. These showed no consistent associations between urinary creatinine and eGFR at any time point (Appendix Table A1).

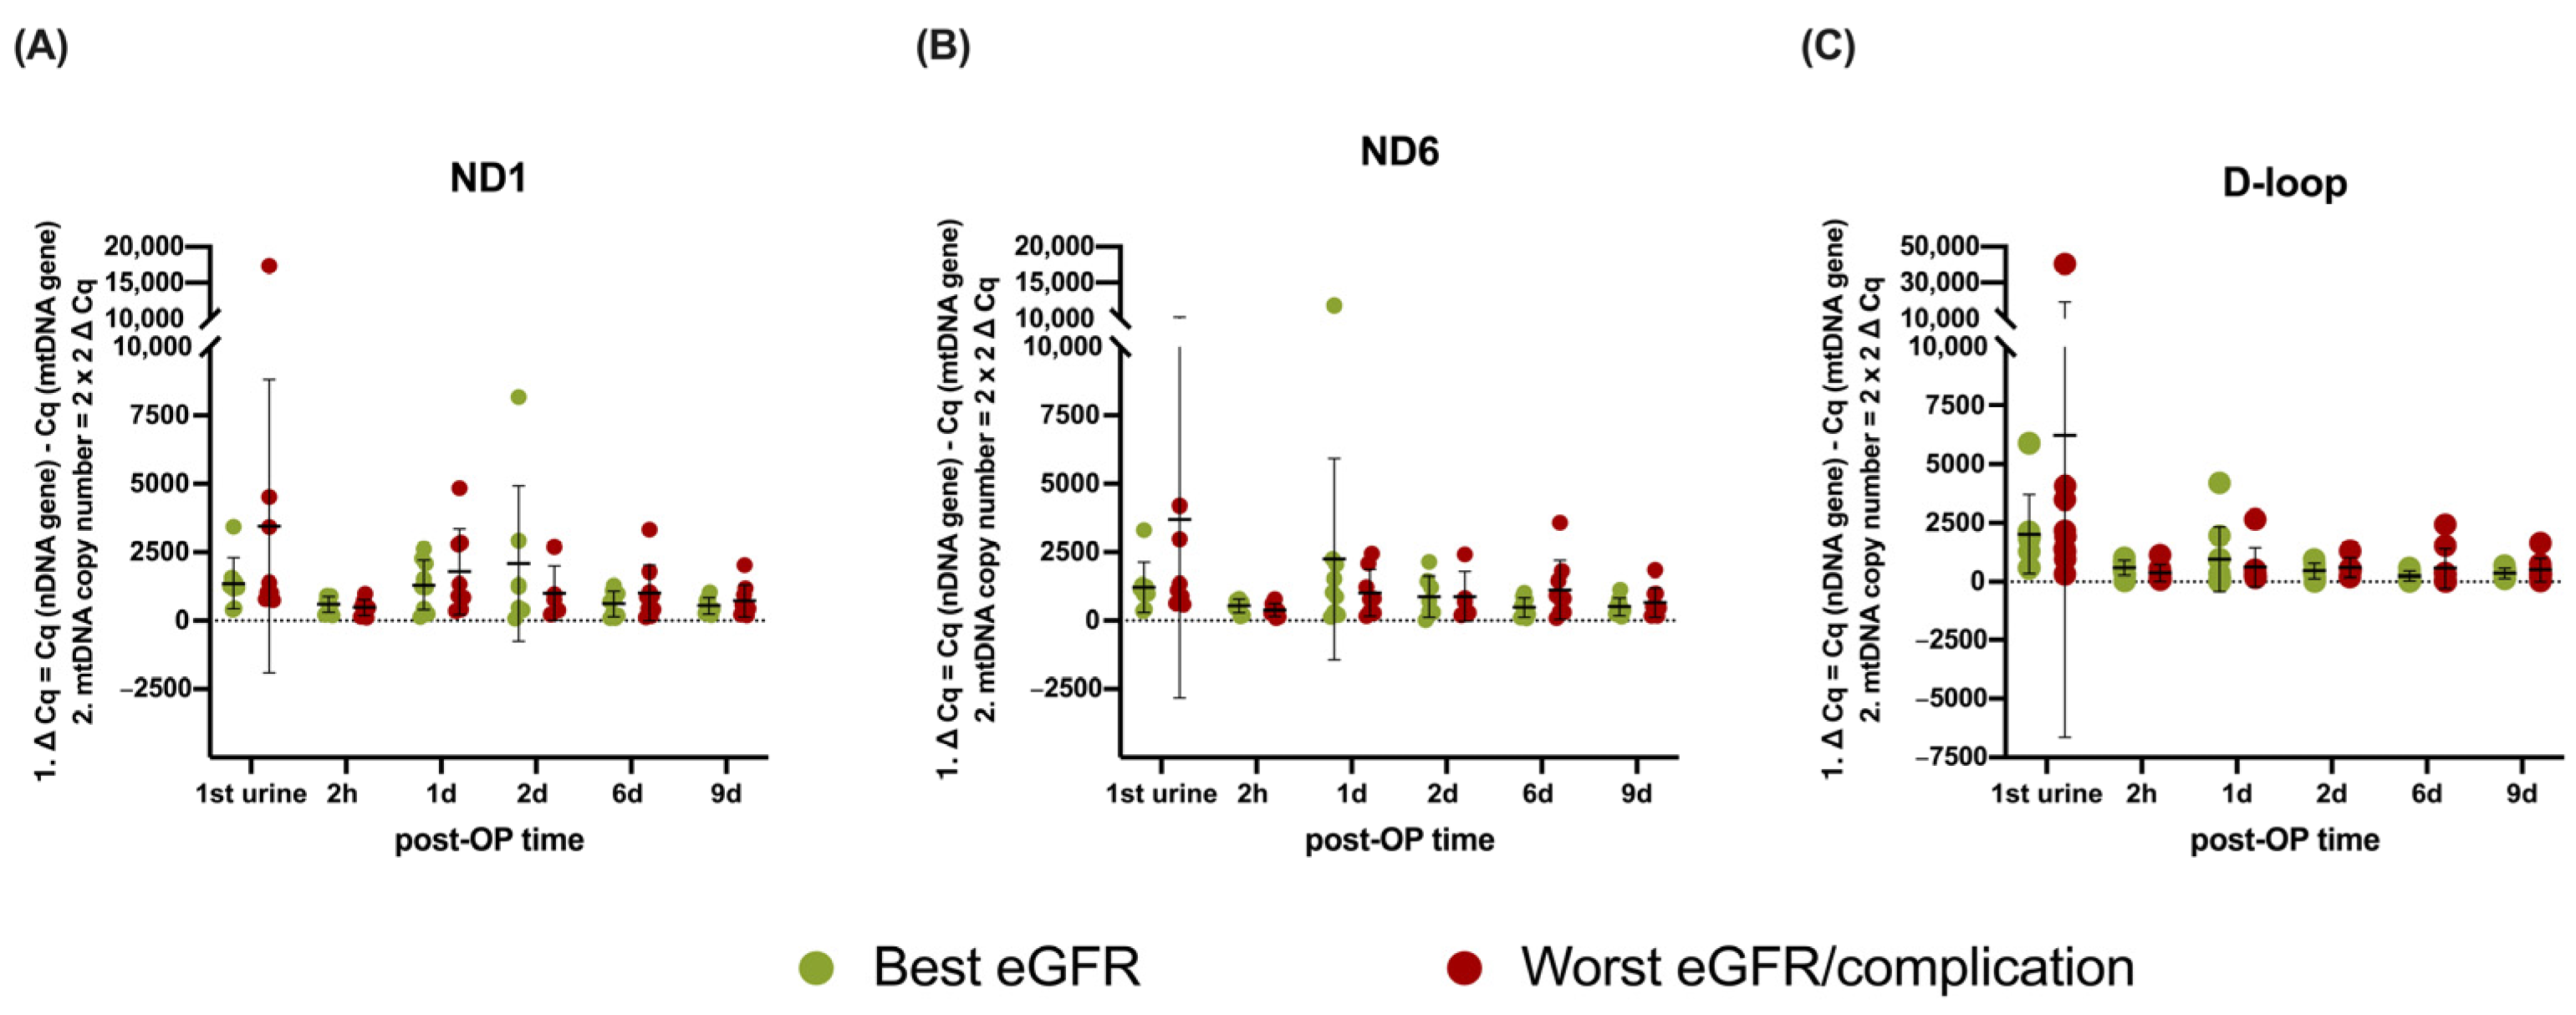
3.4. mtDNA Copy Number Analysis

Copy number analysis is shown in Figure 2A–C. To assess potential differences in long-term graft function, patients were stratified by mean eGFR at 12 and 24 months, selecting the nine recipients with the best and worst function. The patients within the worst outcome groups also all experienced an acute rejection period (see Table 2), whereas patients within the best function group did not. No significant differences in mitochondrial DNA copy number were found between treatment outcome groups based on average eGFR (Figure 2A: ND1 p = 0.4426; Figure 2B: ND6 p = 0.1982; Figure 2C: D-loop p = 0.1677) or over time (ND1 p = 0.1363; ND6 p = 0.5199; D-loop p = 0.4211).

4. Discussion

This study aimed to investigate the temporal profile of UmtDNA and whether UmtDNA levels in the early post-transplant period can predict long-term graft function in living donor kidney transplantation (LDKT). Our findings demonstrate that higher levels of ND1, ND6, and D-loop in the first urine are significantly associated with improved renal function at 12 months, as well as an improvement in renal function from 1 to 24 months. While these improvements were small and clinically insignificant in the current setting, the correlation remains highly relevant. Importantly, the current data primarily serve to establish the existence of a consistent relationship between early mtDNA levels and graft function. Whether this relationship is positive, negative, or clinically impactful may vary per context, but the presence of a reproducible association supports mtDNA as a meaningful biological readout. This underscores that the behavior and clinical interpretation of urinary mtDNA as a biomarker are context-dependent—its association with outcomes may vary by setting and injury severity. In environments with more pronounced ischemia–reperfusion injury (IRI), such as donation after circulatory death (DCD), donation after brain death (DBD), or cardiothoracic surgery, elevated mtDNA levels may reflect mitochondrial injury and predict poorer outcomes [1,32]. Therefore—despite the modest effect size—this study further consolidates the validity of cell-free UmtDNA as a biomarker for graft function in kidney transplantation, aligning with prior research in trauma, sepsis, and acute kidney injury, wherein increased mtDNA levels have consistently correlated with negative clinical outcomes such as organ failure and recovery [28,33,34,35,36,37,38]. Interestingly, however, our findings reveal an inverse relationship compared to most previous reports, which linked elevated mtDNA to tissue injury and worse outcomes [10,24,39,40]. In contrast, in our LDKT cohort, higher UmtDNA levels were associated with improved graft function, suggesting a context-dependent interpretation. Importantly, we confirmed that urinary creatinine levels alone were not consistently associated with long-term graft function (Appendix Table A1), reinforcing that the observed mtDNA associations are not simply a result of variation in urine concentration.
Given the kidney’s high metabolic demands, it is one of the most mitochondria-rich organs, making it particularly vulnerable to IRI [41,42]. Next to the increased release of mtDNA, IRI leads to mtDNA damage, exacerbating and manifesting sustained mitochondrial dysfunction, leading to chronic, low-grade release of mitochondrial DAMPs [1,32,43,44,45,46,47]. Furthermore, mitochondrial dysfunction shifts energy production from ATP generation toward excessive reactive oxygen species (ROS) production, resulting in oxidative stress, bioenergetic deficits, and impaired organ function [48,49,50]. This context is essential for understanding the complex relationship between mtDNA levels, mitochondrial integrity, and renal function after transplantation. This mechanism of sustained mitochondrial dysfunction and DAMP release also plays a central role in other forms of renal injury, such as acute kidney injury (AKI). It makes intuitive sense that a graft capable of promptly clearing circulating mtDNA may contract less damage and function better. For example, mtDNA is implicated in the etiology of acute kidney injury (AKI) [28,33,51]. In sepsis-AKI, UmtDNA is elevated and positively associated with serum creatinine levels [34]. The same applies to AKI following cardiac surgery [35]. MtDNA acts as a damage-associated molecular pattern (DAMP), released upon mitochondrial membrane leakage or cell death [52,53,54]. (Severe) AKI leads to acute tubular necrosis through several forms of (regulated) cell death that contribute to tubular demise, including highly immunogenic types such as necroptosis, pyroptosis, and ferroptosis [54,55,56]. As cell death is the main mechanism of DAMP release, the extent of tubular injury correlates with mtDNA release. These necrotic pathways trigger innate immune activation via TLR-9, NLRP3, and cGAS, leading to NF-κB-driven inflammation [57,58,59]. This inflammatory cascade primes the adaptive immune system, contributing to chronic allograft rejection [10,24,60,61,62]. Previous studies associate high mtDNA levels with worse outcomes, particularly in deceased donor kidney transplantation, where prolonged ischemia amplifies mitochondrial damage [10,24]. In contrast, our findings in LDKT suggest that early UmtDNA release may reflect efficient functional clearance rather than ongoing injury. This discrepancy supports the idea that mtDNA dynamics in LDKT are shaped more by the kidney’s ability to clear systemic DAMPs than by reflecting mitochondrial injury alone, emphasizing the need to evaluate biomarkers within their specific clinical context [46].
A cell’s mitochondrial mass can be approximated by the mitochondrial copy number, which is calculated by a weighted ratio of nuclear to mitochondrial DNA. In kidney disease, lower levels of mtDNA are associated with disease progression and decreased function [36,37,38,39,63,64]. Therefore, one possible explanation would be that the best functioning kidneys had more mitochondria, i.e., a higher mitochondrial copy number, and proportionally excreted more mtDNA into the urine. However, when treating urine as a tissue and calculating the mitochondrial copy number based on the presence of mtDNA and nuclear DNA, mitochondrial copy number was equal throughout all groups (Figure 2). This finding suggests that UmtDNA levels are not simply a reflection of mitochondrial abundance within renal cells. If increased UmtDNA levels originated primarily from the kidney itself, we would expect differences in mitochondrial copy number across groups. Instead, the fact that mitochondrial copy number remains stable indicates that UmtDNA levels are more likely governed by systemic factors, such as the kidney’s filtration and clearance capacity [65].
One possible interpretation is that mtDNA, when released into the circulation as a damage-associated molecular pattern (DAMP), must be efficiently cleared to prevent excessive inflammatory signaling. The kidney seems to play a crucial role in this process by filtering and excreting circulating mtDNA fragments [65,66]. In this context, higher UmtDNA levels may not reflect increased mitochondrial injury but rather a well-functioning graft capable of effectively clearing free mtDNA from the circulation. In this context, the initial rise in circulating mtDNA may stem from surgical trauma to both the recipient’s native tissues (e.g., abdominal wall and iliac vessel dissection) and manipulation of the donor kidney during implantation—resulting in transient systemic DAMP release that is then cleared by the graft. Consequently, elevated mtDNA in urine may serve as a marker of optimal filtration capacity and excellent graft function, rather than an indicator of cellular damage within the kidney itself [24,36,38].
The setting of LDKT may explain why our findings differ from previous studies. These kidneys are derived from healthy donors with short cold ischemic times and immediate graft function in the majority of patients. In this case, it seems likely that surgical trauma causes the release of DAMPs, including mtDNA, from the surgical site [40,66,67]. The mtDNA fragments presented in the systemic circulation are then filtered through the glomeruli and actively secreted into the urine, resulting in elevated mtDNA levels in the first urine upon reperfusion. The better the kidney functions, the faster the mtDNA appears in the urine. This is an important finding and underlines the importance of studying biomarkers in different contexts [10,26].
Supporting this, we recently demonstrated in the same cohort that kidney injury molecule-1 (KIM-1), traditionally a kidney damage marker, was related to long-term kidney function following the same pattern as cell-free mtDNA—in which higher levels are associated with better graft function [20]. This highlights the need to interpret biomarkers within specific contexts to avoid misjudging graft function. Collectively, our data suggest that biomarker behavior in living donor kidney transplantation (LDKT) may differ substantially from that in deceased donor transplantation, including both donation after brain death (DBD) and donation after circulatory death (DCD), yet confirm the usability of cell-free mtDNA as a prospective biomarker.

5. Future Perspectives and Limitations

While our sample size of 57 LDKT recipients was relatively small, it provided a homogeneous cohort with high organ quality and predictable outcomes. This limited our ability to assess complications such as delayed graft function (n = 3), graft loss (n = 2), and patient mortality (n = 1). Larger studies, particularly in deceased donor kidney transplantation, are needed to evaluate the broader applicability of our findings. Additionally, budget constraints restricted the number of urine collection timepoints, which may have limited our ability to capture the full dynamics of mtDNA release.
A major strength of this study is the use of split urine samples, ensuring that all urine analyzed originated from the transplanted kidney. The ongoing VAPOR-2 study, as a direct follow-up to VAPOR-1, will expand upon these findings with a larger and more diverse cohort, allowing further insights into mtDNA dynamics and its prognostic value across different transplantation settings. However, we acknowledge that the method of urine collection via an exteriorized ureteral splint, functioning as a suprapubic catheter, reflected standard clinical practice at our center during the VAPOR-1 study period and enabled early, graft-specific urine sampling. Since then, our institution has transitioned to the use of double J stents for ureteral drainage, which do not permit the same isolated urine collection from the graft. As such, future studies aiming to validate urinary mtDNA as a biomarker must evaluate whether similar associations can be observed under current double J stent protocols. This will be critical for translating our findings into routine clinical practice and ensuring applicability across transplant centers.

6. Conclusions

This study suggests that in the LDKT study population of VAPOR-1, a higher level of UmtDNA in the first urine correlates with higher renal function at 12 months and increases in eGFR between month 1 and 24 after transplantation. These higher UmtDNA levels reflect the kidney’s filtration ability to clear systemic mtDNA rather than mtDNA release from the kidney’s tubular cells. This counterintuitive relation between damage markers and renal function calls for a paradigm shift in interpreting renal damage markers in IRI-induced AKI, particularly in living donor kidney transplantation, as previous studies in kidney transplantation have typically assessed mtDNA levels weeks after transplantation, whereas our study is among the first to examine these levels within the initial minutes to days. This difference in timing may be a key factor influencing biomarker interpretation.

Author Contributions

L.G.: Conceptualization, investigation, methodology, formal analysis, data curation, visualization, writing—original draft, and writing—review and editing. J.H.: Investigation, formal analysis, data curation, writing—original draft, and writing—review and editing. N.S.: Data interpretation and writing—review and editing. F.L.C.: Methodology. M.S.: Conceptualization, investigation, and writing—review and editing. H.L.: Conceptualization, investigation, and writing—review and editing. R.H.: Supervision and writing—review and editing. G.N.-M.: Conceptualization, investigation, supervision, and writing—review and editing. All authors have read and agreed to the published version of the manuscript.

Funding

VAPOR-1 was funded by the University Medical Centre Groningen, Groningen, The Netherlands (internal effectivity grant no. 684000). This work was supported by GUIDE and University Medical Centre Groningen (MD/PhD grant to L.G. and MD/PhD grant to N.S.).

Institutional Review Board Statement

This study was a post hoc analysis of the VAPOR-1 (Volatile Anesthetic Protection of Renal Transplants-1) trial, a prospective randomized controlled trial comparing the effect of two anesthetic agents (propofol vs. sevoflurane) on graft outcome in LDKT. The VAPOR-1 trial was conducted at the University Medical Center of Groningen between September 2010 and October 2014. The Institutional Review Board approved the study protocol (METc 2009/334, date of 31 March 2010), which was conducted in adherence with the Declaration of Helsinki and registered with ClinicalTrials.gov: NCT01248871. Details of the study have been published previously [29].

Informed Consent Statement

Informed consent was obtained from all subjects involved in the study. During the preparation of this work, the authors used OpenAI’s GPT4 (Version 4o) in order to improve the grammar and spelling. After using this tool, the authors reviewed and edited the content as needed and take full responsibility for the content of the publication.

Data Availability Statement

The data that support the findings of this study will be available upon request.

Acknowledgments

Special thanks to Simon (S.E. Wink) for his help designing the graphical abstract.

Conflicts of Interest

M.S. His research group/department has received (over the last 3 years) research grants and consultancy fees from Masimo (Irvine, CA, USA), Becton Dickinson (Eysins, Switzerland), Fresenius-Kabi (Bad Homburg, Germany), Paion (Aachen, Germany), Medcaptain Europe (Andelst, The Netherlands), Baxter (Chicago, IL, USA), and HanaPharm (Seoul, Republic of Korea). He receives royalties on intellectual property from Demed Medical (Sinaai, Belgium) and Ghent University (Gent, Belgium). H.L. is Chief Scientific Officer of 34 Lives (West Lafayette, IN, USA) and has received institutional research grants from the Dutch Kidney Foundation and NOVO Nordisk Foundation. G.N.M.: Her research group has received research grants from the Dutch Transplant Society, the UMCG Transplant Fund, the European Society of Anaesthesia and Intensive Care, HosmartAI, the De Cock Hadders Foundation, NIAA RCoA/BJA, and Sedana Medi-cal, and travel grants from the European Society of Anaesthesia and Intensive Care, University Hospital Zurich, and the Scandinavia Society of Anaesthesia and Intensive Care; plus, she is an editor of the British Journal of Anaesthesia Education.

Abbreviations

The following abbreviations are used in this manuscript:
AKIacute kidney injury
ATPadenosine triphosphate
β2Mbeta-2 microglobulin
BMIbody mass index
cGAScyclic GMP–AMP synthase
cGAMPcyclic GMP-AMP
CIconfidence interval
CITcold ischemia time
CKDchronic kidney disease
Cqquantification cycle
Dday
DAMPdamage-associated molecular pattern
DGFdelayed graft function
D-loopdisplacement-loop
eGFRestimated glomerular filtration rate
ETCelectron transport chain
HLAhuman leukocyte antigens
H-strandheavy strand
IFTAinterstitial fibrosis and tubular atrophy
IQRinterquartile range
IRIischemia–reperfusion injury
Kgkilogram
KIM-1kidney injury molecule-1
LDKTliving donor kidney transplantation
L-strandlight strand
m2square meter
mGFRmeasured glomerular filtration rate
Minminute
Mlmilliliter
mtDNAmitochondrial DNA
Nnumber
NAGn-acetyl-β-D-glucosaminidase
nDNAnuclear DNA
ND1NADH ubiquinone oxidoreductase subunit 1
ND6NADH ubiquinone oxidoreductase subunit 6
NGALneutrophil gelatinase-associated Lipocalin
NFκBnuclear factor kappa-light-chain-enhancer of activated B cells
PNFprimary non-function
post-OPpost-operative
PPIsproton pump inhibitors
PRApanel-specific antibodies
PRRpattern recognition receptor
qPCRquantitative polymerase chain reaction
REMLrestricted maximum likelihood
ROSreactive oxygen species
SDstandard deviation
STINGstimulator interferon genes
TLRtoll-like receptor
VAPOR-1Volatile Anesthetic Protection of Renal Transplants-1
WIT1first warm ischemia time
WIT2second warm ischemia time
Yyears

Appendix A

Appendix A.1. Urinary Creatinine Does Not Explain mtDNA Associations

To correct for urine concentration, mtDNA levels were normalized to urinary creatinine, as described in the Methods section. To confirm that the observed associations were not driven by urinary creatinine itself, we performed univariable regression analyses with creatinine levels from the same timepoints.
As shown in Table A1, creatinine alone did not consistently predict graft function at 1, 12, or 24 months, nor did it correlate with changes in eGFR between month 1 and 24. These results demonstrate that the associations observed with mtDNA are not attributable to urine creatinine alone.
Table A1. Univariable regression analysis of urine creatinine levels.
1-Month eGFR
Variablep-valueq-valueEstimate (95% CI)
Creatinine 1st urine0.9710.981−0.032 (−1.793–1.728)
Creatinine 2 h0.7840.905−0.181 (−1.498–1.136)
12-Month eGFR
Variablep-valueq-valueEstimate (95% CI)
Creatinine 1st urine0.0320.0831.764 (0.154–3.374)
Creatinine 2 h0.3950.5320.535 (−0.716–1.787)
24-Month eGFR
Variablep-valueq-valueEstimate (95% CI)
Creatinine 1st urine0.0670.1081.894 (−0.140–3.928)
Creatinine 2 h0.0070.0572.337 (0.656–4.019)
ΔeGFR 1–24 Months
Variablep-valueq-valueEstimate (95% CI)
Creatinine 1st urine0.0410.0831.740 (0.076–3.405)
Creatinine 2 h0.0260.0831.628 (0.200–3.056)
Data are presented as p-values, q-values, and estimates (β with confidence interval [CI]). Data shown for p-values < 0.250. Abbreviations: eGFR—estimated glomerular filtration rate; h—hours Note: Cq values are inversely related to the amount of mtDNA. Analyses were performed using univariable linear regression. False discovery rate (FDR) correction was applied using the Benjamini–Krieger–Yekutieli procedure. Statistical significance was defined as q < 0.05.

References

  1. Salvadori, M.; Rosso, G.; Bertoni, E. Update on ischemia-reperfusion injury in kidney transplantation: Pathogenesis and treatment. World J. Transplant. 2015, 5, 52–67. [Google Scholar] [CrossRef] [PubMed]
  2. Ponticelli, C. Ischaemia-reperfusion injury: A major protagonist in kidney transplantation. Nephrol. Dial. Transplant. 2014, 29, 1134–1140. [Google Scholar] [CrossRef] [PubMed]
  3. Jahn, N.; Sack, U.; Stehr, S.; Vöelker, M.T.; Laudi, S.; Seehofer, D.; Atay, S.; Zgoura, P.; Viebahn, R.; Boldt, A.; et al. The role of innate immune cells in the prediction of early renal allograft injury following kidney transplantation. J. Clin. Med. 2022, 11, 6148. [Google Scholar] [CrossRef] [PubMed]
  4. Yarlagadda, S.G.; Coca, S.G.; Formica, R.N.; Poggio, E.D.; Parikh, C.R. Association between delayed graft function and allograft and patient survival: A systematic review and meta-analysis. Nephrol. Dial. Transplant. 2009, 24, 1039–1047. [Google Scholar] [CrossRef] [PubMed]
  5. Nieuwenhuijs-Moeke, G.J.; Pischke, S.E.; Berger, S.P.; Sanders, J.S.F.; Pol, R.A.; Struys, M.M.R.F.; Ploeg, R.J.; Leuvenink, H.G.D. Ischemia and reperfusion injury in kidney transplantation: Relevant mechanisms in injury and repair. J. Clin. Med. 2020, 9, 253. [Google Scholar] [CrossRef]
  6. Krysko, D.V.; Agostinis, P.; Krysko, O.; Garg, A.D.; Bachert, C.; Lambrecht, B.N.; Vandenabeele, P. Emerging role of damage-associated molecular patterns derived from mitochondria in inflammation. Trends Immunol. 2011, 32, 157–164. [Google Scholar] [CrossRef] [PubMed]
  7. Riley, J.S.; Tait, S.W. Mitochondrial DNA in inflammation and immunity. EMBO Rep. 2020, 21, e49799. [Google Scholar] [CrossRef]
  8. Zhang, Q.; Raoof, M.; Chen, Y.; Sumi, Y.; Sursal, T.; Junger, W.; Brohi, K.; Itagaki, K.; Hauser, C.J. Circulating mitochondrial DAMPs cause inflammatory responses to injury. Nature 2010, 464, 104–107. [Google Scholar] [CrossRef]
  9. Zanini, G.; Selleri, V.; Lopez Domenech, S.; Malerba, M.; Nasi, M.; Mattioli, A.V.; Pinti, M. Mitochondrial DNA as inflammatory DAMP: A warning of an aging immune system? Biochem. Soc. Trans. 2023, 51, 735–745. [Google Scholar] [CrossRef]
  10. Kim, K.; Moon, H.; Lee, Y.H.; Seo, J.-W.; Kim, Y.G.; Moon, J.-Y.; Kim, J.S.; Jeong, K.H.; Lee, T.W.; Ihm, C.G.; et al. Clinical relevance of cell-free mitochondrial DNA during the early postoperative period in kidney transplant recipients. Sci. Rep. 2019, 9, 18607. [Google Scholar] [CrossRef]
  11. Jansen, M.P.B.; Pulskens, W.P.C.; Uil, M.; Claessen, N.; Nieuwenhuizen, G.; Standaar, D.; Hau, C.M.; Nieuwland, R.; Florquin, S.; Bemelman, F.J.; et al. Urinary mitochondrial DNA associates with delayed graft function following renal transplantation. Nephrol. Dial. Transplant. 2020, 35, 1320–1327. [Google Scholar] [CrossRef] [PubMed]
  12. Haines, R.W.; Fowler, A.J.; Liang, K.; Pearse, R.M.; Larsson, A.O.; Puthucheary, Z.; Prowle, J.R. Comparison of Cystatin C and Creatinine in the Assessment of Measured Kidney Function during Critical Illness. Clin. J. Am. Soc. Nephrol. 2023, 18, 997–1005. [Google Scholar] [CrossRef] [PubMed]
  13. Pan, P.; Binjie, H.; Min, L.; Lipei, F.; Yanli, N.; Junwen, Z.; Xianghua, S. A meta-analysis on diagnostic value of serum cystatin C and creatinine for the evaluation of glomerular filtration function in renal transplant patients. Afr. Health Sci. 2014, 14, 1025–1035. [Google Scholar] [CrossRef] [PubMed]
  14. Waikar, S.S.; Betensky, R.A.; Bonventre, J.V. Creatinine as the gold standard for kidney injury biomarker studies? Nephrol. Dial. Transplant. 2009, 24, 3263–3265. [Google Scholar] [CrossRef] [PubMed]
  15. Waikar, S.S.; Betensky, R.A.; Emerson, S.C.; Bonventre, J.V. Imperfect gold standards for kidney injury biomarker evaluation. J. Am. Soc. Nephrol. 2012, 23, 13–21. [Google Scholar] [CrossRef]
  16. Harman, G.; Akbari, A.; Hiremath, S.; White, C.A.; Ramsay, T.; Kokolo, M.B.; Craig, J.; Knoll, G.A. Accuracy of cystatin C-based estimates of glomerular filtration rate in kidney transplant recipients: A systematic review. Nephrol. Dial. Transplant. 2013, 28, 741–757. [Google Scholar] [CrossRef] [PubMed]
  17. Ricci, Z.; Cruz, D.; Ronco, C. The RIFLE criteria and mortality in acute kidney injury: A systematic review. Kidney Int. 2008, 73, 538–546. [Google Scholar] [CrossRef] [PubMed]
  18. Malyszko, J.; Lukaszyk, E.; Glowinska, I.; Durlik, M. Biomarkers of delayed graft function as a form of acute kidney injury in kidney transplantation. Sci. Rep. 2015, 5, 11684. [Google Scholar] [CrossRef] [PubMed]
  19. Halawa, A. The early diagnosis of acute renal graft dysfunction: A challenge we face. The role of novel biomarkers. Ann. Transplant. 2011, 16, 90–98. [Google Scholar] [PubMed]
  20. Huisman, G.J.J.; Spraakman, N.A.; Koomen, J.V.; Talsma, A.M.; Pol, R.A.; Berger, S.P.; Leuvenink, H.G.D.; Struys, M.M.R.F.; Nieuwenhuijs-Moeke, G.J. Urinary Biomarkers in a Living Donor Kidney Transplantation Cohort-Predictive Value on Graft Function. Int. J. Mol. Sci. 2023, 24, 5649. [Google Scholar] [CrossRef] [PubMed]
  21. Vanmassenhove, J.; Vanholder, R.; Nagler, E.; Van Biesen, W. Urinary and serum biomarkers for the diagnosis of acute kidney injury: An in-depth review of the literature. Nephrol. Dial. Transplant. 2013, 28, 254–273. [Google Scholar] [CrossRef] [PubMed]
  22. Beker, B.M.; Corleto, M.G.; Fieiras, C.; Musso, C.G. Novel acute kidney injury biomarkers: Their characteristics, utility and concerns. Int. Urol. Nephrol. 2018, 50, 705–713. [Google Scholar] [CrossRef]
  23. Obermüller, N.; Geiger, H.; Weipert, C.; Urbschat, A. Current developments in early diagnosis of acute kidney injury. Int. Urol. Nephrol. 2014, 46, 1–7. [Google Scholar] [CrossRef]
  24. Han, F.; Wan, S.; Sun, Q.; Chen, N.; Li, H.; Zheng, L.; Zhang, N.; Huang, Z.; Hong, L.; Qiquan, S. Donor Plasma Mitochondrial DNA Is Correlated with Posttransplant Renal Allograft Function. Transplantation 2019, 103, 2347–2358. [Google Scholar] [CrossRef] [PubMed]
  25. Han, F.; Sun, Q.; Huang, Z.; Li, H.; Ma, M.; Liao, T.; Luo, Z.; Zheng, L.; Zhang, N.; Chen, N.; et al. Donor plasma mitochondrial DNA is associated with antibody-mediated rejection in renal allograft recipients. Aging 2021, 13, 8440–8453. [Google Scholar] [CrossRef]
  26. Kroneisl, M.; Spraakman, N.A.; Koomen, J.V.; Hijazi, Z.; Hoogstra-Berends, F.H.; Leuvenink, H.G.D.; Struys, M.M.R.F.; Henning, R.H.; Nieuwenhuijs-Moeke, G.J. Peri-Operative Kinetics of Plasma Mitochondrial DNA Levels during Living Donor Kidney Transplantation. Int. J. Mol. Sci. 2023, 24, 13579. [Google Scholar] [CrossRef]
  27. Jansen, M.P.B.; Pulskens, W.P.; Butter, L.M.; Florquin, S.; Juffermans, N.P.; Roelofs, J.J.T.H.; Leemans, J.C. Mitochondrial DNA is released in urine of SIRS patients with acute kidney injury and correlates with severity of renal dysfunction. Shock 2018, 49, 301–310. [Google Scholar] [CrossRef]
  28. Liu, J.; Jia, Z.; Gong, W. Circulating mitochondrial DNA stimulates innate immune signaling pathways to mediate acute kidney injury. Front. Immunol. 2021, 12, 680648. [Google Scholar] [CrossRef] [PubMed]
  29. Nieuwenhuijs-Moeke, G.J.; Nieuwenhuijs, V.B.; Seelen, M.A.J.; Berger, S.P.; van den Heuvel, M.C.; Burgerhof, J.G.M.; Ottens, P.J.; Ploeg, R.J.; Leuvenink, H.G.D.; Struys, M.M.R.F. Propofol-based anaesthesia versus sevoflurane-based anaesthesia for living donor kidney transplantation: Results of the VAPOR-1 randomized controlled trial. Br. J. Anaesth. 2017, 118, 720–732. [Google Scholar] [CrossRef]
  30. Simmons, J.D.; Lee, Y.-L.; Mulekar, S.; Kuck, J.L.; Brevard, S.B.; Gonzalez, R.P.; Gillespie, M.N.; Richards, W.O. Elevated levels of plasma mitochondrial DNA DAMPs are linked to clinical outcome in severely injured human subjects. Ann. Surg. 2013, 258, 591–596; discussion 596. [Google Scholar] [CrossRef]
  31. Quiros, P.M.; Goyal, A.; Jha, P.; Auwerx, J. Analysis of mtDNA/nDNA Ratio in Mice. Curr. Protoc. Mouse Biol. 2017, 7, 47–54. [Google Scholar] [CrossRef] [PubMed]
  32. Kuznetsov, A.V.; Javadov, S.; Margreiter, R.; Grimm, M.; Hagenbuchner, J.; Ausserlechner, M.J. The Role of Mitochondria in the Mechanisms of Cardiac Ischemia-Reperfusion Injury. Antioxidants 2019, 8, 454. [Google Scholar] [CrossRef] [PubMed]
  33. Hu, Q.; Ren, J.; Wu, J.; Li, G.; Wu, X.; Liu, S.; Wang, G.; Gu, G.; Ren, H.; Hong, Z.; et al. Urinary mitochondrial DNA levels identify acute kidney injury in surgical critical illness patients. Shock 2017, 48, 11–17. [Google Scholar] [CrossRef] [PubMed]
  34. Hu, Q.; Ren, J.; Ren, H.; Wu, J.; Wu, X.; Liu, S.; Wang, G.; Gu, G.; Guo, K.; Li, J. Urinary Mitochondrial DNA Identifies Renal Dysfunction and Mitochondrial Damage in Sepsis-Induced Acute Kidney Injury. Oxid. Med. Cell. Longev. 2018, 2018, 8074936. [Google Scholar] [CrossRef]
  35. Ho, P.W.-L.; Pang, W.-F.; Luk, C.C.-W.; Ng, J.K.-C.; Chow, K.-M.; Kwan, B.C.-H.; Li, P.K.-T.; Szeto, C.-C. Urinary mitochondrial DNA level as a biomarker of acute kidney injury severity. Kidney Dis. 2017, 3, 78–83. [Google Scholar] [CrossRef]
  36. Cao, H.; Wu, J.; Luo, J.; Chen, X.; Yang, J.; Fang, L. Urinary mitochondrial DNA: A potential early biomarker of diabetic nephropathy. Diabetes Metab. Res. Rev. 2019, 35, e3131. [Google Scholar] [CrossRef] [PubMed]
  37. Wei, P.Z.; Kwan, B.C.-H.; Chow, K.M.; Cheng, P.M.-S.; Luk, C.C.-W.; Li, P.K.-T.; Szeto, C.C. Urinary mitochondrial DNA level is an indicator of intra-renal mitochondrial depletion and renal scarring in diabetic nephropathy. Nephrol. Dial. Transplant. 2018, 33, 784–788. [Google Scholar] [CrossRef]
  38. Yu, B.C.; Cho, N.-J.; Park, S.; Kim, H.; Gil, H.-W.; Lee, E.Y.; Kwon, S.H.; Jeon, J.S.; Noh, H.; Han, D.C.; et al. Minor Glomerular Abnormalities are Associated with Deterioration of Long-Term Kidney Function and Mitochondrial Injury. J. Clin. Med. 2019, 9, 33. [Google Scholar] [CrossRef]
  39. Wei, P.Z.; Kwan, B.C.-H.; Chow, K.M.; Cheng, P.M.-S.; Luk, C.C.-W.; Lai, K.-B.; Li, P.K.-T.; Szeto, C.C. Urinary mitochondrial DNA level in non-diabetic chronic kidney diseases. Clin. Chim. Acta 2018, 484, 36–39. [Google Scholar] [CrossRef]
  40. Ye, J.; Hu, X.; Wang, Z.; Li, R.; Gan, L.; Zhang, M.; Wang, T. The role of mtDAMPs in the trauma-induced systemic inflammatory response syndrome. Front. Immunol. 2023, 14, 1164187. [Google Scholar] [CrossRef]
  41. Bhargava, P.; Schnellmann, R.G. Mitochondrial energetics in the kidney. Nat. Rev. Nephrol. 2017, 13, 629–646. [Google Scholar] [CrossRef]
  42. Bullen, A.; Liu, Z.Z.; Hepokoski, M.; Li, Y.; Singh, P. Renal oxygenation and hemodynamics in kidney injury. Nephron 2017, 137, 260–263. [Google Scholar] [CrossRef] [PubMed]
  43. Nørgård, M.Ø.; Svenningsen, P. Acute kidney injury by ischemia/reperfusion and extracellular vesicles. Int. J. Mol. Sci. 2023, 24, 15312. [Google Scholar] [CrossRef] [PubMed]
  44. Trujillo-Rangel, W.Á.; García-Valdés, L.; Méndez-Del Villar, M.; Castañeda-Arellano, R.; Totsuka-Sutto, S.E.; García-Benavides, L. Therapeutic Targets for Regulating Oxidative Damage Induced by Ischemia-Reperfusion Injury: A Study from a Pharmacological Perspective. Oxid. Med. Cell. Longev. 2022, 2022, 8624318. [Google Scholar] [CrossRef]
  45. Nadalutti, C.A.; Ayala-Peña, S.; Santos, J.H. Mitochondrial DNA damage as driver of cellular outcomes. Am. J. Physiol. Cell Physiol. 2022, 322, C136–C150. [Google Scholar] [CrossRef] [PubMed]
  46. Feng, J.; Chen, Z.; Liang, W.; Wei, Z.; Ding, G. Roles of mitochondrial DNA damage in kidney diseases: A new biomarker. Int. J. Mol. Sci. 2022, 23, 15166. [Google Scholar] [CrossRef] [PubMed]
  47. Lin, M.-M.; Liu, N.; Qin, Z.-H.; Wang, Y. Mitochondrial-derived damage-associated molecular patterns amplify neuroinflammation in neurodegenerative diseases. Acta Pharmacol. Sin. 2022, 43, 2439–2447. [Google Scholar] [CrossRef]
  48. Lira Chavez, F.M.; Gartzke, L.P.; van Beuningen, F.E.; Wink, S.E.; Henning, R.H.; Krenning, G.; Bouma, H.R. Restoring the infected powerhouse: Mitochondrial quality control in sepsis. Redox Biol. 2023, 68, 102968. [Google Scholar] [CrossRef] [PubMed]
  49. Brealey, D.; Brand, M.; Hargreaves, I.; Heales, S.; Land, J.; Smolenski, R.; Davies, N.A.; Cooper, C.E.; Singer, M. Association between mitochondrial dysfunction and severity and outcome of septic shock. Lancet 2002, 360, 219–223. [Google Scholar] [CrossRef]
  50. Huang, W.; Wang, X.; Zhang, H.; Wang, G.; Xie, F.; Liu, D. Serum Mitochondrial Quality Control Related Biomarker Levels are Associated with Organ Dysfunction in Septic Patients. Shock 2021, 56, 412–418. [Google Scholar] [CrossRef] [PubMed]
  51. Jin, L.; Yu, B.; Armando, I.; Han, F. Mitochondrial DNA-Mediated Inflammation in Acute Kidney Injury and Chronic Kidney Disease. Oxid. Med. Cell. Longev. 2021, 2021, 9985603. [Google Scholar] [CrossRef] [PubMed]
  52. Sanz, A.B.; Sanchez-Niño, M.D.; Ramos, A.M.; Ortiz, A. Regulated cell death pathways in kidney disease. Nat. Rev. Nephrol. 2023, 19, 281–299. [Google Scholar] [CrossRef] [PubMed]
  53. Tummers, B.; Green, D.R. The evolution of regulated cell death pathways in animals and their evasion by pathogens. Physiol. Rev. 2022, 102, 411–454. [Google Scholar] [CrossRef]
  54. Linkermann, A.; Chen, G.; Dong, G.; Kunzendorf, U.; Krautwald, S.; Dong, Z. Regulated cell death in AKI. J. Am. Soc. Nephrol. 2014, 25, 2689–2701. [Google Scholar] [CrossRef]
  55. Guerrero-Mauvecin, J.; Villar-Gómez, N.; Rayego-Mateos, S.; Ramos, A.M.; Ruiz-Ortega, M.; Ortiz, A.; Sanz, A.B. Regulated necrosis role in inflammation and repair in acute kidney injury. Front. Immunol. 2023, 14, 1324996. [Google Scholar] [CrossRef]
  56. Guo, R.; Duan, J.; Pan, S.; Cheng, F.; Qiao, Y.; Feng, Q.; Liu, D.; Liu, Z. The Road from AKI to CKD: Molecular Mechanisms and Therapeutic Targets of Ferroptosis. Cell Death Dis. 2023, 14, 426. [Google Scholar] [CrossRef] [PubMed]
  57. Li, D.; Wu, M. Pattern recognition receptors in health and diseases. Signal Transduct. Target. Ther. 2021, 6, 291. [Google Scholar] [CrossRef] [PubMed]
  58. Chen, L.; Deng, H.; Cui, H.; Fang, J.; Zuo, Z.; Deng, J.; Li, Y.; Wang, X.; Zhao, L. Inflammatory responses and inflammation-associated diseases in organs. Oncotarget 2018, 9, 7204–7218. [Google Scholar] [CrossRef] [PubMed]
  59. Marchi, S.; Guilbaud, E.; Tait, S.W.G.; Yamazaki, T.; Galluzzi, L. Mitochondrial control of inflammation. Nat. Rev. Immunol. 2023, 23, 159–173. [Google Scholar] [CrossRef]
  60. Yu, H.; Lin, L.; Zhang, Z.; Zhang, H.; Hu, H. Targeting NF-κB pathway for the therapy of diseases: Mechanism and clinical study. Signal Transduct. Target. Ther. 2020, 5, 209. [Google Scholar] [CrossRef]
  61. Liu, T.; Zhang, L.; Joo, D.; Sun, S.-C. NF-κB signaling in inflammation. Signal Transduct. Target. Ther. 2017, 2, 17023. [Google Scholar] [CrossRef] [PubMed]
  62. Sasaki, Y.; Iwai, K. Roles of the NF-κB Pathway in B-Lymphocyte Biology. Curr. Top. Microbiol. Immunol. 2016, 393, 177–209. [Google Scholar] [CrossRef]
  63. He, W.J.; Li, C.; Huang, Z.; Geng, S.; Rao, V.S.; Kelly, T.N.; Hamm, L.L.; Grams, M.E.; Arking, D.E.; Appel, L.J.; et al. Association of Mitochondrial DNA Copy Number with Risk of Progression of Kidney Disease. Clin. J. Am. Soc. Nephrol. 2022, 17, 966–975. [Google Scholar] [CrossRef]
  64. Chang, C.-C.; Chiu, P.-F.; Wu, C.-L.; Kuo, C.-L.; Huang, C.-S.; Liu, C.-S.; Huang, C.-H. Urinary cell-free mitochondrial and nuclear deoxyribonucleic acid correlates with the prognosis of chronic kidney diseases. BMC Nephrol. 2019, 20, 391. [Google Scholar] [CrossRef]
  65. Irazabal, M.V.; Chade, A.R.; Eirin, A. Renal mitochondrial injury in the pathogenesis of CKD: mtDNA and mitomiRs. Clin. Sci. 2022, 136, 345–360. [Google Scholar] [CrossRef] [PubMed]
  66. Thurairajah, K.; Briggs, G.D.; Balogh, Z.J. The source of cell-free mitochondrial DNA in trauma and potential therapeutic strategies. Eur. J. Trauma Emerg. Surg. 2018, 44, 325–334. [Google Scholar] [CrossRef]
  67. Torp, M.-K.; Stensløkken, K.-O.; Vaage, J. When our best friend becomes our worst enemy: The mitochondrion in trauma, surgery, and critical illness. J. Intensive Care Med. 2024, 40, 8850666241237715. [Google Scholar] [CrossRef]
Figure 1. Temporal dynamics of UmtDNA and stratification of long-term graft function. (AC) Individual values of mtDNA genes ND1 (A), ND6 (B), and D-loop (C) across five time points after transplantation. (DF) The same mtDNA genes stratified by quartiles of average eGFR at 12 and 24 months after transplantation, providing a visual overview of mtDNA dynamics in relation to renal function. Quartiles ranged from lowest (Q4: 18.0–37.6 mL/min/1.73 m2) to highest (Q1: 57.51–103 mL/min/1.73 m2). Abbreviations: Cq, quantification cycle; ND1, NADH ubiquinone oxidoreductase subunit 1; ND6, NADH ubiquinone oxidoreductase subunit 6; D-loop, displacement-loop; post-OP, post-operative; 2h, 2 h; 1d, 1 day; 2d, 2 days; 6d, 6 days after transplantation. Data are shown as individual values with the mean and SD over time (n = 57); statistical analysis was performed using repeated-measures one-way ANOVA (REML) with Geisser–Greenhouse correction and the two-step step-up method of Benjamini, Krieger, and Yekutieli. Note: Cq values are inversely related to the amount of mtDNA; lower Cq values indicate higher mtDNA levels. * p < 0.05.
Transplantology 06 00020 g001
Figure 2. UmtDNA copy number in relation to graft function. (AC) Mitochondrial DNA (mtDNA) copy number for ND1 (A), ND6 (B), and D-loop (C), calculated from matched UmtDNA and nuclear DNA levels. Patients were stratified based on average eGFR at 12 and 24 months after transplantation, selecting the nine recipients with the highest and lowest graft function (n = 18). No significant differences were observed between groups over time or by treatment. Data are shown as individual values with the mean and SD. Statistical analysis was performed using two-way ANOVA (REML) with the two-stage linear step-up procedure of Benjamini, Krieger, and Yekutieli. Abbreviations: mtDNA, mitochondrial DNA; ND1, NADH ubiquinone oxidoreductase subunit 1; ND6, NADH ubiquinone oxidoreductase subunit 6; D-loop, displacement-loop; Cq, quantification cycle.
Transplantology 06 00020 g002
Table 1. Primers and sequences.
PrimerSequence
ND1, ETC complex 1 Forward: TGGCTCCTTTAACCTCTCCA
Reverse: GGTTCGGTTGGTCTCTGCTA
ND6, ETC complex 1 Forward: TGATTGTTAGCGGTGTGGTC
Reverse: CCTCAATAGCCATCGCTGTA
D-loop, regulative regionForward: AACCTACCCACCCTTAACAG
Reverse: CACTCTTGTGCGGGATATTG
β2M, nuclear housekeeping gene Forward: CTGGTAGCTCTAAACAATGTATTCA
Reverse: CATGTACTCAAATGTCTAAAATGGT
Abbreviations: ND1: NADH ubiquinone oxidoreductase subunit 1; ND6: NADH ubiquinone oxidoreductase subunit 6; D-loop: displacement-loop; β2M: Beta-2 microglobulin; ETC: electron transport chain.
Table 2. Baseline characteristics.
Donorn = 57
Age [y]52.3 (±11.0)
Male [n (%)]26 (45.6%)
BMI [kg/m2]27 (±3.2)
Active smokers [n (%)]16 (28.1%)
Cardiovascular comorbidity [n (%)]
Medication use [n (%)]
          Antihypertensive therapy
          Statins
          PPIs
17 (29.8%)

15 (26.3%)
7 (12.3%)
9 (15.8%)
Pre-donation mGFR [mL/min]116 (97–134)
Recipientn = 57
Age [y]51.2 (45.0–58.5)
Male [n (%)]27 (47.4%)
BMI [kg/m2]25.4 (22.5–28.3)
Cardiovascular comorbidity [n (%)]
Medication use [n (%)]
          Antihypertensive therapy
          Phosphate binders
          Statins
39 (68.4%)

52 (91.2%)
32 (56.1%)
28 (49.1%)
Unrelated donor [n (%)]29 (50.9%)
Pre-emptive transplantation [n (%)]28 (49.1%)
Re-transplantation [n (%)]7 (12.3%)
≥3 HLA mismatches [n (%)]35 (61.4%)
Positive PRA [n (%)]7 (12.3%)
Ischemia times [min]
          WIT1
          CIT
          WIT2

4 (3–4)
175.5 (156.0–187.0)
43.0 (±7.3)
Kidney and patient outcomesn = 57
DGF [n (%)]3 (5.4%)
eGFR 1 month post-transplantation [mL/min/1.73 m2]50.8 (±14.9)
eGFR 3 months post-transplantation [mL/min/1.73 m2]49.6 (38.8–58.2)
eGFR 6 months post-transplantation [mL/min/1.73 m2]50.4 (38.8–61.1)
eGFR 12 months post-transplantation [mL/min/1.73 m2]50.2 (±14.2)
eGFR 24 months post-transplantation [mL/min/1.73 m2]51.4 (±17.6)
Acute rejection 2 years [n (%)]9 (16.1%)
Graft loss [n (%)]2 (3.5%)
Mortality [n (%)]1 (1.8%)
Data given as the mean (±SD), median (IQR), or n (%). Abbreviations: SD: standard deviation; IQR: interquartile range; n: number in group; BMI: body mass index; PPIs: proton pump inhibitors; HLA: human leukocytes antigens; PRA: panel specific antibodies ≥ 15%; WIT1: first warm ischemia time; CIT: cold ischemia time; WIT2: second warm ischemia time, DGF: delayed graft function, mGFR: measured glomerular filtration rate, eGFR: estimated glomerular filtration rate; y: year; kg: kilogram; m2: square meter; mL: milliliter; min: minute.
Table 3. Univariable regressions of the mtDNA genes.
1-Month eGFR
Variablep-valueq-valueEstimate (95% CI)
ND1 1st urine0.7420.5150.183 (−0.929–1.294)
ND1 2 h0.4790.3910.335 (−0.609–1.278)
ND6 1st urine0.7520.5150.154 (−0.823–1.132)
ND6 2 h0.5850.4390.250 (−0.666–1.167)
D-loop 1st urine0.9520.6250.032 (−1.046–1.110)
D-loop 2 h0.4960.3910.309 (−0.598–1.216)
12-Month eGFR
Variablep-valueq-valueEstimate (95% CI)
ND1 1st urine0.0080.030 *−1.303 (−2.257–−0.350)
ND1 2 h0.2500.219−0.512 (−1.398–0.373)
ND6 1st urine0.0160.030 *−1.050 (−1.895–−0.204)
ND6 2 h0.2270.210−0.520 (−1.374–0.334)
D-loop 1st urine0.0110.030 *−1.259 (−2.213–−0.306)
D-loop 2 h0.2170.210−0.528 (−1.377–0.321)
24-Month eGFR
Variablep-valueq-valueEstimate (95% CI)
ND1 1st urine0.0360.052−1.311 (−2.533–−0.089)
ND1 2 h0.0640.067−1.029 (−2.120–0.062)
ND6 1st urine0.0460.060−1.098 (−2.176–−0.020)
ND6 2 h0.0640.067−0.997 (−2.056–0.062)
D-loop 1st urine0.0360.052−1.326 (−2.563–−0.089)
D-loop 2 h0.0540.065−1.025 (−2.069–0.019)
ΔGFR 1–24 Months
Variablep-valueq-valueEstimate (95% CI)
ND1 1st urine0.0090.030 *−1.372 (−2.388–−0.356)
ND1 2 h0.0070.030 *−1.188 (−2.031–−0.345)
ND6 1st urine0.0150.030 *−1.141 (−2.049–−0.234)
ND6 2 h0.0140.030 *−1.066 (−1.910–−0.222)
D-loop 1st urine0.0170.030 *−1.231 (−2.228–−0.233)
D-loop 2 h0.0050.030 *−1.168 (−1.974–−0.362)
Data are presented as p- and q-values and estimates (β with confidence interval [CI]). Data shown for p-values < 0.250. Abbreviations: eGFR—estimated glomerular filtration rate; ND1NADH ubiquinone oxidoreductase subunit 1; ND6NADH ubiquinone oxidoreductase subunit 6; D-loopdisplacement-loop. Note: Cq values are inversely related to the amount of mtDNA; lower Cq values indicate higher mtDNA levels. Analyses were performed using univariable linear regression. False discovery rate (FDR) correction was applied using the Benjamini–Krieger–Yekutieli procedure. * Statistical significance was defined as q < 0.05.
Disclaimer/Publisher’s Note: The statements, opinions and data contained in all publications are solely those of the individual author(s) and contributor(s) and not of MDPI and/or the editor(s). MDPI and/or the editor(s) disclaim responsibility for any injury to people or property resulting from any ideas, methods, instructions or products referred to in the content.

