
Polygenic Embryo Risk Scores: A Survey of Public Perception


Abstract
1. Introduction
2. Methods
Statistical Analysis
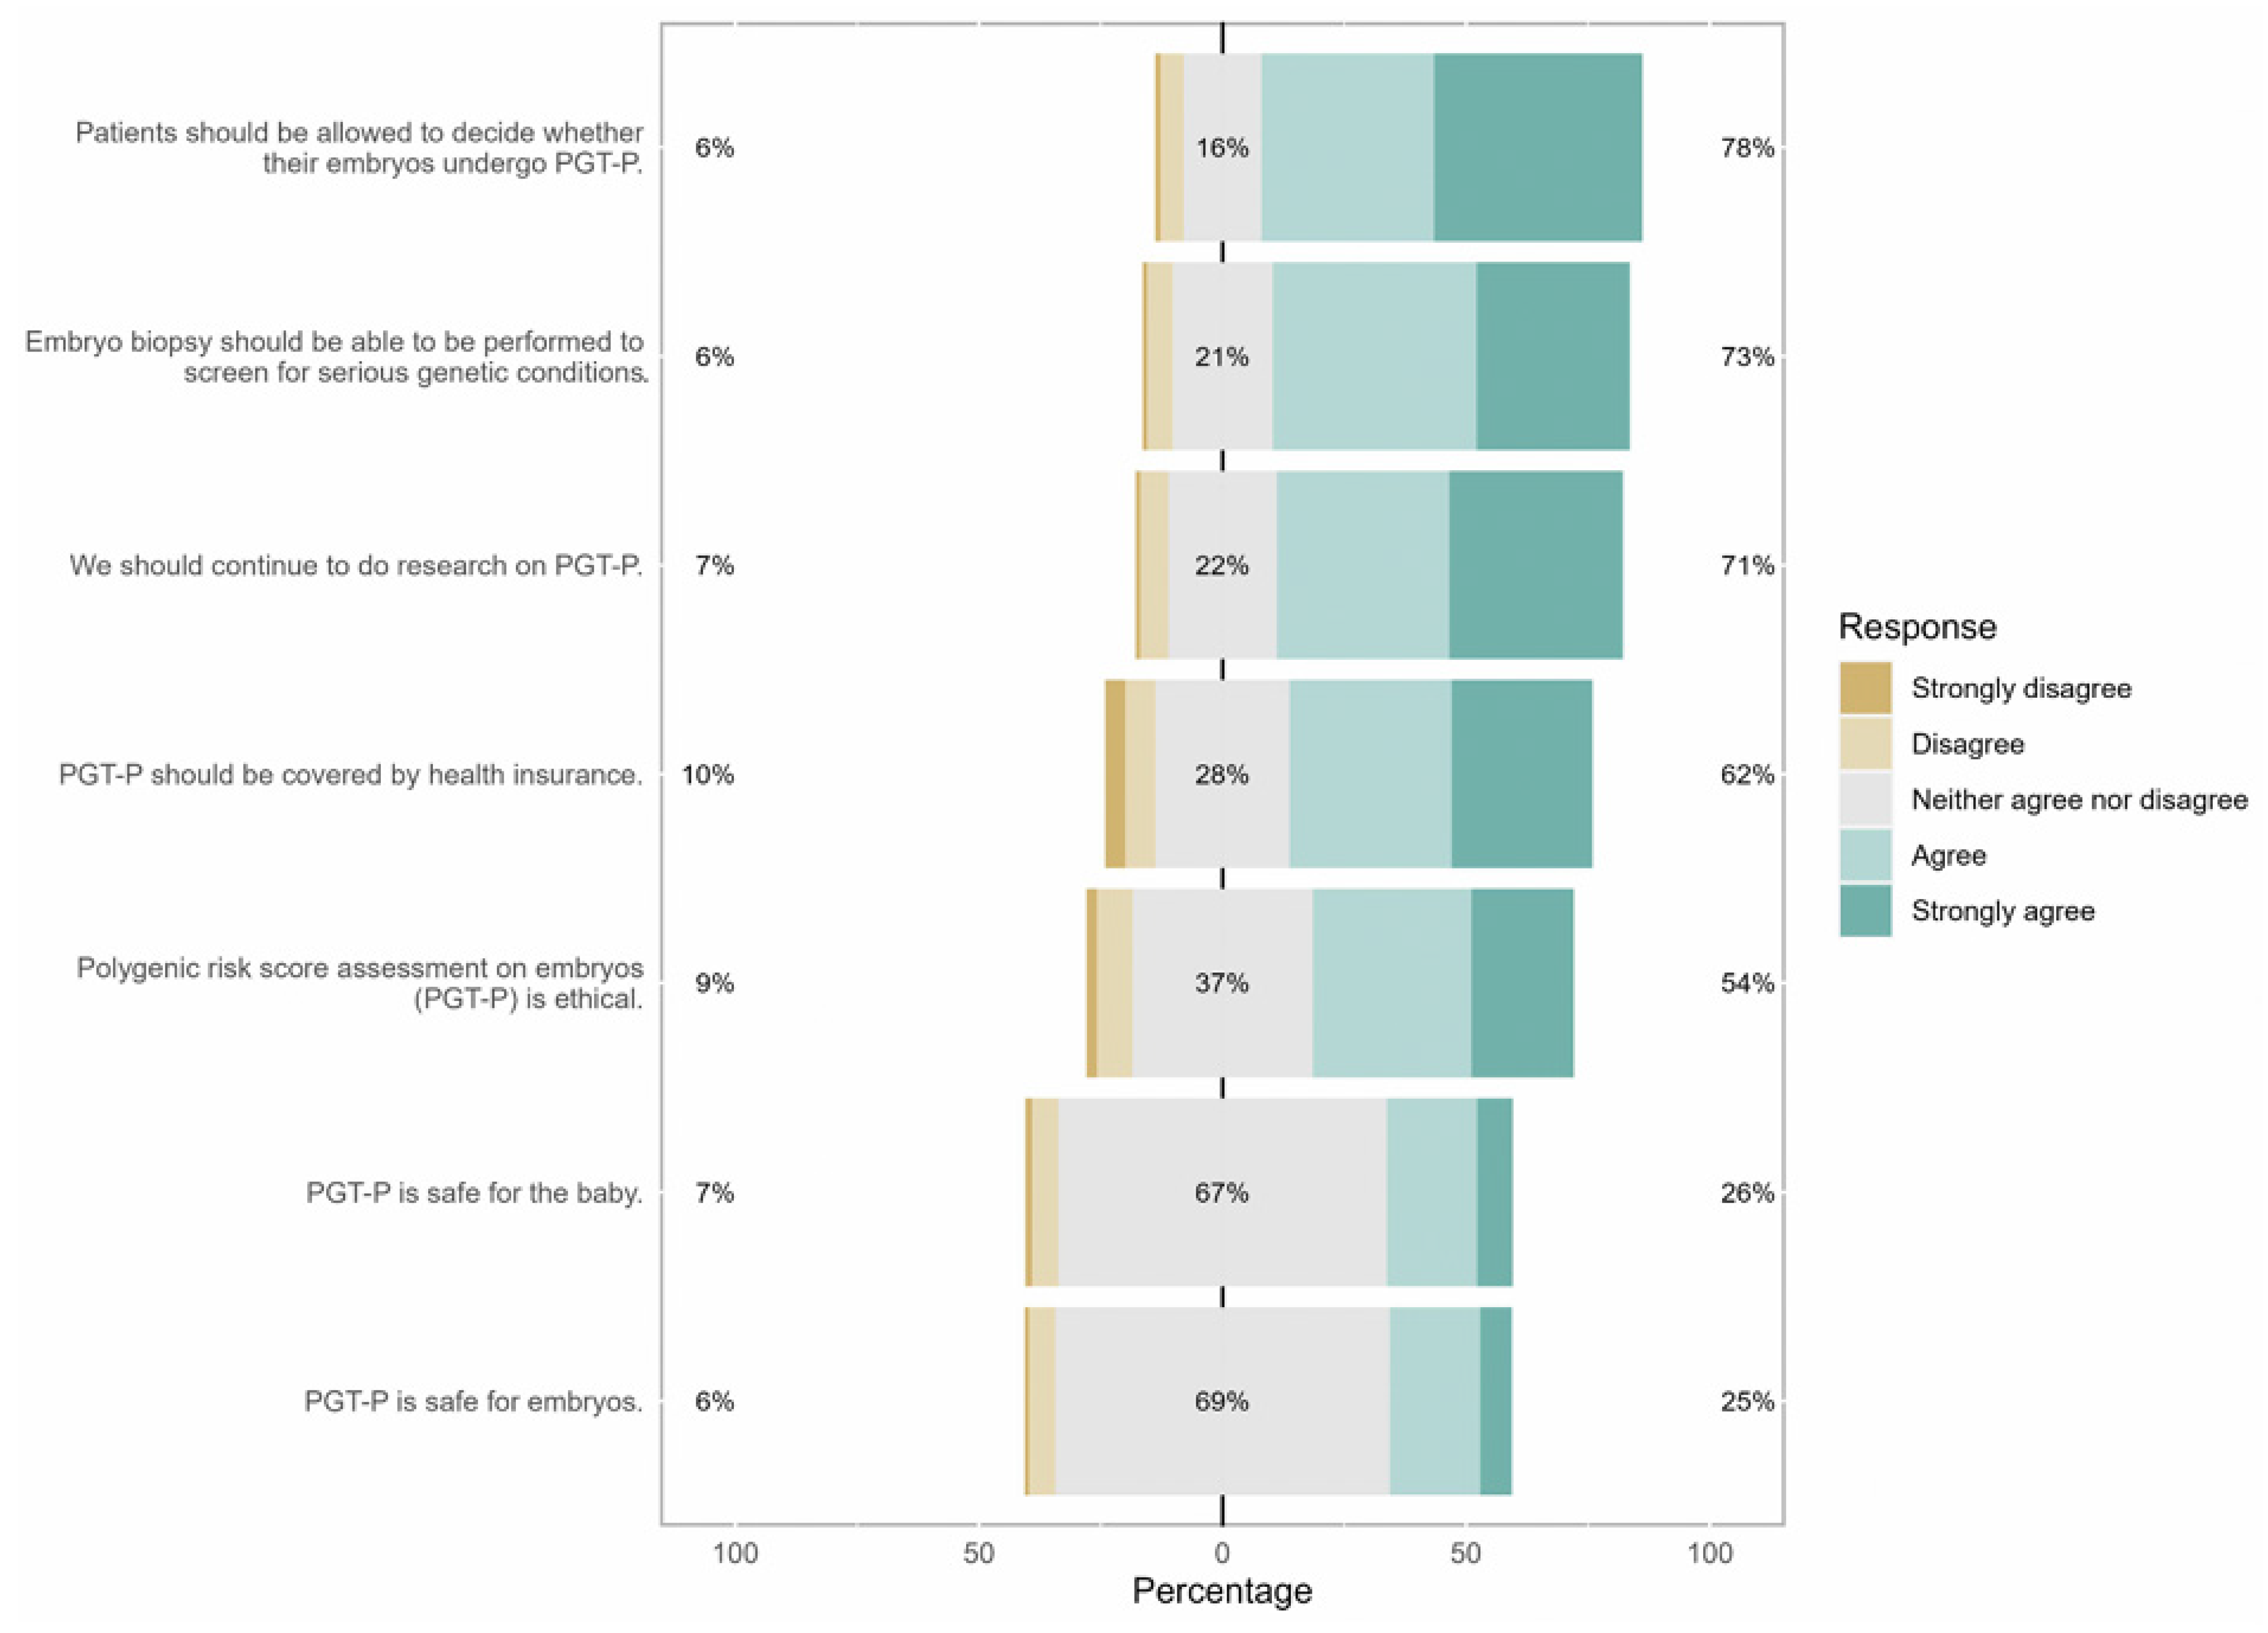
3. Results
4. Discussion
5. Conclusions
Supplementary Materials
Author Contributions
Funding
Institutional Review Board Statement
Informed Consent Statement
Data Availability Statement
Acknowledgments
Conflicts of Interest
References
- Turley, P.; Meyer, M.; Wang, N.; Cesarini, D.; Hammonds, E.; Martin, A.; Neale, B.; Rehm, H.; Wilkins-Haug, L.; Benjamin, D.; et al. Problems with using polygenic scores to select embryos. N. Engl. J. Med. 2021, 385, 78–86. [Google Scholar] [CrossRef] [PubMed]
- Tam, V.; Patel, N.; Turcotte, M. Benefits and limitations of genome-wide association studies. Nat. Rev. Genet. 2019, 20, 467–484. [Google Scholar] [CrossRef] [PubMed]
- Treff, N.R.; Savulescu, J.; de Melo-Martín, I.; Shulman, L.P.; Feinberg, E.C. Should preimplantation genetic testing for polygenic disease be offered to all-or none? Fertil. Steril. 2022, 117, 1162–1167. [Google Scholar] [CrossRef] [PubMed]
- Kozlov, M. The controversial embryo tests that promise a better baby. Nature 2022, 609, 668–671. [Google Scholar] [CrossRef] [PubMed]
- Meyer, M.N.; Tan, T.; Benjamin, D.J.; Laibson, D.; Turley, P. Public views on polygenic screening of embryos. Science 2023, 379, 541–543. [Google Scholar] [CrossRef] [PubMed]
- Katz, M.; Siddiqui, N.; Behr, B.; Chandramohan, D.; Zhang, Q.; Suer, F.; Xia, Y.; Podgursky, B. Patient perspectives after receiving simulated preconception polygenic risk scores (Prs) for family planning. J. Assist. Reprod. Genet. 2025, 42, 997–1013. [Google Scholar] [CrossRef] [PubMed]
- Furrer, R.A.; Barlevy, D.; Pereira, S.; Carmi, S.; Lencz, T.; Lázaro-Muñoz, G. Public attitudes, interests, and concerns regarding polygenic embryo screening. JAMA Netw. Open 2024, 7, e2410832. [Google Scholar] [CrossRef] [PubMed]
- Hariton, E.; Bortoletto, P.; Goldman, R.H.; Farland, L.V.; Ginsburg, E.S.; Gargiulo, A.R. A survey of public opinion in the United States regarding uterine transplantation. J. Minim. Invasive Gynecol. 2018, 25, 980–985. [Google Scholar] [CrossRef] [PubMed]
- Forzano, F.; Antonova, O.; Clarke, A.; de Wert, G.; Hentze, S.; Jamshidi, Y. The use of polygenic risk scores in pre-implantation genetic testing: An un- proven, unethical practice. Eur. J. Hum. Genet. 2021, 30, 493–495. [Google Scholar] [CrossRef] [PubMed]
- Polyakov, A.; Amor, D.J.; Savulescu, J. Polygenic risk score for embryo selection-not ready for prime time. Hum. Reprod. 2022, 37, 2229–2236. [Google Scholar] [CrossRef] [PubMed]
- Pereira, S.; Carmi, S.; Altarescu, G. Polygenic embryo screening: Four clinical considerations warrant further attention. Hum. Reprod. 2022, 37, 1375–1378. [Google Scholar] [CrossRef] [PubMed]
- Eccles, J.; Marin, D.; Duffy, L.; Chen, S.H.; Treff, N.R. Rate of patients electing for polygenic risk scores in preimplantation genetic testing. Fertil. Steril. 2021, 116, e267–e268. [Google Scholar] [CrossRef]
- Zhang, S.; Johnson, R.A.; Novembre, J.; Freeland, E.; Conley, D. Public attitudes toward genetic risk scoring in medicine and beyond. Soc. Sci. Med. 2021, 274, 113796. [Google Scholar] [CrossRef] [PubMed]
- Pagnaer, T.; Siermann, M.; Borry, P.; Tšuiko, O. Polygenic risk scoring of human embryos: A qualitative study of media coverage. BMC Med. Ethics 2021, 22, 125. [Google Scholar] [CrossRef] [PubMed]
- Treff, N.R.; Eccles, J.; Marin, D. Preimplantation genetic testing for polygenic disease relative risk reduction: Evaluation of genomic index performance in 11,883 adult sibling pairs. Genes 2020, 11, E648. [Google Scholar] [CrossRef] [PubMed]
- Martin, A.R.; Kanai, M.; Kamatani, Y.; Okada, Y.; Neale, B.M.; Daly, M.J. Clinical use of current polygenic risk scores may exacerbate health disparities. Nat. Genet. 2019, 51, 584–591. [Google Scholar] [CrossRef] [PubMed]
- Lazaro-Munoz, G.; Pereira Carmi, S.; Lencz, T. Screening embryos for polygenic conditions and traits: Ethical considerations for an emerging technology. Genet. Med. 2021, 23, 432–434. [Google Scholar] [CrossRef] [PubMed]

| [All] | N | |
|---|---|---|
| N = 633 | ||
| Gender: | 633 | |
| Female | 318 (50.2%) | |
| Male | 315 (49.8%) | |
| Age (y): | 633 | |
| 18–29 | 113 (17.9%) | |
| 30−44 | 192 (30.3%) | |
| 45−60 | 166 (26.2%) | |
| >60 | 162 (25.6%) | |
| US Region | 626 | |
| Midwest: ND, SD, NE, KS, MO, IA, MN, WI, IL, IN, MI, and OH | 135 (21.6%) | |
| Northeast: ME, NH, VT, MA, CT, RI, NY, PA, and NJ | 125 (20.0%) | |
| South: TX, OK, AR, LA, MS, AL, TN, KT, WV, DC, VA, MD, DE, NC, SC, GA, and FL | 219 (35.0%) | |
| West: MT, WY, CO, NM, AZ, UT, NZ, ID, WA, OR, CA, AK, and HI | 147 (23.5%) | |
| Approximate household income (USD): | 620 | |
| 20,000 or less | 62 (10.0%) | |
| 20,001−40,000 | 106 (17.1%) | |
| 40,001−60,000 | 118 (19.0%) | |
| 60,001−80,000 | 89 (14.4%) | |
| 80,001−100,000 | 97 (15.6%) | |
| 100,001−150,000 | 89 (14.4%) | |
| More than 150,001 | 59 (9.52%) | |
| Marital status: | 630 | |
| Married/civil union | 336 (53.3%) | |
| Never married | 146 (23.2%) | |
| Separated | 14 (2.22%) | |
| Widowed | 23 (3.65%) | |
| Divorced | 59 (9.37%) | |
| In long-term relationship | 52 (8.25%) | |
| Religion: | 626 | |
| Atheist/Agnostic | 125 (20.0%) | |
| Buddhism | 16 (2.56%) | |
| Christian non-Catholic | 225 (35.9%) | |
| Christian Catholic | 160 (25.6%) | |
| Hindu | 19 (3.04%) | |
| Jewish | 23 (3.67%) | |
| Muslim | 12 (1.92%) | |
| Other | 46 (7.35%) | |
| Political party affiliation: | 624 | |
| Democrat | 263 (42.1%) | |
| Libertarian | 41 (6.57%) | |
| None of the above | 103 (16.5%) | |
| Republican | 151 (24.2%) | |
| Other | 66 (10.6%) | |
| Race: | 633 | |
| White or Caucasian | 430 (67.9%) | |
| American Indian or Alaska Native | 40 (6.32%) | |
| Asians | 73 (11.5%) | |
| Black or African American | 55 (8.69%) | |
| Hispanic or Latino | 62 (9.79%) | |
| Middle Eastern | 15 (2.37%) | |
| Native Hawaiian or Pacific Islander | 3 (0.47%) | |
| Number of children: | 624 | |
| 0 | 224 (35.9%) | |
| 1 | 111 (17.8%) | |
| 2 | 169 (27.1%) | |
| 3+ | 120 (19.2%) | |
| If 0, do you want children in the future? | 228 | |
| I am not sure | 51 (22.4%) | |
| No | 95 (41.7%) | |
| Yes | 82 (36.0%) | |
| Do you personally know anyone who used infertility treatments? | 626 | |
| No | 324 (51.8%) | |
| Yes | 302 (48.2%) | |
| Do you personally know anyone who has had infertility? | 627 | |
| No | 249 (39.7%) | |
| Yes | 378 (60.3%) | |
| Is it important to you to have a child free of disease? | 627 | |
| I do not know | 120 (19.1%) | |
| No | 110 (17.5%) | |
| Yes | 397 (63.3%) | |
| If you were undergoing IVF, how much would you pay for PGT-P? (Embryo biopsy costs around USD 200 per embryo) (USD): | 630 | |
| 200−500 per embryo | 261 (41.4%) | |
| 500−1000 per embryo | 95 (15.1%) | |
| 1000−2000 per embryo | 30 (4.76%) | |
| More than 2000 per embryo | 21 (3.33%) | |
| I would not pay for PGT-P | 223 | |
| Who should be able to use PGT-P? | 627 | |
| Anyone | 333 (53.1%) | |
| No one | 59 (9.41%) | |
| Patients who are using donor egg or donor sperm (not their own) to create embryos | 96 (15.3%) | |
| Patients with a personal or family history of certain diseases | 139 (22.2%) | |
| Data were summarized using counts and percentages. Respondents were allowed to choose more than one race as appropriate. |
| It Is the Perfect Idea. |
|---|
| I do not have any concerns. |
| No objection if parents want it. |
| I have no concerns about this. It falls within the rights of the parent(s) and is truly none of my |
| business. |
| As someone who has gone through IVF, I don’t see any problem with this kind of testing. I |
| think people should stop trying to dictate the medical treatments others have access to, |
| especially if they are safe. |
| No concerns, except the cost. |
| I do not care; it should be 100% allowed. |
| It is eugenics. |
| The information gained will be misused. |
| I do not know enough info about the accuracy and safety. |
| My only concern would be for the embryo; only a brief explanation is provided. |
| Unknown consequences such as an insurance company not paying for the pregnancy if they |
| do not like the test results. |
| Disagree | Neutral | Agree | OR | 95% CI | p | |
|---|---|---|---|---|---|---|
| N = 60 | N = 234 | N = 339 | ||||
| Age (y): | ||||||
| <45 | 34 (7.28%) | 167 (35.8%) | 266 (57.0%) | Reference | ||
| ≥45 | 26 (15.7%) | 67 (40.4%) | 73 (44.0%) | 0.68 | 0.47–0.98 | 0.038 |
| Gender: | ||||||
| Female | 33 (10.4%) | 133 (41.8%) | 152 (47.8%) | Reference | ||
| Male | 27 (8.57%) | 101 (32.1%) | 187 (59.4%) | 1.05 | 0.76–1.45 | 0.777 |
| Religion: | ||||||
| Christian non-Catholic | 30 (13.3%) | 82 (36.4%) | 113 (50.2%) | Reference | ||
| Atheist/Agnostic | 7 (5.60%) | 36 (28.8%) | 82 (65.6%) | 1.93 | 1.21–3.10 | 0.006 |
| Buddhism | 3 (18.8%) | 6 (37.5%) | 7 (43.8%) | 0.29 | 0.10–0.89 | 0.030 |
| Christian Catholic | 12 (7.50%) | 63 (39.4%) | 85 (53.1%) | 0.87 | 0.58–1.31 | 0.503 |
| Hindu | 1 (5.26%) | 8 (42.1%) | 10 (52.6%) | 0.81 | 0.31–2.08 | 0.657 |
| Jewish | 1 (4.35%) | 8 (34.8%) | 14 (60.9%) | 2.07 | 0.88–4.85 | 0.096 |
| Muslim | 0 (0.00%) | 4 (33.3%) | 8 (66.7%) | 1.18 | 0.35–3.96 | 0.791 |
| Other | 5 (10.9%) | 23 (50.0%) | 18 (39.1%) | 0.83 | 0.44–1.57 | 0.570 |
| Political party affiliation: | ||||||
| Democrat | 19 (7.22%) | 90 (34.2%) | 154 (58.6%) | Reference | ||
| Libertarian | 4 (9.76%) | 16 (39.0%) | 21 (51.2%) | 0.50 | 0.27–0.93 | 0.029 |
| None of the above | 11 (10.7%) | 47 (45.6%) | 45 (43.7%) | 0.96 | 0.60–1.54 | 0.864 |
| Other | 9 (13.6%) | 24 (36.4%) | 33 (50.0%) | 0.94 | 0.62–1.44 | 0.777 |
| Republican | 16 (10.6%) | 54 (35.8%) | 81 (53.6%) | 0.89 | 0.51–1.54 | 0.666 |
| Number of children: | ||||||
| 0 | 15 (6.70%) | 72 (32.1%) | 137 (61.2%) | Reference | ||
| 1 | 9 (8.11%) | 34 (30.6%) | 68 (61.3%) | 0.83 | 0.52–1.33 | 0.442 |
| 2 | 18 (10.7%) | 65 (38.5%) | 86 (50.9%) | 0.81 | 0.52–1.24 | 0.323 |
| 3+ | 17 (14.2%) | 58 (48.3%) | 45 (37.5%) | 0.63 | 0.40–1.01 | 0.057 |
| US Region: | ||||||
| Midwest | 18 (13.3%) | 48 (35.6%) | 69 (51.1%) | Reference | ||
| Northeast | 9 (7.20%) | 44 (35.2%) | 72 (57.6%) | 0.84 | 0.51–1.39 | 0.497 |
| South | 21 (9.29%) | 86 (38.1%) | 119 (52.7%) | 0.92 | 0.59–1.43 | 0.710 |
| West | 12 (8.16%) | 56 (38.1%) | 79 (53.7%) | 0.87 | 0.53–1.41 | 0.565 |
| Level of education: | 1.24 | 1.05–1.45 | 0.009 | |||
| Some high school or less | 1 (5.00%) | 4 (20.0%) | 15 (75.0%) | |||
| High school diploma or GED | 11 (7.75%) | 71 (50.0%) | 60 (42.3%) | |||
| Technical or associate degree | 15 (12.0%) | 46 (36.8%) | 64 (51.2%) | |||
| Bachelor’s degree | 18 (8.57%) | 76 (36.2%) | 116 (55.2%) | |||
| Graduate or professional degree | 14 (10.6%) | 34 (25.8%) | 84 (63.6%) | |||
| Approximate household income (USD): | 0.95 | 0.86–1.05 | 0.290 | |||
| 20,000 or less | 2 (3.23%) | 28 (45.2%) | 32 (51.6%) | |||
| 20,001−40,000 | 8 (7.55%) | 48 (45.3%) | 50 (47.2%) | |||
| 40,001−60,000 | 10 (8.47%) | 42 (35.6%) | 66 (55.9%) | |||
| 60,001−80,000 | 9 (10.1%) | 18 (20.2%) | 62 (69.7%) | |||
| 80,001−100,000 | 13 (13.4%) | 33 (34.0%) | 51 (52.6%) | |||
| 100,001−150,000 | 10 (11.2%) | 35 (39.3%) | 44 (49.4%) | |||
| More than 150,001 | 6 (10.2%) | 22 (37.3%) | 31 (52.5%) | |||
| Know anyone who had infertility: | ||||||
| No | 21 (8.43%) | 119 (47.8%) | 109 (43.8%) | Reference | ||
| Yes | 39 (10.3%) | 112 (29.6%) | 227 (60.1%) | 1.23 | 0.88–1.74 | 0.230 |
| Essential to have a disease-free child: | ||||||
| No | 21 (19.1%) | 45 (40.9%) | 44 (40.0%) | Reference | ||
| I don’t know | 19 (15.8%) | 54 (45.0%) | 47 (39.2%) | 1.16 | 0.68–1.98 | 0.588 |
| Yes | 20 (5.04%) | 131 (33.0%) | 246 (62.0%) | 2.41 | 1.55–3.77 | <0.001 |
| Perceived safety of PGT-P | −0.64 (0.65) | −0.17 (0.39) | 0.23 (0.59) | 7.37 | 5.27–10.30 | <0.001 |
Disclaimer/Publisher’s Note: The statements, opinions and data contained in all publications are solely those of the individual author(s) and contributor(s) and not of MDPI and/or the editor(s). MDPI and/or the editor(s) disclaim responsibility for any injury to people or property resulting from any ideas, methods, instructions or products referred to in the content. |
© 2025 by the authors. Licensee MDPI, Basel, Switzerland. This article is an open access article distributed under the terms and conditions of the Creative Commons Attribution (CC BY) license (https://creativecommons.org/licenses/by/4.0/).
Share and Cite
Peyser, A.; Brogan, C.; Zimmerman, L.; Goldman, R.H. Polygenic Embryo Risk Scores: A Survey of Public Perception. Reprod. Med. 2025, 6, 19. https://doi.org/10.3390/reprodmed6030019
Peyser A, Brogan C, Zimmerman L, Goldman RH. Polygenic Embryo Risk Scores: A Survey of Public Perception. Reproductive Medicine. 2025; 6(3):19. https://doi.org/10.3390/reprodmed6030019
Chicago/Turabian StylePeyser, Alexandra, Cailey Brogan, Lilli Zimmerman, and Randi H. Goldman. 2025. "Polygenic Embryo Risk Scores: A Survey of Public Perception" Reproductive Medicine 6, no. 3: 19. https://doi.org/10.3390/reprodmed6030019
APA StylePeyser, A., Brogan, C., Zimmerman, L., & Goldman, R. H. (2025). Polygenic Embryo Risk Scores: A Survey of Public Perception. Reproductive Medicine, 6(3), 19. https://doi.org/10.3390/reprodmed6030019