Article

Quantum Beats of a Macroscopic Polariton Condensate in Real Space

by
Roman V. Cherbunin
1,2,*,
Aleksey Liubomirov
1,2,
Stella V. Kavokina
1,3,4,
Denis Novokreschenov
2,3,
Andrey Kudlis
2,3,* and
Alexey V. Kavokin
2,3,4,*
1
Department of Physics, St. Petersburg State University, University Embankment, 7/9, 199034 St. Petersburg, Russia
2
Russian Quantum Center, Skolkovo, 121205 Moscow, Russia
3
Abrikosov Center for Theoretical Physics, MIPT, Dolgoprudnyi, 141701 Moscow, Russia
4
International Center for Polaritonics, Westlake University, Shilongshan Road, 18, Hangzhou 310024, China
*
Authors to whom correspondence should be addressed.
Optics 2025, 6(4), 53; https://doi.org/10.3390/opt6040053
Submission received: 14 September 2025 / Revised: 11 October 2025 / Accepted: 15 October 2025 / Published: 23 October 2025

Abstract

We experimentally observe harmonic oscillations in a bosonic condensate of exciton-polaritons confined within an elliptical trap. These oscillations arise from quantum beats between two size-quantized states of the condensate, split in energy due to the trap’s ellipticity. By precisely targeting specific spots inside the trap with nonresonant laser pulses, we control frequency, amplitude, and phase of these quantum beats. The condensate wave function dynamics is visualized on a streak camera and mapped to the Bloch sphere, demonstrating Hadamard and Pauli-Z operations. We conclude that a qubit based on a superposition of these two polariton states would exhibit a coherence time exceeding the lifetime of an individual exciton-polariton by at least two orders of magnitude.

1. Introduction

Quantum beats are a widely spread phenomenon that is characteristic of the coherent dynamics of a two-level quantum system excited in a superposition state [1,2,3]. The period of the beats is determined by the energy splitting of two participating quantum states [2], while their decay time characterizes the decoherence processes that are necessarily present in any quantum system coupled to an environment [3,4]. In condensed matter physics, quantum beats caused by size quantization of electron [5], hole [6] or exciton [7] wave functions, Zeeman splitting [8], spin-orbit [9], hyperfine [10] interactions etc have been documented. Quantum beats are typically detected by optical methods, including time-resolved photoluminescence [11], pump-probe [1], four-wave mixing [12], Faraday-rotation [13] spectroscopy, spin noise [14] and photon-echo [15] spectroscopies as well as several other techniques. These approaches enable detection of the oscillations of intensity, polarisation, coherence degree and/or other measurable characteristics of light caused by quantum beats in crystals, molecules and other matter objects coupled to light [16]. In this context, bosonic light-matter quasiparticles, namely, exciton-polaritons [17,18,19] represent a unique laboratory for studies of the optical manifestations of quantum beats. In the strong exciton-photon coupling regime in semiconductor microcavities, the quantum beats between exciton-polariton eigen-modes frequently referred to as Rabi-oscillations have been observed since mid-1990s [20,21]. The true quantum Rabi-oscillations were demonstrated by means of the solid-state cavity QED [22]. Next, a number of experiments demonstrated the complex coherent oscillatory dynamics of the polarization and intensity of light emitted by linear combinations of various polariton states [23,24] that e.g. led to generation of full Bloch light beams [23]. A fundamental factor that limits the decay time of polariton quantum beats is life-time of an individual exciton-polariton which is typically less than a hundred picoseconds even in high-quality semiconductor microcavities [25]. However, some oscillatory phenomena with much longer decay times in many-body bosonic condensates of exciton-polaritons have recently been theoretically discussed [26,27,28] and experimentally observed [29,30]. Specifically, the persistent Larmor precession driven by polariton–polariton interactions has been reported [29], and the continuous time-crystal behavior has been demonstrated in a polariton condensate coupled to phonons [31]. A complementary quantum-statistical analysis that explicitly treats fluctuations and coherence beyond the mean-field regime was presented in Ref. [32], highlighting the role of dark states in stabilising driven polariton condensates. It has been argued that a combination of strong optical non-linearity caused by repulsive polariton-polariton interactions, stimulated scattering of polaritons and dissipative coupling between different polariton condensates may lead to the limit-cycle solutions [26], dynamical attractors [27,33] and even to polariton time-crystals [28].
Related questions of how Bose–Einstein condensation in driven-dissipative media compares with Fröhlich-type condensation in other pumped bosonic systems have recently been addressed in Ref. [34]. In contrast to the quantum beats characteristic of a linear two-level quantum system whose frequency is simply given by the splitting between two participating energy levels, the limit cycle oscillations have their dynamics governed by a variety of factors including the polariton concentration, polariton-polariton interaction constants, spatial dependence of the polariton lifetime etc. [27]. The decay time of oscillations characteristic of limit cycles, theoretically, tends to infinity. In the present study, we experimentally observe long-lived oscillations of a macroscopic exciton-polariton condensate in real space that reveal features of quantum beats rather than limit-cycle oscillations.

2. Setting the Trap

We study bosonic condensates of exciton-polaritons created by a nonresonant c w optical excitation in a planar GaAs-based microcavity. The description of the sample and its characteristic optical spectra can be found in [35]. We use a spatial-light modulator (SLM) (see Figure S1 of the Supplementary Material) to create an elliptical trap for exciton-polaritons shown in Figure 1a. We take advantage of the driven-dissipative nature of exciton-polariton condensates bosonic condensation at energy states other than the ground state. We carefully chose the design of the trap and the pumping intensity in order to make sure that the ensemble of exciton-polaritons populates a selected pair of energy levels of the trapping potential. The eigen-wave functions corresponding to these states represent two-dimensional p-shaped orbitals. The corresponding spatial distributions of the intensity and the phase of the polariton condensate are shown on Figure 1b,c, respectively.
To change the state of the condensate, or to put it into the oscillatory mode, we modify the profile of the potential trap with the use of nonresonant control pulses. These pulses excite electron and hole clouds that eventually form incoherent excitons that, in their turn, relax to the polariton modes. Together, this leads to the appearance of a localized repulsive potential acting on the polariton condensate. This potential eventually vanishes on a time scale of several hundred picoseconds (see Figure S7 of the Supplementary Material). The emission of excitons (exciton-polaritons) created by a control pulse can be directly observed with the use of the streak camera, as Figure 1a shows. One can see how its peak relaxes in energy, eventually reaching the condensate energy (Figure S7 of the Supplementary Material).
Elliptical traps offer the advantage of optical control over energy splitting between mentioned p-shaped orbitals. The experimentally obtained spatial distributions of the polariton densities corresponding to these orbitals are shown in Figure 1d,e. We map the true eigen functions of the trap by measuring the spatial maps of phase ϕ 0 x , y and amplitude a x , y of the oscillations of intensity of the emitted light induced by quantum beats between the eigen states of the trap. These maps obtained both experimentally and theoretically are shown in panels of Figure 1f–i. The oscillations are the most pronounced in the areas of the strongest overlap of p x and p y orbitals. Varying the ellipticity of the trap we tune the splitting of p x and p y orbitals on a micro-electron-Volt scale as Figure 1l illustrates.

3. The Dynamics of Trapped Condensates

The oscillatory dynamics observed in our experiments can be analytically reproduced by a linear two-level model. We approximate the optically induced trap that confines the exciton-polaritons condensate by a modified potential of a two-dimensional harmonic oscillator V = m f ( φ ) ω x 2 x 2 + ω y 2 y 2 / 2 (for details, see the Supplementary Materials). We solve the two-dimensional Schrödinger Equation (S7) and obtain the energy spectrum of the trapped condensate. We assume that the system occupied the p x -eigen state prior to the arrival of the control pulse. The effect of this non-resonant pulse we model by a time-dependent perturbation potential. Figure 1k shows the theoretical calculation of the density dynamics of the polariton condensate at the specific spot (horizontal cross-section in panel (j)) of the elliptical trap (blue curve). These results appear to be in good agreement with the experimental data (orange curve).
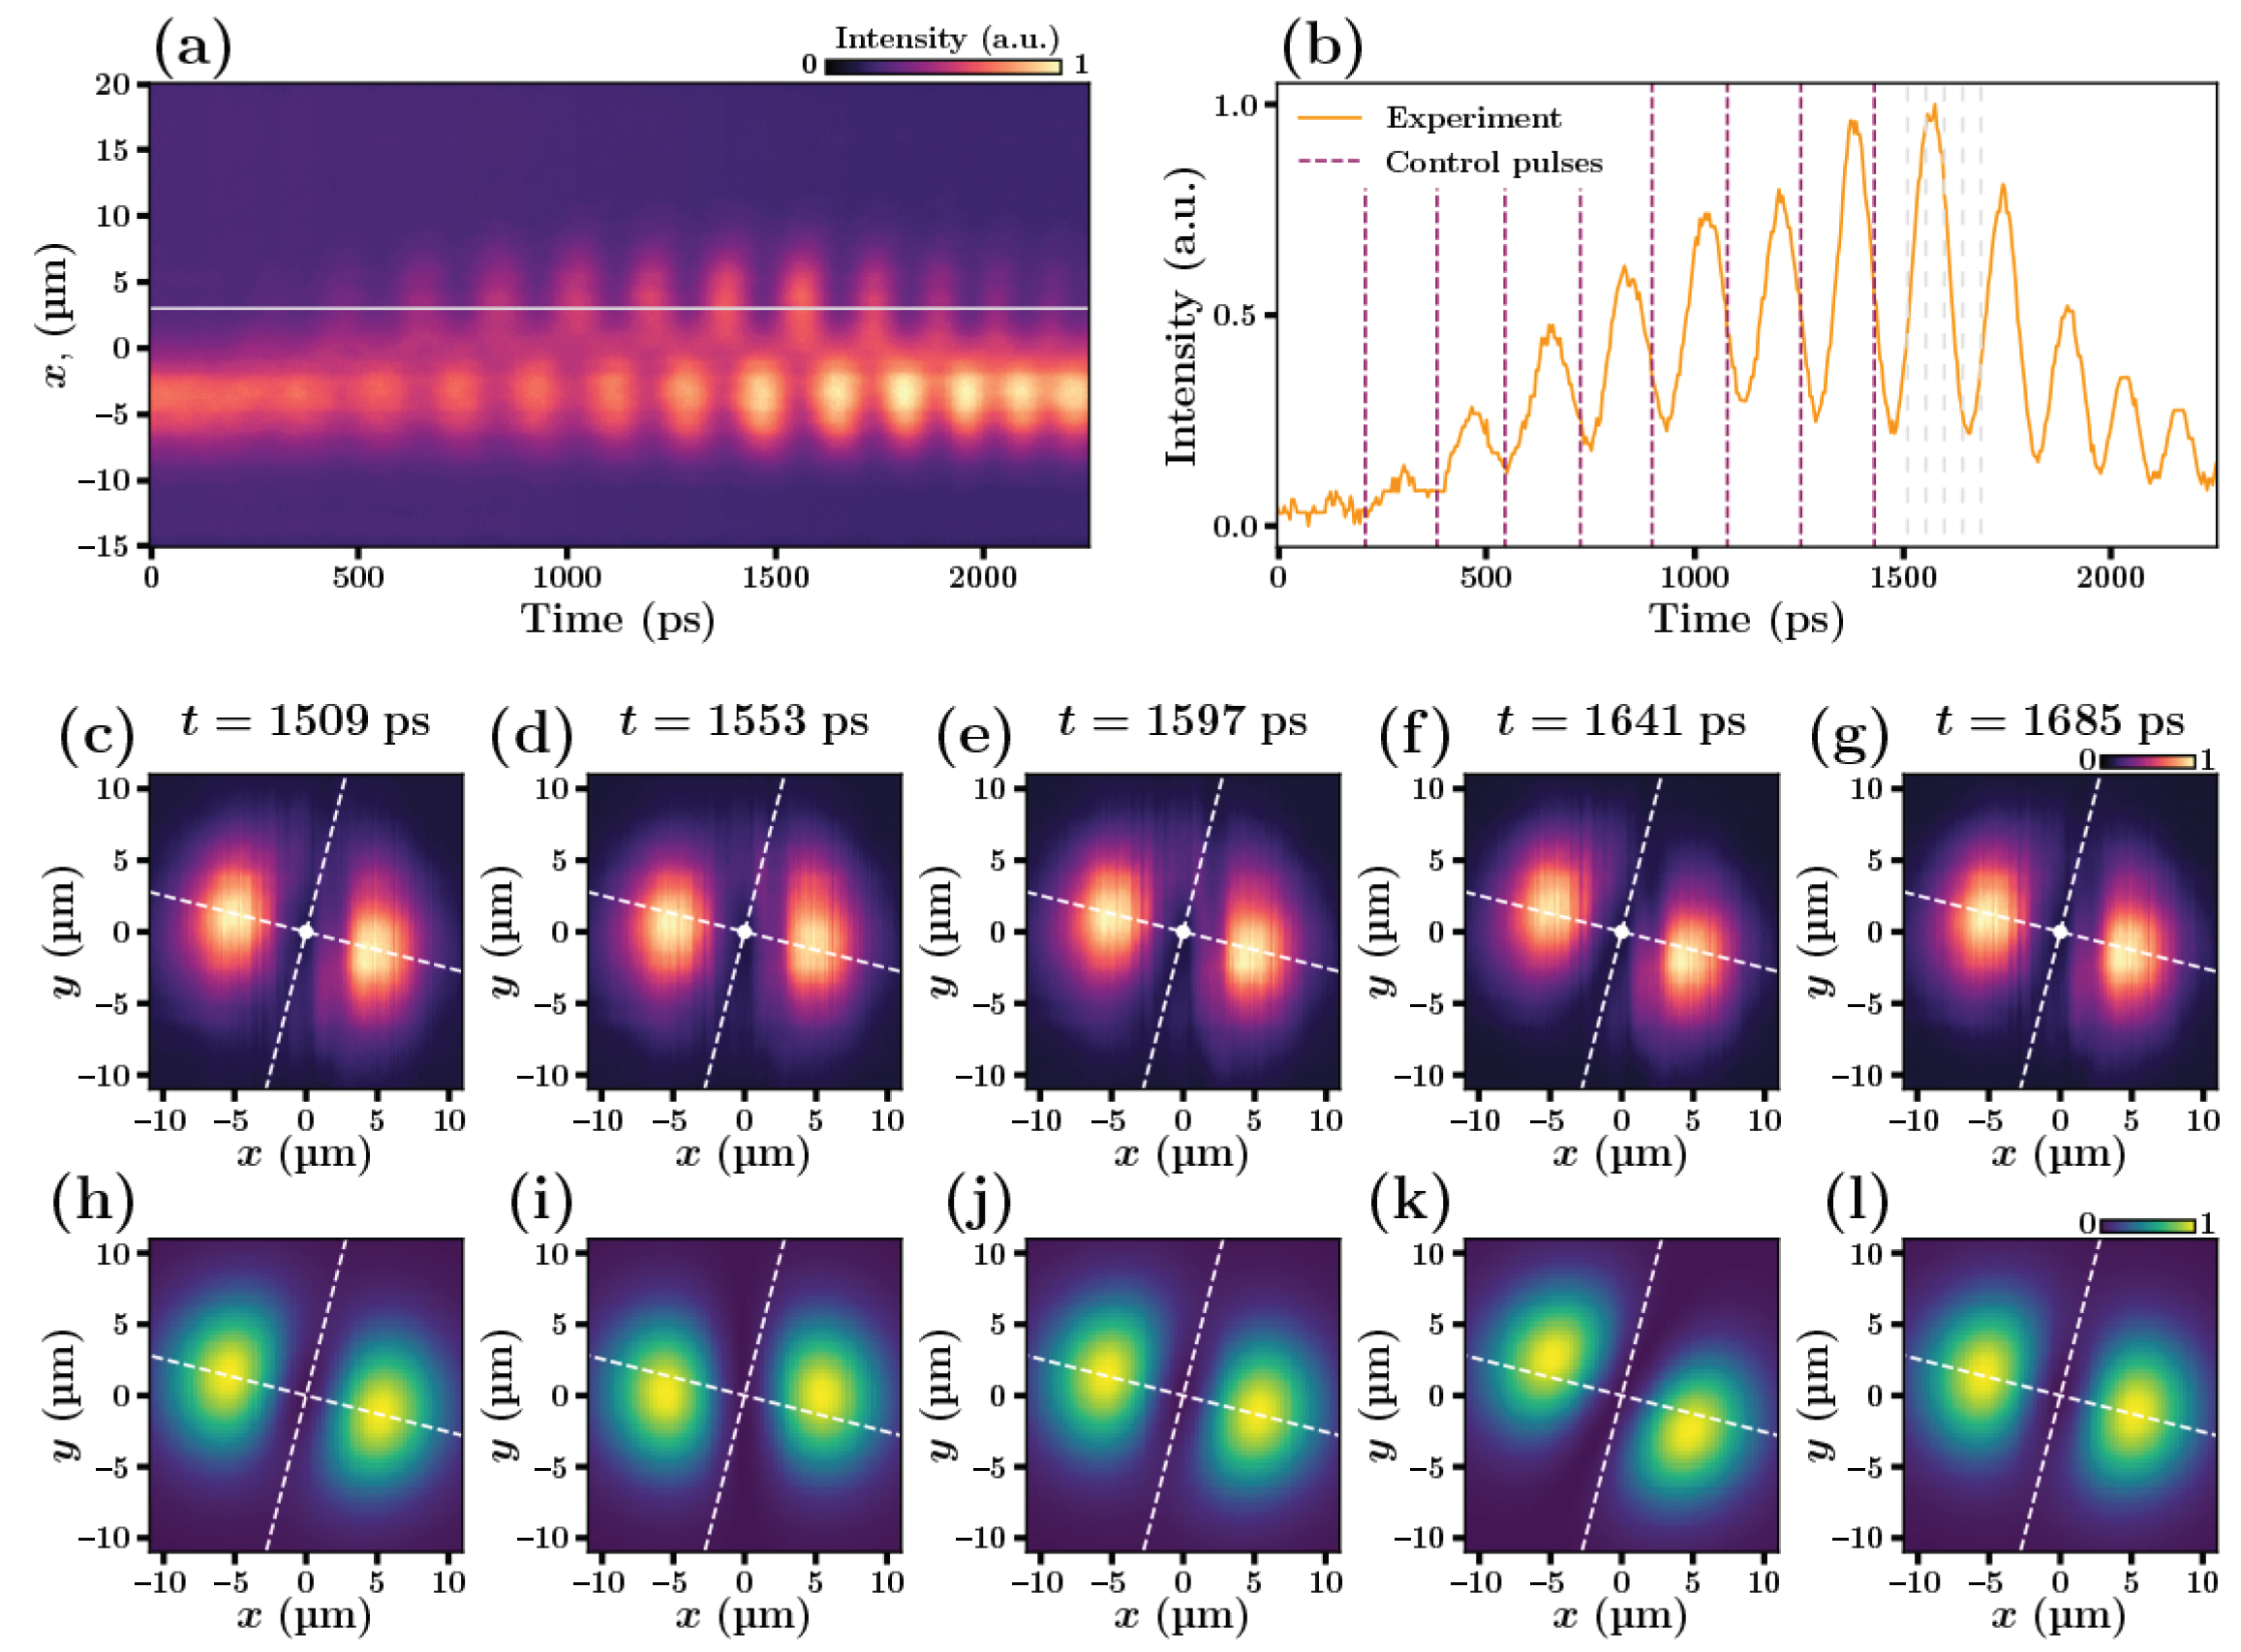
Streak-camera measurements allow us to visualize time- and space-resolved images of polariton condensates. We find a very good agreement of the measurements with predictions of a two-level quasi-analytical model. After reaching the stationary oscillation regime, we observe pronounced intensity beats which may be fitted by a harmonic function: a ( x , y ) sin [ ω t + ϕ 0 ( x , y ) ] at each spatial point. Figure 2 shows the spatial distribution of the polariton density obtained experimentally (panels (c–g)) and numerically (panels (h–l)) at different times within the period of quantum beats. In order to maximize the magnitude of intensity oscillations detected by streak-camera (panel (a)) we use a sequence of 8 control pulses incident to the same spot at equal time intervals, as dashed lines in Figure 2b show. The repetition frequency in this sequence of pulses was chosen equal to the condensate oscillation frequency to achieve a parametric resonance (see Supplementary Material, Figure S9).

4. Hadamard and Pauli Operations

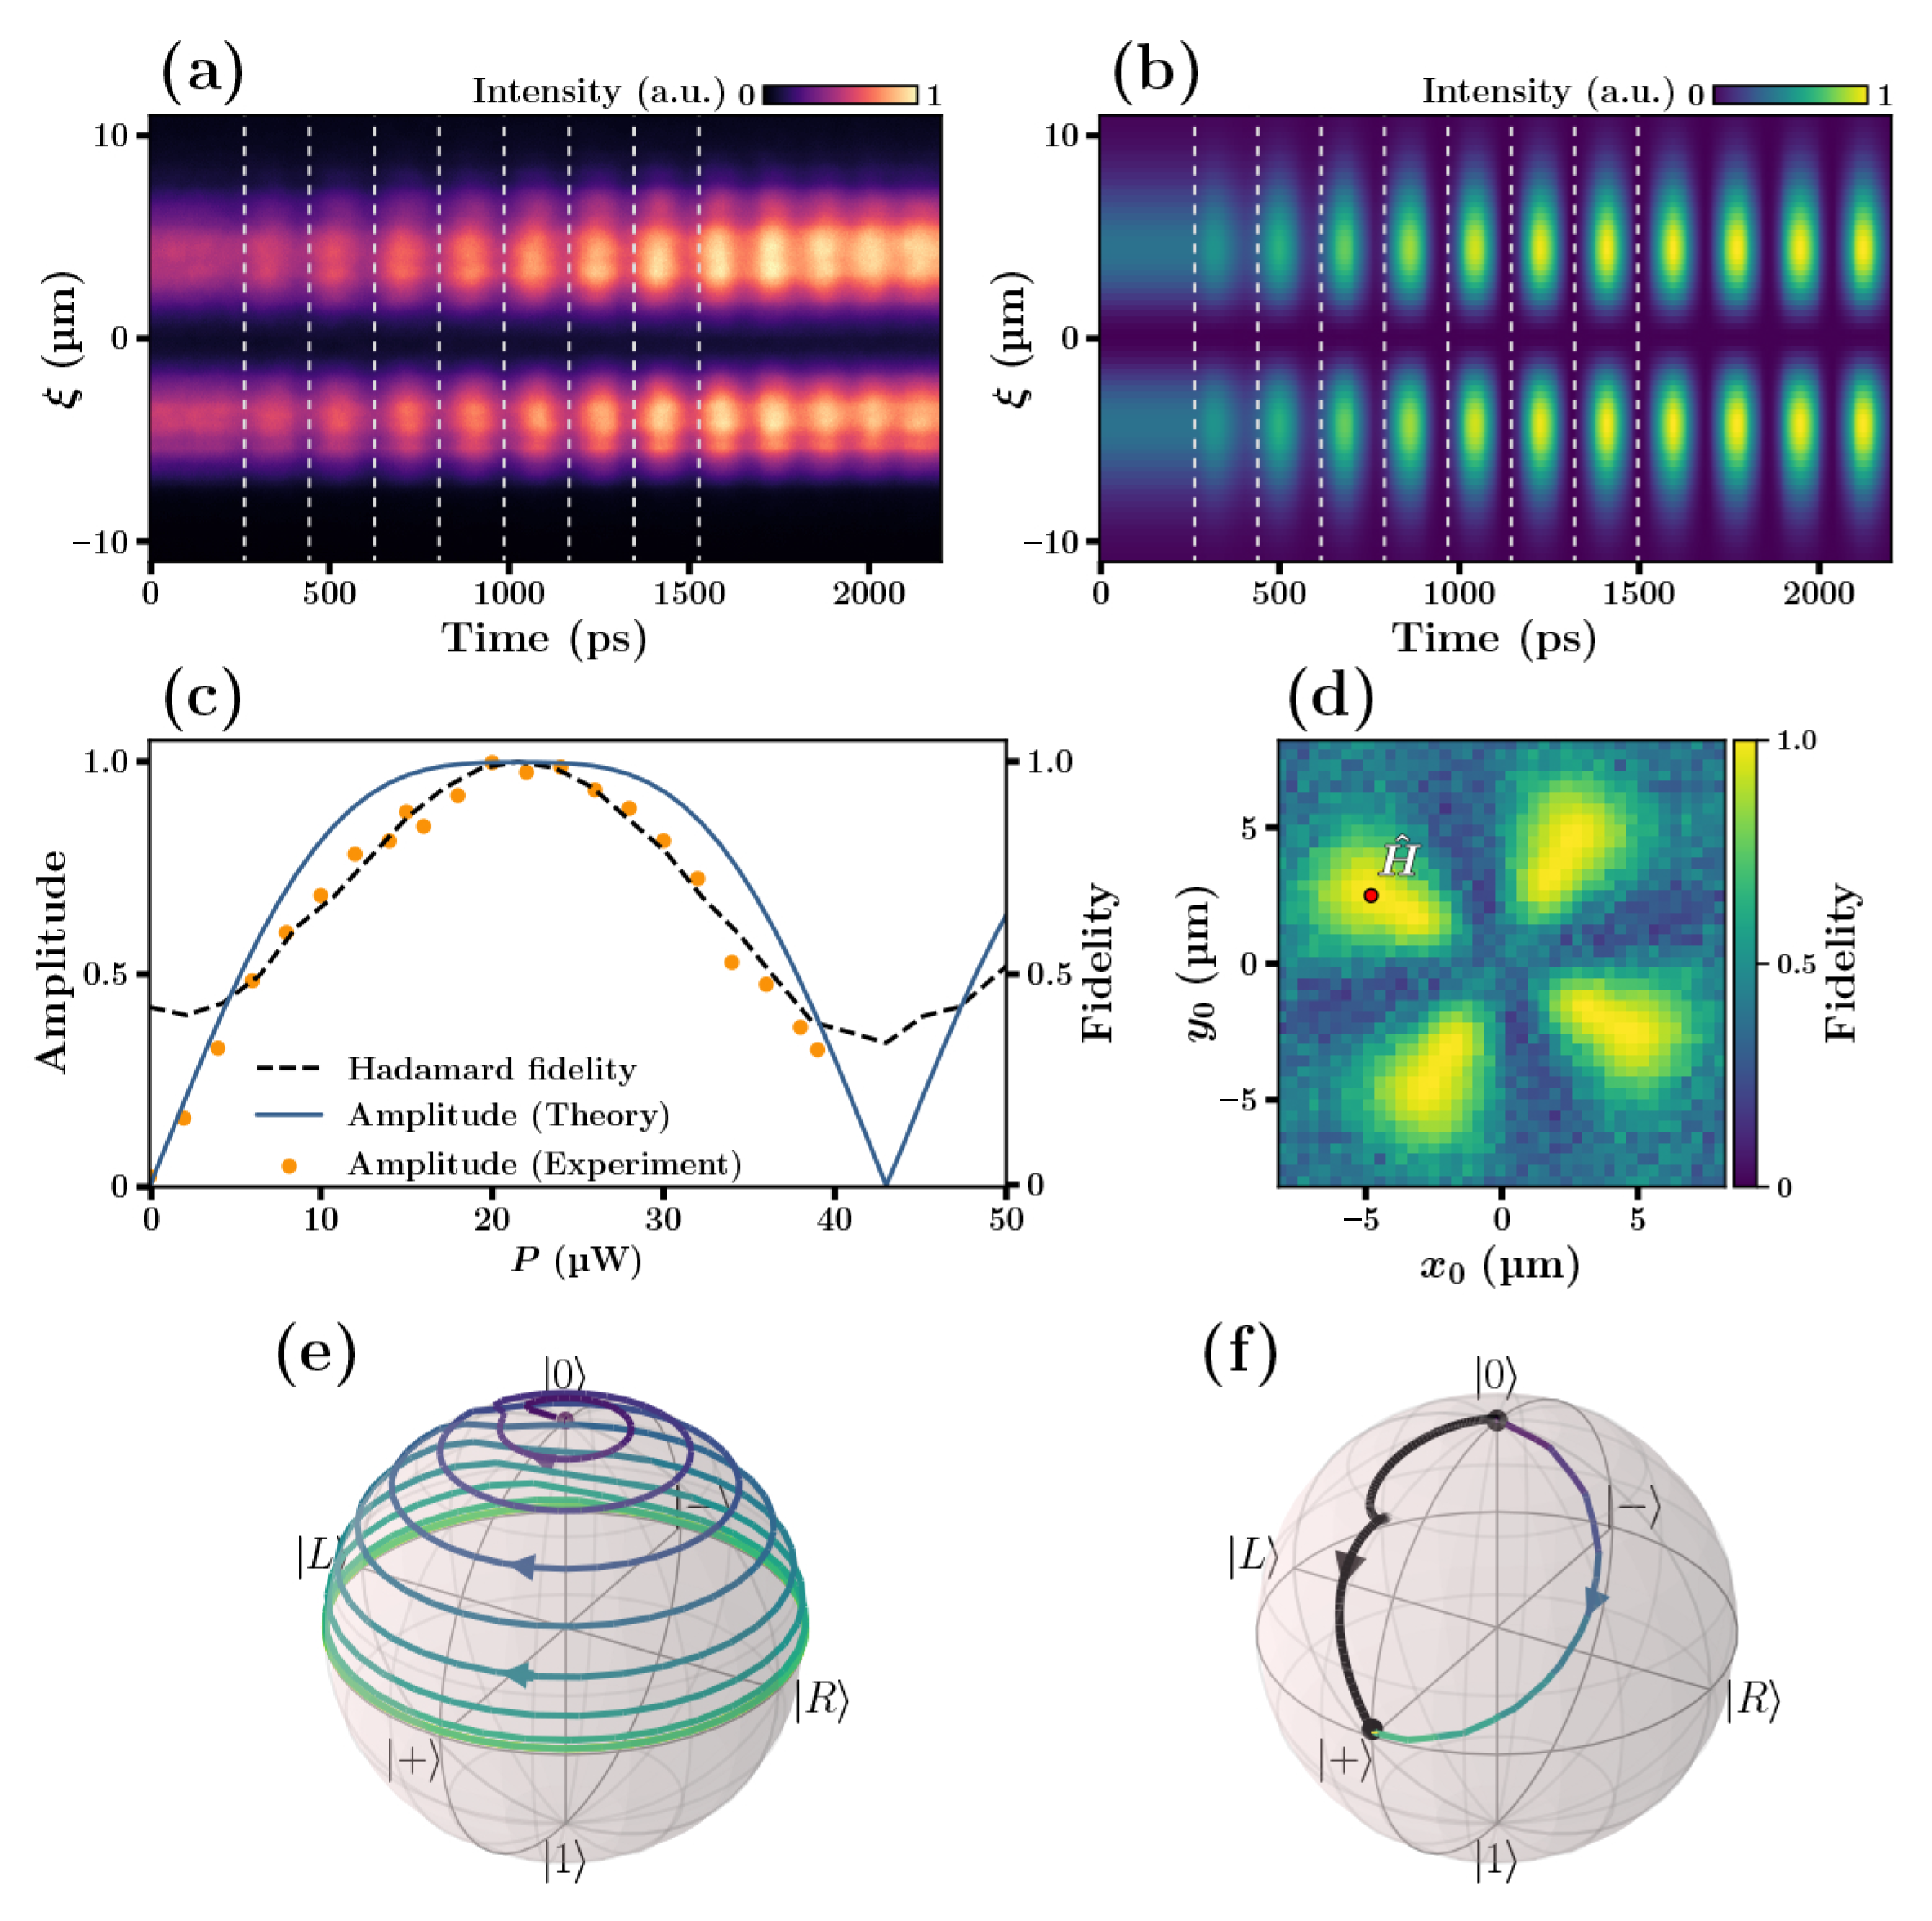
It is instructive to map the observed quantum beats to a Bloch sphere. We do it by fitting the time-resolved tomography images recorded by the streak-camera with use of a two-level model introduced above. The oscillatory dynamics of the system manifests itself in the precession of its quantum state on the surface of the Bloch sphere as panel (e) (in a rest frame) and (f) (in a rotating frame) in Figure 3 show.
The poles of the Bloch sphere may be considered as the computational basis states | 0 ( p x -orbital) and | 1 ( p y -orbital). Once a polariton condensate is placed in a superposition of two eigen states of a trap, it may be considered as a qubit. Using nonresonant optical pulses focused at different locations of the trap, we were able to change the state of the trapped condensate. These changes manifest themselves in changing frequency, amplitude and phase of the quantum beats observed in the streak-camera images. Mapping the state of the condensate to the Bloch sphere we observed how the studied quantum system evolves from the pole of the sphere to its equatorial plane (Figure 3e,f). Panel (f) displays two curves: the experimental data is represented by the black curve, whereas the theoretical calculation is shown in blue-green. The two trajectories converge to the same final point, which is crucial for realizing a high fidelity quantum operation. This particular transformation corresponds to the Hadamard operation given by:
H = 1 2 1 1 1 1 .
In order to implement the high-fidelity Hadamard operation, we have measured the dependence of the amplitude of the beats induced by the sequence of control pulses on the pump power and compared it with the theoretical prediction (Figure 3c). The black line in Figure 3c shows the predicted fidelity of the Hadamard operation for a pulse centered at the red spot in the panel (d). Carefully choosing the spot hit by the sequence of control pulses we have been able to achieve a fidelity of the Hadamard operation of over 0.95 . This number is obtained by averaging over 5 different initial states of the system. The theoretical estimate for the fidelity is much higher, about ∼1, as one can see from the calculated fidelity map shown in Figure 3d.
Once the Hadamard operation is implemented, we implement also Pauli-Z operation given by:
Z = 1 0 0 1 .
This is achieved by sending the 9th control pulse to a specific spatial location. It moves the system to an opposite end of the diameter in the equatorial plane of the Bloch sphere, as Figure 4 illustrates. The streak-camera images of the condensate density cross-section as a function of time are demonstrated in panels (a,b). 8 initializing pulses transfer the system from the pole to the equator ( | + ), then the 9th control pulse triggers the Pauli-Z gate operation. We have plotted the dependencies of the phase shifts induced by the control pulses as functions of the control pulse intensities (panel (c)). After optimization of the pump power the phase of the quantum beats is being shifted by this gate operation by + π or π depending on the location of the control pulse. The final state of the system is the same in both cases, as panel (e) illustrates. This panel shows two calculated trajectories of the system, which coincide on the path from | 0 to | + , and then move in opposite directions along the equator (solid and dotted lines). The experimental fidelity of the implemented Pauli-Z operation exceeds 0.97 in both cases. We have obtained this estimate based on a series of experiments, where we initialized the system in >20 different points on the surface of the Bloch sphere. The studied set of initial locations is shown in of Figure 4g. In our implementation, the Pauli–Z gate flips the relative phase between | 0 and | 1 by π for arbitrary superpositions prepared on the Bloch sphere, as illustrated in Figure 4e,g.

5. Discussion

In our experiments, streak-camera averages the emission intensity collected after millions of pulses. Still, we are able to observe the intensity beats whose amplitude and phase are characterized by well-defined patterns. The macroscopic many-body wavefunction of a polariton condensate changes on a length-scale of over 10   μ m with a periodicity of about 100   p s . Small discrepancies between the experimental traces and the predictions of the linear two-level model (e.g., in Figure 3c and Figure 4c) stem from weak nonlinear mixing of remote trap modes (1s, 3s, 3p, 3d) with the qubit basis ( 2p x , 2p y ). This effect is minor, as corroborated by the high gate fidelities. This indicates that every initial pulse brings the condensate essentially to the same superposition of p x - and p y -orbitals. Regular oscillations of a trapped exciton-polariton condensate that persist for at least 1 n s . The phase locking of p x - and p y -orbitals imposed by the control pulse survives much longer than the phase of the condensate as a whole. This conclusion is consistent with recent experiments on persistent currents of exciton-polaritons in a ring geometry [36]. We note also that the real-space density dynamics of polariton condensates in traps have been studied in coupled systems [37,38]. These studies focused on nonlinear phenomena such as Lotka-Volterra population dynamics or collective Bogoliubov-like modes, where the interplay of interactions and dissipation drives pronounced density oscillations. In contrast, our present experiment demonstrates a linear phenomenon of quantum beats between the discrete p x and p y orbitals. Barrat et al. [30] have recently implemented a polariton-based qubit analog in an annular trap, exploiting two counter-circulating vortex states. Further exploring the potentiality of trapped condensates for quantum computation, here we harness the linear splitting between p x and p y orbitals confined by an elliptical trap and directly visualize the dynamics of the condensate wave function in real space. The frequency of the oscillations that we observe is defined by the splitting between size-quantization levels of the polariton condensate confined in a trap and it can be tuned either by changing the ellipticity of the trap or by modifying its potential with use of control pulses of light. In order to check that the observed dynamics is not linked with any dynamical attractor of a limit-cycle type, we excited the system in several initial states on the Bloch sphere. Shifting the initial condition we shift the whole trajectory on a sphere. Furthermore, we have perturbed the dynamics of the condensate by sending control laser pulses. In these studies, no trace of an attractor has been revealed. We conclude that the observed oscillations are quantum beats experienced by the polariton condensate as a whole entity. These beats have several unique features: (i) they persist over times orders of magnitude longer than the single-polariton lifetime, (ii) they involve several thousands of polaritons composing the condensate, (iii) a pronounced real space dynamics is observed. The observation of coherent real-space dynamics of a macroscopic many-body object paves the way for the realization of polariton qubits, as discussed in recent publications [30,39,40,41].

6. Conclusions

In conclusion, we have experimentally demonstrated long-living quantum beats of the trapped bosonic condensates of exciton-polaritons. By time-resolved-interferometry technique we have measured the coherence times T1 and T2 corresponding to the decay of the first order coherence of the eigen states of the polariton condensate in a trap and the decay of the coherence of a superposition of the two eigen states, respectively. Both T1 (1200 ps) and T2 (800 ps) exceed the single polariton life-time by two orders of magnitude. This proves that a superposition of two discrete states of a trapped exciton polariton-condensate may be used for quantum gate operations. We implemented the Hadamard and Pauli-Z operations by hitting specific spots on a trapped condensate with non-resonant light pulses that create time-dependent perturbation potentials for the exciton-polaritons. The experimentally measured fidelity of single-qubit operations on the trapped polariton condensates exceeds 0.95 for the Hadamard operation and 0.97 for the Pauli-Z operation. These results pave the way for the realization of quantum processors based on trapped exciton-polariton condensates.

Supplementary Materials

The following supporting information can be downloaded at: https://www.mdpi.com/article/10.3390/opt6040053/s1. Figure S1. Experimental set-up. BS—non-polarizing beam splitter; PBS—polarizing beam splitter; BB—black body; DMD SLM—spatial light modulator based on a digital micromirror device; CW—single-mode cw laser with E ph = 1.65 eV; PM—power meter; MO—micro-objective; FELH—low-pass spectral filter; MZI—Mach–Zehnder interferometer. Figure S2. Emission of the polariton laser at different trap pump powers. A weak external ellipse shows the approximate position of the trap, while the two bright emitting lobes with a central minimum correspond to the polariton condensate. The trap laser powers are indicated on the panels. Figure S3. Emission of the polariton condensate for different trap orientations. Sequential images correspond to trap orientations of 10 , 20 , 45 , and 90 . Figure S4. (a) Sequence of 8 laser pulses (used for Hadamard operations) measured with a streak camera. The dashed white line marks the cross-section along which the time dependence shown in panel (b) is plotted. Figure S5. Stokes components of polariton emission: (a) linear V–H, (b) linear A–D, (c) circular. Figure S6. Time-resolved measurements of the first-order coherence. Panels (a) and (b) show interferograms recorded at time delays of 0 and 100 ps, respectively. The pale-pink filled circle marks the p y orbital ( τ p y = 753.1 ps), the blue open circle marks the p x orbital ( τ p x = 1217.1 ps), and the green half-filled circle indicates their spatial overlap. Panel (c) displays | g 1 ( τ ) | with a two-mode fit (period T g 1 = 193.5 ps; beating period 2 T g 1 = 386.9 ps). Panel (d) shows the extracted phase difference Δ ϕ versus time; its slope yields the energy splitting | Δ E | = 10.6 μ eV . In this figure, T 1 is inferred from the decay of | g 1 ( τ ) | measured within the individual 2 p x and 2 p y lobes, whereas T 2 is inferred from the decay of | g 1 ( τ ) | at their overlap (“equator”) region. Figure S7. Time- and energy-resolved emission of the microcavity after a high-energy femtosecond pulse arriving at t = 600 ps. The horizontal line at 1.530 eV marks the condensate emission in the trap. Panels (a) and (b) show emission recorded far from and near the pulse spot, respectively. Figure S8. (a,d) Time- and spatially-resolved emission of the polariton condensate excited by a single femtosecond pulse. Variations in the trap-forming beam shape lead to (a) oscillations with a time-dependent frequency and (d) oscillations with two characteristic frequencies. (b,e) Time traces along the white dashed lines in (a,d). (c,f) Spectra obtained from the corresponding time traces in (b,e). Figure S9. Influence of the control-pulse power (a) and the cw trap-beam power (b) on the position and amplitude of the parametric resonance that occurs when the pulse-train repetition rate matches the splitting between trap-confined excited states. The eigen-state splitting is governed by the trap ellipticity (see Figure S14). Figure S10. (a) Sequential pumping of condensate oscillations with a series of eight femtosecond pulses. The first pulse arrives at t = 200 ps; the last pulse arrives at t = 1530 ps. The interval t = 1530–2200 ps shows the decay of oscillations after the pulse train. (b) A cross-section of the time- and spatially-resolved image taken at the maximum of the condensate emission. (c) Fourier spectrum computed from the time trace between the vertical dashed lines. The temporal profile of the eight-pulse train is shown explicitly in Figure S4. Figure S11. Experimentally measured time- and spatially-resolved emission of the polariton condensate at different cross-sections. (a–c) Relative positions of the real-space emission map and the streak-camera slit (horizontal line). (d–f) Corresponding time dependencies. The excitation corresponds to consecutive Hadamard and Pauli-Z operations. Figure S12. (a) Example of extracting the tilting angle of the dipole (dumbbell) state from the reconstructed condensate image. The yellow dashed line marks the angular section used for sampling. (b) Emission intensity versus angle around the image center (yellow) and its fit (black) by y ( ϕ ) = A cos 2 ( ϕ + α ) , where α is the dipole tilting angle. Figure S13. Spatial distribution of energy-resolved emission of the polariton condensate confined in an elliptical trap. Sequential panels correspond to consecutive CCD pixels at the spectrometer output slit. Each image is normalized to its maximum. At the highest cw-trap power, all trap states are populated by polaritons. Figure S14. Energy splitting between the 2nd and 3rd dipole states versus trap ellipticity, extracted from the beating frequency (yellow) and from spectroscopy (lilac). Curves are theoretical fits. Figure S15. (Left) Dependence of the matrix distance D on the control-pulse center ( x 0 , y 0 ) for the Hadamard operator at t 0 = 292.2 ps. (Right) Average fidelity F (over 30 random initial states ψ 0 ) versus ( x 0 , y 0 ) at t 0 = 292.2 ps. Figure S16. Dependence of the shortest distance D (over ( x 0 , y 0 ) ) and the highest average fidelity F ¯ (over ( x 0 , y 0 ) ) on the control-pulse arrival time t 0 for the Hadamard operation. Figure S17. Initial and final states on the Bloch sphere for a control pulse realizing the Hadamard operation: (upper) initial | ψ 0 and final | ψ I ; (lower) initial | ψ 0 and target | ψ H . The final state is shown at τ = 500 ps. Figure S18. Dependence of the norm D on the control-pulse center ( x 0 , y 0 ) for (left) the σ x operator at t 0 = 292.2 ps and (right) the σ y operator at t 0 = 135 ps. Figure S19. Dependence of the norm D on the control-pulse center ( x 0 , y 0 ) for the σ z operator at t 0 = 292.2 ps. Figure S20. Shortest distance D (optimized over ( x 0 , y 0 ) ) versus control-pulse arrival time t 0 for all Pauli operations. Figure S21. Time dependence of the angle between the condensate axis and its initial orientation: experiment versus theory. This plot corresponds to the dynamics in the main-text Figure 3, with damping included and the control-pulse-spot parameters adjusted for the best fit. References [42,43,44,45,46,47,48] are cited in Supplementary Materials.

Author Contributions

Formal analysis, A.L. and D.N.; Investigation, R.V.C., D.N. and A.K.; Writing—original draft, A.K.; Writing—review and editing, S.V.K.; Supervision, S.V.K. and A.V.K. All authors have read and agreed to the published version of the manuscript.

Funding

This research was funded by Saint Petersburg State University, Research Grant No. 125022803069-4. A.V.K. and S.K. were funded by the Innovation Program for Quantum Science and Technology, grant number 2023ZD0300300. A.K. was funded by the Priority 2030 Strategic Academic Leadership Program at the Moscow Institute of Physics and Technology. R.C. acknowledges the Resource Center Nanophotonics of the State University of St. Petersburg for support of the experimental part of the project.

Data Availability Statement

The original contributions presented in this study are included in the article/supplementary material. Further inquiries can be directed to the corresponding authors.

Acknowledgments

The authors acknowledge the Saint Petersburg State University for the Research Grant No. 125022803069-4. AVK and SV acknowledge “Innovation Program for Quantum Science and Technology” 2023ZD0300300. RC acknowledges the Resource Center Nanophotonics of the State University of St-Petersburg for support of the experimental part of the project. AK acknowledges support from the Moscow Institute of Physics and Technology under the Priority 2030 Strategic Academic Leadership Program.

Conflicts of Interest

The authors declare no conflicts of interest.

References

  1. Mitsunaga, M.; Tang, C.L. Theory of quantum beats in optical transmission-correlation and pump-probe measurements. Phys. Rev. A 1987, 35, 1720–1728. [Google Scholar] [CrossRef]
  2. Dodd, J.N.; Kaul, R.D.; Warrington, D.M. The modulation of resonance fluorescence excited by pulsed light. Proc. Phys. Soc. 1964, 84, 176. [Google Scholar] [CrossRef]
  3. Haroche, S.; Paisner, J.A.; Schawlow, A.L. Hyperfine Quantum Beats Observed in Cs Vapor under Pulsed Dye Laser Excitation. Phys. Rev. Lett. 1973, 30, 948–951. [Google Scholar] [CrossRef]
  4. Shah, J. Ultrafast Spectroscopy of Semiconductors and Semiconductor Nanostructures, 2nd ed.; Springer: New York, NY, USA, 2013; Volume 115. [Google Scholar] [CrossRef]
  5. Roskos, H.G.; Nuss, M.C.; Shah, J.; Leo, K.; Miller, D.A.B.; Fox, A.M.; Schmitt-Rink, S.; Köhler, K. Coherent submillimeter-wave emission from charge oscillations in a double-well potential. Phys. Rev. Lett. 1992, 68, 2216–2219. [Google Scholar] [CrossRef]
  6. Schmitt-Rink, S.; Bennhardt, D.; Heuckeroth, V.; Thomas, P.; Haring, P.; Maidorn, G.; Bakker, H.; Leo, K.; Kim, D.S.; Shah, J.; et al. Polarization dependence of heavy- and light-hole quantum beats. Phys. Rev. B 1992, 46, 10460–10463. [Google Scholar] [CrossRef] [PubMed]
  7. Göbel, E.O.; Leo, K.; Damen, T.C.; Shah, J.; Schmitt-Rink, S.; Schäfer, W.; Müller, J.F.; Köhler, K. Quantum beats of excitons in quantum wells. Phys. Rev. Lett. 1990, 64, 1801–1804. [Google Scholar] [CrossRef]
  8. Bar-Ad, S.; Bar-Joseph, I. Absorption quantum beats of magnetoexcitons in GaAs heterostructures. Phys. Rev. Lett. 1991, 66, 2491–2494. [Google Scholar] [CrossRef]
  9. Trifonov, A.V.; Khramtsov, E.S.; Kavokin, K.V.; Ignatiev, I.V.; Kavokin, A.V.; Efimov, Y.P.; Eliseev, S.A.; Shapochkin, P.Y.; Bayer, M. Nanosecond Spin Coherence Time of Nonradiative Excitons in GaAs/AlGaAs Quantum Wells. Phys. Rev. Lett. 2019, 122, 147401. [Google Scholar] [CrossRef] [PubMed]
  10. Kotur, M.; Dzhioev, R.I.; Vladimirova, M.; Jouault, B.; Korenev, V.L.; Kavokin, K.V. Nuclear spin warm up in bulk n-GaAs. Phys. Rev. B 2016, 94, 081201. [Google Scholar] [CrossRef]
  11. Alexandrov, E. Interference effects in quantum transitions in non-stationary atomic systems. Opt. Spectrosc. 1964, 17, 957. [Google Scholar]
  12. Erland, J.; Balslev, I. Theory of quantum beat and polarization interference in four-wave mixing. Phys. Rev. A 1993, 48, R1765–R1768. [Google Scholar] [CrossRef]
  13. Yugova, I.A.; Glazov, M.M.; Ivchenko, E.L.; Efros, A.L. Pump-probe Faraday rotation and ellipticity in an ensemble of singly charged quantum dots. Phys. Rev. B 2009, 80, 104436. [Google Scholar] [CrossRef]
  14. Müller, G.M.; Oestreich, M.; Römer, M.; Hübner, J. Semiconductor spin noise spectroscopy: Fundamentals, accomplishments, and challenges. Phys. E Low-Dimens. Syst. Nanostructures 2010, 43, 569–587. [Google Scholar] [CrossRef]
  15. Kurnit, N.A.; Abella, I.D.; Hartmann, S.R. Observation of a Photon Echo. Phys. Rev. Lett. 1964, 13, 567–568. [Google Scholar] [CrossRef]
  16. Scully, M.O.; Zubairy, M.S. Dedication. In Quantum Optics; Cambridge University Press: Cambridge, UK, 1997; pp. 17–18. [Google Scholar]
  17. Deng, H.; Weihs, G.; Santori, C.; Bloch, J.; Yamamoto, Y. Condensation of Semiconductor Microcavity Exciton Polaritons. Science 2002, 298, 199–202. [Google Scholar] [CrossRef] [PubMed]
  18. Kasprzak, J.; Richard, M.; Kundermann, S.; Baas, A.; Jeambrun, P.; Keeling, J.M.J.; Marchetti, F.M.; Szymańska, M.H.; André, R.; Staehli, J.L.; et al. Bose–Einstein condensation of exciton polaritons. Nature 2006, 443, 409–414. [Google Scholar] [CrossRef] [PubMed]
  19. Carusotto, I.; Ciuti, C. Quantum fluids of light. Rev. Mod. Phys. 2013, 85, 299–366. [Google Scholar] [CrossRef]
  20. Norris, T.B.; Rhee, J.K.; Sung, C.Y.; Arakawa, Y.; Nishioka, M.; Weisbuch, C. Time-resolved vacuum Rabi oscillations in a semiconductor quantum microcavity. Phys. Rev. B 1994, 50, 14663–14666. [Google Scholar] [CrossRef] [PubMed]
  21. Cao, H.; Jacobson, J.; Björk, G.; Pau, S.; Yamamoto, Y. Observation of dressed-exciton oscillating emission over a wide wavelength range in a semiconductor microcavity. Appl. Phys. Lett. 1995, 66, 1107–1109. [Google Scholar] [CrossRef]
  22. Hennessy, K.; Badolato, A.; Winger, M.; Gerace, D.; Atatüre, M.; Gulde, S.; Fält, S.; Hu, E.L.; Imamoğlu, A. Quantum nature of a strongly coupled single quantum dot–cavity system. Nature 2007, 445, 896–899. [Google Scholar] [CrossRef]
  23. Dominici, L.; Colas, D.; Gianfrate, A.; Rahmani, A.; Ardizzone, V.; Ballarini, D.; De Giorgi, M.; Gigli, G.; Laussy, F.P.; Sanvitto, D.; et al. Full-Bloch beams and ultrafast Rabi-rotating vortices. Phys. Rev. Res. 2021, 3, 013007. [Google Scholar] [CrossRef]
  24. Renucci, P.; Amand, T.; Marie, X.; Senellart, P.; Bloch, J.; Sermage, B.; Kavokin, K.V. Microcavity polariton spin quantum beats without a magnetic field: A manifestation of Coulomb exchange in dense and polarized polariton systems. Phys. Rev. B 2005, 72, 075317. [Google Scholar] [CrossRef]
  25. Mukherjee, S.; Myers, D.M.; Lena, R.G.; Ozden, B.; Beaumariage, J.; Sun, Z.; Steger, M.; Pfeiffer, L.N.; West, K.; Daley, A.J.; et al. Observation of nonequilibrium motion and equilibration in polariton rings. Phys. Rev. B 2019, 100, 245304. [Google Scholar] [CrossRef]
  26. Kim, S.; Rubo, Y.G.; Liew, T.C.H.; Brodbeck, S.; Schneider, C.; Höfling, S.; Deng, H. Emergence of microfrequency comb via limit cycles in dissipatively coupled condensates. Phys. Rev. B 2020, 101, 085302. [Google Scholar] [CrossRef]
  27. Rayanov, K.; Altshuler, B.L.; Rubo, Y.G.; Flach, S. Frequency Combs with Weakly Lasing Exciton-Polariton Condensates. Phys. Rev. Lett. 2015, 114, 193901. [Google Scholar] [CrossRef] [PubMed]
  28. Nalitov, A.V.; Sigurdsson, H.; Morina, S.; Krivosenko, Y.S.; Iorsh, I.V.; Rubo, Y.G.; Kavokin, A.V.; Shelykh, I.A. Optically trapped polariton condensates as semiclassical time crystals. Phys. Rev. A 2019, 99, 033830. [Google Scholar] [CrossRef]
  29. Sigurdsson, H.; Gnusov, I.; Alyatkin, S.; Pickup, L.; Gippius, N.A.; Lagoudakis, P.G.; Askitopoulos, A. Persistent Self-Induced Larmor Precession Evidenced through Periodic Revivals of Coherence. Phys. Rev. Lett. 2022, 129, 155301. [Google Scholar] [CrossRef]
  30. Barrat, J.; Tzortzakakis, A.F.; Niu, M.; Zhou, X.; Paschos, G.G.; Petrosyan, D.; Savvidis, P.G. Qubit analog with polariton superfluid in an annular trap. Sci. Adv. 2024, 10, eado4042. [Google Scholar] [CrossRef]
  31. Carraro-Haddad, I.; Chafatinos, D.L.; Kuznetsov, A.S.; Papuccio-Fernández, I.A.; Reynoso, A.A.; Bruchhausen, A.; Biermann, K.; Santos, P.V.; Usaj, G.; Fainstein, A. Solid-state continuous time crystal in a polariton condensate with a built-in mechanical clock. Science 2024, 384, 995. [Google Scholar] [CrossRef]
  32. Zhang, Z.; Zhao, S.; Lei, D. Quantum statistical theory for an exciton–polariton condensate: Fluctuations and coherence. Phys. Rev. B 2022, 106, L220306. [Google Scholar] [CrossRef]
  33. Sun, X.; Wang, G.; Hou, K.; Bi, H.; Xue, Y.; Kavokin, A. Clock generator based on a vortex attractor in polariton superfluids. Phys. Rev. B 2024, 109, 155301. [Google Scholar] [CrossRef]
  34. Xu, W.; Bagrov, A.A.; Chowdhury, F.T.; Smith, L.D.; Kattnig, D.R.; Kappen, H.J.; Katsnelson, M.I. Fröhlich versus Bose-Einstein condensation in pumped bosonic systems. Phys. Rev. Res. 2025, 7, 023111. [Google Scholar] [CrossRef]
  35. Aladinskaia, E.; Cherbunin, R.; Sedov, E.; Liubomirov, A.; Kavokin, K.; Khramtsov, E.; Petrov, M.; Savvidis, P.; Kavokin, A. Spatial quantization of exciton-polariton condensates in optically induced trap. Phys. Rev. B 2023, 107, 045302. [Google Scholar] [CrossRef]
  36. Yao, Q.; Comaron, P.; Alnatah, H.; Beaumariage, J.; Mukherjee, S.; West, K.; Pfeiffer, L.; Baldwin, K.; Szymanska, M.; Snoke, D. Persistent, controllable circulation of a polariton ring condensate. arXiv 2023, arXiv:2302.07803. [Google Scholar] [CrossRef]
  37. Töpfer, J.D.; Sigurdsson, H.; Alyatkin, S.; Lagoudakis, P.G. Lotka-Volterra population dynamics in coherent and tunable oscillators of trapped polariton condensates. Phys. Rev. B 2020, 102, 195428. [Google Scholar] [CrossRef]
  38. Estrecho, E.; Pieczarka, M.; Wurdack, M.; Steger, M.; West, K.; Pfeiffer, L.N.; Snoke, D.W.; Truscott, A.G.; Ostrovskaya, E.A. Low-Energy Collective Oscillations and Bogoliubov Sound in an Exciton-Polariton Condensate. Phys. Rev. Lett. 2021, 126, 075301. [Google Scholar] [CrossRef]
  39. Xue, Y.; Chestnov, I.; Sedov, E.; Kiktenko, E.; Fedorov, A.K.; Schumacher, S.; Ma, X.; Kavokin, A. Split-ring polariton condensates as macroscopic two-level quantum systems. Phys. Rev. Res. 2021, 3, 013099. [Google Scholar] [CrossRef]
  40. Kavokin, A.; Liew, T.C.H.; Schneider, C.; Lagoudakis, P.G.; Klembt, S.; Hoefling, S. Polariton condensates for classical and quantum computing. Nat. Rev. Phys. 2022, 4, 435–451. [Google Scholar] [CrossRef]
  41. Ricco, L.S.; Shelykh, I.A.; Kavokin, A. Qubit gate operations in elliptically trapped polariton condensates. Sci. Rep. 2024, 14, 4211. [Google Scholar] [CrossRef]
  42. de Oliveira, M.; Munro, W.J. Quantum computation with mesoscopic superposition states. Phys. Rev. A 2000, 61, 042309. [Google Scholar] [CrossRef]
  43. Kiktenko, E.O.; Fedorov, A.K.; Man’ko, O.V.; Man’ko, V.I. Multilevel superconducting circuits as two-qubit systems: Operations, state preparation, and entropic inequalities. Phys. Rev. A 2015, 91, 042312. [Google Scholar] [CrossRef]
  44. Vidal, G.; Werner, R.F. Computable measure of entanglement. Phys. Rev. A 2002, 65, 032314. [Google Scholar] [CrossRef]
  45. Dominici, L.; Colas, D.; Donati, S.; Restrepo Cuartas, J.P.; De Giorgi, M.; Ballarini, D.; Guirales, G.; López Carreño, J.C.; Bramati, A.; Gigli, G.; et al. Ultrafast control of Rabi oscillations in a polariton condensate. Phys. Rev. Lett. 2014, 113, 226401. [Google Scholar] [CrossRef]
  46. Faust, T.; Rieger, J.; Seitner, M.J.; Kotthaus, J.P.; Weig, E.M. Coherent control of a classical nanomechanical two-level system. Nat. Phys. 2013, 9, 485–488. [Google Scholar] [CrossRef]
  47. Frimmer, M.; Novotny, L. The classical Bloch equations. Am. J. Phys. 2014, 82, 947–955. [Google Scholar] [CrossRef]
  48. Snoke, D.W. Interpreting Quantum Mechanics: Modern Foundations; Cambridge University Press: Cambridge, UK, 2024. [Google Scholar]
Figure 1. The optically-induced elliptical trap used for confinement of an exciton-polariton condensate. (a) the trap (light ring) and the spot of a control pulse inside the ring. (b) the intensity of emission of the trapped condensate in real space in the absence of quantum beats. (c) the space-dependent phase of the condensate wavefunction extracted from the interferometry images. Panels (d,e) show the experimental images of the eigen-functions of the trapped condensate referred to as p x - and p y - orbitals, corresponding to the 2nd and 3rd size-quantization energy levels of the trap. Panels (fi) show the maps of an amplitude a ( x , y ) (f,h) and a phase ϕ 0 ( x , y ) (g,i) of the oscillations obtained from fitting the experimental data (f,g) by harmonic oscillatory functions and calculated (h,i). Both in the experiment and theoretical calculation, the ellipticity coefficient of the trap of 1.054 has been chosen. (j) shows the experimentally measured dynamics of the condensate emission intensity triggered by the control pulse and detected at the streak-camera slot oriented along x-axis. The orange line in (k) is a cut of the image in (j) along the horizontal line. The blue line in panel (k) shows the corresponding density of the condensate wavefunction calculated within the two-level model. (l) the energy splitting of p x - and p y -eigen energies δ E = ћ ω as a function of the ellipticity of the trap. Points show the splittings extracted from the fit of the experimental data. Blue line shows the calculation results. The fitting parameters of the model, entering the potential (S1): m = 7 eV, ω x = 0.352 ps 1 , ω y = 0.371 ps 1 .
Optics 06 00053 g001
Figure 2. (a) The time-dependent emission of the trapped polariton condensate detected within the streak-camera slit, (b) shows the cut of the image (a) along the horizontal white line indicated in (a). Vertical purple dashed lines show the times of arrival of the control pulses. Five dashed gray lines in (b) indicate the times at which the images of the polariton condensate in panels (cg) are taken. The experimental images of the condensate emission intensity in real-space (cg) demonstrate the evolution of the condensate wavefunction within a single period of oscillations, which is 176 ps in this specific case. The corresponding numerically calculated images (hl) are obtained with use of the set of the fitting parameters: m = 7 eV, ω x = 0.297 ps 1 , ω y = 0.303 ps 1 .
Optics 06 00053 g002
Figure 3. Implementation of the Hadamard operation (1) on a trapped polariton condensate. (a) the experimental streak-camera image of the condensate density cross-section as a function of time. Vertical dashed white lines show when the control laser pulses arrive. (b) the calculated dynamics of the condensate density cross-section. (c) the experimental (orange dots) and theoretical (blue solid line) dependencies of the amplitude of the oscillations of the symmetry axis of the condensate on the pump power of control pulses. The black curve shows the dependence of the predicted fidelity of the Hadamard operation as a function of the control pulse intensity. (d) the color map showing the calculated dependence of the fidelity of the Hadamard gate on the coordinates ( x 0 , y 0 ) of the spot hit by control pulses. The red dot shows the position used in the experiment. (e) shows the calculated trajectory on the surface of the Bloch sphere that describes the dynamics of the system initialized by 8 subsequent laser pulses, (f) shows the same trajectory in a frame rotating with the frequency of the observed quantum beats (blue-green line). The experimental dynamics of the system is shown by the black solid line in panel (f). Parameters of the model: m = 7 eV, ω x = 0.359 ps 1 , ω y = 0.341 ps 1 .
Optics 06 00053 g003
Figure 4. Implementation of the Pauli-Z operation (2) on a trapped polariton condensate. (a) the streak-camera image of the condensate density cross-section as a function of time for the control pulse location shown by dot (1) in panel (d,b) shows the same for the control pulse location shown by dot (2) in panel (d). The arrival times of control pulses are indicated by vertical dashed lines in panels (a,b). (c) the experimental (orange and purple lines) and theoretical (dashed blue and green lines) dependencies of the shift of the phase of quantum beats induced by control pulses incident to the sample at the locations (1) and (2) indicated in panel (d) as functions of the corresponding pumping intensities. (d) color map showing the calculated dependence of the fidelity of the Pauli-Z gate on the coordinates ( x 0 , y 0 ) of the spot hit by control pulses. The red spot shows location of the first 8 pulses used to implement the Hadamard operation, the blue and green spots marked (1) and (2) show locations of the 9th pulse triggering the Pauli-Z operation. (e) shows the calculated trajectories of the system on the surface of the Bloch sphere for the combination of 8 pulses and 9th pulse arriving at locations (1) and (2) shown in the panel (d) by solid and dotted lines, respectively. (f) demonstrates the experimental dynamics of the system (orange-purple line) subject to the Hadamard and Pauli-Z gate operations. The theoretical trajectory from (e) is also shown for comparison. (g) shows the set of examined initial states of the system used to evaluate fidelity of the Pauli-Z operation. Parameters of the model: m = 7 eV, ω x = 0.152 ps 1 , ω y = 0.164 ps 1 .
Optics 06 00053 g004
Disclaimer/Publisher’s Note: The statements, opinions and data contained in all publications are solely those of the individual author(s) and contributor(s) and not of MDPI and/or the editor(s). MDPI and/or the editor(s) disclaim responsibility for any injury to people or property resulting from any ideas, methods, instructions or products referred to in the content.