Abstract
Wireless optical communication technology offers advantages, such as high-data transmission rates, confidentiality, and robust anti-interception capabilities, making it highly promising for cross-sea–air interface communication applications. However, to our knowledge, no studies have been conducted on the spatial transmission efficiency of light after it passes through ocean waves. To address this issue, a seawater-wave–atmosphere model based on Gerstner waves was constructed. Using the Monte Carlo method, the optical power distributions of the laser light passing through the sea–air interface at the first- and second-level sea scales were simulated. The optimal positions for deploying one to three receiving optical systems were analyzed, and a laser communication receiving system was designed. Furthermore, simulations were conducted to determine the optical transmission efficiency of the designed optical receiver system. At the first-level sea scale, the optimal position for a single-point detector was (0°, ±5.61°), whereas those for the two detectors were (0°, ±5.61°) and (0°, ±5.68°). At the second-level sea scale, the optimal position for a single-point detector was (0°, ±3.17°), and the optimal positions for the two detectors were (0°, ±3.1°) and (0°, ±2.98°). Under the designed conditions, the optical transmission efficiency for a single detector at the first- and second-level sea scales was 0.74–0.88%, respectively, while it was 0.79–1.09% in the two-detector case. At the second-level sea scale, the optical transmission efficiency for a single detector was 0.37–2.09% and 0.50–1.97% in the two-detector case.
1. Introduction
Atmospheric wireless optical communication and wireless optical communication technologies have matured. Cross-sea–air medium wireless optical communication is still in the theoretical stage of research. Cross-sea–air communication technology can be used for seabed data collection, positioning and navigation, military training, and other activities. To our knowledge, there are no reports on engineering prototypes because of the complex interaction of reflection, refraction, and scattering of light at the sea–air interface. Among these, refraction-induced beam divergence is the main factor that contributes to energy attenuation. Additionally, the complexity and dynamic nature of ocean waves make it difficult to determine precisely the optical transmission efficiency across the sea–air interface.
The transmission efficiency of cross-medium laser communication is affected by the parameters of the light source, optical system, and detector. These parameters affect key communication metrics, such as the communication range, data rate, and bit error rate (BER). Therefore, an accurate determination of optical transmission efficiency is essential for system design. The communication process requires stable and sustained received optical power in wireless optical communication systems, and the transmission efficiency must satisfy the minimum detectable signal-to-noise ratio requirement to achieve the target BER performance.
In 2018, Alharbi et al. [1] proposed a hybrid approach combining statistical and physical models to investigate the effects of dynamic sea surfaces on laser propagation in air-to-underwater optical channels, and conducted underwater wireless optical transmission experiments in a water tank. In 2019, researchers [2] at the Xidian University investigated the distribution and attenuation characteristics of uplink laser transmission across media interfaces. By employing Monte Carlo methods, they enhanced the existing laser transmission models and discovered that high-sea-surface wind speeds considerably affected the cross-medium uplink laser transmission. In 2021, the Guilin University of Electronic Technology [3] conducted a comprehensive study on air–sea cross-medium communications based on a detailed analysis of various channel media. This study established a vertical distribution profile of seawater attenuation coefficients and developed a turbulence profile model specifically adapted to marine environments. Furthermore, they proposed an optimal phase-screen distribution method that considerably improved the agreement between the cross-medium channel model and real-world conditions. However, to our knowledge, no studies have been conducted to determine the optimal placement of optical systems or calculate the transmission efficiency during laser cross-medium propagation.
This study first establishes a cross-medium sea-wave model for the sea scales at Levels 1 and 2 based on the Gerstner wave and interface refraction theories. Using Monte Carlo simulations, we obtained the optical power distribution of the laser beams after they propagated through the cross-medium sea-wave model. Based on a systematic analysis, we determined the optimal placement positions for one to three receiving optical detectors. The optical transmission efficiency was calculated for the designed receiving optical systems, and the simulation results demonstrated that deploying multiple receiving systems can improve the laser energy transmission efficiency considerably.
2. Simulation Theory of Laser Propagation Across Sea–Air Media
2.1. Gerstner Wave Theory for Ocean-Wave Simulations
The representation of ocean-wave profiles can be achieved through two primary approaches: energy spectrum methods (including the Neumann, Pierson–Moskowitz spectrum, and JONSWAP spectra) and geometric profile models (comprising the Peachy [4], Stokes [5], and Gerstner [6] models). Geometric optics theory requires geometric profile models to analyze the optical power distribution. Among these, the Gerstner model demonstrates superior alignment with the physical characteristics of ocean waves, offering distinct advantages in terms of volume conservation and wave-crest sharpening effects, thus justifying its adoption in this study. However, mathematical functions are relatively simple; the resulting wave models have weaker randomness and more uniform fluctuations, which are better suited for simulating calm or mildly wavy sea surfaces.
The Gerstner wave model assumes that each water particle moves in a circular or elliptical orbital trajectory around its equilibrium position, with this motion occurring in conjunction with the wave movement [7]. The Gerstner wave model assumes that the sea surface lies on the XY-plane at rest, with the Z-axis oriented vertically upward. Water particles oscillate along the X-axis direction, with their equilibrium positions denoted as (X0, Y0). Each particle undergoes wave-induced motion with a radius r, where k represents the wavenumber at point (X0, Z0), ω denotes the angular frequency of the wave, and t indicates time.
The motion equations of Gerstner waves can be derived by considering the time-dependent positional variations in the water particles along their circular trajectories. For derivation purposes, the parametric position of a water particle on its circular path is represented as θ (for simplicity, we temporarily disregard the radius r, which is introduced in subsequent steps). However, owing to wave propagation, the circle moves along the X-axis, with its center moving up and down depending on the height of the wave.
Considering both wave propagation and height variations, θ can be correlated with t and wave dynamics. Given that the wave propagates along the X-axis at velocity c (where c = kω, c representing the phase speed), the relationship can be expressed as θ = kx × ωt + θ0, where θ0 is the initial phase.
To introduce the radius and consider the change in the height of the wave, the point on the circular trajectory (sinθ, cosθ) can be multiplied by the radius r and offset on the Z-axis because the height of the wave can be added. This offset can be obtained by considering the height of the wave at the point (X0, Z0), which is usually proportional to sin(kx − ωt) (but with a phase difference and an amplitude factor). Thus, the position of the water particle at time t (X, Z) can be expressed as, and it is depicted in Figure 1. The solid circle represents the water particles moving with radius r, while the dashed circles indicate their motion in the next step. During this movement, the trajectory of the circle centers is depicted by the blue curve, which represents the Gerstner wave.
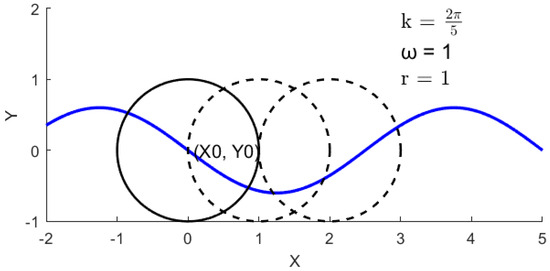
Figure 1.
Gerstner wave diagram.
2.2. Methods Used to Simulate Ocean Surface Waves
In the development of cross-medium communication systems, attenuation at the sea–air interface is a critical factor. When a laser beam propagates from seawater into the atmosphere, refraction and reflection occur simultaneously. Refraction causes the laser to diverge, with the degree of divergence depending on the light source parameters, sea scales, and wave models. Owing to the limited aperture of laser communication receivers, long-distance transmission can lead to substantial spatial optical loss. Additionally, when light travels from water (an optically denser medium) into the atmosphere (an optically less dense medium), total internal reflection occurs if the incident angle exceeds the critical angle (48.59°), thereby preventing the transmission of the optical signal [8].
It is assumed that the refractive index of the atmosphere is n1, and that of seawater is n0. As shown in Figure 2, consider an incident light ray at an angle α relative to the vertical line, corresponding to the incident angle of α′ = α + γ. The refracted ray forms an angle β with respect to the vertical line, and the refraction angle is β′ = β + γ. According to Snell’s law [9], we have
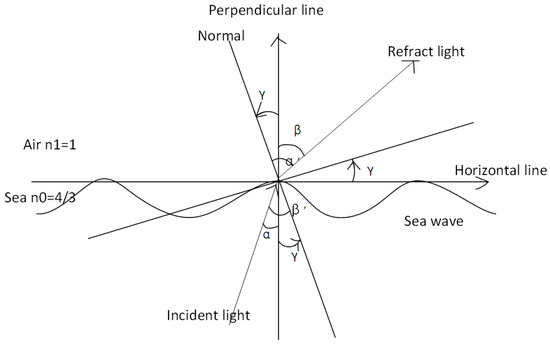
Figure 2.
Light passing through the air–sea interface.
To calculate the refraction of the laser at the sea–air interface, the simulated sea surface was divided into numerous small surface elements that could be approximated as flat planes (as shown in Figure 3). For each planar region, the refractive angle of the laser at the sea–air interface can be computed using Equation (2) [10].
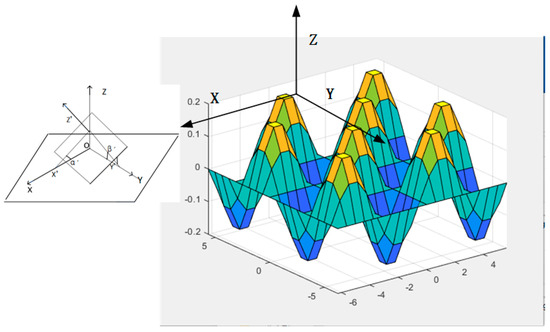
Figure 3.
Schematic of the local coordinate system on the sea surface.
Assume the angle between the X-axis of the sea surface reference coordinate system and the X′-axis of the local coordinate system of the surface element is α1, and the angle between the Y-axis of the local coordinate system and the Y′-axis of the sea surface reference coordinate system is β1. The relationship between the sea surface reference and the local coordinate systems of a small surface element can be expressed as follows:
From the above equation, the expression for the unit normal vector of the surface element in the reference coordinate system can be obtained as
2.3. Monte Carlo Simulation of Laser Beams
The Monte Carlo algorithm is a computational method that simulates stochastic processes by generating random numbers and employing probability models to replicate the photon transport in a medium [11]. The entire simulation process described in this paper encompasses the complete physical sequence wherein a laser beam is emitted from a device positioned 50 m under the water surface, traverses through the seawater medium, crosses the air–sea interface, propagates through the atmospheric channel, and is ultimately captured by the receiving system. The propagation of laser beams through scattering media is typically characterized by the radiative transfer equation [12]. For the simulation of light propagation, we employ the stochastic Monte Carlo technique [13], which accounts for the quantum nature of light and models the behavior of photon flux [14].
Photons undergo scattering and absorption at every random position. When light passes through a turbid medium, the scattered photons can be divided into three components: ballistic photons, quasi-ballistic photons, and diffuse photons [15]. Ballistic photons are not affected by scattering and maintain their original propagation direction, but they will rapidly decay as the thickness of the medium increases; quasi-ballistic photons undergo a small amount of scattering and still approximately follow the original direction of propagation, becoming the key signals for imaging and focusing in thicker media; while diffuse photons form random distributed background noise [16,17] due to multiple scattering. Monte Carlo simulations [18,19] show that even in thicker scattering media, a considerable portion of quasi-ballistic photons can penetrate and reach the detector [20].
In this study, the laser source was evenly divided into numerous ray elements. Each element randomly selected its emission position and angle according to a specified distribution law. After passing through the seawater/air interface, the exit angle was calculated based on the wave facet vector information and the refractive index of seawater.
As shown in Figure 4, at the altitude of airborne communication, a spherical surface was constructed with the center of the sea-surface light spot used as the origin and the communication height as the radius. A detector array was arranged on a spherical surface to count the number of rays received by each pixel. Finally, the spatial distribution of the optical power of the laser beam was determined after it crossed the seawater/air interface. The optical transmission efficiency can be determined by comparison with the total power, as shown in Figure 4.
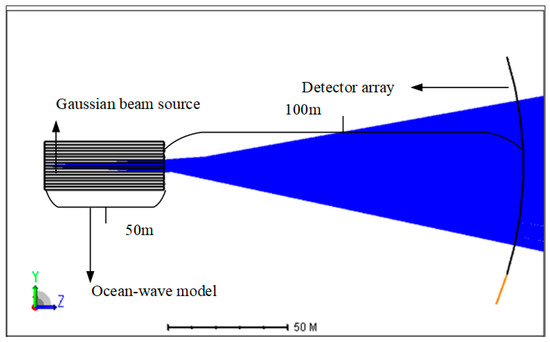
Figure 4.
Monte Carlo simulation of laser beams.
3. Cross-Sea–Air Medium Wireless Optical Communication Receiver System
The proposed system model consists of an underwater communication transmitter and an aerial communication receiver, with the following components: Underwater Transmitter System consists of a modulation circuit, digital-to-analog converter (DAC), laser diode, and beam divergence adjustment lens. Aerial Receiver System consists of multiple laser communication receivers (receiving system comprises an optical filter, lenses, and detector), multiple retractable and steerable tracking turntables, lidar (or microwave radar) with turntable controller, and beacon acquisition and tracking camera, as shown in Figure 5.
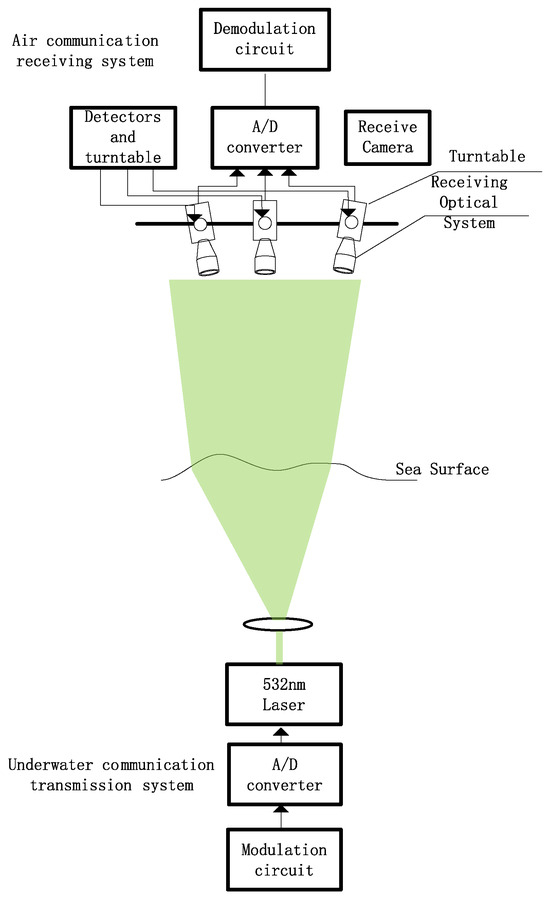
Figure 5.
Model of cross-sea and air communication system.
The beacon tracking camera is responsible for locating the underwater transmitter, while the lidar detects the wave surface profile spectrum. Based on this data, the tracking turntables adjust the angle and position of the laser receivers to optimize the performance of the laser-based cross-medium communication link.
To improve detection probability, multiple receiving optical systems can be deployed at different locations for simultaneous detection. By applying a maximum value selection process to multichannel signals, the detection efficiency can be enhanced while mitigating the instantaneous optical power attenuation caused by sudden wind-wave fluctuations.
Owing to the effects of wind and other external forces on the ocean surface, the actual air–sea interface experiences random fluctuations, causing the sea surface to tilt relative to the horizontal plane. Based on actual measurement data and calculations, Cox and Munk proposed a normalized probability distribution equation [21] for the sea-surface tilt angle γ under specific wind speed conditions.
The root-mean-square surface slope in this expression is , where U is the wind speed (m/s) at the sea surface. The peak value of the wave tilt angle varied as a function of the wind speed.
Figure 6 shows the probability distribution curves of the sea-surface tilt angles at different wind speeds. Higher wind speeds led to a broad probability distribution range and a reduced peak probability of sea-surface tilt angles. At a given wind speed, the sea-surface tilt angles tend to cluster around a specific value. Therefore, the highest optical power transmission efficiency can be achieved by strategically positioning the receiver optical system at an optimal angle and location based on the wind speed.
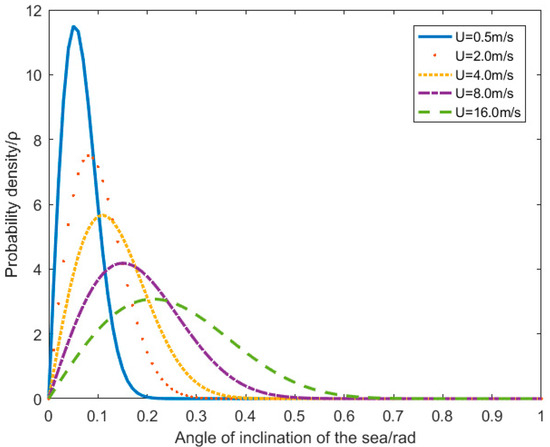
Figure 6.
Distribution diagram of sea-surface slope angles at different wind speeds.
4. Modeling Light Transmission Efficiency for Water–Air Wireless Optical Links
4.1. Simulation Parameters
The waves exhibit periodicity. To ensure stable communication, light spots formed by the source on the water surface should cover more than one wavelength range. At a source depth of 50 m and an interface spot diameter of approximately 5 m, the required source divergence angle was 0.1 rad. In the simulation, the optical power of the source was set to 1 W at a wavelength of 532 nm. A Gaussian beam source [22] was employed, and the source power was divided into 1 × 10⁶ segments for Monte Carlo ray tracing.
The receiving optical system was positioned at a height of 100 m. To ensure experimental accuracy, the field of view (FOV) was designed to cover an interface area exceeding 5.5 m. An avalanche photodiode detector was selected, with each pixel measuring 10 × 10 mm.
To satisfy the FOV requirements, the optical system was configured with a focal length of 150 mm and an aperture diameter of 125 mm, enabling coverage of a 6.7 m × 6.7 m area on the sea surface. Multiple multipixel detectors were uniformly arranged above the wave field, centered at the origin of the interface. The spatial power distribution of the laser beam after traversing the static medium was obtained by statistically analyzing the cumulative optical power received by each detector pixel. As specified in Table 1, distinct wave characteristics (period and height) were simulated to represent the varying sea scales. Table 1 references 1.5 m and 5.5 m as the wavelengths of the simulated waves, and 0.1 m and 0.2 m as the wave heights of the simulated waves. Reference [23] suggests that the effective upper limit of Gerstner waves is H/λ ≈ 1/7 (approximately 0.142). The first-level wind conditions selected in this paper, with a wave height of 0.1 m and a wavelength of 1.5 m, and the second-level wind conditions, with a wave height of 0.2 m and a wavelength of 5.5 m, are all within this range. Gerstner waves are more suitable for simulating fully developed and regular ocean waves, and thus are more applicable to calm, light to moderate sea conditions. According to the Douglas sea state scale, this roughly corresponds to Sea States 1 to 3.

Table 1.
Ocean wave parameters.
Figure 7 and Figure 8 show the temporal evolution of the optical power distributions for sea scales 1 and 2, respectively. The moment is selected at different times, observing the optical power changes in a single wave from its occurrence to disappearance at that moment. The results demonstrate superior transmission efficiency in the peripheral regions compared with the central area, which is in agreement with the wave slope statistics. The sampling points on the horizontal axis constitute an ordered data stream generated by a multi-detector system, with each point corresponding to a specific pixel within an individual detector. The same interpretation applies to the sampling points shown in Figure 8, Figure 9, Figure 10, Figure 11, Figure 12 and Figure 13.
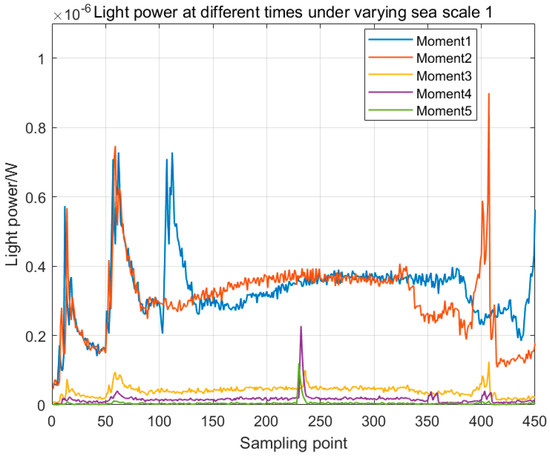
Figure 7.
Light power distribution diagram for sea scale 1.
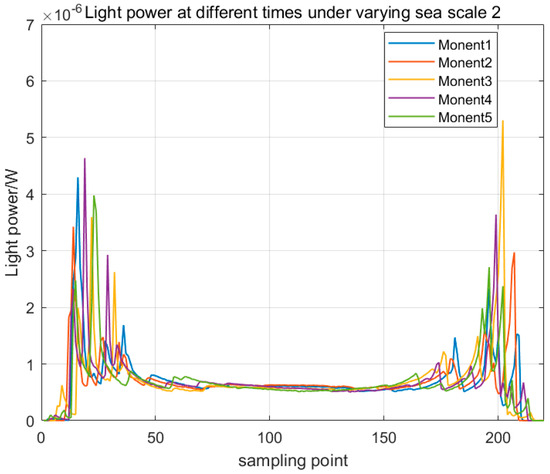
Figure 8.
Light power distribution diagram for sea scale 2.
4.2. Dynamic Simulations and Optimal Detector Placement Strategy
- Static simulation methods were employed for ray tracing to obtain dynamic optical power distributions by continuously varying the wave morphology according to the wave-evolution process.
- The optimal receiver position was determined by identifying the spatial maximum of the minimum received power across all the detector pixels. Specifically, for each detector pixel location, the minimum optical power (P_min) observed during the dynamic wave variations was recorded. All the P_min values were compared, and the position with the maximum P_min was selected. This location, which exhibited the most stable lower-bound power delivery, was designated as the single-receiver optimal position to maximize the worst-case transmission efficiency.
- The optimal N-receiver positions were determined by calculating the summed minimum power () for all the position combinations. The combination with the maximum was selected. This max-sum-min criterion was applied consistently for .
- The optical transmission efficiency under dynamic conditions can be obtained by deploying an optical receiver system at these optimal positions.
4.3. Simulation Results
4.3.1. Sea Scale 1
Based on the defined sea-scale characteristics, the developed simulation model generated the minimum received optical power distributions across six representative locations, as depicted in Figure 9.
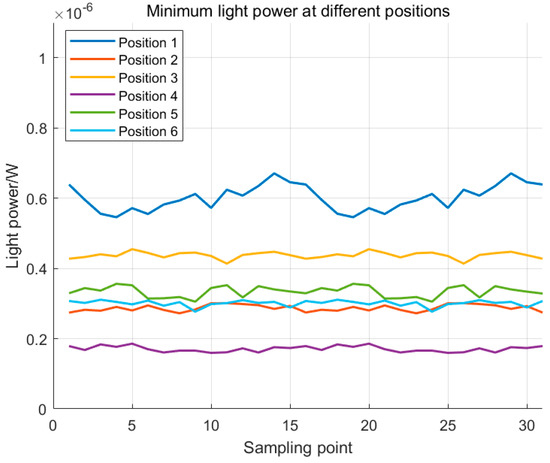
Figure 9.
Distribution curve of minimum light power at different positions for the sea scale 1.
From the results, Position 1 at (0°, ±5.61°), which corresponds to the spatial coordinates (±14.73, 132.99), was identified as the optimal single-receiver configuration. Figure 10 shows the received optical power distribution when the receiver was oriented at this elevation angle. Taking the laser emitter at the bottom of the wave model in Figure 4 as the origin, the position of the detector on the right represents the spatial coordinate reference. The Y-direction indicates the location of the detector pixels, and the Z-direction represents the distance between the detector and the laser emitter. The angular coordinate conversion is obtained by calculating the arctangent of the height in the Y-direction divided by 150 m.
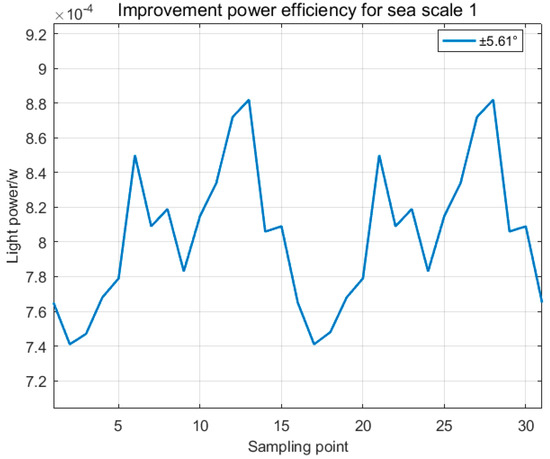
Figure 10.
Received light power at the (0°, ±5.61°) detector.
Single-receiver system: The detector recorded optical power levels ranging from 7.41 × 10⁻⁴ W to 8.82 × 10⁻⁴ W. Given the 1 W source power, the calculated transmission efficiency (received power/source power) ranged from 0.74% to 0.88%.
Multireceiver optimization: Dual-receiver configuration—optimal positions at (0°, ±5.61°) and (0°, ±5.68°); triple-receiver configuration—optimal positions at (0°, ±5.7°), (0°, ±5.65°), and (0°, ±5.63°).
The received optical power distributions for detectors 1, 2, and 3 are shown in Figure 11.
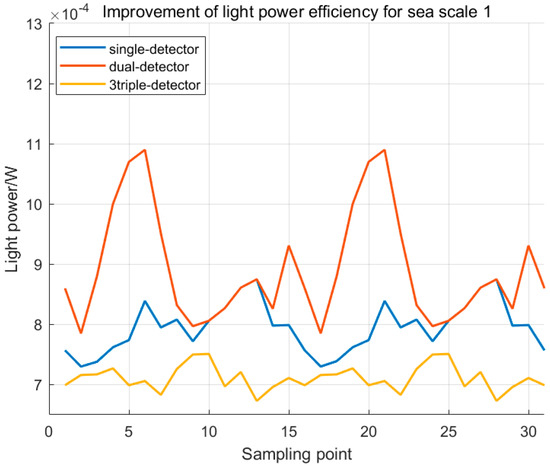
Figure 11.
Improvement of light power efficiency for sea scale 1.
Figure 11 shows that the dual-detector configuration achieves a peak transmission efficiency (range of 0.79–1.09%). The minimum efficiency in this configuration demonstrates a 1.06× improvement over that of a single-receiver system. The triple-detector configuration achieves peak transmission efficiency (range of 0.68–0.76%). The minimum efficiency demonstrated a 0.86× improvement over a single-receiver system. The detection performance of dual detectors is optimal. For Sea State 1, the detection performance of three detectors is significantly worse than that of two detectors and is even inferior to a single detector. This is primarily because wave fluctuations under Sea State 1 conditions are relatively mild, making a dual-detector configuration optimal for transmission communication.
4.3.2. Sea Scale 2
Sea Scale 2 conditions: Single-receiver optimization identified (0°, ±3.17°) as the optimal elevation angle that corresponded to spatial coordinates (±8.31, 139.07). The received optical power distribution in this orientation is shown in Figure 12.
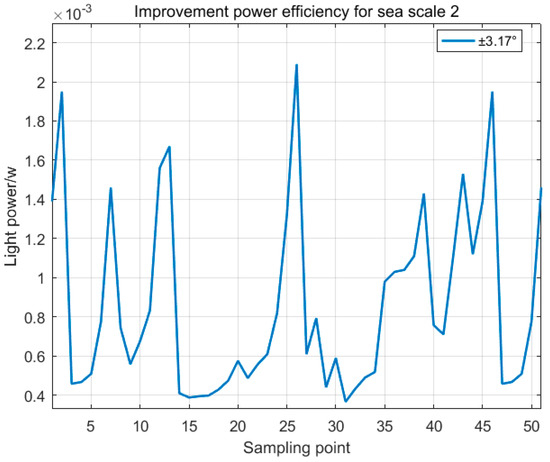
Figure 12.
Received light power at the (0°, ±3.17°) detector.
Single-receiver performance: Recorded optical powers: 0.37 × 10⁻³ W to 2.09 × 10⁻³ W. Calculated transmission efficiency range: 0.37–2.09%. Optimized multireceiver configurations: Dual-receiver system—optimal angles at (0°, ±3.1°) and (0°, ±2.98°). Triple-receiver system—optimal angles at (0°, ±3.03°), (0°, ±3.24°), and (0°, ±2.97°).
The optical power distribution profiles for the single-, two-, and three-receiver configurations are shown in Figure 13.
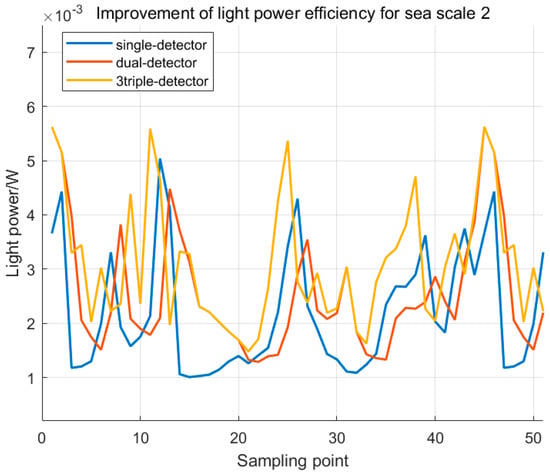
Figure 13.
Improvement of light power efficiency for sea scale 2.
Figure 13 shows that the dual-detector configuration achieves peak transmission efficiency (range of 0.50–1.97%). The minimum efficiency demonstrated a 1.36× improvement over a single-receiver system. The triple-detector configuration achieves peak transmission efficiency (range of 0.46–2.05%). The minimum efficiency demonstrated a 1.24× improvement over a single-receiver system. The detection performance of dual detectors is optimal.
5. Discussion
This study first established a refraction model for cross-water–air media for the sea scales at Levels 1 and 2 based on the Gerstner wave and interface refraction theories. The optical power distributions at different positions were simulated using the Monte Carlo method. The analysis showed that, for the sea scale at Level 1, the optimal position for a single detector was (0°, ±5.61°), while the optimal positions for two detectors were (0°, ±5.61°) and (0°, ±5.68°). For the sea scale at Level 2, the optimal position for a single detector was (0°, ±3.17°), while the optimal positions for two detectors were (0°, ±3.1°) and (0°, ±2.98°).
Further simulations were conducted to evaluate the optical transmission efficiency of the designed receiver optical system. The results indicate that the sea scale at Level 1, the optical transmission efficiency ranged from 0.74% to 0.88% and from 0.79% to 1.09% in the cases where one and two detectors were used, respectively, representing an improvement of approximately 1.06× compared with the single-receiver system. For the sea scale at Level 2, the optical transmission efficiency ranged from 0.37% to 2.09% and from 0.50% to 1.97% in the cases where one and two detectors were used, respectively, representing an improvement of approximately 1.36× compared with a single-receiver system. The deployment of a multi-aperture receiving system effectively enhances the optical transmission efficiency. The theoretical calculations and software simulations for the model of laser transmission across the sea–air medium are based on digital wave models derived from wave profile equations, which exhibit significant deviations from real-world conditions. Under higher sea conditions, the simplification of the Gerstner model leads to overly optimistic prediction results. It neglects energy dissipation, thereby overestimating the available energy; it adopts idealized regular waveforms, thereby overestimating the matching degree between the equipment and the waves and the average efficiency. Therefore, practical simulation and validation efforts must rely on large-scale optical field detection systems deployed on the sea surface.
Author Contributions
Conceptualization, Y.L. (Yingying Li) and Z.L.; methodology, Z.L.; software, Z.L.; validation, Y.L. (Yingying Li), Z.L. and S.Y.; formal analysis, Z.L.; investigation, Y.L. (Yingying Li); resources, Q.F.; data curation, Y.L. (Yingying Li) and Z.L.; writing—original draft preparation, Y.L. (Yingying Li); writing—review and editing, Y.L. (Yingying Li); visualization, Y.L. (Yingying Li) and Z.L.; supervision, Y.L. (Yingchao Li) and H.S.; project administration, Z.L. and C.W.; funding acquisition, Z.L. All authors have read and agreed to the published version of the manuscript.
Funding
National Natural Science Foundation of China (U22A2008).
Institutional Review Board Statement
Not applicable.
Informed Consent Statement
Not applicable.
Data Availability Statement
The original contributions presented in this study are included in the article. Further inquiries can be directed to the corresponding author.
Conflicts of Interest
The authors declare no conflicts of interest.
Abbreviations
The following abbreviations are used in this manuscript:
| BER | Bit error rate |
| FOV | Field of view |
References
- Alharbi, O.; Xia, W.; Wang, M.; Deng, P.; Kane, T. Measuring and modeling the air-sea interface and its impact on FSO systems. SPIE Opt. Eng. Appl. 2018, 10770, 1077002. [Google Scholar]
- Li, L.; Peng, Y.; Zongmin, C. Monte Carlo simulation of upward laser transmission across media. J. Xidian Univ. 2019, 46, 176–181. [Google Scholar]
- Deyan, Z. Research on Laser Transmission Characteristics Across Media. Master’s Thesis, Guilin University of Electronic Technology, Guilin, China, 2021. [Google Scholar]
- Qiaoyu, L. Research and Implementation of Highly Realistic Water Flow Effects. Master’s Thesis, Shandong University, Jinan, China, 2012. [Google Scholar]
- Yazhou, X.; Jie, L. Stokes model for wind-wave interactions. Adv. Water. Sci. 2009, 20, 281–286. [Google Scholar]
- Fournier, A.; Reeves, T.W. A simple model of ocean waves. Comput. Graph. Interact. Tech. 1986, 20, 75–84. [Google Scholar] [CrossRef]
- Sujun, L.; Bing, Y.; Lingda, W. Photorealistic ocean scene modeling and rendering based on the Gerstner-Rankine model. J. Eng. Graph. 2008, 29, 77–82. [Google Scholar]
- Lihong, S.; Faliang, A.; Ning, H. Analysis of laser transmission characteristics at the seawater interface. J. Guilin Univ. Electron. Technol. 2006, 26, 430–433. [Google Scholar]
- Estes, L.E.; Fain, G.; Harris, J.D. Laser beam propagation through the ocean’s surface. In Proceedings of the OCEANS 96 MTS/IEEE Conference Proceedings. The Coastal Ocean—Prospects for the 21st Century, Fort Lauderdale, FL, USA, 23–26 September 1996; IEEE: New York, NY, USA, 1996; pp. 87–94. [Google Scholar]
- Jian, K. Research on Visible Light Transmission Characteristics of LED in Seawater-Air Cross-Medium Environment. Ph.D. Thesis, Xi’an University of Technology, Xi’an, China, 2023. [Google Scholar]
- Aiping, H.; Yingluo, Z.; Linwei, T. Characteristics of underwater laser communication channel based on Monte Carlo simulation. Infrared Laser Eng. 2017, 46, 226–231. [Google Scholar]
- Berrocal, E.; Sedarsky, D.; Paciaroni, M.; Meglinski, I.; Linne, M. Laser light scattering in turbid media Part I: Experimental and simulated results for the spatial intensity dis-tribution. Opt. Express 2007, 15, 10649–10665. [Google Scholar] [CrossRef] [PubMed]
- Wang, L.; Jacques, S. MCML—Monte Carlo modeling of light transport in multi-layered tissues. Comput. Programs Methods Biomed. 1995, 47, 131. [Google Scholar] [CrossRef] [PubMed]
- Meglinski, I.V. Quantitative assessment of skin layers absorption and skin re-flectance spectra simulation in the visible and near-infrared spectral regions. Physiol. Meas. 2002, 23, 741. [Google Scholar] [CrossRef] [PubMed]
- Ramachandran, H. Imaging through turbid media. Curr. Sci. 1999, 76, 1334. [Google Scholar]
- Vali, Z.; Gholami, A.; Ghassemlooy, Z.; Michelson, D.G.; Omoomi, M.; Noori, H. Modeling turbulence in underwater wireless optical communications based on Monte Carlo simulation. J. Opt. Soc. Am. A Opt. Image Sci. Vis. 2017, 34, 1187–1193. [Google Scholar] [CrossRef] [PubMed]
- Charles, W. Simulation, Modeling, and Design of Underwater Optical Communication Systems. Master’s Thesis, Raleigh, North Carolina State University, Raleigh, NC, USA, 2012. [Google Scholar]
- Galaktionov, I.V.; Kudryashov, A.V.; Sheldakova, Y.V.; Byalko, A.A.; Borsoni, G. Measurement and correction of the wavefront of the laser light in a turbid medium. Quantum Electron. 2017, 47, 32–37. [Google Scholar] [CrossRef]
- Galaktionov, I.; Kudryashov, A.; Sheldakova, J.; Nikitin, A.; Samarkin, V. Laser beam focusing through the scattering medium by means of adaptive optics. In Proceedings of the SPIE BIOS, San Francisco, CA, USA, 28 January–2 February 2017. [Google Scholar]
- Galaktionov, I.; Nikitin, A.; Sheldakova, J.; Toporovsky, V.; Kudryashov, A. Focusing of a Laser Beam Passed through a Moderately Scattering Medium Using Phase-Only Spatial Light Modulator. Photonics 2022, 9, 296. [Google Scholar] [CrossRef]
- Cox, C.; Munk, W. Measurement of the roughness of the sea surface from photographs of the sun’s glitter. J. Opt. Soc. Am. 1954, 44, 838–850. [Google Scholar] [CrossRef]
- Min, L.; Xiguo, L.; Jingyan, M.; XiaoJun, W. Analysis of optical power attenuation model in wireless optical communication. Infrared Laser Eng. 2012, 41, 2136–2141. [Google Scholar]
- Goda, Y. Random Seas and Design of Maritime Structures; World Scientific Publishing Company: Singapore, 2010; Volume 33. [Google Scholar]
Disclaimer/Publisher’s Note: The statements, opinions and data contained in all publications are solely those of the individual author(s) and contributor(s) and not of MDPI and/or the editor(s). MDPI and/or the editor(s) disclaim responsibility for any injury to people or property resulting from any ideas, methods, instructions or products referred to in the content. |
© 2025 by the authors. Licensee MDPI, Basel, Switzerland. This article is an open access article distributed under the terms and conditions of the Creative Commons Attribution (CC BY) license (https://creativecommons.org/licenses/by/4.0/).