Article

Frequency Response Analysis of FAU, LTA and MFI Zeolites Using UV-Vis and Electrochemical Impedance Spectroscopy

by
Fabian N. Murrieta-Rico
1,*,
Joel Antúnez-García
2,
Rosario I. Yocupicio-Gaxiola
3,
Armando Reyes Serrato
2,
Vitalii Petranovskii
2,
Mufei Xiao
2,
Oleg Sergiyenko
4,
Wendy Flores-Fuentes
5 and
Julio C. Rodríguez-Quiñonez
5
1
Ingeniería Mecatrónica, Universidad Politécnica de Baja California, Mexicali 21376, B.C., Mexico
2
Centro de Nanociencias y Nanotecnología, Universidad Nacional Autónoma de México, Ensenada 22800, B.C., Mexico
3
Tecnológico Nacional de México/Instituto Tecnológico Superior de Guasave, Carretera a Brecha Sin Número, Ejido Burrioncito, Guasave 81149, SIN., Mexico
4
Instituto de Ingeniería, Universidad Autónoma de Baja California, Mexicali 21376, B.C., Mexico
5
Facultad de Ingeniería, Universidad Autónoma de Baja California, Mexicali 21376, B.C., Mexico
*
Author to whom correspondence should be addressed.
Optics 2023, 4(3), 459-472; https://doi.org/10.3390/opt4030033
Submission received: 19 May 2023 / Revised: 21 July 2023 / Accepted: 25 July 2023 / Published: 28 July 2023
(This article belongs to the Section Engineering Optics)

Abstract

:
Zeolites are porous materials that have cavities interconnected by channels. These crystalline materials are composed of Si-O tetrahedral structures, and according to the assembly of such tetrahedral structures, specific crystalline structures are obtained. Until now, it has been said that there are more than 245 different zeolitic frameworks, and since each one has a specific distribution of pores and cavities, each kind of zeolite has a specific area-to-volume ratio. As a result of the type of zeolite structure, the zeolite can exhibit specific properties, i.e., electrical or optical. Moreover, the physical properties of zeolites can be modified after the inclusion of another chemical species in their structure or in their voids, which can result in tuning a zeolite for specific applications. In this work, synthetic zeolites of types LTA, FAU and MFI are characterized by a number of methods. In particular, the data from UV-Vis spectroscopy are analyzed, and the effect of crystalline structure on properties such as optical bandgap, refractive index, absorption coefficient, incident photon frequency, and extinction coefficient is studied.

1. Introduction

Optical properties of materials allow one to understand where they can be applied and, at the same time, how these materials can be tuned, with the objective of matching specific requirements. In particular, the optical properties of a material define how the material interacts with light. Different types of analysis based on light can be used for studying the properties of a material, for example, IR and UV-Vis spectroscopies. In modern materials science, the use of UV-Vis spectroscopy allows one to obtain information regarding the chemical composition of an analyte. Among the uses of this technique is the determination of the band-gap of a sample, absorption coefficient, optical conductivity, and dielectric constant.
The use of UV-Vis spectroscopy allows one to study the presence of chemical species in zeolites. In particular, after preparing mononuclear titanium oxide species in faujasites with a variation of Si/Al ration, the use of UV-Vis diffuse reflectance spectra, Raman spectroscopy, and XRD showed the presence of three different species of titanium oxide [1]. Hamidouche et al. [2] synthesized a composite material based on zeolite HY/polypyrrole; in particular, the zeolite HY is obtained after a process of ammonium ion exchange in NaY zeolite [3]. The material was studied using UV-Vis spectroscopy, and it was determined that the band-gap energy of the composite was lower than the values of its precursor components.
Although UV-Vis spectroscopy is an experimental technique that requires the physical analysis of the sample, in the last years and with the advance of computational technology, theoretical advancements have made the study of theoretically generated UV-Vis spectra available. For instance, Fois et al. [4] studied the red shift that is attributed to the ligand-to-metal-charge-transfer electronic transitions detected by UV-Vis studies, after the use of density functional theory (DFT), where the periodicity of crystalline phase is considered.
While there are reports of studies related either to optical or to electrical properties of zeolites, a clear link between the phenomena associated during the analysis is not presented. In particular, relative permittivity is frequency dependent and at low frequencies, it is obtained from electrical measurements, while optical measurements yield relative permittivity at high frequencies. For this reason, calculating the relative permittivity in a wide frequency range allows one to understand the physical properties of a material under analysis. Hence, it is known that the permittivity of a material is related to the dielectric absorptivity, and it is a complex parameter. In the case of the real part of permittivity, it describes the field-induced charge separation, while the imaginary part defines the absorbed energy that is converted into heat [5]. There are diverse applications where the relative permittivity of a material is of interest. For example, the absorption of electromagnetic energy can be adjusted through the permittivity and permeability of a material [6]. The relative permittivity of zeolites allows one to use them as sensors. This is possible because if the zeolite is used as a “dielectric”, there is a change of its relative permittivity when there is the presence of gases [7,8]. It is also known that the conductivity and dielectric permittivity are used in the study of catalytic activity [9].
Even though the importance of studying optical and electrical properties of materials is undeniable, the literature is scarce when dealing with frequency analysis in the electrical and optical spectrum. One example of this kind of study is reported by Saad et al. [10]. In the case of zeolites, to our knowledge, there is no similar study regarding zeolites.
In this work, the optical and electrical properties of synthetic zeolites with codes—provided by the International Zeolite Association (IZA) [11]—LTA, FAU and MFI are studied. This is after the study of optical data generated from UV-Vis spectroscopy and the frequency response analysis using electrochemical impedance spectroscopy. Finally, the results of data analysis are compared, and the relationship between electrical and optical processes is presented.

2. Materials and Methods

Preparation of Samples

Like the method described in [12], for the synthesis of zeolite X in accordance with the IZA recipe [5], the synthesis is carried out by mixing two preprepared solutions. To make the first solution, 50 g of deionized water (conductivity ≤4.3 μS/cm) and 50 g of sodium hydroxide (Sigma Aldrich, reagent grade ≥98%) were mixed and dissolved using a magnetic stirrer. During agitation, the temperature of the mixture was set to 303 K with the aim of promoting the integration of NaOH in the water. Then, 48.75 g of alumina trihydrate (Sigma Aldrich, reagent grade, 50.0–57.5% Al) was added, the mixture was stirred again at 100 °C until completely dissolved, and cooled to 25 °C. Next, it was mixed with 101.25 g of water. Then, 50 g of this solution was mixed with 306 g of water and 26.56 g of sodium hydroxide and homogenized with a magnetic stirrer. Thus, stock precursor solution Ax was obtained.
Stock precursor solution Bx was prepared by mixing 109.85 g of sodium silicate solution (Sigma Aldrich, reagent grade, 12.0–13.0% Si basis, 13.4–14.4% NaOH), 306 g of water, and 29.56 g of sodium hydroxide until the mixture was completely dissolved. The mixture was then divided into two equal volumes, one corresponding to solution Bx for synthesis according to the IZA method. Then, equal volumes of solutions, Ax and Bx, were mixed at room temperature and magnetically stirred until homogenized. The mixture was transferred to 500 mL polypropylene bottles and placed inside an oven at 90° C for 12 h. Thereafter, the solids were filtered and washed at the filter with 2 L of deionized water. Finally, the resulting crystals were dried in an oven at 100 °C for 24 h.
In the case of zeolite A, the method described in [12] was followed. According to the IZA recipe [11], deionized water, sodium hydroxide, sodium aluminate, and sodium metasilicate were used as starting materials; 80 mL of water and 0.723 g of sodium hydroxide were mixed until NaOH was completely dissolved. The mixture was divided into two equal volumes, which were stored in polypropylene bottles and labeled as “mixture Aa”. Half of mixture Aa was then mixed with 8.259 g of sodium aluminate; the mixture was stirred in the capped bottle until homogeneity was reached and labeled as “mixture Ba”. The other half of mixture Aa was mixed with 15.48 g of sodium metasilicate; the mixture was stirred until it reached homogeneity and labeled as “mixture Ca”. The two mixtures, Ba and Ca, were combined, and a thick gel formed. This gel was stirred until a complete homogenization was observed and stored in a polypropylene bottle. For the crystallization process, the homogenized gel was placed inside an oven for 4 h at 372 K, after which the product was withdrawn from the oven and cooled until room temperature was achieved. Then, the contents of the vessel were mixed with 1 L of water, and this mixture was stirred for 30 min and then filtered; the resulting powder was recovered after drying the filter in an oven for 3 h at 372 K, and each powder was dried for 3 h at the same temperature.
The zeolite MFI with a nominal SiO2/Al2O3 mole ratio of 50 in ammonium cation form (product CBV 5524G) was purchased from Zeolyst International (Kansas City, MO, USA).

3. Scanning Electron Microscopy and X-ray Diffraction Analysis

The micrographs of each zeolite were obtained after the use of scanning electron microscopy (SEM) on a JEOL JIB-4500 (Peabody, MA, USA) microscope equipped with an EDS detector. Characteristic micrographs are presented in Figure 1. As is observed, the zeolites MFI and FAU show quite small particles in comparison to LTA crystals. However, energy dispersive spectrometry (EDS) allows for study of chemical elements present in each sample; in Figure 2, the normalized data of EDS spectra are presented.
From Figure 2, it can be noted that all the samples have the characteristic elements expected on these zeolites, namely, oxygen, sodium, aluminum, and silicon. Moreover, the relative amount of each element can be correlated. As expected for zeolite, LTA and FAU, with a theoretical Si/Al ratio of 1 and 1.2, respectively [11], both of them exhibit a similar amount of Si and Al atoms. In the case of zeolite MFI, the theoretical Si/Al ratio is 13.28, which is similar to that presented in experimental data.
In order to study the crystalline characteristics of samples, all powders were studied using X-ray diffraction (XRD) by using Aeris Panalytical (Malvern, UK) equipment with Cu K alpha monochromatic radiation (l = 0.154056 nm, 40 kV, 15 mA). The results are presented in Figure 3. Theoretical diffractograms were retrieved from IZA (International Zeolite Association) [11], and they are identified with -r (FAU-r, LTA-r, MFI-r) as reference. For comparison purposes, the intensity of all diffractograms was normalized. When the experimental and theoretical data are compared, it can be noted in each case how the position of theoretical peaks coincides with those of peaks from experimental data.
In particular, for FAU-r and FAU, the relative intensity shows variations, and also, there is a displacement in 2 θ , which indicates a variation in the call parameter. In the case of LTA-r and LTA, there are no observable variations in the angular position of peaks. Finally, for zeolite MFI, when comparing theoretical (MFI-r) and experimental (MFI) data, the peaks are located at almost the sample angles, but also, in the case of experimental data, the narrowest peaks are masked. From the SEM, EDS and XRD data, it is confirmed that the characteristics of the materials correspond to the target zeolites. Furthermore, from the Scherrer Equation, the average crystallite sizes are calculated as 19, 58 and 8 nm for MFI, LTA and FAU zeolites, respectively. Based on the micrographs in Figure 1, the particle size of MFI and FAU zeolites is smaller than LTA crystals. This is confirmed by the average particle size calculated from XRD, and it was found that the average particle size of FAU is smaller than MFI zeolites.

4. UV-Vis Analysis

UV-Vis spectroscopy data were obtained through the use of a UV-Vis NIR Cary 5000 (Santa Clarita, CA, USA) spectrophotometer. From the UV-Vis data, plenty of information can be obtained. In this regard, relative permittivity real part ε r is given by
ε r = n 2 k 2 ,  
and the imaginary part ε i can be calculated from
ε i = 2 n k ,  
where n and k are the refractive index and extinction coefficient, respectively.
Considering the percent transmittance T s and the absorbance A in arbitrary units (a.u.),
T s = 100 · 10 A .  
Then
n = 1 T s + 1 T s 1 ,
and from the wavelength λ and absorption coefficient α can be calculated from the thickness of the film in cm as α = 2.303 A · l 1 . As a result, the extinction coefficient k is given by
k = α λ 4 π .  
Given the speed of light as c = 299,792,458 m/s, the optical conductivity is given by
σ o p t = α n c 4 · π .
In addition to these parameters, the band-gap can be estimated from the UV-Vis data. In this case, the Tauc model, which is a general formula for absorption in material [13], can be used
α h v 1 / n = A h v E g .
From direct measurements, the UV-Vis absorption spectra were obtained. As is presented in Figure 2, zeolites FAU and LTA have a similar Si/Al ratio, which leads to a similar presence of Al2O3. This can be observed in the evident similarity of their UV-Vis absorption spectra (Figure 4a). In the case of MFI zeolite, there is a greater Si/Al ratio than in FAU and LTA zeolites [14,15], which is observed in Figure 1 and in the absorbance (Figure 4a). In addition, the data of Figure 4a can be evaluated through CIE lab space [16].
Color spaces are widely recognized as a means of describing colors, including absorbance, through descriptors such as numerical values. In this context, the CIE Lab color space is particularly employed due to its ability to establish a correlation between numeric values and human visual perception. In this sense, L, A and B refer to luminosity, red/green coordinates, and yellow/blue coordinates, respectively.
As shown in Figure 4b, according to the absorption presented by each zeolite, a color is assigned in the CIE lab space. As a result, we can compare the colors associated with each zeolite. As can be observed, the greatest variation exists when the color of LTA is compared with FAU, and also FAU and MFI are closer among them.
As stated before, from the UV-Vis absorption spectra, a plethora of parameters can be obtained. In the case of the band-gap, after the use of Equation (7) and considering n = 2 for direct allowed transitions (direct band-gap), the Tauc plot for each zeolite was obtained (Figure 5). As is observed, zeolites FAU and LTA have a close band gap among them, but the MFI zeolite exhibits the widest forbidden band energy. This can be attributed to the chemical composition of zeolites. This includes the location of Al, Na atoms in the zeolitic matrix [17,18,19], as well as the inclusion of novel chemical species into the crystalline array [14,20].
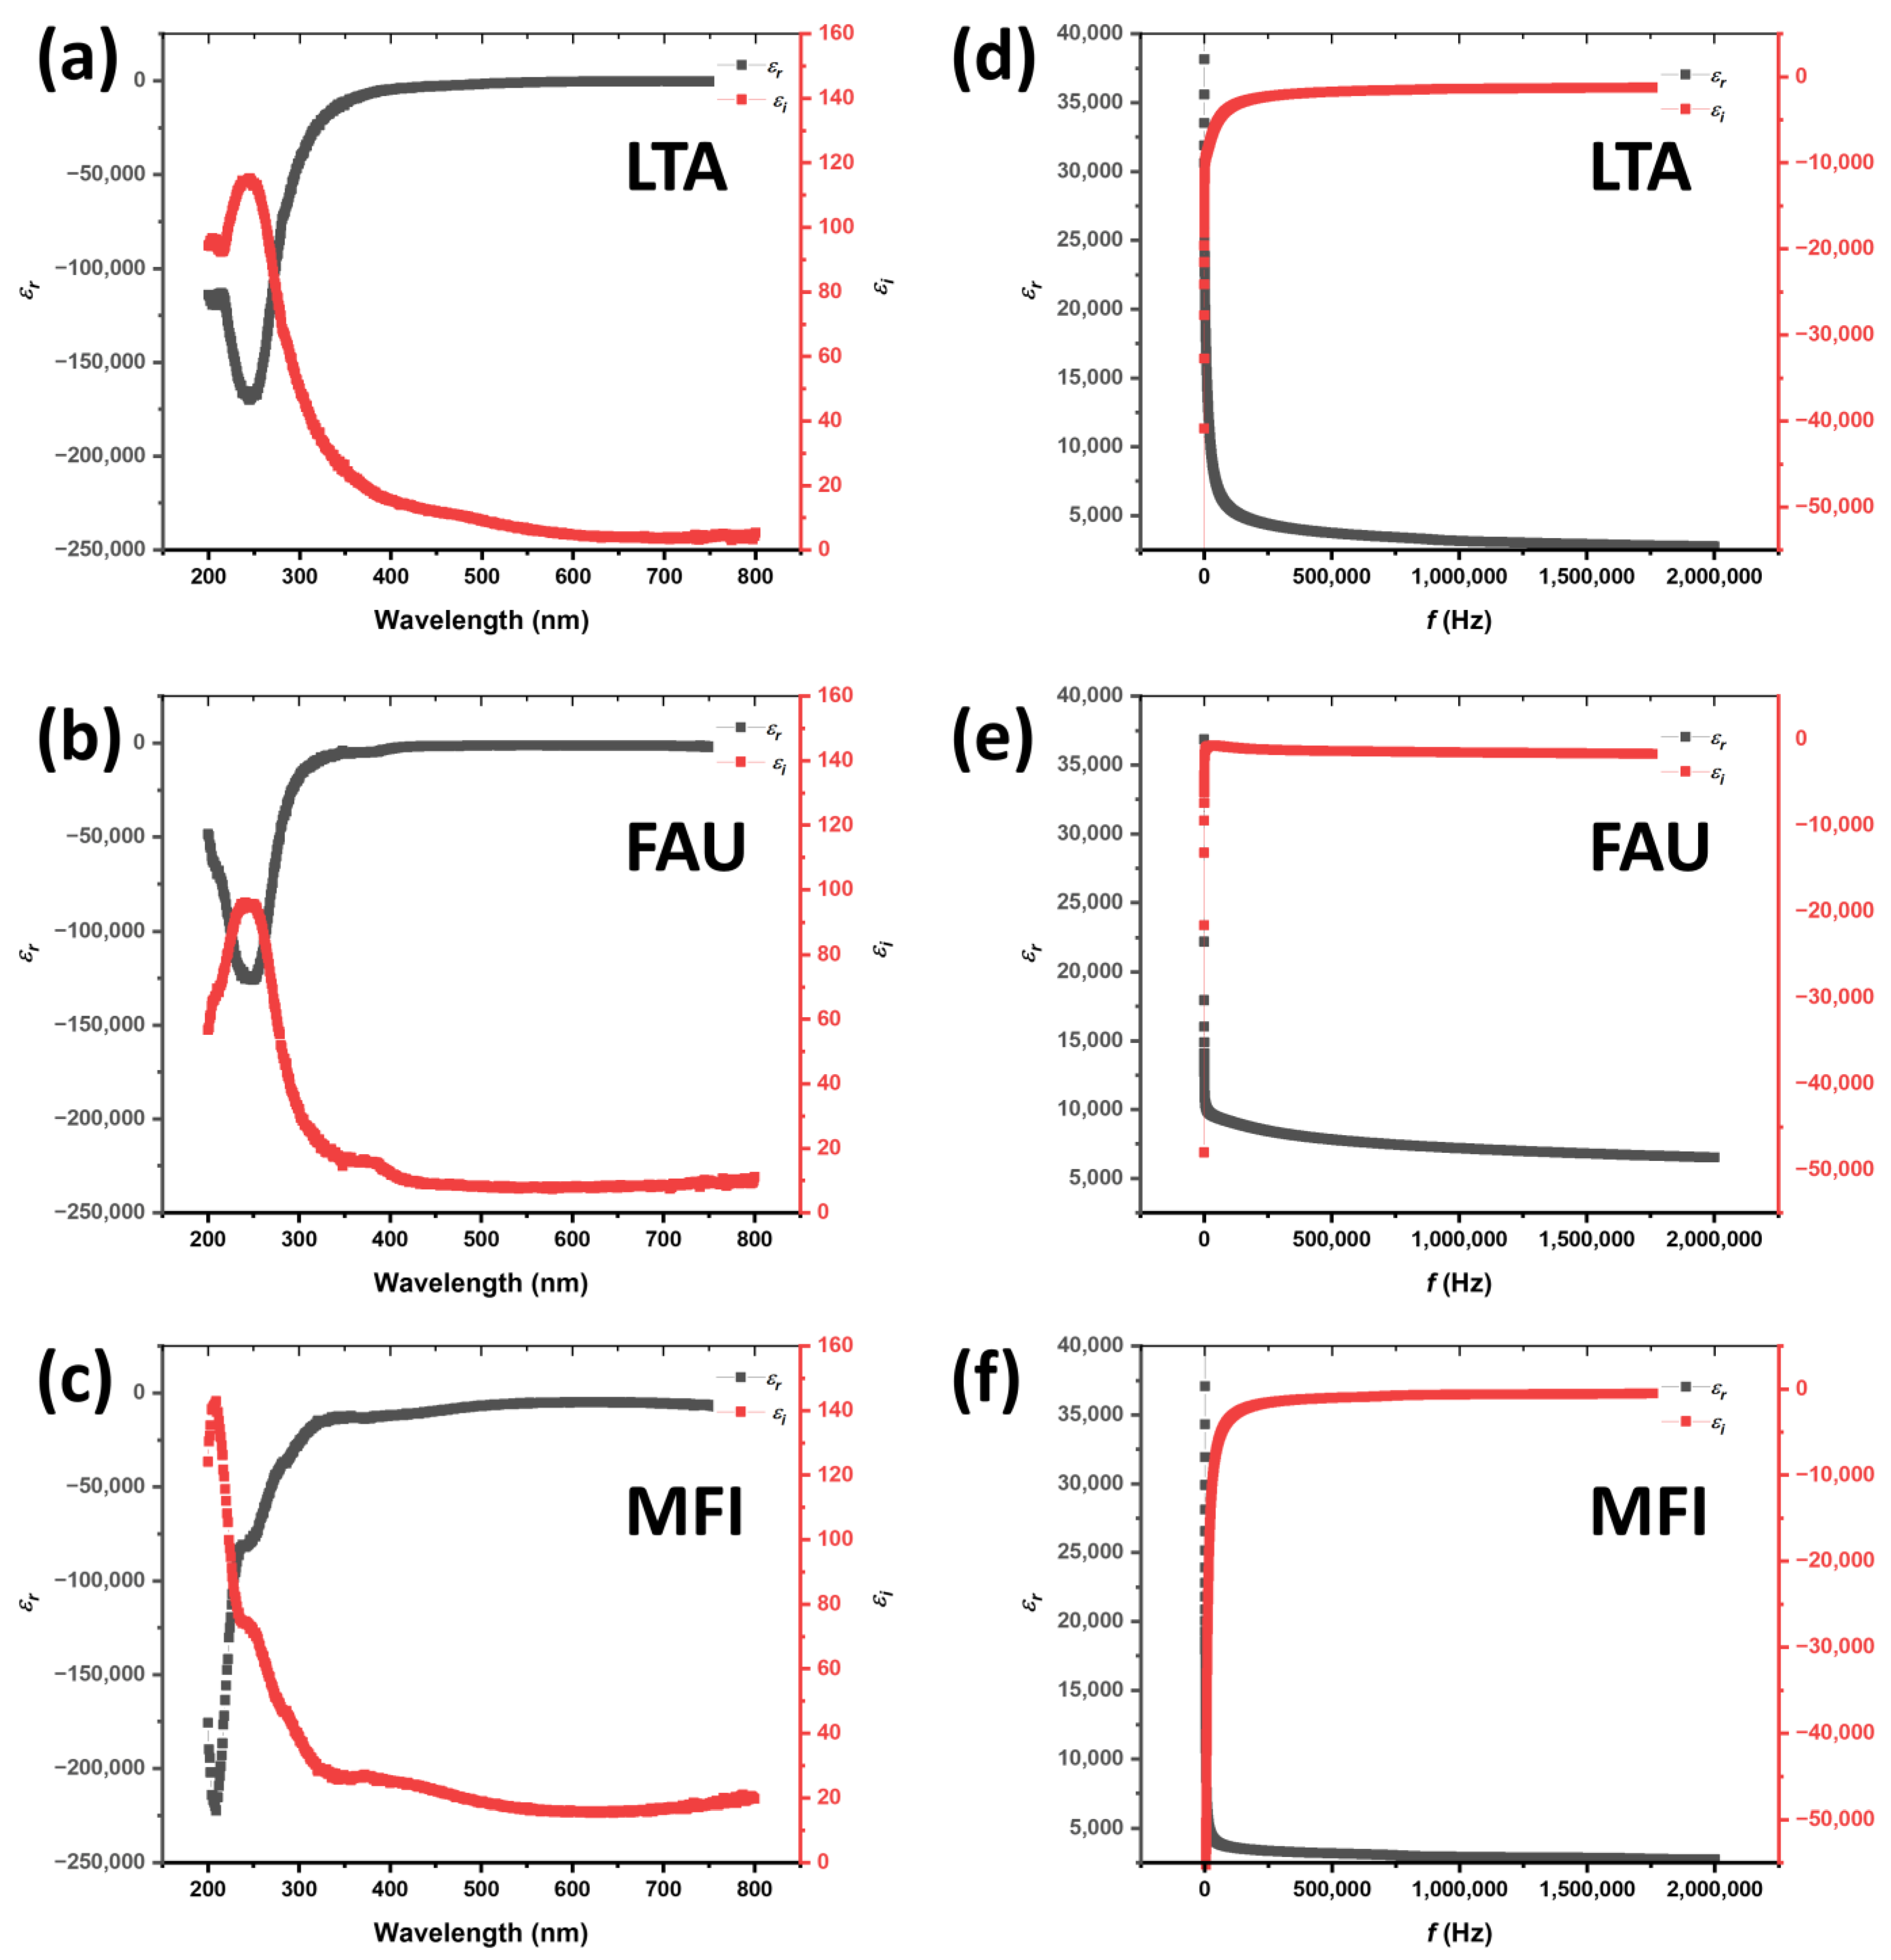
In addition, after the use of Equations (1) and (2), the optical relative permittivity can be calculated. These results are presented in Figure 6a–c. As discussed by Sebastian et al. [21], the relative permittivity of a material shows its energy storing capacity when a potential is applied across it. It is related to the macroscopic properties, such as polarization or capacitance.
In this sense, each material presented in Figure 6 exhibits a particular behavior of its complex relative permittivity, which is defined by the nature of the sample and also by the frequency range where the analysis has been carried out. At has been discussed elsewhere [22], the UV-Vis range shows us the electronic processes that are taking place in the sample under study. Hence, the behavior of real and imaginary parts of relative permittivity follows the expected behavior, which is that, after an increase in frequency, there is an increment of the real part, and there is a decrement of the imaginary part.
In the case of the optical conductivity, it can be calculated after Equation (6). This leads to a plot (Figure 7) similar to Figure 4a, but in this case, we have the magnitude corresponding to the conductivity in S/m. Since the optical conductivity shows the relationship between the magnitude of the induced electric field for arbitrary frequencies and the induced current density in the material, it is clear from Figure 4 that the MFI zeolite has the greatest optical conductivity at the highest frequencies or wavelengths. In contrast, between 200 and 300 nm, the LTA zeolite is the best conductor.
Since the data from UV-Vis allows us to calculate the real and imaginary parts of relative permittivity, we can say that this process works as a “sort” of optical impedance, where the dissipation factor can be calculated as a function of frequency. Therefore, the relative optical permittivity demonstrated in Figure 6a–c can be effectively utilized with data obtained from electrochemical impedance spectroscopy. This combined approach enables a deeper comprehension of the dielectric processes occurring within zeolites.

5. Electrochemical Impedance Spectroscopy

For this study, the methodology described was used. Each sample was ground and compressed into a pellet with a diameter of 1 cm and a thickness of 1 mm; the pellet was then placed between two polished copper electrodes, which were connected to an E4980A Precision LCR Meter. As a result, for each sample, a data set was obtained corresponding to the magnitude of the total impedance | Z T | in ohms, phase angle θ in arc degrees, and frequency of interrogation signal in hertz.
As is well known, the complex impedance is given in terms of the real Z and imaginary part Z of Z T ,
Z T = Z + j Z ,  
and the phase angle is given by
θ = arctan Z Z .  
The electrical conductivity σ T of the sample is given in terms of AC conductivity σ a c and DC conductivity σ d c ,
σ T = σ a c + σ d c .  
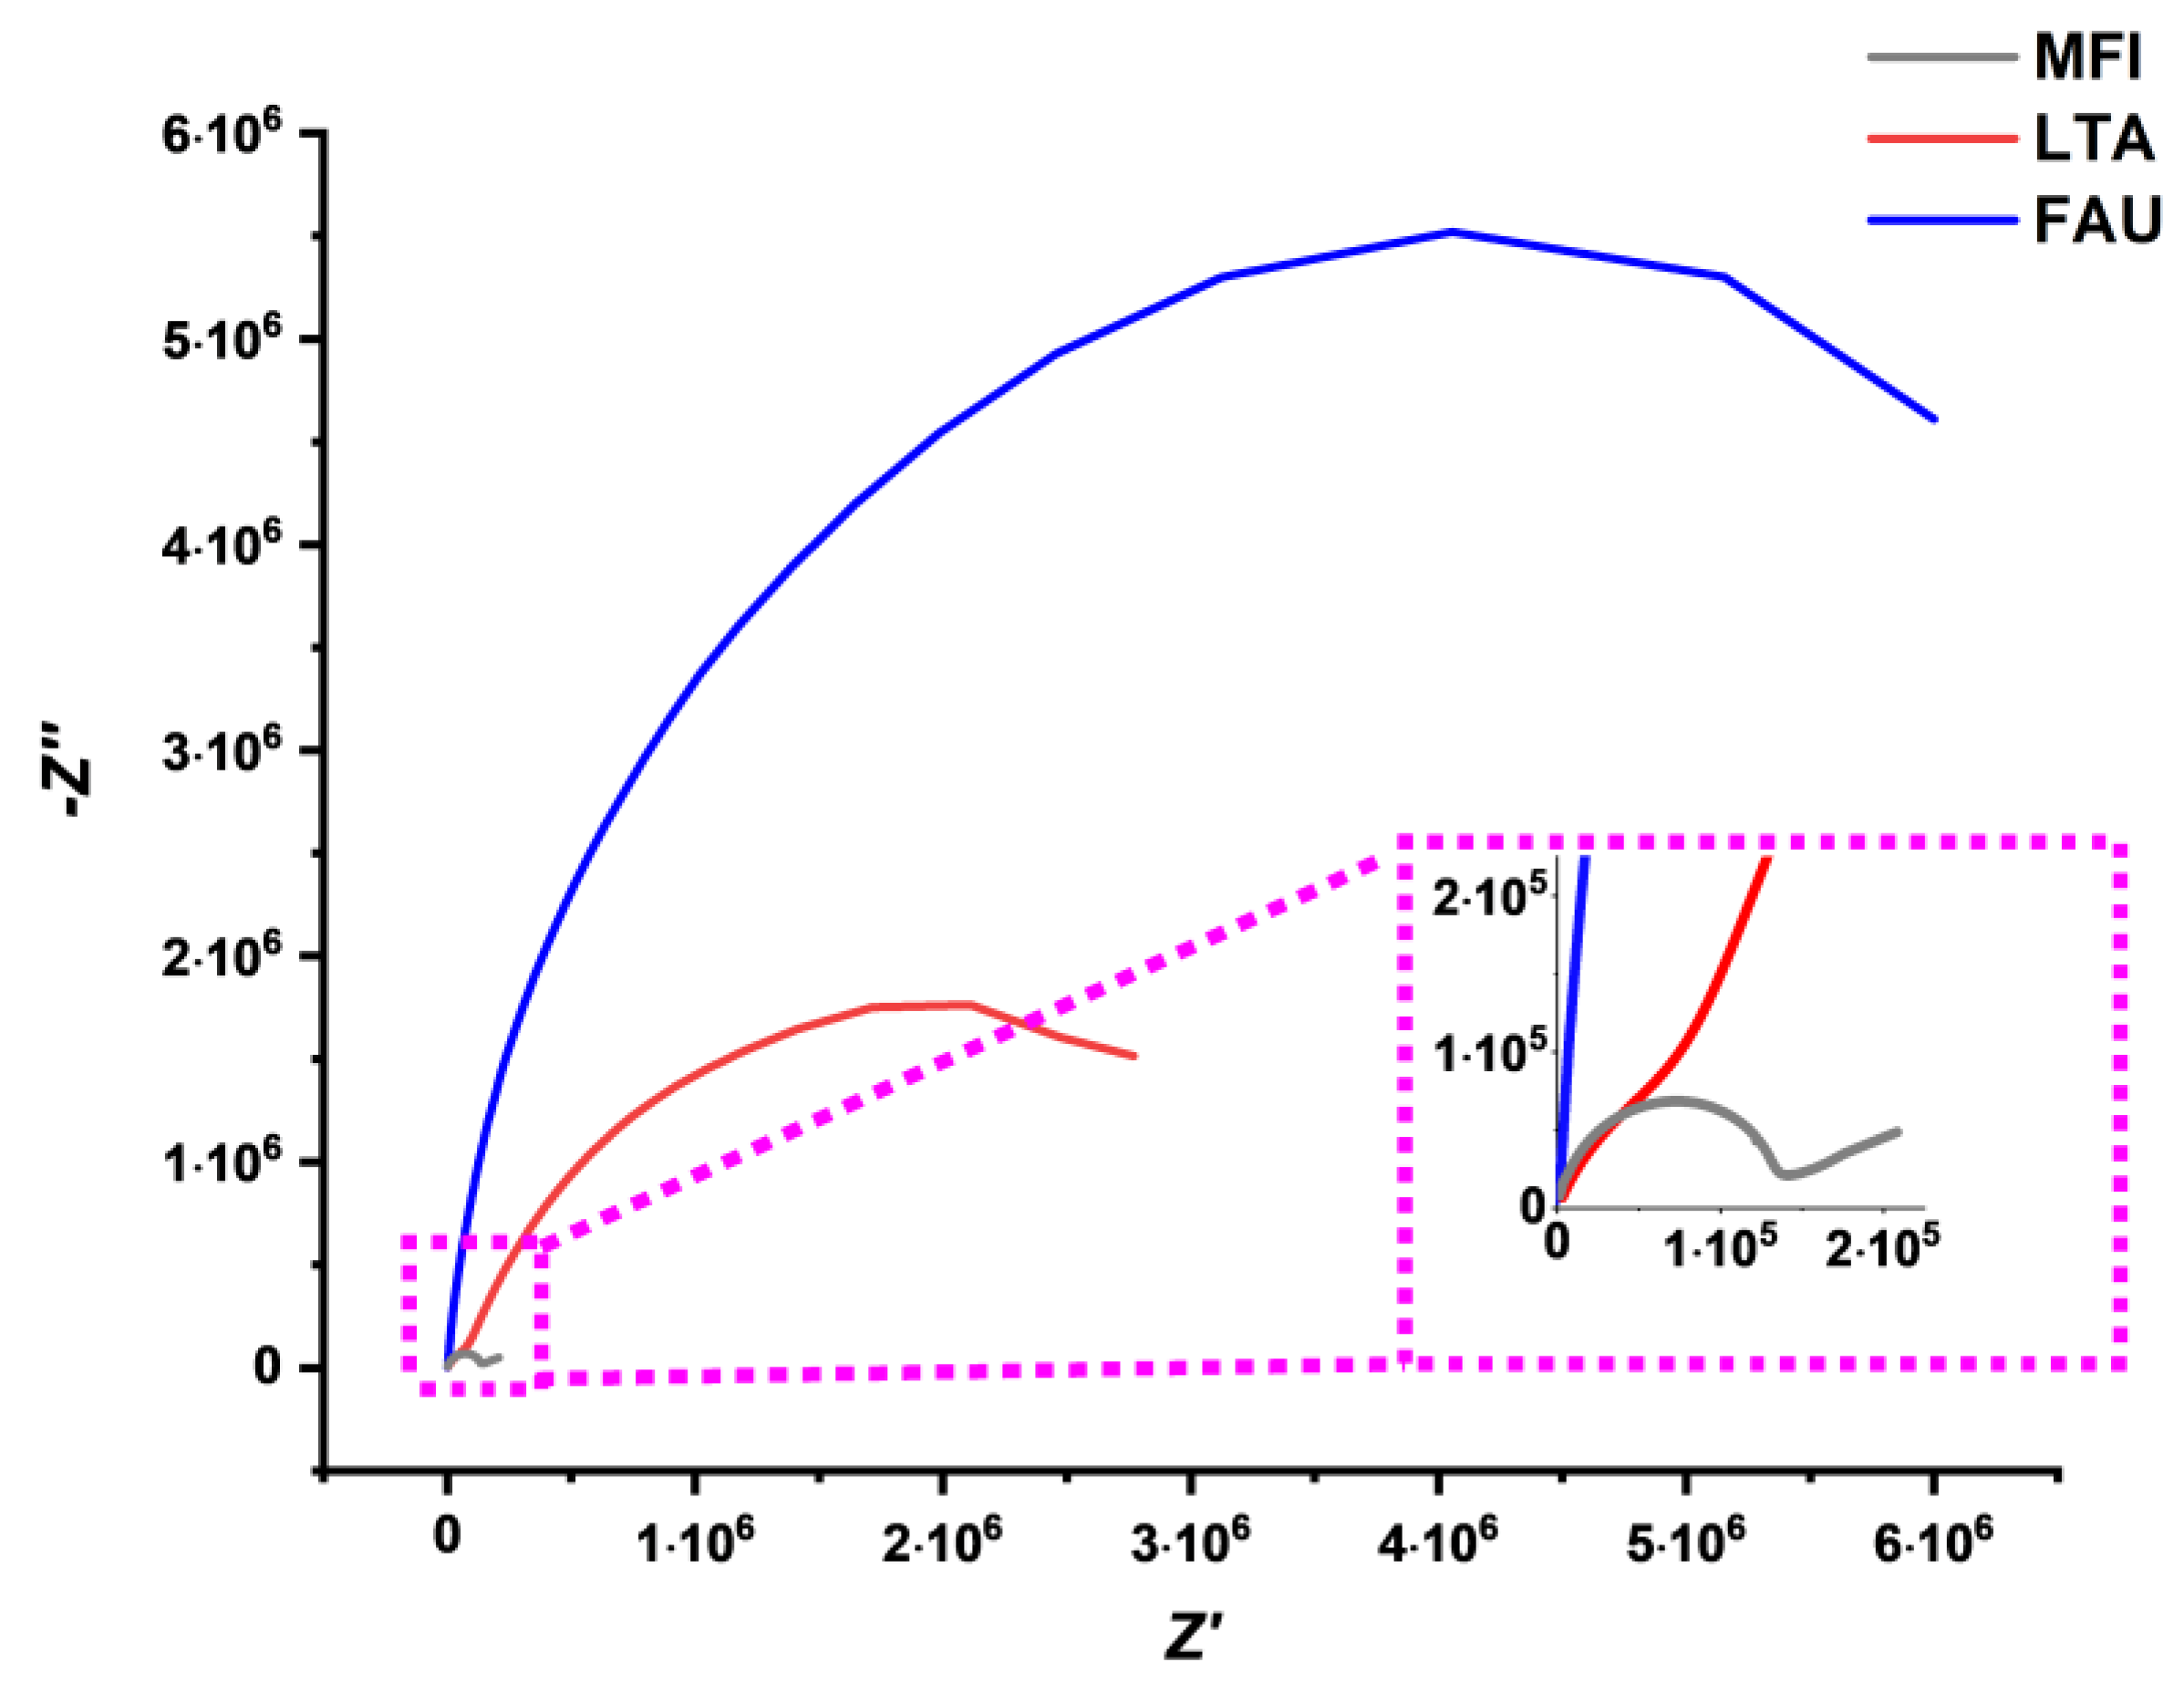
From the data obtained during the frequency interrogation process and using Equations (8) and (9), the real and imaginary parts of impedance were calculated. The results are presented in Figure 1. As can be noted, all zeolites have a Nyquist plot that shows an “arc”-like behavior. This can be attributed to electric interactions inside the zeolitic matrix and how the ionic conductivity is taking place. A greater magnitude of Z is caused by an increase in the energy storage processes of the material, which is caused by the morphology of the crystals. In this sense, it is clear that all zeolites exhibit variations in the electrical processes that are taking place. Although there is no linear relationship between Z and Z , there are zones where such behavior could be apparent, for example, the inset in Figure 8. In the case of Z being equal to Z , this indicates that a purely reactive impedance exists. This means that the reactive and resistive components of impedance have the same component, but they are out of phase by 90°. As a consequence, the impedance has, in its parts, equal amounts of resistance and reactance, and impedance is frequency dependent, which occurs at specific frequency values. Therefore, if Z = | Z | , this suggests that the electrical model is neither purely resistive nor purely reactive but lies somewhere in between. This depends on the values and types of electrical elements in the electrical model.
After examining the data in Figure 8, two electrical models can be used to describe the observed behavior. FAU and MFI zeolites exhibit an electrical response corresponding to a circuit of the form R s + ( R p | | C P E ) , and in the case of LTA, there is a circuit of the form ( R 1 | C P E 1 + ( R 2 | | C P E 2 ) . These circuits are presented in Figure 9. After using ZView software, the parameters of the elements in the proposed circuits are fitted. These values are presented in Table 1 and Table 2.
As described elsewhere [23,24], the grain boundary and the particle size define how the conductivity takes place in ionic conductors. In this sense, the synergic effects of these characteristics define the system dynamics and, as a consequence, the electrical model that describes such a system. As is shown by the XRD data, the average particle size of MFI is almost twice that FAU. This allows us to understand why the R s value of MFI is almost twice that presented by FAU zeolite, and this parameter can be proposed as the electrical effects between grains. At the same time, since they have a different morphology and chemical composition, the C P E and R p parameters follow a non-linear variation. Since the C P E p parameter approaches 1, we conclude that reactance takes place due to capacitive effects [25], and while the capacitance C P E T of MFI and CPE is almost the same, the R p value in FAU is almost two orders of magnitude above MFI. In the case of LTA zeolite, there are two branches that contribute to the observed impedance, each one with reactive effects. Like in the data of Table 1, C P E 1 T and C P E 2 T approaches 1, which shows that reactive effects are due to a capacitive behavior. In addition, branch 1 models the interparticle effects, while branch 2 models the effects that take place inside the particles.
The total conductivity for all samples is presented in Figure 10. Three characteristic zones are found. The first one corresponds to DC conductivity, the second one is the transition from DC to AC conductivity, and finally the third zone corresponds to AC conductivity.
As observed, the conductivity is almost constant at low frequencies, which coincides with the Nyquist plot. In the case of high frequencies, the conductivity has a greater slope than the DC conductivity. The transition zone defines what kind of conductivity is taking place, and as has been shown elsewhere, after the use of Jonscher power law, it is found that we are dealing with ionic conductors. This is characteristic of these materials examined within the frequency range presented in Figure 10.
From electrical impedance data, the electrical complex relative permittivity can be obtained [26]. With the aim of comparing the electrical data with the optical data, the relative electrical permittivity is presented in Figure 6d–f. As is observed, for each case, both real and imaginary parts have almost constant values. This is expected for ionic conductors that are interrogated with frequencies below microwaves. In general terms, the electric permittivity decreases as the frequency increases; this fact can be appreciated if the optical relative permittivity is observed after the electrical relative permittivity.

6. Conclusions

In this work, the optical and electrical properties of LTA, FAU, and MFI zeolites were investigated. Consequently, a comprehensive analytical framework has been developed and presented to facilitate the study of these properties in a thorough manner. It was found that the data obtained from optical measurements allows us to understand the basic properties of the materials, in particular, bandgap, optical conductivity, and relative permittivity. In the case of the electrical analysis, the results show how the morphology and chemical composition of the material defines the frequency response and the parameters obtained from it, such as electrical conductivity and relative permittivity. The most significant contribution of this research lies in the presentation of the relationship between relative permittivity derived from electrical and optical sources. This correlation has been validated by comparing it with reports on other materials, further solidifying its importance and relevance. As a result, the methodology presented in this work can be extended to any zeolitic material.

Author Contributions

Conceptualization, F.N.M.-R., V.P. and J.A.-G.; methodology, F.N.M.-R.; validation, V.P. and R.I.Y.-G.; formal analysis, F.N.M.-R., V.P. and J.A.-G.; investigation, F.N.M.-R., V.P., J.A.-G., R.I.Y.-G., A.R.S., M.X., O.S., W.F.-F. and J.C.R.-Q.; writing—original draft preparation, F.N.M.-R., V.P., J.A.-G., R.I.Y.-G., A.R.S., M.X., O.S., W.F.-F. and J.C.R.-Q.; writing—review and editing, F.N.M.-R., V.P., J.A.-G., R.I.Y.-G., A.R.S., M.X., O.S., W.F.-F. and J.C.R.-Q.; funding acquisition, V.P. and A.R.S. All authors have read and agreed to the published version of the manuscript.

Funding

This research was funded through the grants DGAPA-PAPIIT IG101623 and CONACYT “Basic Science Project A1-S-33492”.

Data Availability Statement

Not applicable.

Conflicts of Interest

The authors declare no conflict of interest.

References

  1. Klaas, J.; Schulz-Ekloff, G.; Jaeger, N.I. UV−Visible Diffuse Reflectance Spectroscopy of Zeolite-Hosted Mononuclear Titanium Oxide Species. J. Phys. Chem. B 1997, 101, 1305–1311. [Google Scholar] [CrossRef]
  2. Hamidouche, F.; Ghebache, Z.; Boudieb, N.; Sanad, M.M.S.; Djelali, N.-E. Enhancing the Supercapacitive and Conductivity Properties of Polypyrrole via In-situ Polymerization with HY Zeolite Nanoparticles. J. Inorg. Organomet. Polym. Mater. 2020, 31, 704–715. [Google Scholar] [CrossRef]
  3. Saragi, I.R.; Krisnandi, Y.K.; Sihombing, R. Synthesis and Characterization HY Zeolite from Natural Aluminosilicate for n-Hexadecane Cracking. Mater. Today: Proc. 2019, 13, 76–81. [Google Scholar] [CrossRef]
  4. Fois, E.; Gamba, A.; Tabacchi, G. Bathochromic Effects in Electronic Excitation Spectra of Hydrated Ti Zeolites: A Theoretical Characterization. ChemPhysChem 2008, 9, 538–543. [Google Scholar] [CrossRef] [Green Version]
  5. Conner, W.C.; Tompsett, G.; Lee, K.H.; Yngvesson, K.S. Microwave synthesis of zeolites: 1. Reactor engineering. J. Phys. Chem. B 2004, 108, 13913–13920. [Google Scholar] [CrossRef]
  6. Yin, Y.; Liu, X.; Wei, X.; Yu, R.; Shui, J. Porous CNTs/Co Composite Derived from Zeolitic Imidazolate Framework: A Lightweight, Ultrathin, and Highly Efficient Electromagnetic Wave Absorber. ACS Appl. Mater. Interfaces 2016, 8, 34686–34698. [Google Scholar] [CrossRef] [PubMed]
  7. Kurzweil, P.; Maunz, W.; Plog, C. Impedance of zeolite-based gas sensors. Sens. Actuators B Chem. 1995, 25, 653–656. [Google Scholar] [CrossRef]
  8. Urbiztondo, M.; Pellejero, I.; Rodriguez, A.; Pina, M.; Santamaria, J. Zeolite-coated interdigital capacitors for humidity sensing. Sens. Actuators B Chem. 2011, 157, 450–459. [Google Scholar] [CrossRef]
  9. İzci, E.; Izci, A. Dielectric behavior of the catalyst zeolite NaY. Turk. J. Chem. 2007, 31, 523–530. [Google Scholar]
  10. Saad, I.B.; Hannachi, N.; Roisnel, T.; Hlel, F. Optical, UV-Vis spectroscopy studies, electrical and dielectric properties of transition metal-based of the novel organic–inorganic hybrid (C6H10N2)(Hg2Cl5)2·3H2O. J. Adv. Dielectr. 2019, 9, 1950040. [Google Scholar] [CrossRef] [Green Version]
  11. Baerlocher, C.; McCusker, L.B. Database of Zeolite Structures. Available online: http://www.izastructure.org/databases (accessed on 29 November 2022).
  12. Murrieta-Rico, F.N.; Yocupicio-Gaxiola, R.I.; Antúnez-García, J.; Reyes-Serrato, A.; Sánchez, P.; Petranovskii, V. Textile Functionalization Using LTA and FAU Zeolitic Materials. Polymers 2022, 15, 99. [Google Scholar] [CrossRef]
  13. Tauc, J. Optical properties and electronic structure of amorphous Ge and Si. Mater. Res. Bull. 1968, 3, 37–46. [Google Scholar] [CrossRef]
  14. Murrieta-Rico, F.N.; Antúnez-García, J.; Yocupicio-Gaxiola, R.I.; Zamora, J.; Reyes-Serrato, A.; Pestryakov, A.; Petranovskii, V. Study of Electric and Magnetic Properties of Iron-Modified MFI Zeolite Prepared by a Mechanochemical Method. Materials 2022, 15, 7968. [Google Scholar] [CrossRef]
  15. Sharma, P.; Han, M.H.; Cho, C.-H. Synthesis of Zeolite Nanomolecular Sieves of Different Si/Al Ratios. J. Nanomater. 2015, 2015, 912575. [Google Scholar] [CrossRef] [Green Version]
  16. Hanbury, A.; Serra, J. Mathematical morphology in the cielab space. Image Anal. Ster. 2002, 21, 201–206. [Google Scholar] [CrossRef]
  17. Antúnez-García, J.; Galván, D.; Petranovskii, V.; Murrieta-Rico, F.N.; Yocupicio-Gaxiola, R.I.; Shelyapina, M.G.; Fuentes-Moyado, S. The effect of chemical composition on the properties of LTA zeolite: A theoretical study. Comput. Mater. Sci. 2021, 196, 110557. [Google Scholar] [CrossRef]
  18. Antúnez-García, J.; Galván, D.; Petranovskii, V.; Murrieta-Rico, F.N.; Yocupicio-Gaxiola, R.I.; Shelyapina, M.G.; Fuentes-Moyado, S. Aluminum distribution in mordenite-zeolite framework: A new outlook based on density functional theory calculations. J. Solid State Chem. 2021, 306, 122725. [Google Scholar] [CrossRef]
  19. Antúnez-García, J.; Galván, D.H.; Petranovskii, V.; Murrieta-Rico, F.N.; Yocupicio-Gaxiola, R.I.; Fuentes-Moyado, S. Theoretical study of the effect of isomorphous substitution by Al3+ and/or Fe3+ cations to tetrahedral positions in the framework of a zeolite with erionite topology. J. Mater. Sci. 2019, 54, 13190–13199. [Google Scholar] [CrossRef]
  20. Antúnez-García, J.; Yocupicio-Gaxiola, R.I.; Serrato, A.R.; Petranovskii, V.; Murrieta-Rico, F.N.; Shelyapina, M.G.; Fuentes-Moyado, S. A theoretical study of the effect of exchange cations in surface of ZSM-5 lamellar zeolites. J. Solid State Chem. 2023, 317, 123725. [Google Scholar] [CrossRef]
  21. Sebastian, M.T.; Silva, M.A.S.; Sombra, A.S.B. Measurement of Microwave Dielectric Properties and Factors Affecting Them. In Microwave Materials and Applications 2V Set; John Wiley & Sons, Ltd.: Chichester, UK, 2017; pp. 1–51. [Google Scholar]
  22. Yang, X.; Liu, X.; Yu, S.; Gan, L.; Zhou, J.; Zeng, Y. Permittivity of Undoped Silicon in the Millimeter Wave Range. Electronics 2019, 8, 886. [Google Scholar] [CrossRef] [Green Version]
  23. Martínez-Rosas, M.E.; Garrafa-Gálvez, H.E.; Nava, O.; Murrieta-Rico, F.N.; Chinchillas-Chinchillas, M.J.; Carrillo-Castillo, A.; Luque, P.A. Electrochemical impedance characterization of ZnO semiconductor nanoparticles biosynthesized with Verbascum thapsus. J. Mater. Sci. Mater. Electron. 2021, 32, 10510–10519. [Google Scholar] [CrossRef]
  24. Garrafa-Gálvez, H.E.; Cardoza-Avendaño, L.; López-Gutiérrez, R.M.; Martínez-Rosas, M.E.; Murrieta-Rico, F.N.; Luque, P.A. Use of Tilia extract to improve the optical and electrochemical properties of ZnO semiconductor nanoparticles. J. Mater. Sci. Mater. Electron. 2023, 34, 14. [Google Scholar] [CrossRef]
  25. Yan, Z.; Zhu, L.; Li, Y.C.; Wycisk, R.J.; Pintauro, P.N.; Hickner, M.A.; Mallouk, T.E. The balance of electric field and interfacial catalysis in promoting water dissociation in bipolar membranes. Energy Environ. Sci. 2018, 11, 2235–2245. [Google Scholar] [CrossRef]
  26. Luque, P.A.; Nava, O.; Romo-Cardenas, G.; Nieto-Hipolito, J.I.; Vilchis-Nestor, A.R.; Valdez, K.; Sanchez-Lopez, J.D.D.; Murrieta-Rico, F.N. Facile Zinc Oxide Nanoparticle Green Synthesis Using Citrus reticulata Extract for Use in Optoelectronic Sensors. IEEE Sens. J. 2020, 21, 11275–11282. [Google Scholar] [CrossRef]
Figure 1. Micrographs of zeolites: MFI (a), LTA (b), and FAU (c).
Optics 04 00033 g001
Figure 2. Normalized EDS spectra of all samples.
Optics 04 00033 g002
Figure 3. Comparison of theoretical and experimental diffractograms of MFI, LTA and FAU zeolites.
Optics 04 00033 g003
Figure 4. UV-Vis absorption spectra for LTA (diamond), FAU (star) and MFI (hexagon) zeolites (a); CIE Lab space evaluation of UV-Vis data from LTA, FAU and MFI zeolites (b).
Optics 04 00033 g004
Figure 5. Tauc plots corresponding to MFI, LTA and FAU zeolites.
Optics 04 00033 g005
Figure 6. Optical complex relative permittivity, real (gray) and imaginary (red) parts, calculated for each zeolite: LTA (a), FAU (b), MFI (c); electrical complex relative permittivity, real (gray) and imaginary (red) parts, calculated for each zeolite: LTA (d), FAU (e), MFI (f).
Optics 04 00033 g006
Figure 7. Optical conductivity calculated for LTA, FAU and MFI zeolites.
Optics 04 00033 g007
Figure 8. Nyquist plot for LTA, FAU and MFI zeolites.
Optics 04 00033 g008
Figure 9. Electrical models proposed for FAU and MFI zeolites (a) and for LTA (b) zeolites.
Optics 04 00033 g009
Figure 10. Electrical conductivity of zeolites LTA, FAU and MFI.
Optics 04 00033 g010
Table 1. Fitted parameters for FAU and MFI zeolites.
Zeolite R s (Ω) R p (Ω) C P E T (F) C P E P
FAU1462 1.41 × 10 7 5.87 × 10 11 0.95398
MFI 4021 153670 4.267 × 10 11 0.90562
Table 2. Fitted parameters for LTA zeolite.
R1 (Ω)CPE1TCPE1PR2 (Ω)CPE2T (F)CPE2P
57,7761.023 × 10−100.905563.7769 × 1065.68 × 10−100.81504
Disclaimer/Publisher’s Note: The statements, opinions and data contained in all publications are solely those of the individual author(s) and contributor(s) and not of MDPI and/or the editor(s). MDPI and/or the editor(s) disclaim responsibility for any injury to people or property resulting from any ideas, methods, instructions or products referred to in the content.