Article

New Evidence for a Nonclassical Behavior of Laser Multimode Light

1
Laboratory of Nonequilbrium Electron Processes (LNEP), Institute of Solid State Physics (ISSP RAS), 142432 Chernogolovka, Moscow Region, Russia
2
Landau Phystech School of Physics and Research, Moscow Institute of Physics and Technology, 141701 Dolgoprudny, Moscow Region, Russia
3
Laboratory of Quantum Crystals (LQC), Institute of Solid State Physics (ISSP RAS), 142432 Chernogolovka, Moscow Region, Russia
*
Author to whom correspondence should be addressed.
Optics 2022, 3(1), 46-52; https://doi.org/10.3390/opt3010006
Submission received: 15 December 2021 / Revised: 21 January 2022 / Accepted: 26 January 2022 / Published: 29 January 2022

Abstract

:
In this work, we present new experimental evidence of a nonclassical behavior of a multimode Fabry–Perot (FP) semiconductor laser by the measurements of intensity correlation functions. Due to the multimode quantum state occurrence, instead of expected correlations between the intensities of the laser modes (a semiclassical theory), their anticorrelations were revealed.

1. Introduction

Quantum mechanical states of light, also called nonclassical light [1], are used in quantum cryptography [2], quantum computing [3], quantum teleportation [4] and quantum photometry [5]. The sources of nonclassical light are a spontaneous parametric down-conversion (SPDC) used for the generation of entangled photon pairs and of single photons [6,7], atoms in traps [8], quantum dots as a source of single photons [9] and optical parametric oscillators (OPO) as a source of squeezed light [10]. Every source generates a specific quantum state of the electromagnetic field with the appropriate properties, which allow for its potential use in quantum informatics. We believe that semiconductor laser multimode light can serve as a new source of nonclassical light and be applied in various fields. In our first study of the intensity correlation functions of laser light scattered by semiconductor microcavity [11], we observed a correlation function predicted for such a case by Eleuch [12] but with surprisingly long correlation times. Our further experimental results showed strong photon correlations in the radiation of a multimode semiconductor laser itself [13]. The question arises: Are these observed correlations the signature of a new multimode quantum state of light or do they result from a specific pulse train regime of a semiconductor laser [14]? The explanation of this effect could be given within the framework of the semiclassical theory of light as well as within the concept of the totally quantum mechanical picture, including the back action of photon detection on the emission of the subsequent photon. Attempting to distinguish between these two possibilities, we measured the triple intensity correlation, which uses quantum–mechanical notions in its explanations of this effect [15,16]. The multimode semiconductor laser light could be a new example of nonclassical light, which is in an entangled state with the light-emitting medium of the laser. Here, we present further proof of the quantum character of multimode FP semiconductor laser radiation based on a novel experimental scheme. This scheme includes four single-photon avalanche diodes (SPAD), which allow the recording of double correlators of three kinds: the multimode autocorrelation functions, the single-mode autocorrelation functions and all-to-one cross-correlation functions. The aim of our measurements is to conduct a careful comparison of autocorrelation functions for the individual modes. Surprisingly, we observed an anticorrelation between all-to-one intensities instead of their correlation predicted by a semiclassical theory.

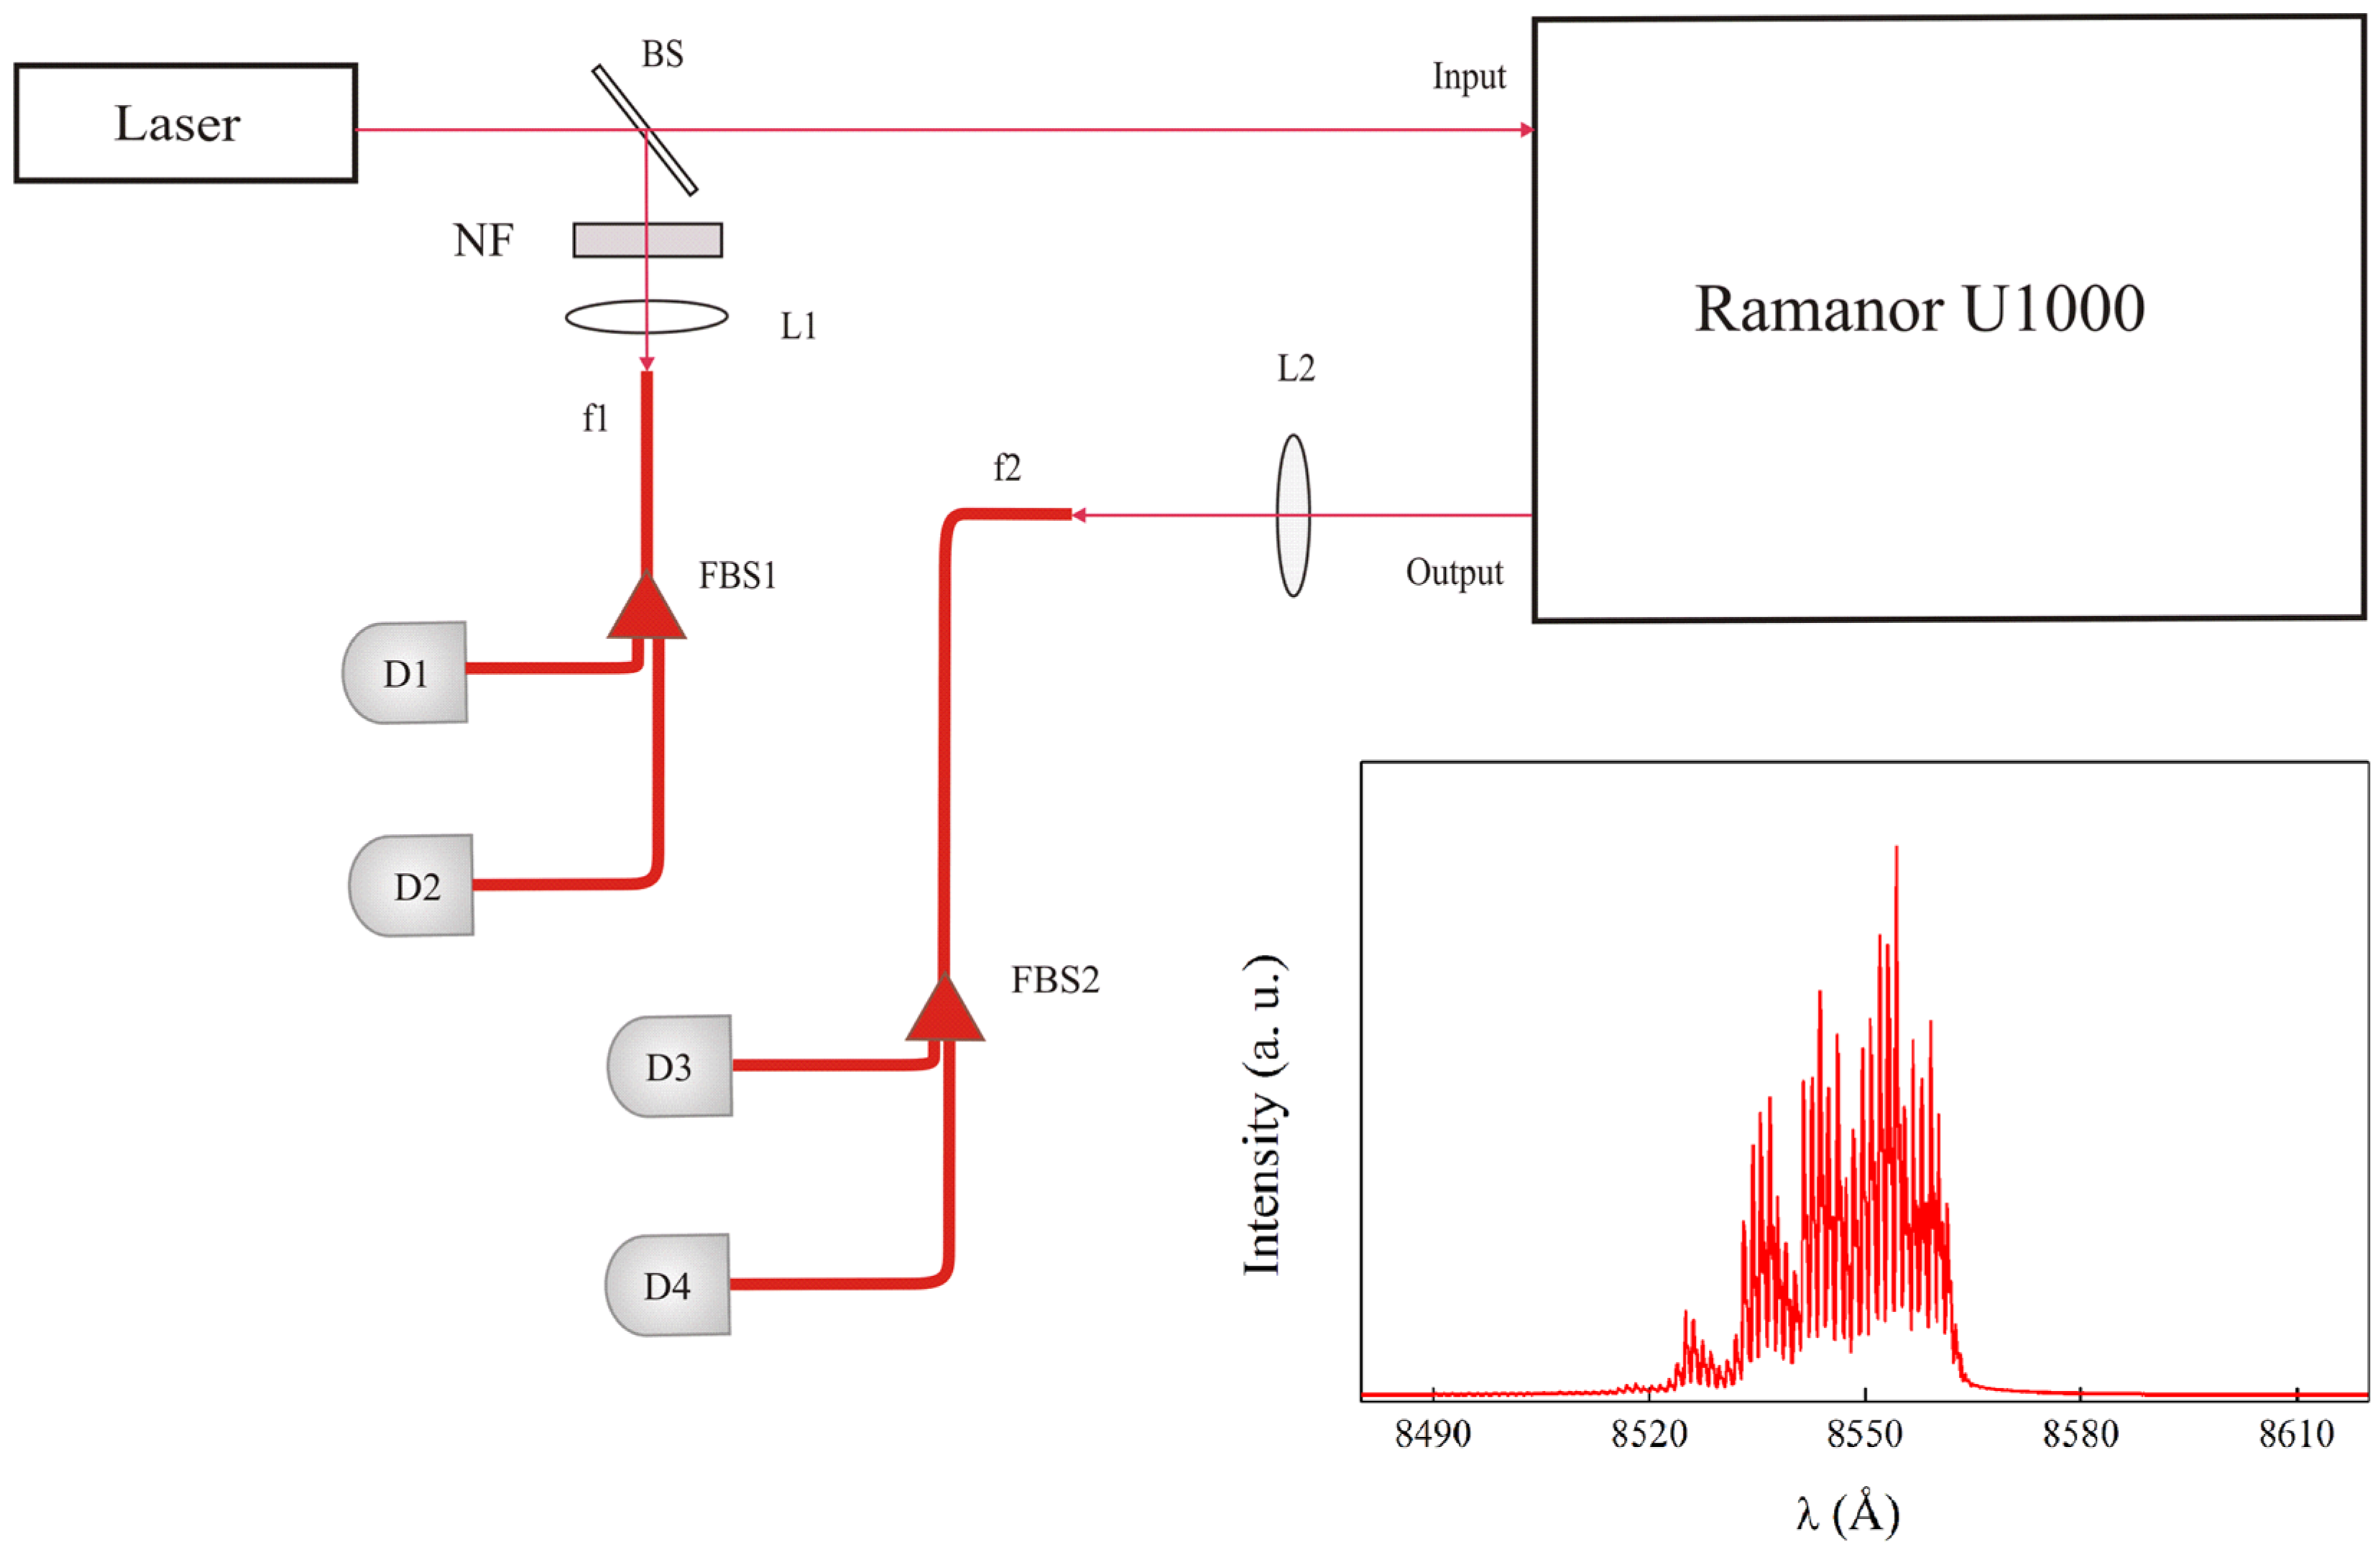
2. Experiments and Methods
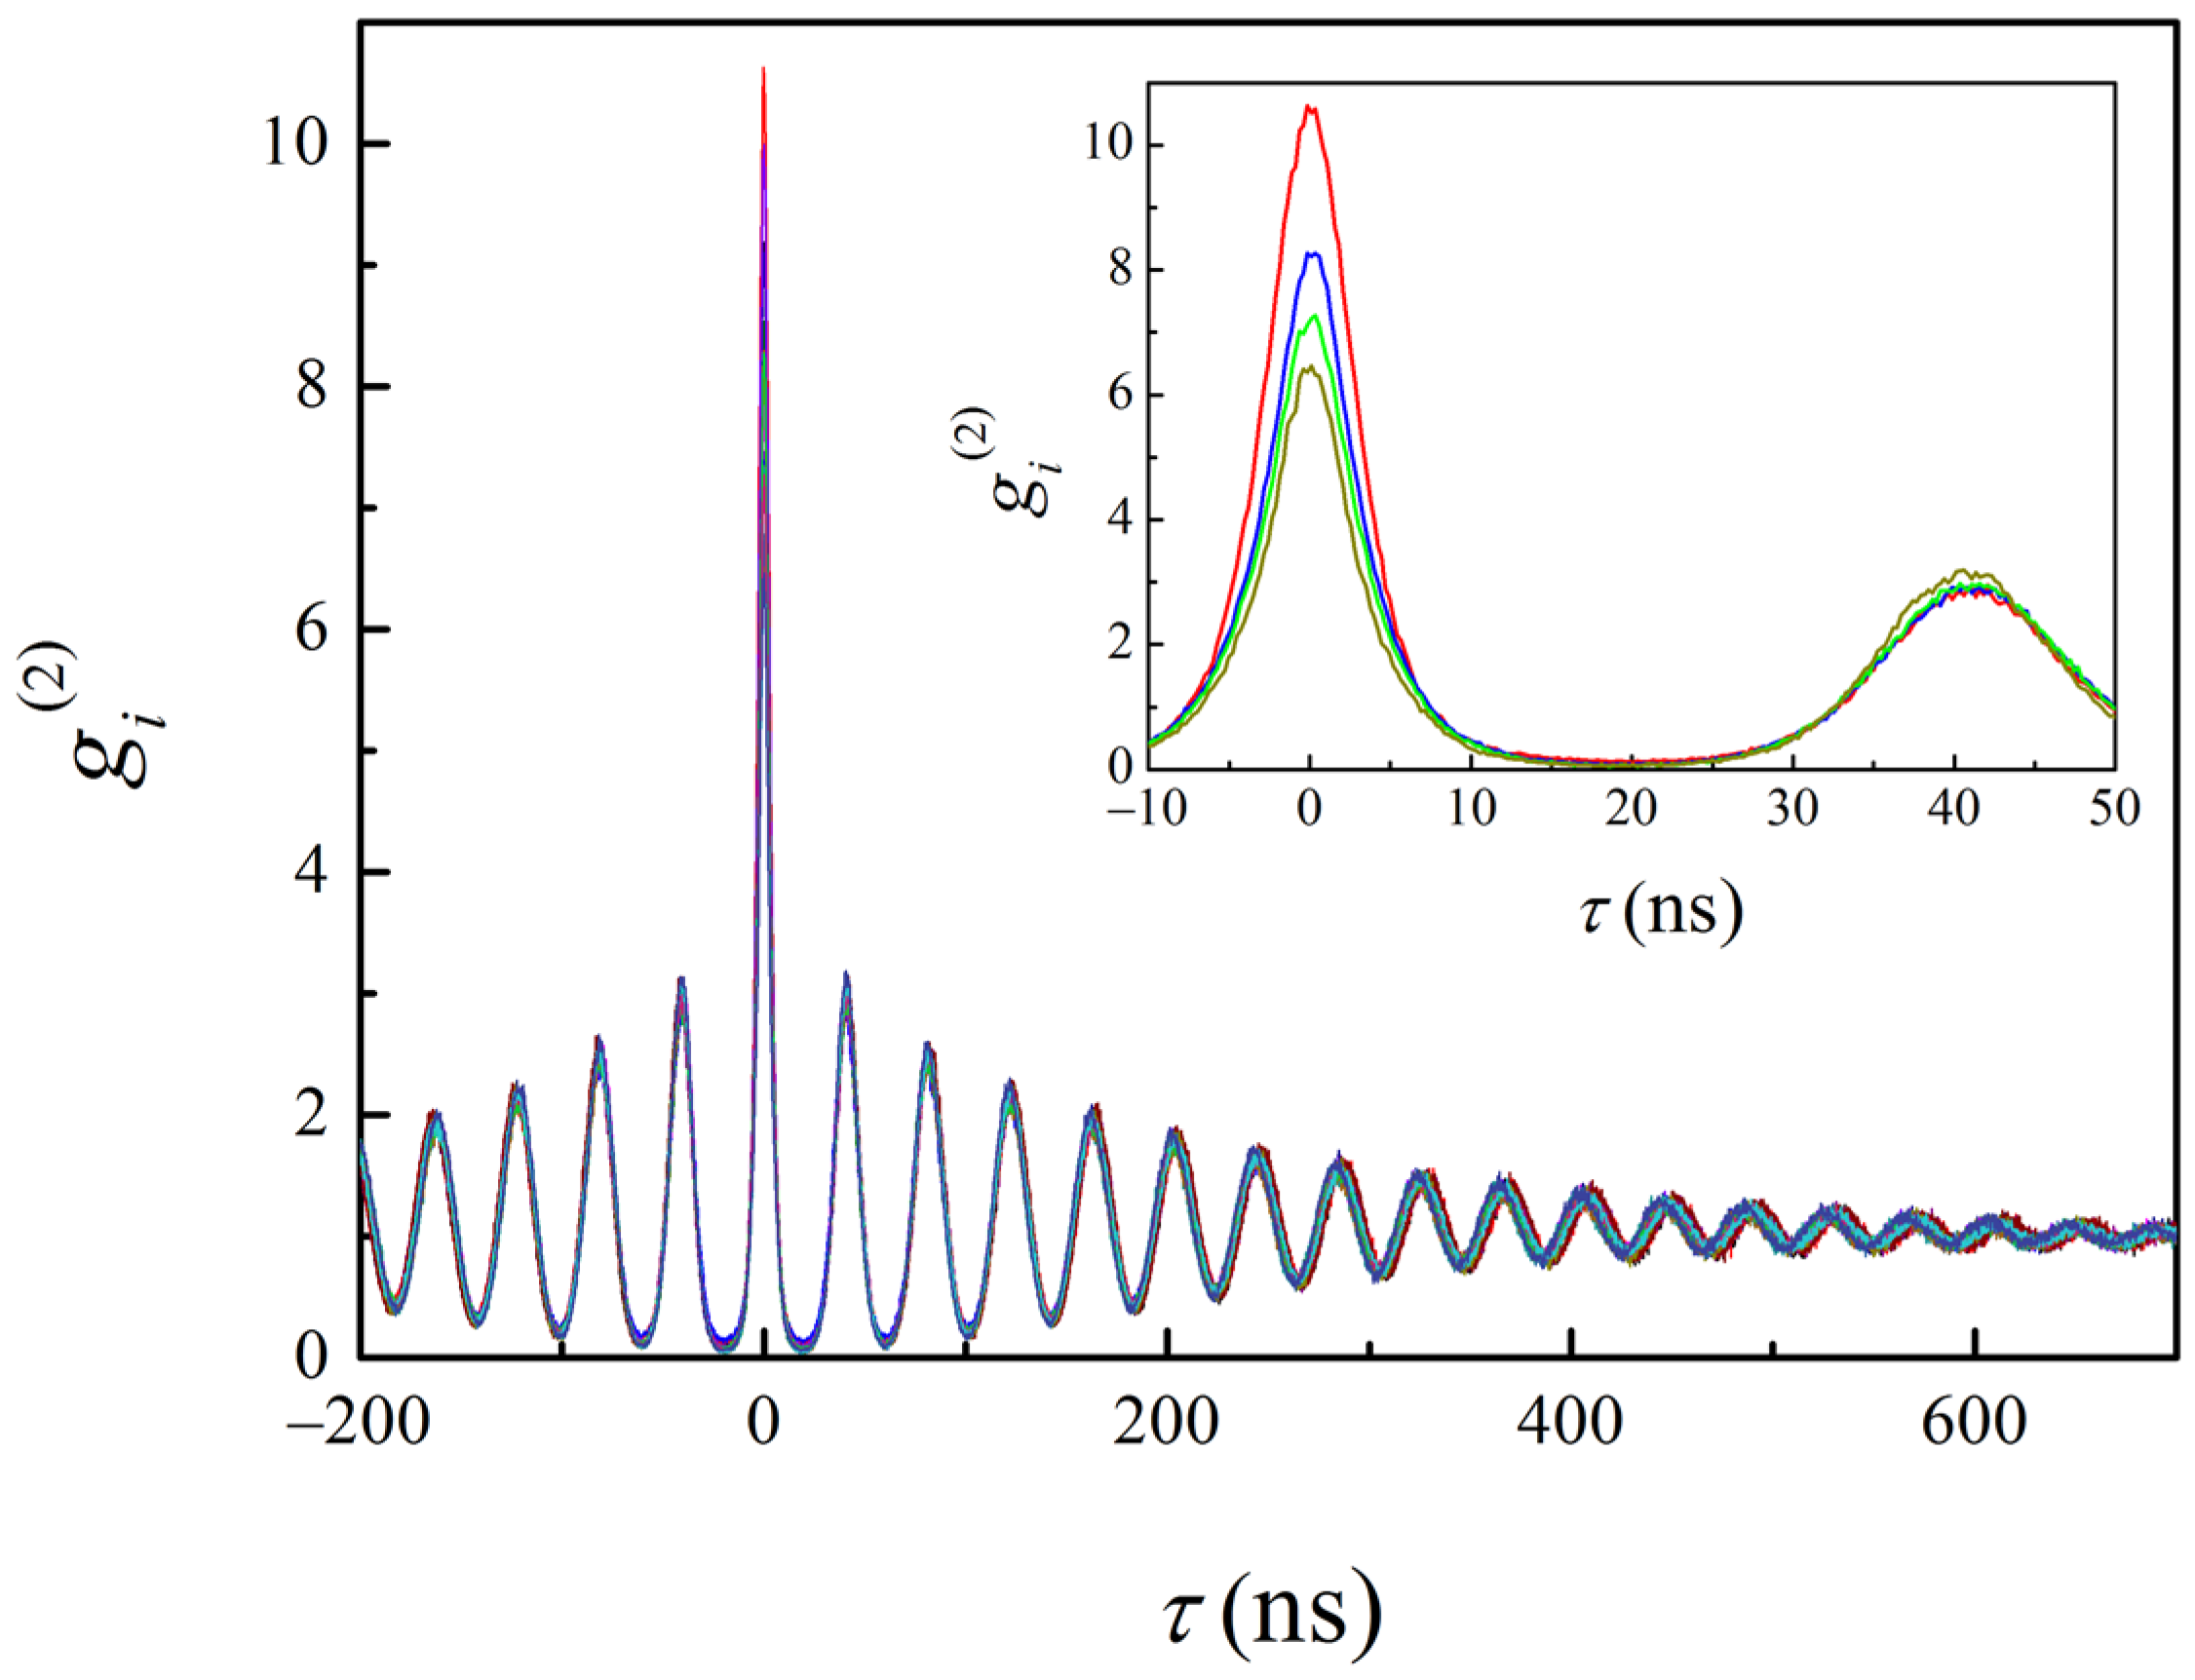
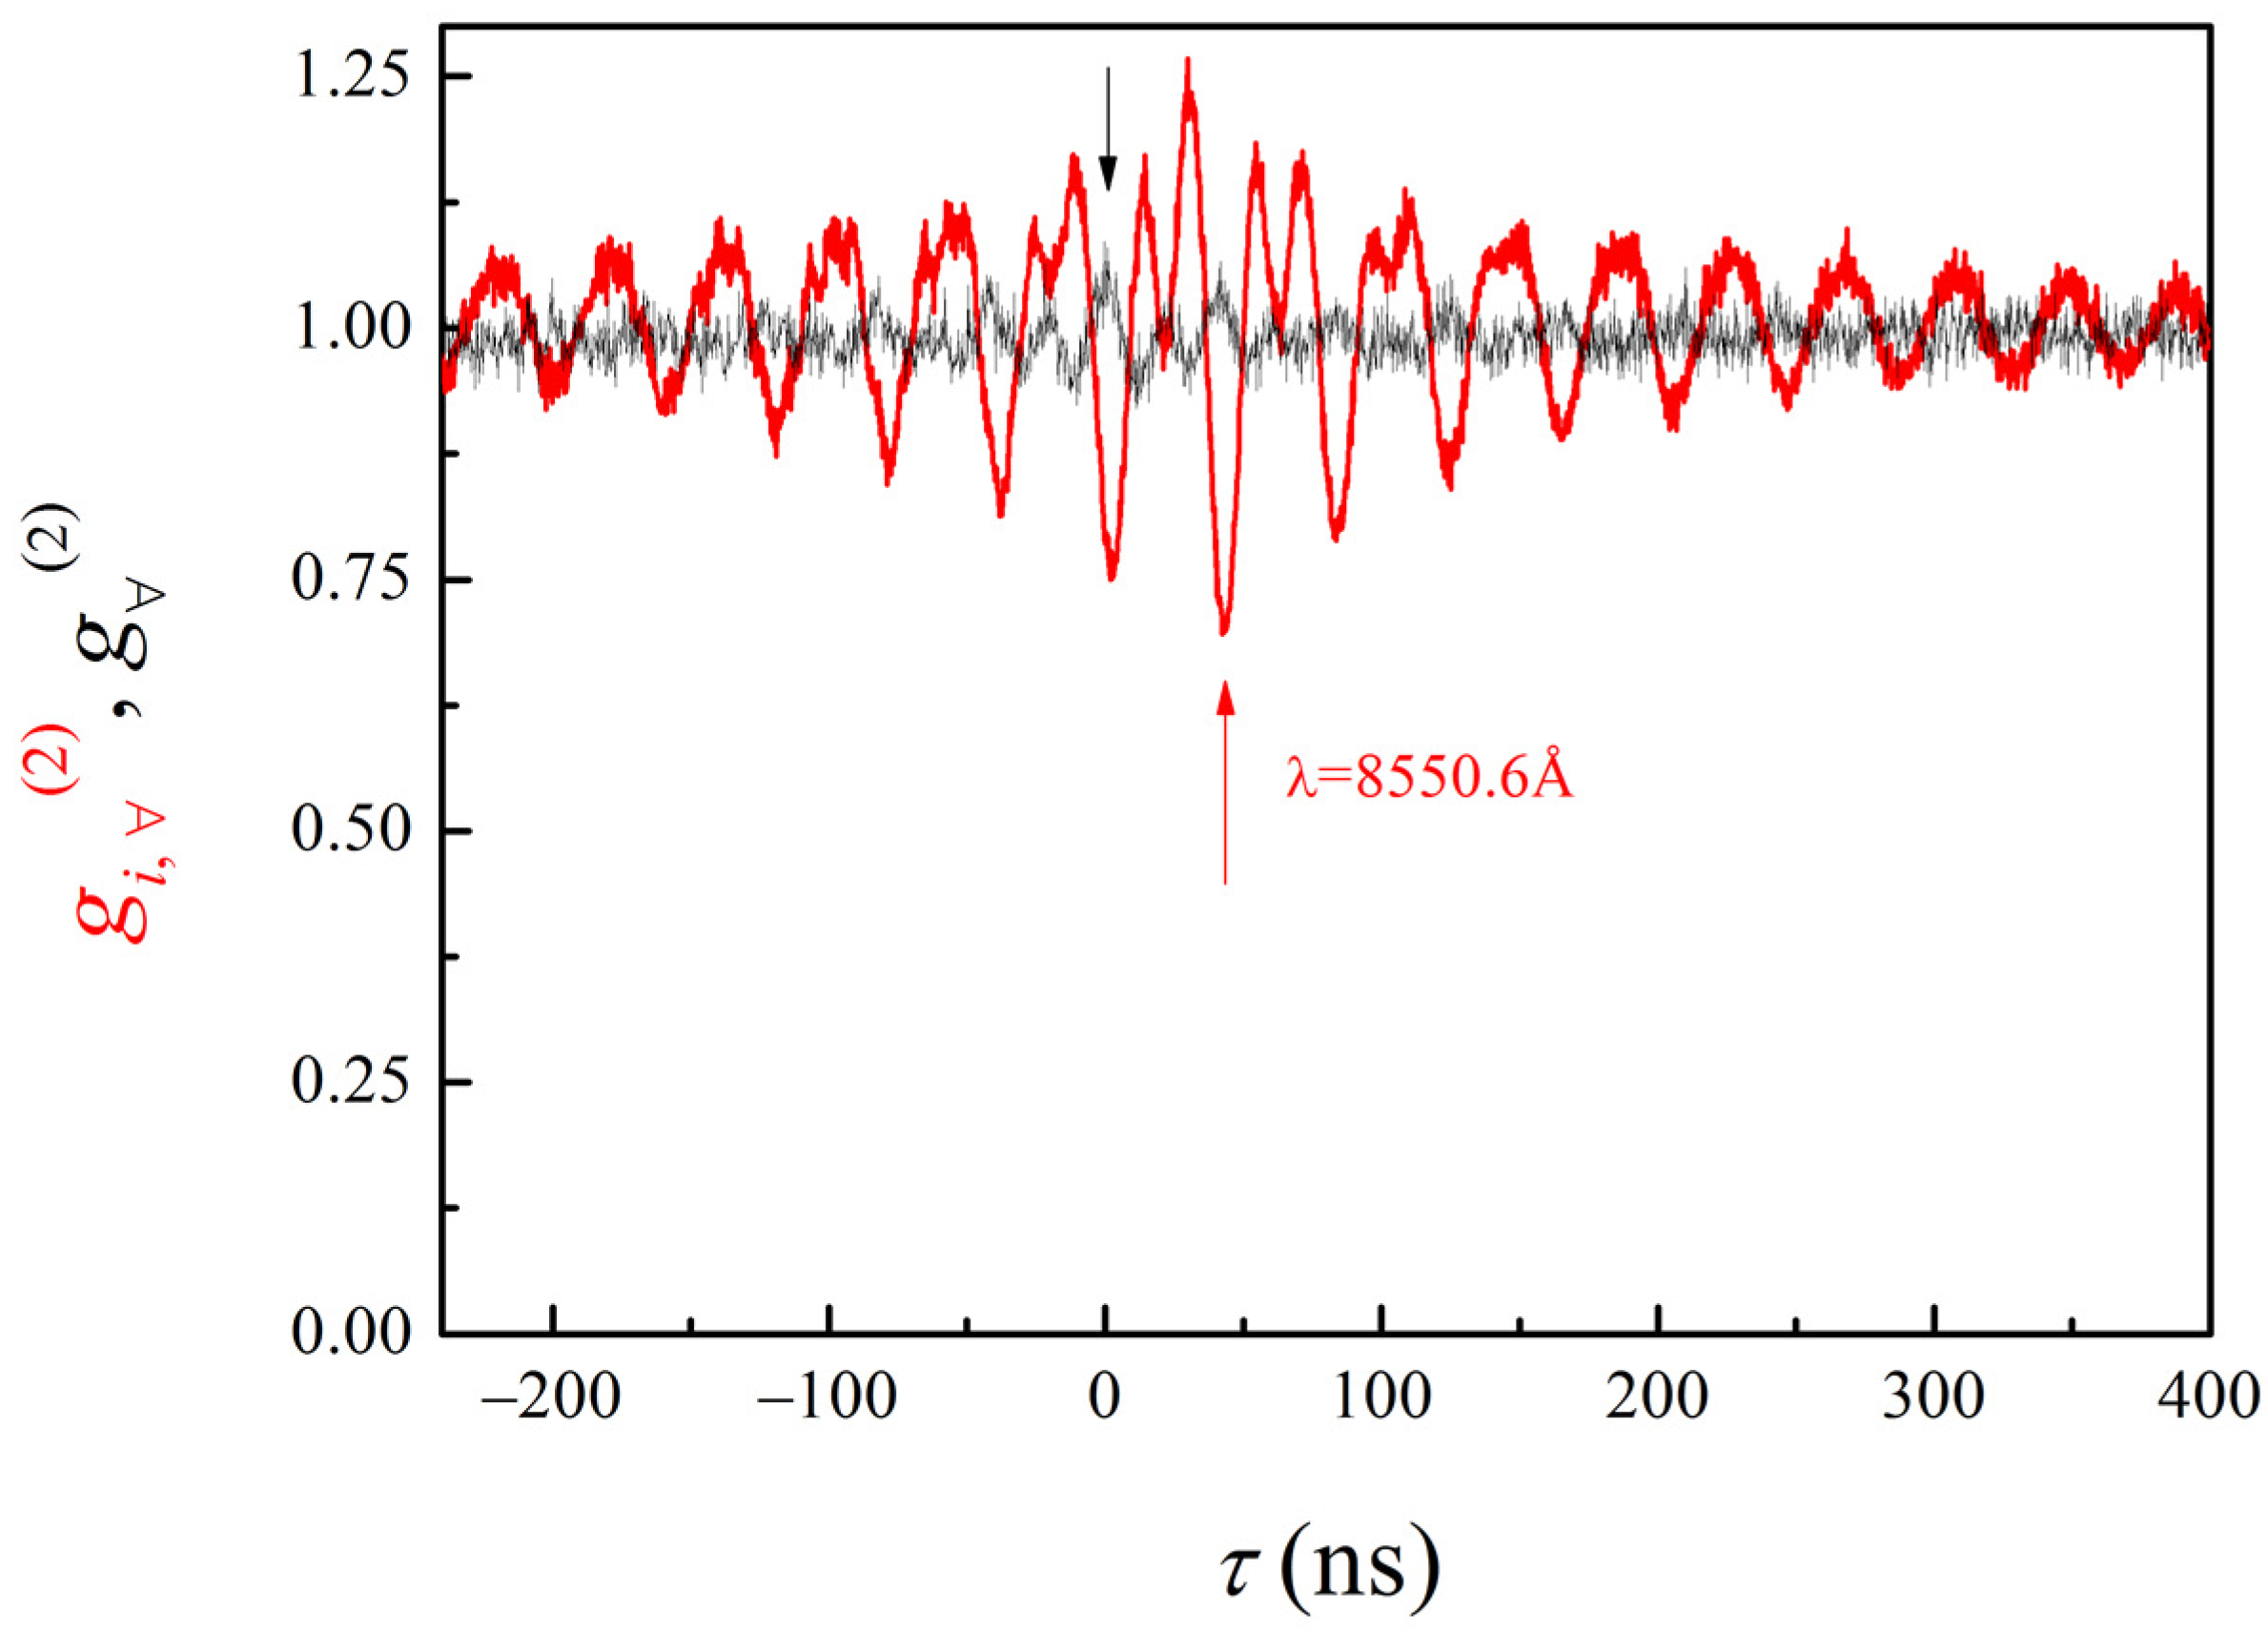
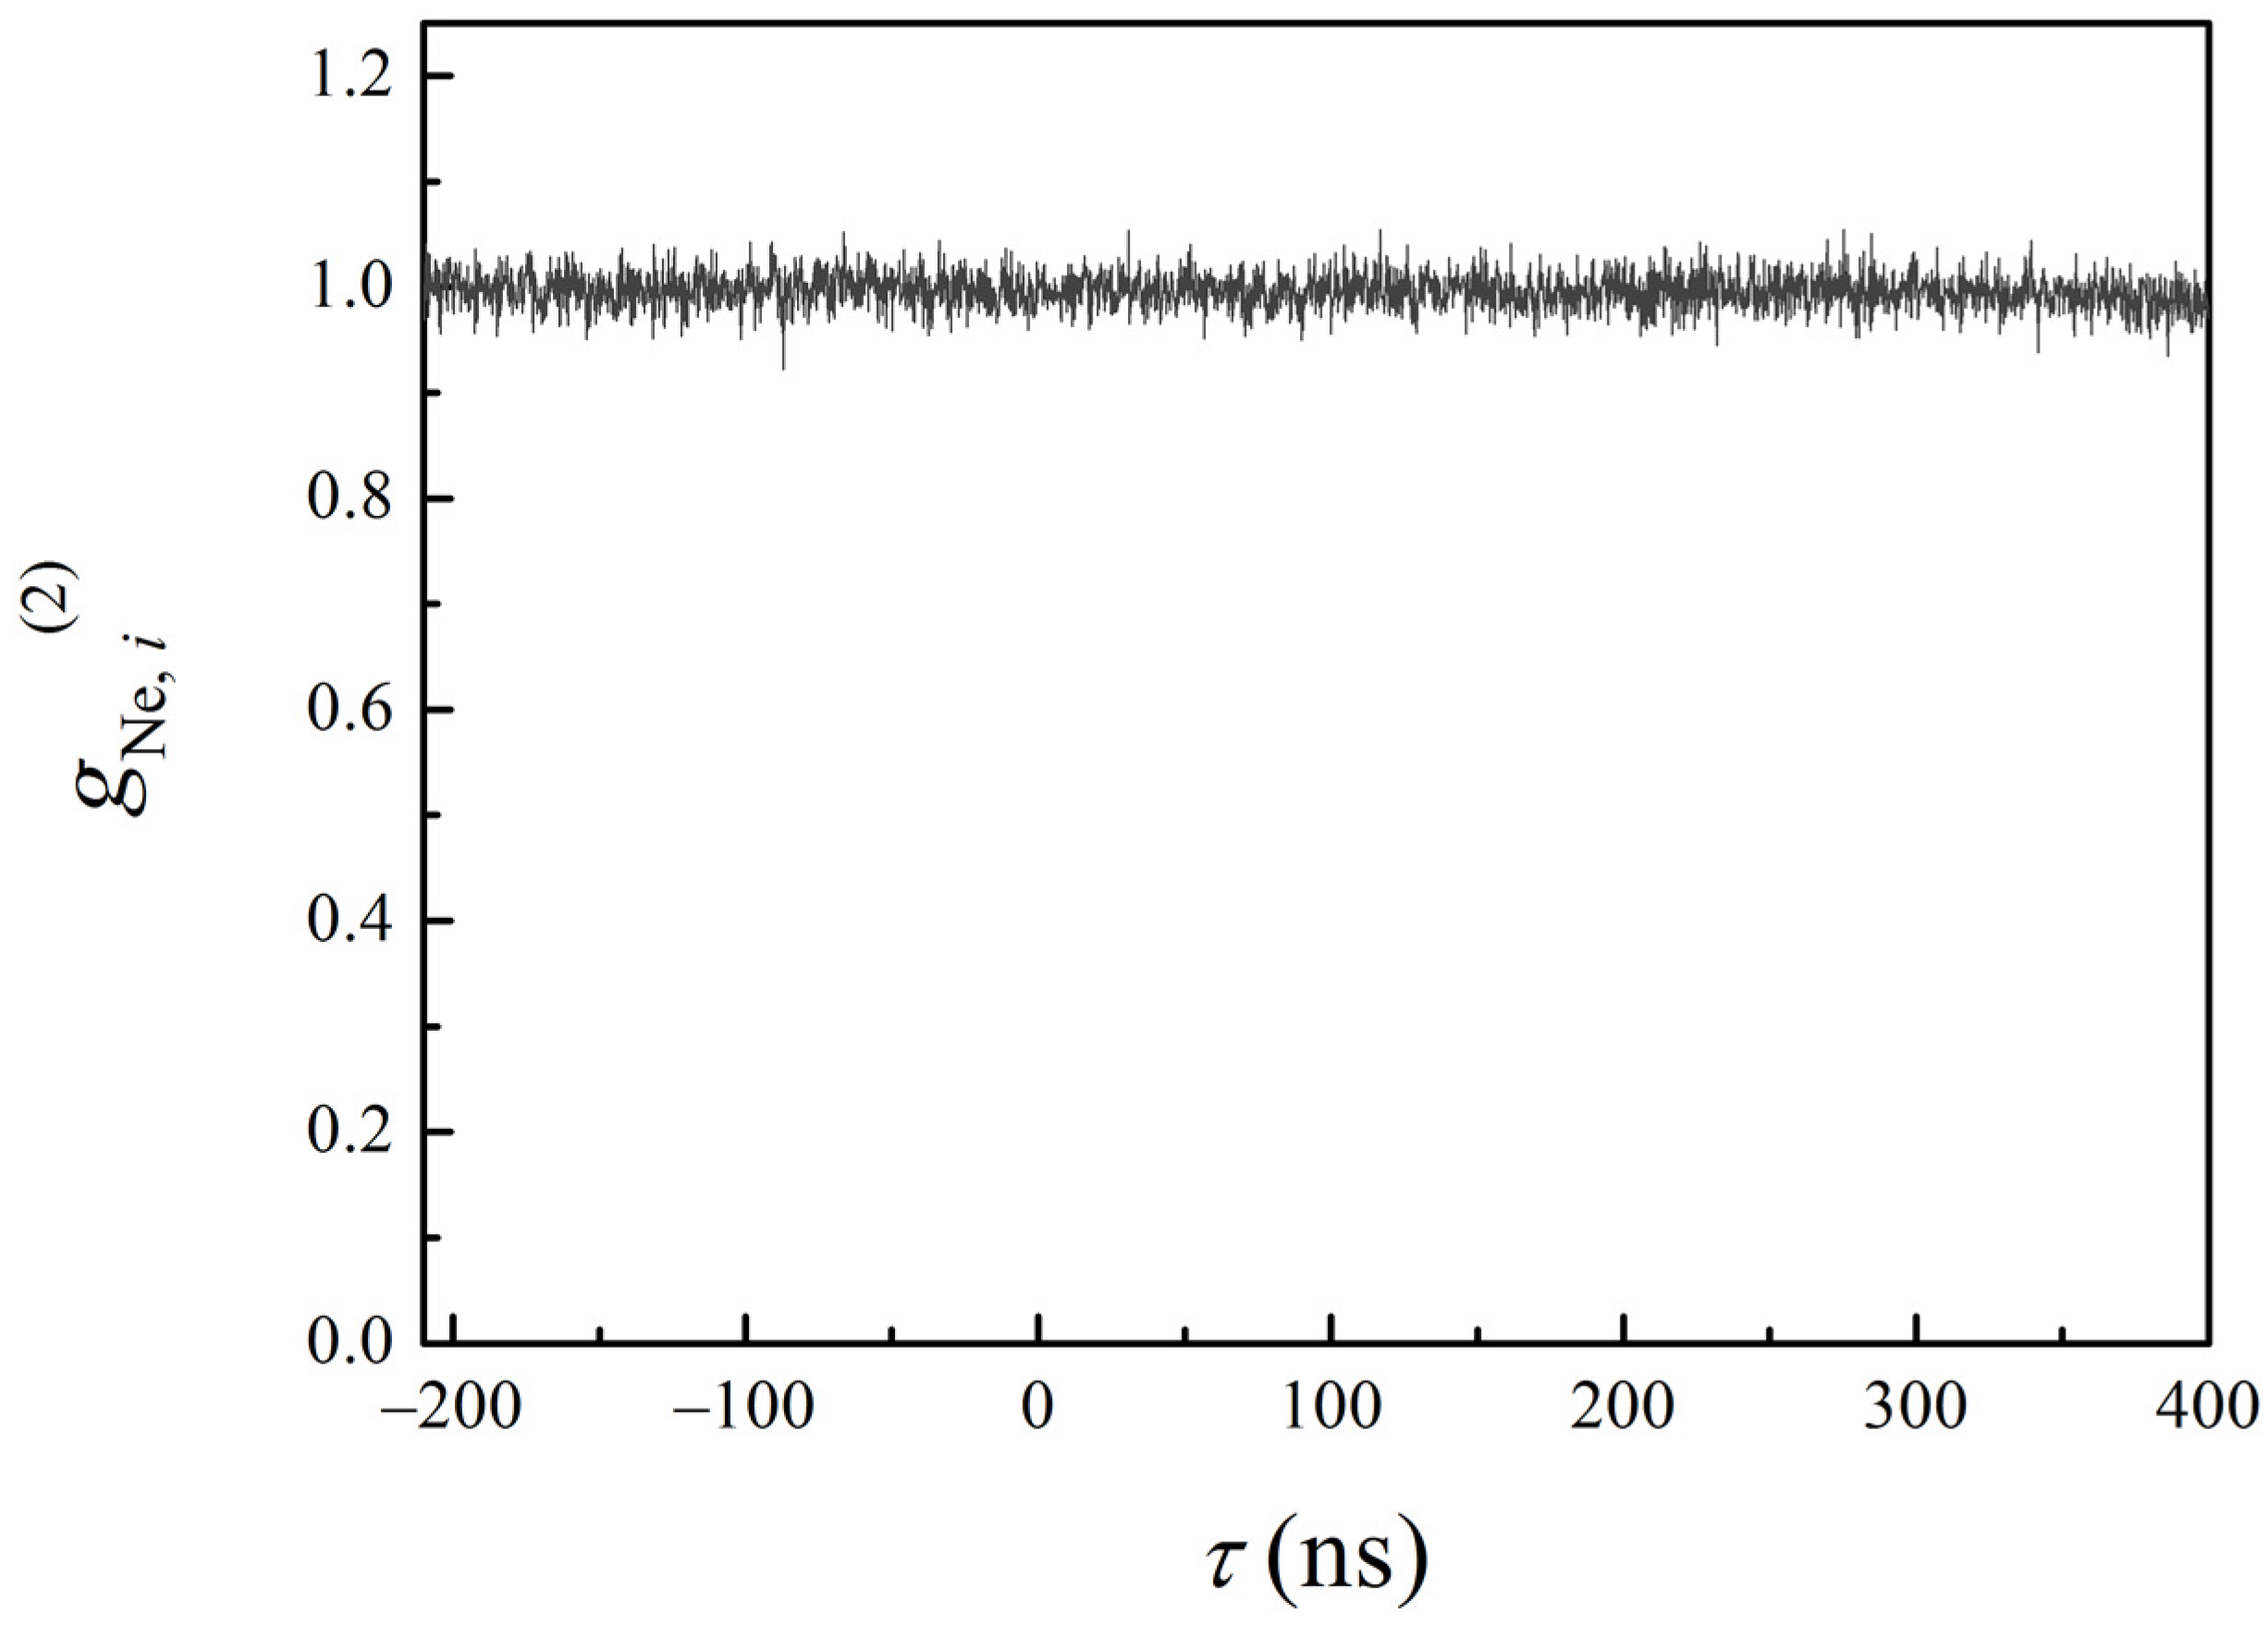
The experimental setup is schematically shown in Figure 1. The radiation of the multimode semiconductor FP laser (model FPL-852 +/−2 nm, Nolatech) [2] is split by a beamsplitter (a parallel-sided glass plate) into two beams. One beam is attenuated by a neutral density filter (NF) and focused into a multimode fiber (f1), after which it is distributed between two SPADs (D1, D2) by means of a fiber-Y-splitter (FBS1). Another beam is directed onto the entrance slit of a triple-grating spectrometer, Ramanor U1000. The output beam is then focused into a multimode fiber (f2), after which it is distributed between the photodiodes D3 and D4 by means of the fiber-Y-splitter FBS2.
The multimode spectrum of the laser operating in its standard regime, with a total power of 30 mW, is shown in the inset of Figure 1. The spectrum consists of a large number (approximately 35) of longitudinal modes. All avalanche photodiodes are operated in the photon counting regime. Using the high-resolution (~20 meV) triple spectrometer, Ramanor U1000, we can select one of the modes from the spectrum shown in the inset of Figure 1. This allows us to measure second-order intensity correlation functions of three kinds: a correlation function of the multimode radiation, a single-mode correlation function and a cross-correlation function between all modes and a single mode (see below). The slits used in the spectrometer were only some microns wide in order to achieve the best possible spectral resolution, as well as to reduce the light intensity.

3. Results

The second-order correlation function g ( 2 ) for the multimode radiation is:
g ( 2 ) ( τ ) = I ( 0 ) I ( τ ) I 2 ,
where I(0) and I(τ) are the intensities measured with detectors D1 and D2, respectively.
This function shows the absence of any significant correlations as it is expected for a coherent state (see Figure 2).
A multimode continuous-wave laser is often thought to generate a state which is a product:
| Ψ = C | α 1     | α n ,
where C is the normalization constant and |α1〉 … |αn〉 are coherent states of the individual modes, thus the absence of correlations is quite natural.
As mentioned above, the total number of intense longitudinal modes in the spectrum of the laser working at its nominal optical power of 30 mW is about 35. We measured autocorrelation functions for 25 modes (see Figure 3). The second-order intensity correlation functions g i ( 2 ) of a desired single mode are:
g i ( 2 ) ( τ ) = I i ( 0 ) I i ( τ ) I i 2
where Ii(0) and Ii(τ) are the intensities of a single mode measured with the detectors D3 and D4.
All of the modes are almost identical regarding their autocorrelation functions. The visibility of these functions is extremely high, with the level very close to 100% (the counting rate in the first minimum of the autocorrelation function was only (2–5) counts/1000 s). It can be also observed from Figure 3 (in the inset) that the maximum of the function is inversely proportional to the wavelength (the values are given in the figure caption). These functions show a strong photon bunching at zero-time delay, followed by oscillations with a period of about 40 ns and a damping constant of about 190 ns. The only difference between autocorrelation functions of individual modes is the height of the zero-delay peak. This value varies between 4.5 and 11 and also shows some instability if the measurements of the single-mode autocorrelation functions are repeated several times. We attribute this instability to intensity fluctuations caused by spatial interference effects at the entrance slit of the spectrometer.
The cross-correlation function between all modes and a single mode can be expressed as:
g i , ( 2 ) ( τ ) = I i ( 0 ) I ( τ ) I i I .
where I(τ) and Ii(0) are the intensities of all modes and a single mode measured with detectors D1 and D3.
Surprisingly, we found that the maximum absolute value of correlations actually occurs at the time delay of 40 ns, which is roughly comparable with a time delay corresponding to the propagation time of light from the beamsplitter through the spectrometer and the output fiber to the detector D3. However, we observe an anti-correlation between the intensities I1 and I3 (measured by means of detectors D1 and D3, correspondingly) instead of a correlation at this time delay (see Figure 4).

4. Discussion

It is clear that our results contradict Formula (2), showing that individual modes are not in coherent states. A high-visibility intensity correlation function may be a signature of pulsed-laser operation, and the pulse regime of a continuous-wave multimode semiconductor laser was experimentally observed [4]. In this case, continuous-wave, multimode laser operation is a mixture of pulse trains of individual modes, where phases are chosen so that the integrated intensity is kept constant. In our case, the intensity correlation functions measured in a wide time scale showed no regular pulse trains repeating intensity fluctuations observed at zero-time delay. Nevertheless, we believe that such a pulse regime can indeed occur, but that this is insufficient to explain the strong correlations observed between individual photons. In other words, the strong photon bunching should look like a pulse train in a high-power laser beam but the reverse is not automatically true; a high-power laser pulse train does not demand a strong photon bunching. For example, if we take a chaotic light source such as a neon lamp (Ne) and modulate its radiation with an external modulator, then intensity correlation experiments reveal the modulation envelope but the photons remain uncorrelated within the envelope. On the contrary, a quantum-correlated state implies correlations between the individual photon events.
Within the framework of a semiclassical theory, one can regard photon detection with SPADs as appropriate stationary random processes of the intensity fluctuations. We can see that functions g ( 2 ) and g i ( 2 ) have their maxima at zero-time delay, as should be the case for a stationary random process. This means that the maximum intensity correlation is observed at the wave front of the laser radiation (both for a pair of detectors, D1-D2, and for D3-D4). Then, one could expect a maximal correlation to be observed between detectors D1 and D3 at a time delay corresponding to the propagation time from the beamsplitter to the detector D3, namely, while the wave front measured with detector D1 arrives to detector D3. In other words, a short light pulse will give a maximum value of the autocorrelation function at zero-time delay when measured with detectors D1 and D2, as well as when measured with detectors D3 and D4. It would seem the same is true for detectors D1 and D3: such a pulse will give a maximum value of the cross-correlation function g i , ( 2 ) at a time delay corresponding to the propagation time of the pulse through the spectrometer and the output fiber to detector D3.
It should be noted that the cross-correlation curve shown in Figure 4 has a minimum at a point of the greatest value of correlations. The comparison of the curves clearly shows that the maxima of one curve coincides with the minima of the other curve and vice versa.
For the avoidance of any unexpected apparatus effects, we also measured the intensity correlation functions, where the first detector (D1) was illuminated with a Ne lamp, while a single-mode laser light was registered by the second detector (D3) (see Figure 5). In addition, the first detector was illuminated with a multimode laser light, while the second was used to register Ne light. In both cases, no correlation occurrences were revealed.

5. Conclusions

In conclusion, the measurements of second-order g(2) intensity correlation functions of a multimode semiconductor Fabry–Perot laser showed that its individual modes are not in coherent states, even though they have identical autocorrelation functions. These functions reveal a strong photon bunching followed by pronounced oscillations. The antibunching effect in the cross-correlation function measurements between the radiation of individual mode and the total radiation of the laser cannot be explained by the semiclassical theory of periodic pulse trains generated by a multimode semiconductor laser. Clearly, the quantum–mechanical model is needed to describe the generation of multimode light in an FP semiconductor laser.

Author Contributions

Writing—original draft preparation, M.L.; writing—review and editing, M.L. and A.P.; visualization, M.L., A.D. and A.P.; supervision, M.L.; project administration, M.L.; funding acquisition, O.M. All authors have read and agreed to the published version of the manuscript.

Funding

This research was funded by the Russian Foundation for Basic Research, grant number 20-02-00231.

Conflicts of Interest

The authors declare no conflict of interest.

References

  1. Klyshko, D.N. The nonclassical light. Phys. Uspekhi. 1996, 39, 573–596. [Google Scholar] [CrossRef]
  2. Pirandola, S.; Andersen, U.L.; Banchi, L.; Berta, M.; Bunandar, D.; Colbeck, R.; Englund, D.; Gehring, T.; Lupo, C.; Ottaviani, C.; et al. Advances in quantum cryptography. Adv. Opt. Photonics 2020, 12, 1012–1236. [Google Scholar] [CrossRef] [Green Version]
  3. Ladd, T.D.; Jelezko, F.; Laflamme, R.; Nakamura, Y.; Monroe, C.; O’Brien, J.L. Quantum computers. Nature 2010, 464, 45–53. [Google Scholar] [CrossRef] [PubMed] [Green Version]
  4. Pirandola, S.; Eisert, J.; Weedbrook, C.; Furusawa, A.; Braunstein, S.L. Advances in Quantum Teleportation. Nat. Photonics 2015, 9, 641–652. [Google Scholar] [CrossRef]
  5. Zwinkels, J.C.; Ikonen, E.; Fox, N.P.; Ulm, G.; Rastello, M.L. Photometry, radiometry and ‘the candela’: Evolution in the classical and quantum world. Metrologia 2010, 47, R15–R32. [Google Scholar] [CrossRef] [Green Version]
  6. Kwiat, P.; Mattle, K.; Weinfurter, H.; Zeilinger, A.; Sergienko, A.V.; Shih, Y. New High-Intensity Source of Polarization-Entangled Photon Pairs. Phys. Rev. Lett. 1995, 75, 4337–4341. [Google Scholar] [CrossRef] [PubMed] [Green Version]
  7. Bock, M.; Lenhard, A.; Chunnilall, C.; Becher, C. Highly efficient heralded single-photon source for telecom wavelengths based on a PPLN waveguide. Opt. Express 2016, 24, 23992–24001. [Google Scholar] [CrossRef] [PubMed]
  8. Knill, E. Quantum computing with realistically noisy devices. Nature 2005, 434, 39–44. [Google Scholar] [CrossRef] [PubMed] [Green Version]
  9. Michler, P.; Kiraz, A.; Becher, C.; Schoenfeld, W.V.; Petroff, P.M.; Hu, E.; Zhang, L.; Imamoglu, A. A quantum dot single-photon turnstile device. Science 2000, 290, 2282–2285. [Google Scholar] [CrossRef] [PubMed] [Green Version]
  10. Andersen, U.L.; Gehring, T.; Marquardt, C.M.; Leuchs, G. 30 years of squeezed light generation. Phys. Scr. 2016, 91, 053001. [Google Scholar] [CrossRef]
  11. Lebedev, M.V.; Parakhonskii, A.L.; Demenev, A.A. Generation of nonclassical light upon resonant excitation of a semiconductor microcavity. JETP Lett. 2015, 102, 571–576. [Google Scholar] [CrossRef]
  12. Eleuch, H. Photon statistics of light in semiconductor microcavities. J. Phys. B At. Mol. Opt. Phys. 2008, 41, 055502. [Google Scholar] [CrossRef]
  13. Demenev, A.A.; Domaretskii, D.R.; Parakhonskii, A.L.; Lebedev, M.V. On the origin of nonclassical light generation upon resonant excitation of a GaAs semiconductor microcavity. JETP Lett. 2017, 106, 549–554. [Google Scholar] [CrossRef]
  14. Yacomotti, A.M.; Furfaro, L.; Hachair, X.; Pedaci, F.; Giudici, M.; Tredicce, J.; Javaloyes, J.; Balle, S.; Viktorov, E.A.; Mandel, P. Dynamics of multimode semiconductor lasers. Phys. Rev. A 2004, 69, 053816. [Google Scholar] [CrossRef] [Green Version]
  15. Lebedev, M.V.; Demenev, A.A.; Parakhonsky, A.L.; Misochko, O.V. Multimode semiconductor laser: Quantum versus classical behavior. J. Russ. Laser Res. 2019, 40, 64–70. [Google Scholar] [CrossRef] [Green Version]
  16. Lebedev, M.; Demenev, A.; Parakhonsky, A.; Misochko, O. A triple correlator of radiation intensities of a multimode semiconductor laser. Optics 2020, 1, 32–39. [Google Scholar] [CrossRef] [Green Version]
Figure 1. Schematic of the experimental setup. The laser is the multimode semiconductor FP laser [2]. NF is a neutral density filter. BS is a beamsplitter (a parallel-sided glass plate). FBS1 and FBS2 are fiber-Y-splitters. f1 and f2 are multimode optical fibers. D1, D2, D3 and D4 are single-photon detectors (silicon avalanche photodiodes) or SPADs (Perkin and Elmer Ltd.; quantum efficiency of 30%). L1 and L2 are lenses. Ramanor U1000 is a triple-grating spectrometer. The gratings have 1800 grooves/mm. The multimode spectrum of the laser is shown in the bottom right corner of the figure.
Optics 03 00006 g001
Figure 2. The second-order intensity correlation function of the multimode FP laser radiation.
Optics 03 00006 g002
Figure 3. The intensity correlation functions of single modes. All the functions are almost identical. The inset shows four selected functions close to the first minimum corresponding to four single modes (red curve: λ = 8510.7 Å, blue curve: λ = 8533.5 Å, green curve: λ = 8535.0 Å and dark yellow curve: λ = 8538.0 Å).
Optics 03 00006 g003
Figure 4. The intensity cross-correlation function (red curve) measured between all modes and a single mode (λ = 8550.6 Å). The intensity correlation function of the multimode radiation is shown once again for the comparison (grey curve). The black arrow denotes the position of a maximum value for the multimode autocorrelation function.
Optics 03 00006 g004
Figure 5. The intensity cross-correlation function between a Ne lamp and a single mode of the laser studied.
Optics 03 00006 g005
Publisher’s Note: MDPI stays neutral with regard to jurisdictional claims in published maps and institutional affiliations.

