Article

Design Simulation of Czerny–Turner Configuration-Based Raman Spectrometer Using Physical Optics Propagation Algorithm

1
Research Laboratory of Lasers (RLL)-Group of Laser Development (GoLD), Department of Physics, Syed Babar Ali School of Science and Engineering, Lahore University of Management Sciences (LUMS), Sector U D.H.A, Lahore 54792, Pakistan
2
Department of Physics, COMSATS University Islamabad, Park Road, Islamabad 45550, Pakistan
3
Department of Physics, University of Central Florida, Orlando, FL 32816, USA
*
Author to whom correspondence should be addressed.
Optics 2022, 3(1), 1-7; https://doi.org/10.3390/opt3010001
Submission received: 12 September 2021 / Revised: 8 December 2021 / Accepted: 14 December 2021 / Published: 5 January 2022

Abstract

:
We report the design simulation of the Raman spectrometer using Zemax optical system design software. The design is based on the Czerny–Turner configuration, which includes an optical system consisting of an entrance slit, two concave mirrors, reflecting type diffraction grating and an image detector. The system’s modeling approach is suggested by introducing the corresponding relationship between detector pixels and wavelength, linear CCD receiving surface length and image surface dimension. The simulations were carried out using the POP (physical optics propagation) algorithm. Spot diagram, relative illumination, irradiance plot, modulation transfer function (MTF), geometric and encircled energy were simulated for designing the Raman spectrometer. The simulation results of the Raman spectrometer using a 527 nm wavelength laser as an excitation light source are presented. The present optical system was designed in sequential mode and a Raman spectrum was observed from 530 nm to 630 nm. The analysis shows that the system’s image efficiency was quite good, predicting that it could build an efficient and cost-effective Raman spectrometer for optical diagnostics.

1. Introduction

Spectrometry is a general term used for analyzing the specific spectrum and employed for the analysis of materials. Raman spectrometry [1] is used to study molecular structures, identify molecules in unknown samples and give spectral information [2]. Jin Xinghuan et al. designed the modern grating-based Raman spectrometer. The spectral resolution, wavelength range and the simple spectrometer’s structural parameters are the contemporary way of thinking geometrical models [3].
Different designs of the Raman spectrometer have been published. Wang et al. designed a crossed Czerny–Turner spectrometer using convergent illumination of the grating for the fluorescence spectrum of the organic particles [4]. Yinchao Zhang and Chen Wang proposed a double-grating monochromator with a different fiber arrangement [5]. The Offner system with a convex grating is exceptional in aberration correction and distortion control [5,6]. Czerny and Turner first showed that the coma aberration introduced by the off-axis reflection from a spherical mirror could be corrected by a symmetrical but oppositely oriented spherical mirror in spectrometer design [7]. The Czerny–Turner imaging spectrometer, a plane grating and two spherical mirrors are configured in a coma-free geometry with the Shafer equation used to resolve spectral intensity [8].
Here, we introduce the design simulation of the Raman spectrometer’s optical structure using plain, reflecting grating and a focusing spherical mirror, shortening the overall system’s length to obtain higher resolution, thus enabling the development of a robust and low-cost Raman spectrometer for optical measurements in the laboratory.

2. Design Parameters for the Simulation of the Raman Spectrometer

The different designing parameters, such as the surface type of each lens, the radius of curvature, thickness and focal length, were chosen in the lens data editor window in Zemax [9], as shown in Table 1. We adopted the physical optics propagation (POP) algorithm over geometrical ray-tracing because geometrical ray-tracing can only be used when diffraction limits are negligible.
A typical spectrometer consists of a source light, an entrance slit, spherical collimating and focusing mirrors, grating and CCD (charge-coupled device) detector [10]. Diffraction gratings are extraordinary due to their imaging efficiency in terms of resolution and lowest wavefront aberration. However, they are usually unable to achieve a flat focus curve [11], so a spherical mirror is needed to concentrate the subject on the image surface. Figure 1A shows the schematic diagram representing the layout for the Raman spectrometer’s optical configuration. Raman scattered light from the sample is focused on the entrance slit with the focusing lens of numerical aperture 0.16, further collimated with collimating mirrors and incident on the diffraction grating. The Raman signal is diffracted from the grating and split up into its components focused on the CCD camera through the focusing mirror (Figure 1A). The radius of the curvature of the collimating and focusing mirror is R 1 and R 2 , respectively.
A sample is usually defined before the entrance slit of the spectrometer. The upper and the lower energy levels of the sample have certain vibrational levels in an electronic state which can be represented by horizontal lines in an energy state. The vibrational transition can occur when molecules move from one vibrational level to another energy level. By monitoring the vibrational transition, one can identify and study the functional groups or chemical substances.
We chose a 527 nm center wavelength laser as the light source, whose energy was equal to the energy bandgap between the sample’s upper and lower energy levels. The sample absorbs the incident light and excites to the upper energy level. Electrons in the excited state decay to a lower vibrational level through a non-radiative process and then decay to a lower energy level and emit photons of different energy called the Raman spectrum. The Raman spectrum of a sample is usually distributed in the range from 200 to 2500 cm 1 [3] and the Raman spectrum wavelength range observed in the experiment was from 530 nm to 630 nm. A 1024 × 1024 pixels charge-coupled device (CCD) was chosen to record the spatial profile. The scale of each pixel was (5 × 5) μ m and the receiving surface of CCD was 1.25 cm 2 . The numerical aperture (NA) of the object side was chosen to be 0.16, while the grating constant was 0.100 lines/ μ m and the width of the slit was 30 μ m. We chose the CCD size, which was comparable to the image plane [12].
The initial parameters of the system design are shown in Table 2.
The ray tracing of the Raman spectrometer is shown in Figure 1B. The angles ϕ 1 and ϕ 2 are the diffraction angles of the two edge wavelengths after passing through the diffraction grating; they intersect the focusing mirror at A and B. σ 1 and σ 2 are the angles between the reflected light of the two edge wavelengths on the focusing mirror and the horizontal line. Finally, they gather on points C and D of the linear CCD. For the references of the mathematical formulas, we refer the reader to the references [4,5,8,10]. Using the diffraction grating formula
d sin θ = n λ
where d is the grating constant, the diffraction angles ϕ 1 and ϕ 2 can be calculated as
d ( sin α + sin ϕ 1 ) = n λ 1
d ( sin α + sin ϕ 2 ) = n λ 2
Taking the diffraction order equal to 1 (n = 1), the minimum size (length) of the focusing mirror to reflect the two edge wavelengths according to the geometrical structure is given as
A B = x 2 × [ tan ( α + ϕ 1 ) [ tan ( α + ϕ 2 ) ]
After reflection from the focusing mirror, the horizontal angle of the diffracted rays is changed by 2 θ as given below:
σ = α + ϕ 2 θ
Finally, the size of the image is calculated using the geometrical structure
C D = A B x 3 × [ tan ( σ 2 ) tan ( σ 1 ) ]
Equation (6) shows the minimum length of the CCD detector surface. Based on the original configuration and using the Equations (1)–(6), all the necessary parameters to design the Raman spectrometer can be determined.

3. Simulation Results and Analysis

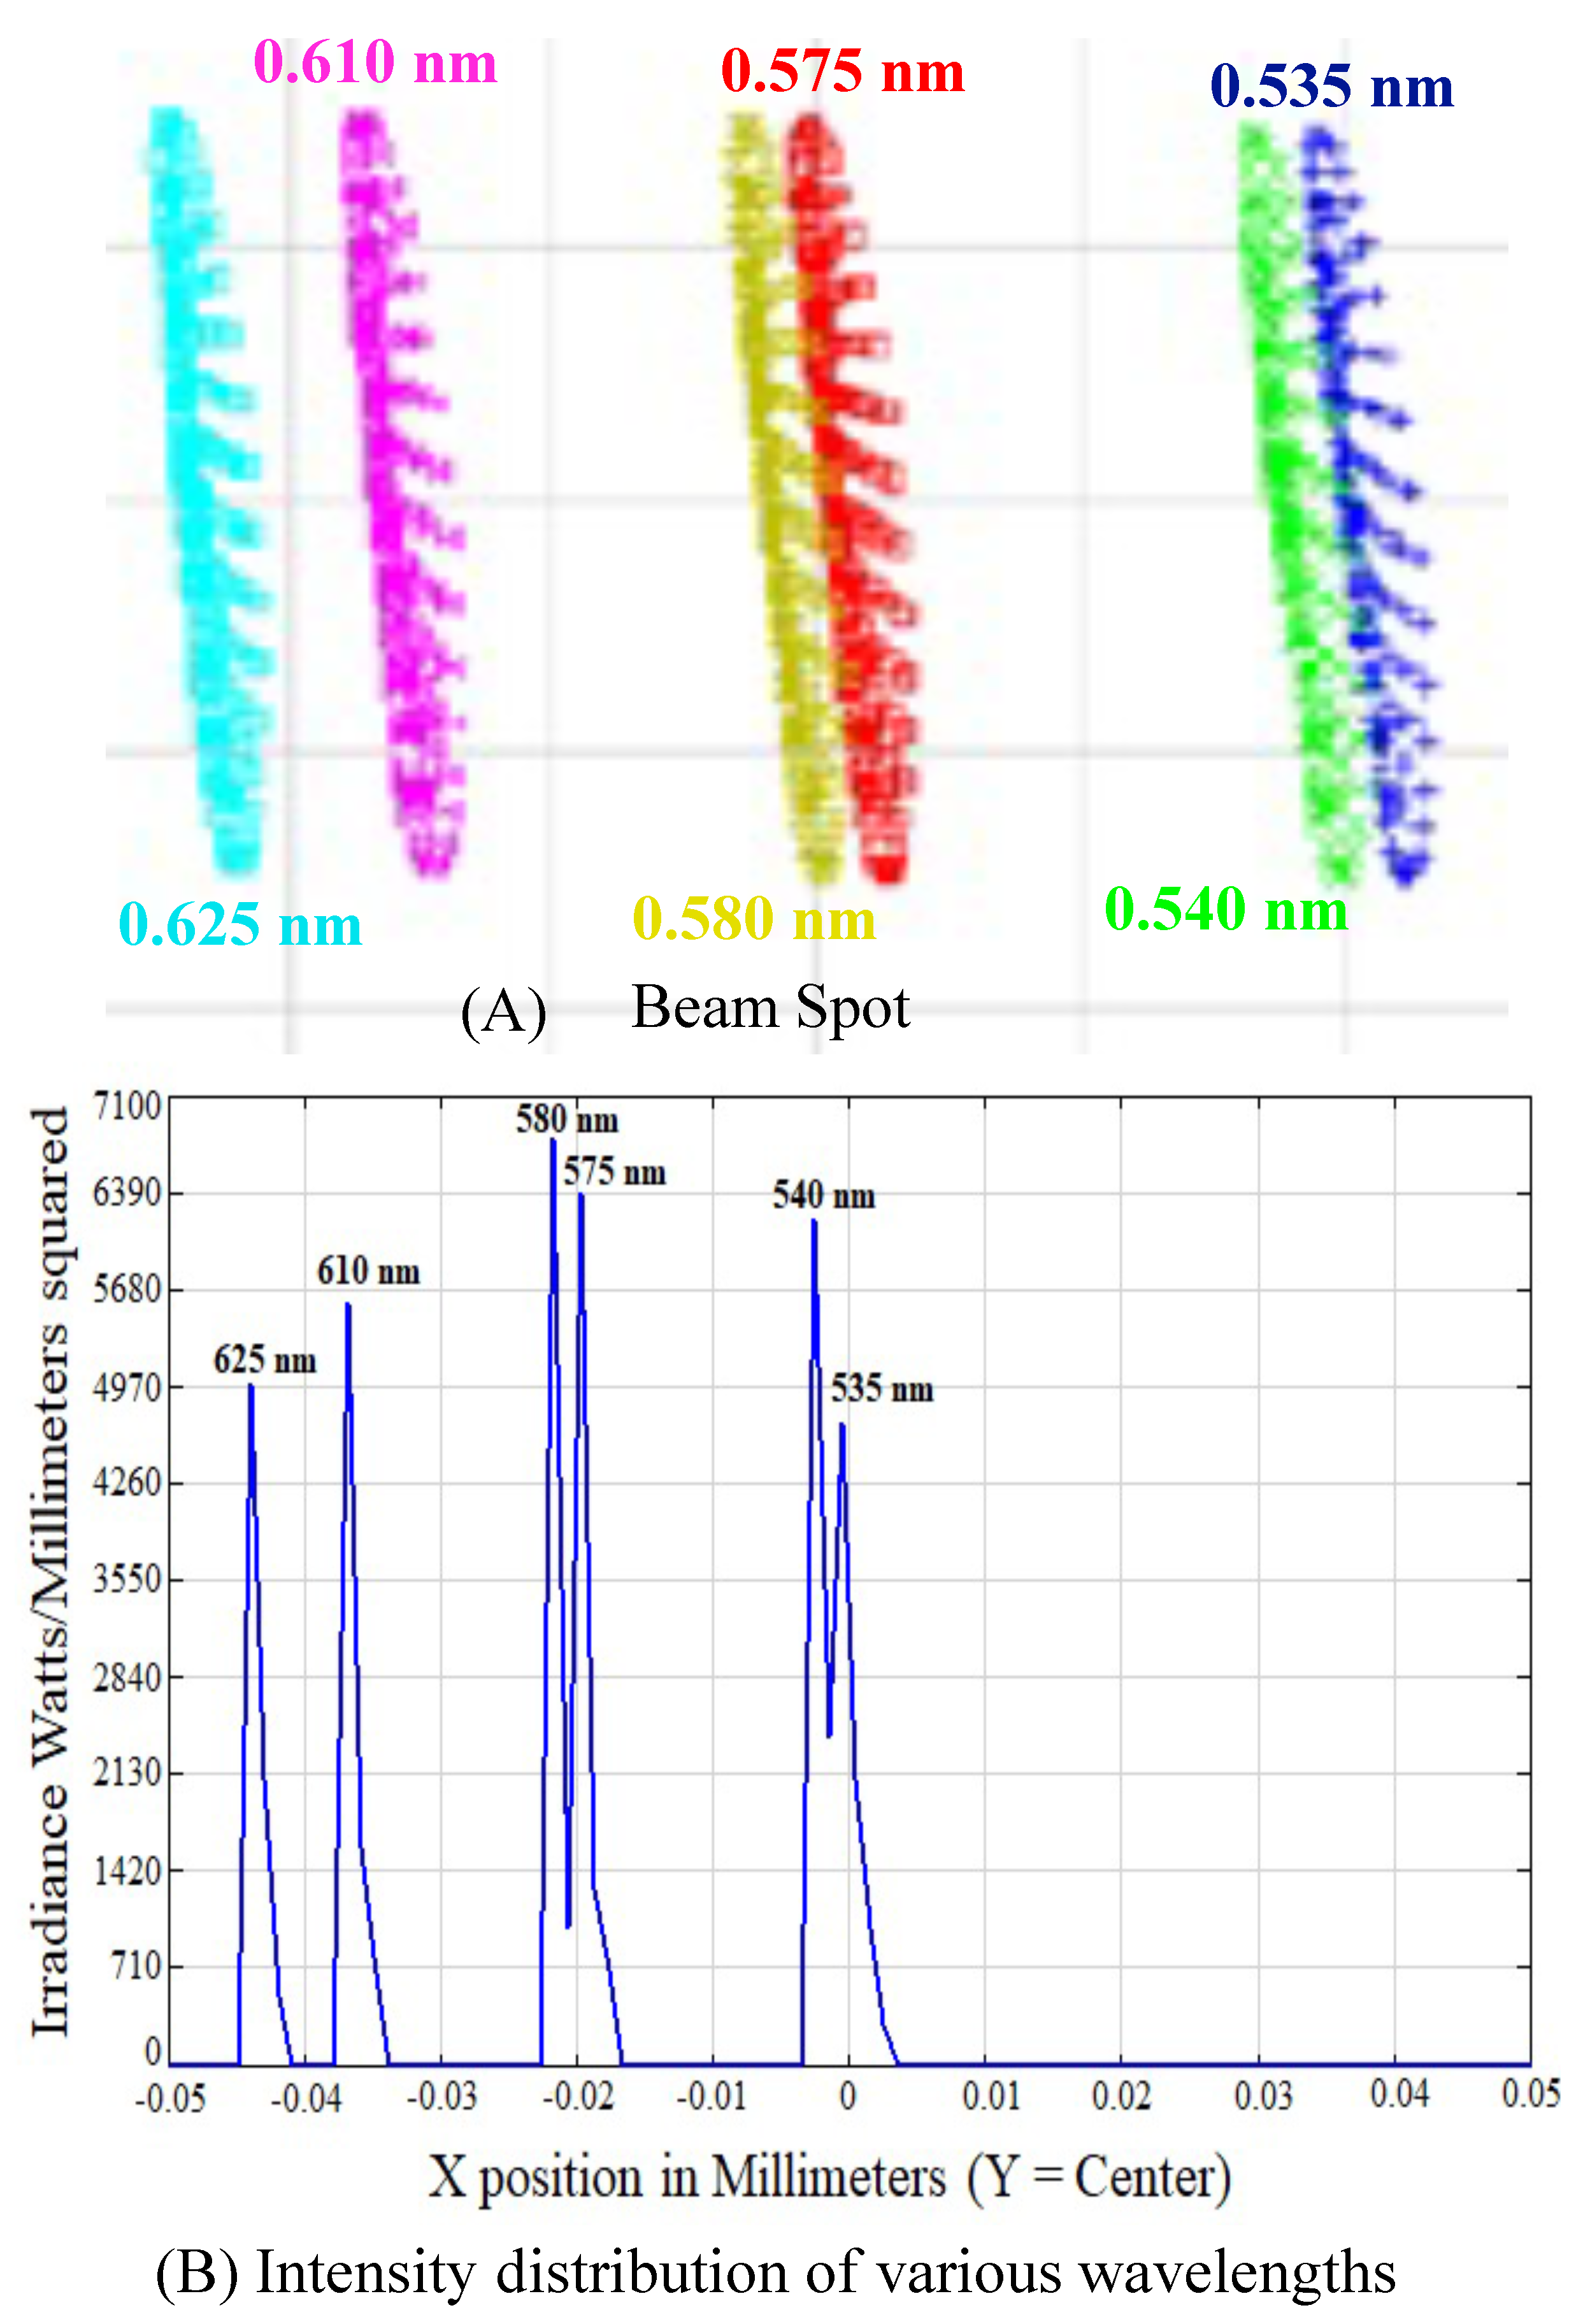
After optimization, x 1 increased to 3 mm. The light diffracted by the grating had a certain convergence angle, corresponding to x 3 , and it was reduced to 4.5 mm, whereas other parameters, such as detector size and pixels, and mirror focal length remained unchanged. The optimized spot diagram of the adjacent wavelengths is shown in Figure 2A. The image formed on the spectrometer’s image plane showed that the adjacent wavelengths at different positions were well separated and distinguishable, as shown in Figure 2B.
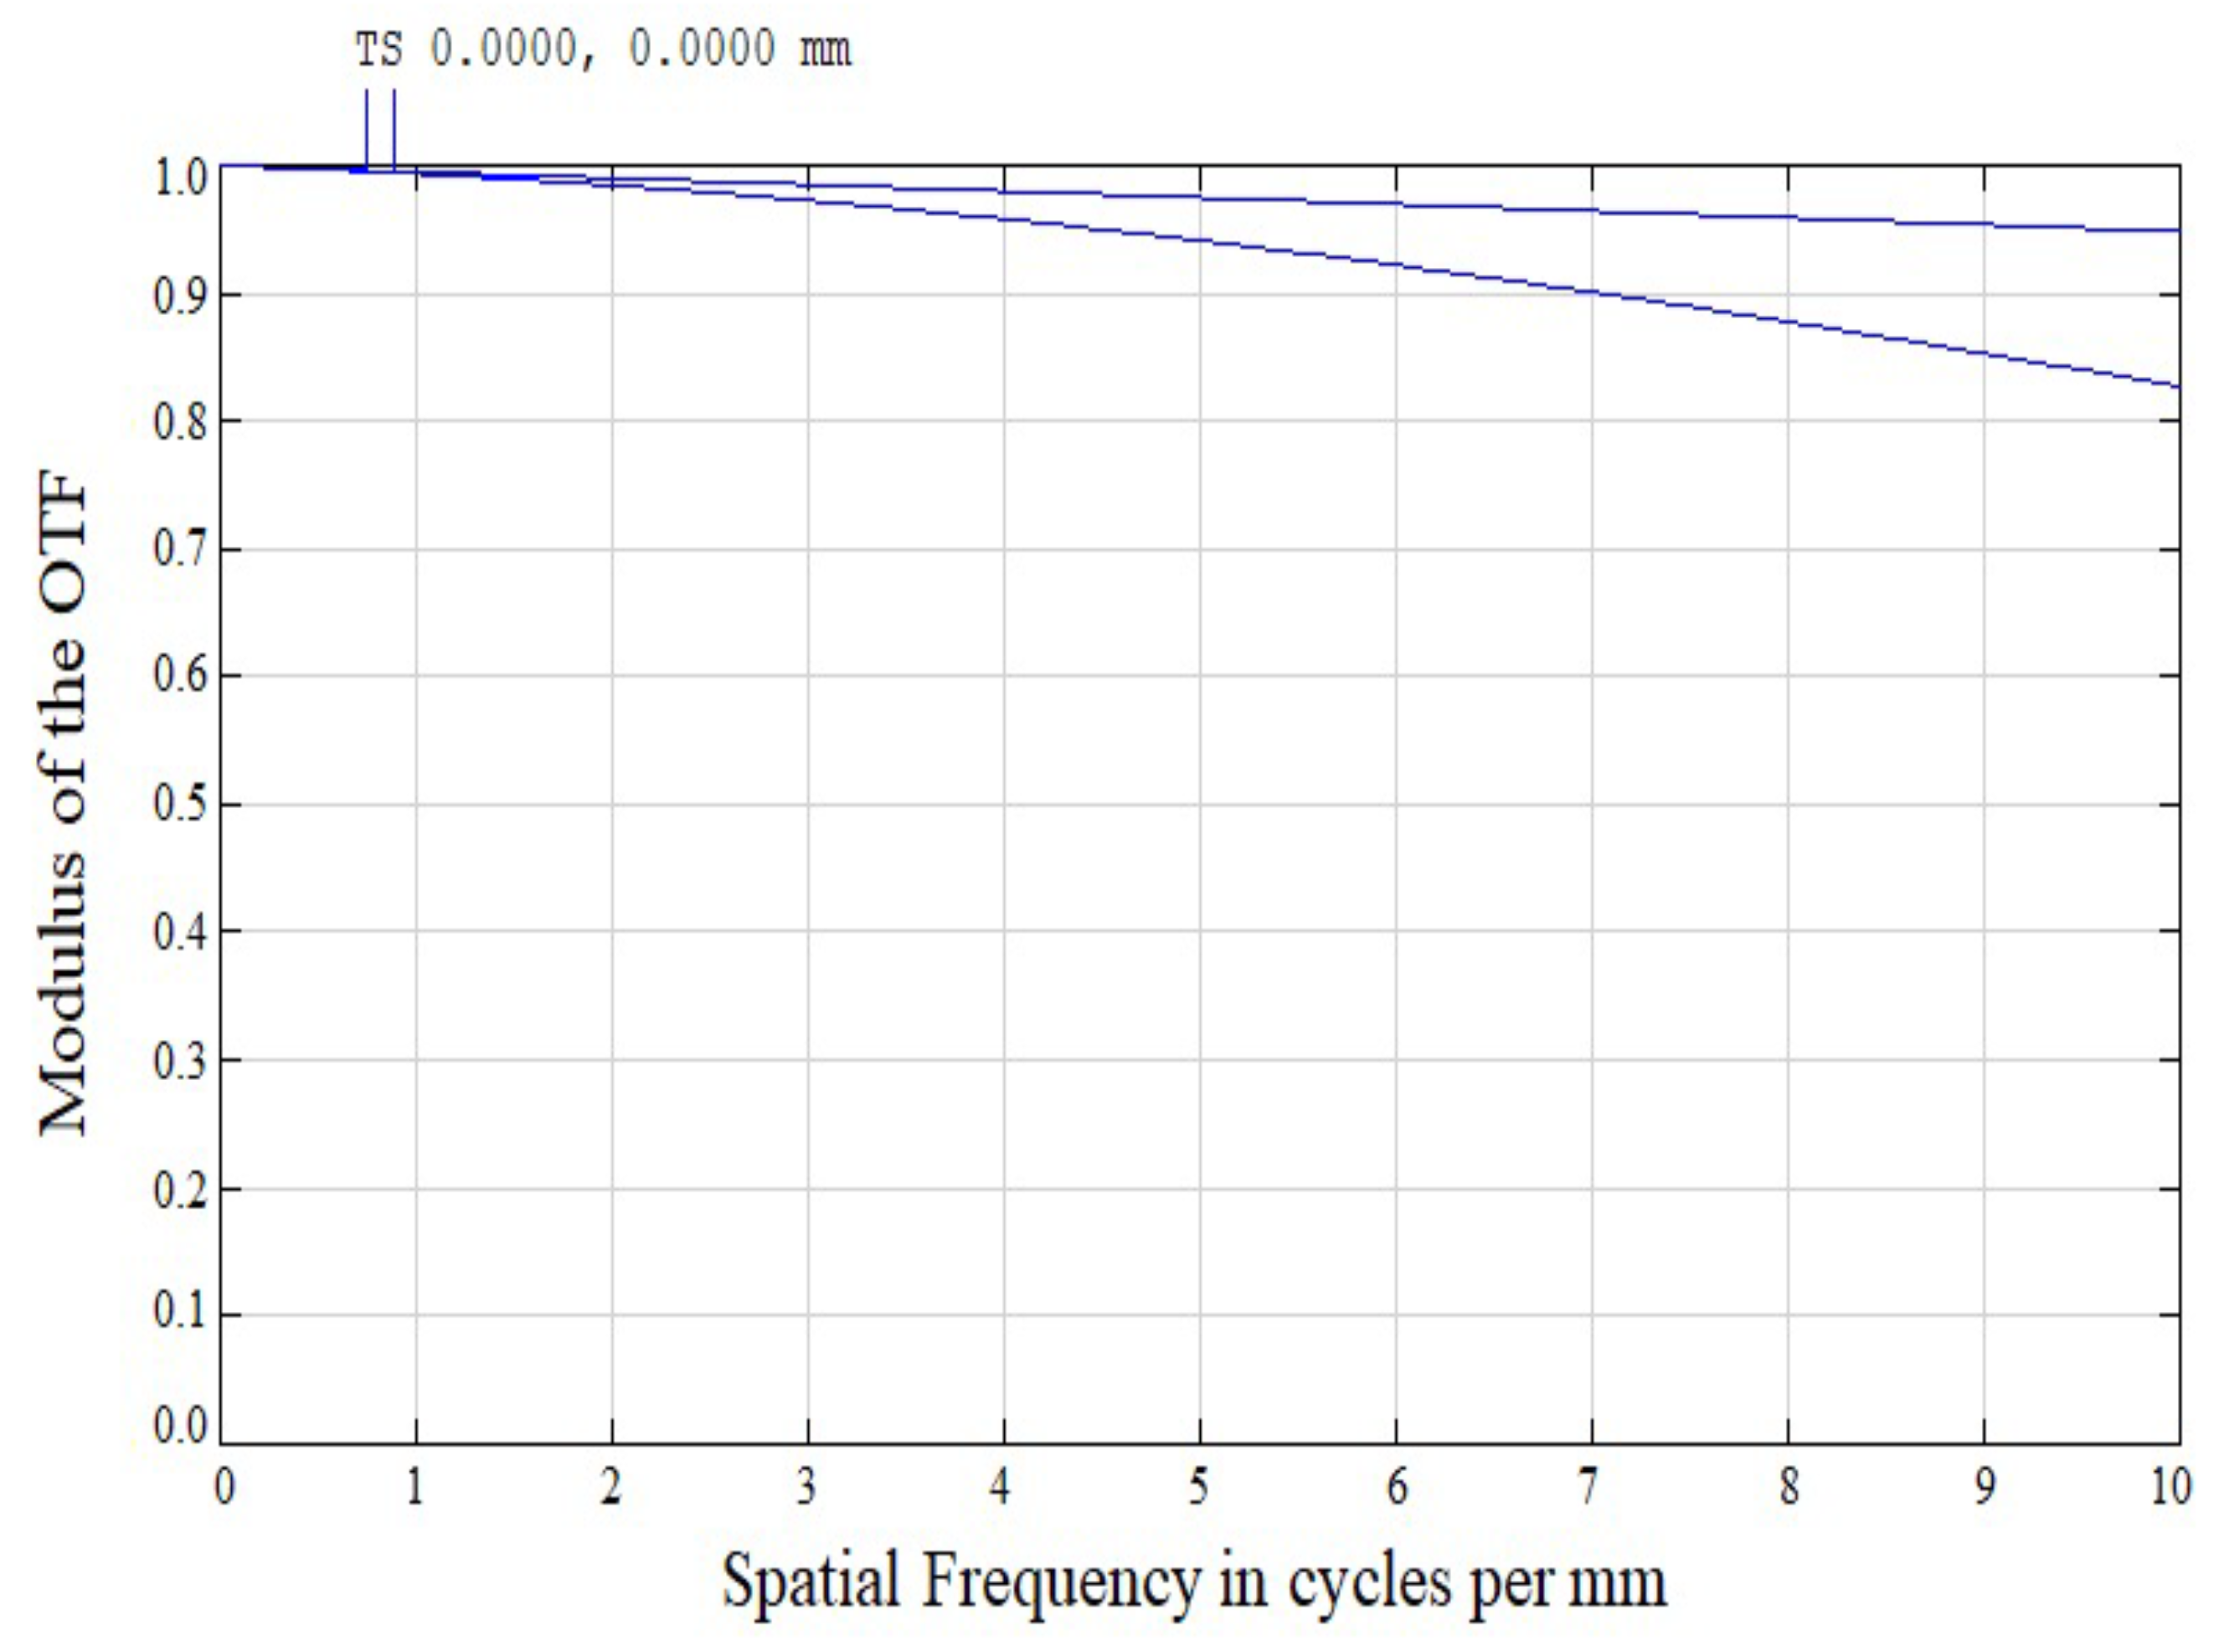
It can be seen, from Figure 2B, that the energy spectrum of the neighboring wavelengths at various wavelengths could be easily distinguished. The modulation transfer function (MTF) diagram, which describes the spatial response of our Raman spectrometer at the center wavelength (575 nm), is shown in Figure 3. It gives the contrast ratio between the input and output images. The MTF curve was approximately the same in the whole band. Therefore, the curve of the center wavelength is demonstrated in Figure 3. The MTF shows how the spatial frequency content of the entity is correctly transferred to the image and describes the performance of the optical system. The higher the value of the MTF, the greater the image quality of the device is. As shown in Figure 3, when the spatial frequency was 10 per mm 1 , the optical transfer function (OTF) was more significant than 0.8, which means that the efficiency of the designed spectrometer system was higher [13].
All results were obtained in the Sequential Mode of Zemax. In this mode, the slit width can be measured only by increasing the height of the point light source. Following the above settings to trace the light, the results obtained in this mode are closer to the real-world observations.
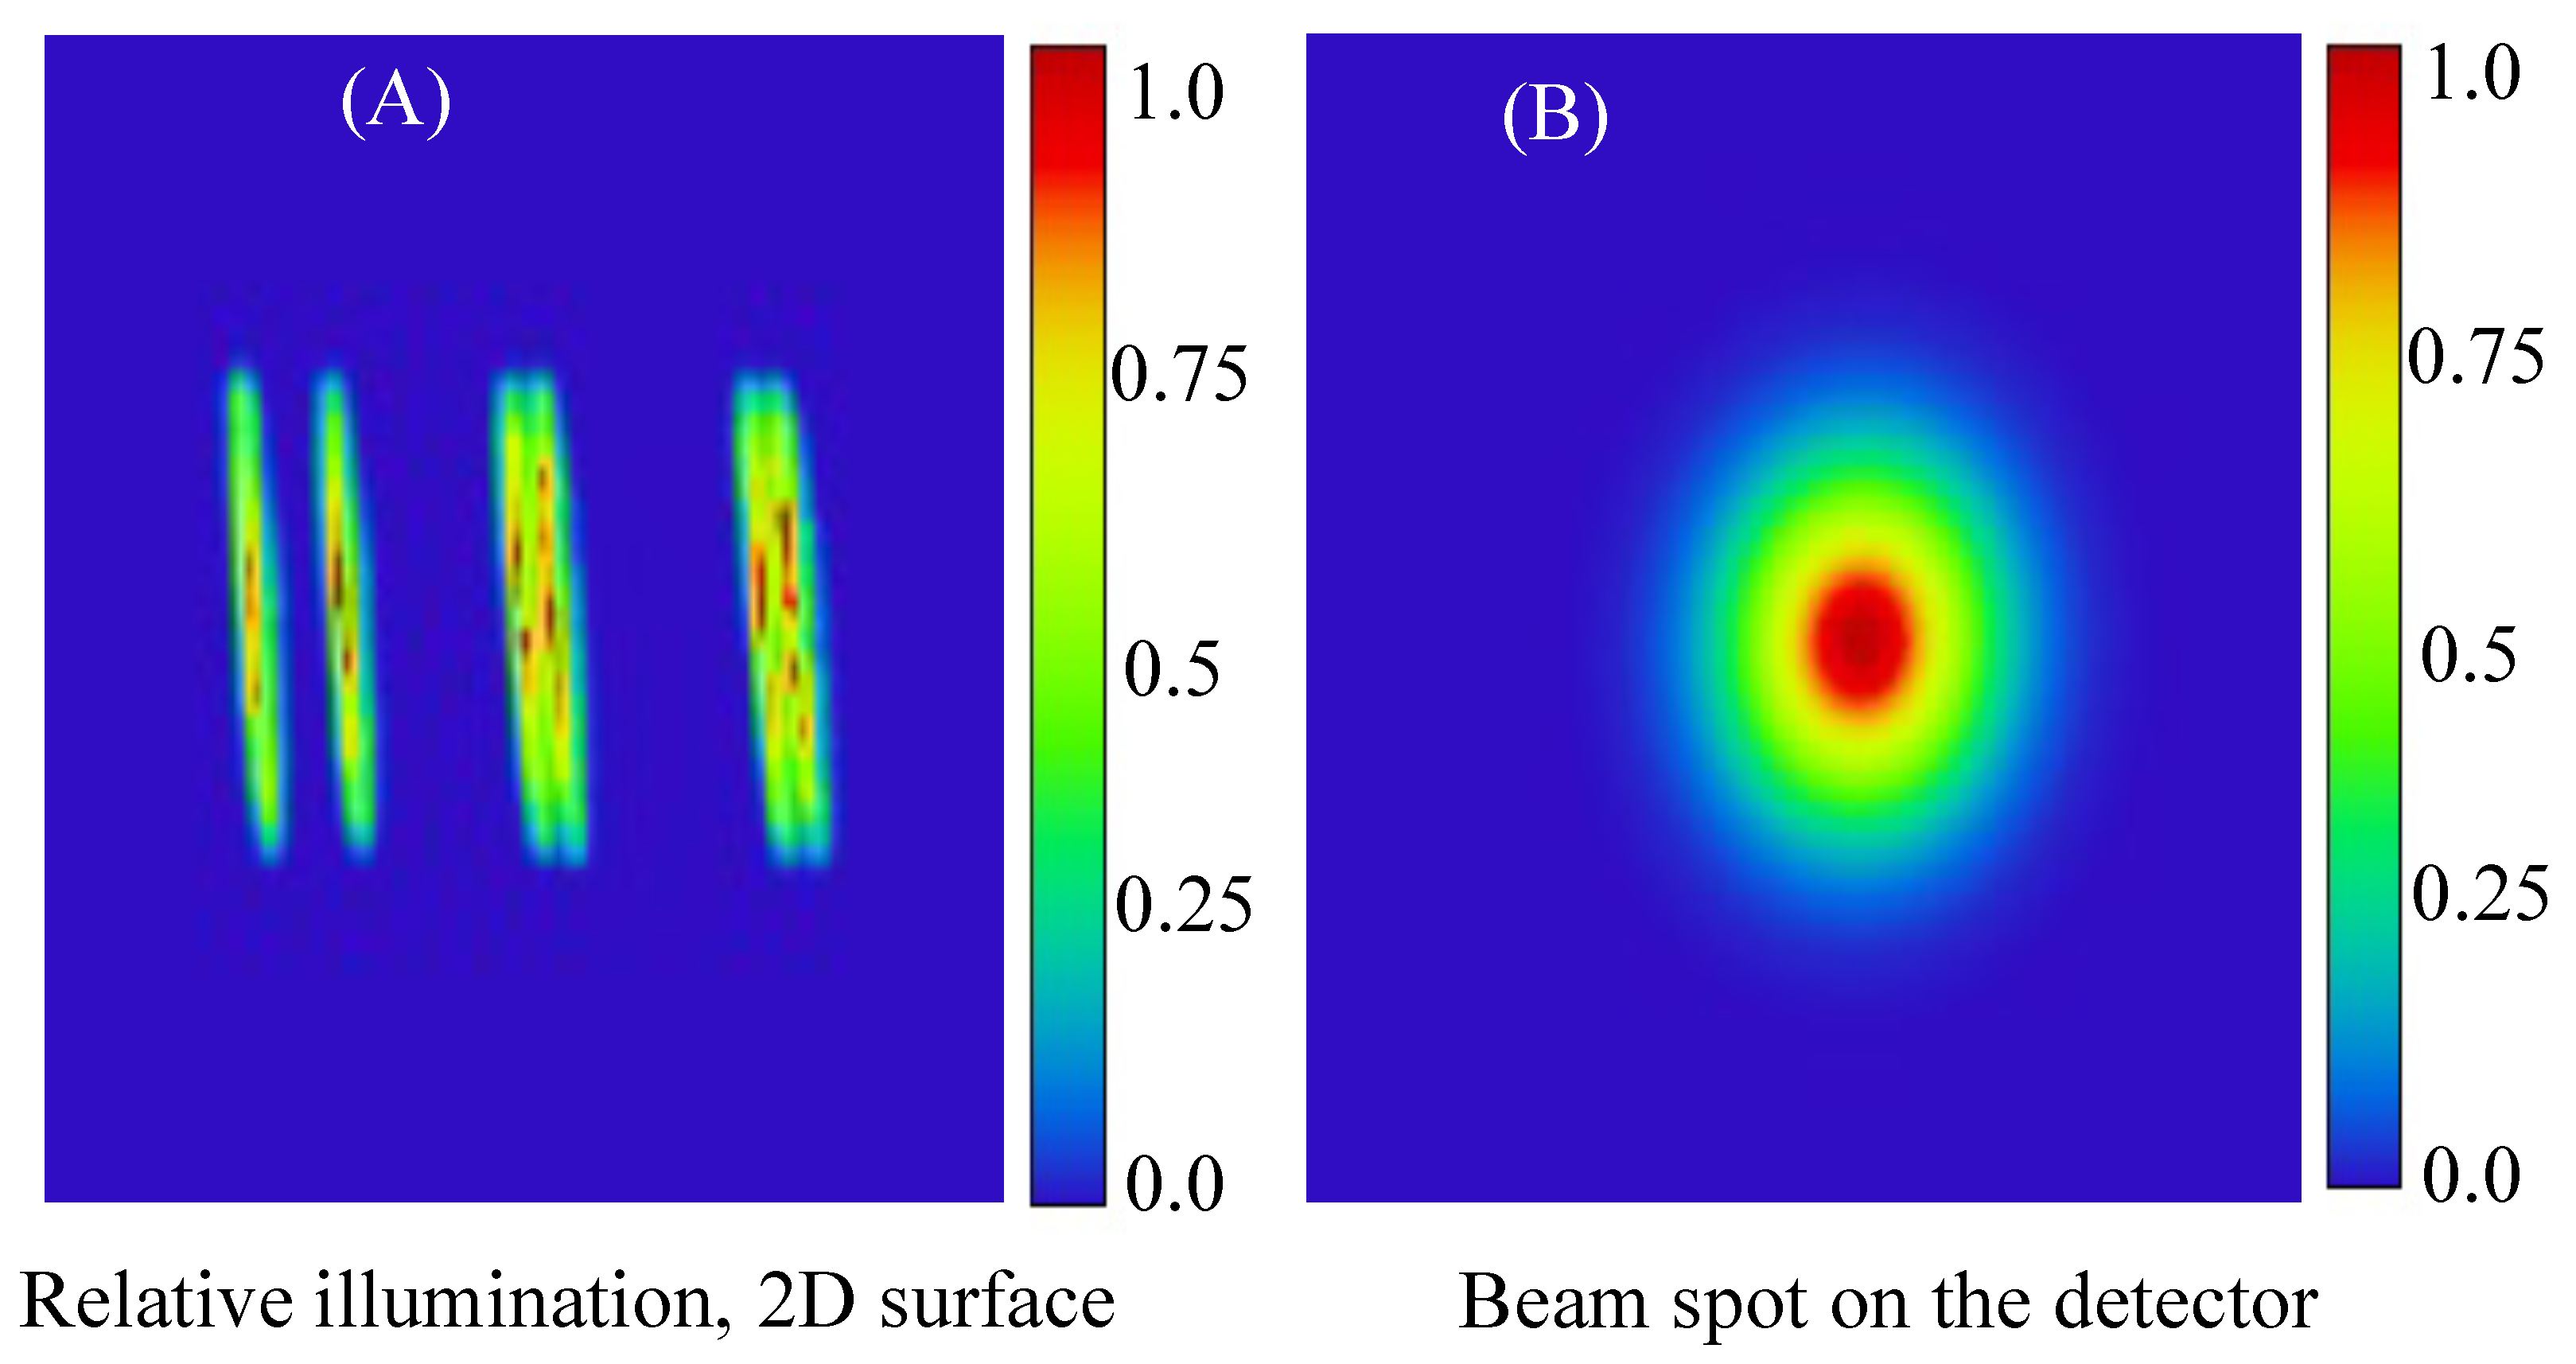
The intensity distribution of adjacent wavelengths shown in Figure 4A shows the intensity distribution of all the different wavelengths expressed by the geometric linear response function. The linear response function is the cross-sectional representation of the image density distribution [14]. The length and width of the receiving surface of the detector were 10 mm and 5 mm, respectively. The wavelength band imaged on the detector and the images produced by the two edge rays were similar to the two ends of the detector (Figure 4A). Using the CCD, the light of the neighboring wavelengths of separate bands could also be separated, which indicates that the illumination of the adjacent wavelengths was easily separable and distinguishable with the present detector pixels. This finding further shows the functional viability of this system. The radiant flux received by the detector surface per unit area and beam spot size at the detector surface for a 580 nm wavelength is shown in Figure 4B.
I 1 / λ 4
Illuminations at longer wavelengths result in a decrease in Raman signals. There is less illumination for a higher wavelength (total irradiance) than the lower wavelength in the Raman spectrometer, so the above relation worked correctly in our designed Raman spectrometer. The optical term encircled energy describes the energy concentration in the optical picture or predicted laser in a defined area. We observed the energy concentration variations concerning the change in the size of the image on the detector; as the point image’s size increased, the fraction of enclosed energy increased, which is consistent with what reported in [15].

4. Conclusions

The Raman spectrometer utilizing diffraction grating incorporates the standard Czerny–Turner system features with the flat-field grating spectrometer system. The spectrometer system’s modeling approach is suggested by introducing the corresponding relationship among pixel and wavelength, linear CCD receiving surface length and image surface dimension. The excitation light with a center wavelength of 527 nm was used for simulation and optimization in the Zemax optical modeling program. Spot diagram, irradiance plot, MTF and geometric encircled energy for the Raman spectrum of the sample, which lie in the visible range, were simulated. The analysis showed that the image efficiency of the system was higher and Raman spectra could be obtained from a sample using the above-designed Raman spectrometer system. This study could pave the way for developing a robust, miniature, compact and low-cost Raman spectrometer for optical measurements.

Author Contributions

Conceptualization, T.I. and A.S.B.; data curation, formal analysis and writing of first draft, M.N., N.-u.-a.F., M.H. and T.I.; writing—review and editing, M.N., M.H., T.I. and A.S.B.; supervision, funding acquisition and resources, T.I. and A.S.B. All authors have read and agreed to the published version of the manuscript.

Funding

This research received no external funding.

Institutional Review Board Statement

Not applicable.

Informed Consent Statement

Not applicable.

Data Availability Statement

The data of this article are available on arXiv at the following link: https://arxiv.org/abs/2108.00292.

Conflicts of Interest

The authors declare no conflict of interest.

References

  1. Baranska, H.; Anna, L.; Jacek, T. Laser Raman Spectrometry: Analytical Applications; Ellis Horwood: Chichester, UK; Wiley: New York, NY, USA; PWN-Polish Scientific Publishers: Warsaw, Poland, 1987; Volume 38, pp. 138–139. Available online: https://www.osti.gov/biblio/6748775 (accessed on 10 September 2021).
  2. Stöckle, R.M.; Suh, Y.D.; Deckert, V.; Zenobi, R. Nanoscale chemical analysis by tip-enhanced Raman spectroscopy. Chem. Phys. Lett. 2000, 318, 131–136. [Google Scholar] [CrossRef]
  3. Jin, X.; Chen, H.; Dong, J.; Chen, S.; Guo, P.; Zhang, Y. Optical design of concave grating Raman spectrometer. Chin. J. Opt. 2015, 35, 0930004–1. [Google Scholar]
  4. Wang, C.; Chen, H.; Zhang, Y.; Chen, S.; Guo, P.; Wang, L. Optical design of a crossed Czerny–Turner spectrometer with a linear array photomultiplier tube. Appl. Opt. 2019, 58, 7789–7794. [Google Scholar] [CrossRef] [PubMed]
  5. Zhang, Y.; Wang, C.; Chen, H.; Chen, S.; Guo, P.; He, J.; Wang, L. Optical design of a crossed double-grating spectrometer for extracting pure rotational Raman lines of N2. Opt. Lasers Eng. 2020, 134, 106291. [Google Scholar] [CrossRef]
  6. Prieto-Blanco, X.; Montero-Orille, C.; González-Nuñez, H.; Mouriz, M.D.; Lago, E.L.; de la Fuente, R. The Offner imaging spectrometer in quadrature. Opt. Express 2010, 18, 12756–12769. [Google Scholar] [CrossRef] [PubMed]
  7. Lee, K.S.; Thompson, K.P.; Rolland, J.P. Broadband astigmatism-corrected Czerny–Turner spectrometer. Opt. Express 2010, 18, 23378–23384. [Google Scholar] [CrossRef] [PubMed]
  8. Shafer, A.B.; Megill, L.R.; Droppleman, L. Optimization of the Czerny–Turner spectrometer. JOSA 1964, 54, 879–887. [Google Scholar] [CrossRef]
  9. Available online: https://www.zemax.com/products/opticstudio (accessed on 10 September 2021).
  10. Tang, M.; Fan, X.; Wang, X.; Xu, Y.; Que, J.; He, J. General study of asymmetrical crossed Czerny—Turner spectrometer. Appl. Opt. 2015, 54, 9966–9975. [Google Scholar] [CrossRef] [PubMed]
  11. Lerner, J.M.; Chambers, R.J.; Passereau, G. Flat field imaging spectroscopy using aberration corrected holographic gratings. Int. Soc. Opt. Photonics 1981, 268, 122–128. [Google Scholar]
  12. An, Y.; Liu, Y.; Sun, Q. Design and development of optical system for portable Raman spectrometer. Acta Opt. Sin. 2013, 33, 0330001. [Google Scholar] [CrossRef]
  13. Park, S.K.; Schowengerdt, R.; Kaczynski, M.A. Modulation-transfer-function analysis for sampled image systems. Appl. Opt. 1984, 23, 2572–2582. [Google Scholar] [CrossRef] [PubMed]
  14. Li, Y.; Oldendick, J.; Ordonez, C.E.; Chang, W. The geometric response function for convergent slit-slat collimators. Phys. Med. Biol. 2009, 54, 1469. [Google Scholar] [CrossRef] [PubMed] [Green Version]
  15. Everson, M.; Duma, V.F.; Dobre, G. Geometric and Radiometric Vignetting Associated with a 72-Facet, Off-Axis, Polygon Mirror for Swept Source Optical Coherence Tomography (SS-OCT); AIP Publishing LLC: Melville, NY, USA, 2017; Volume 1796, p. 04004. [Google Scholar]
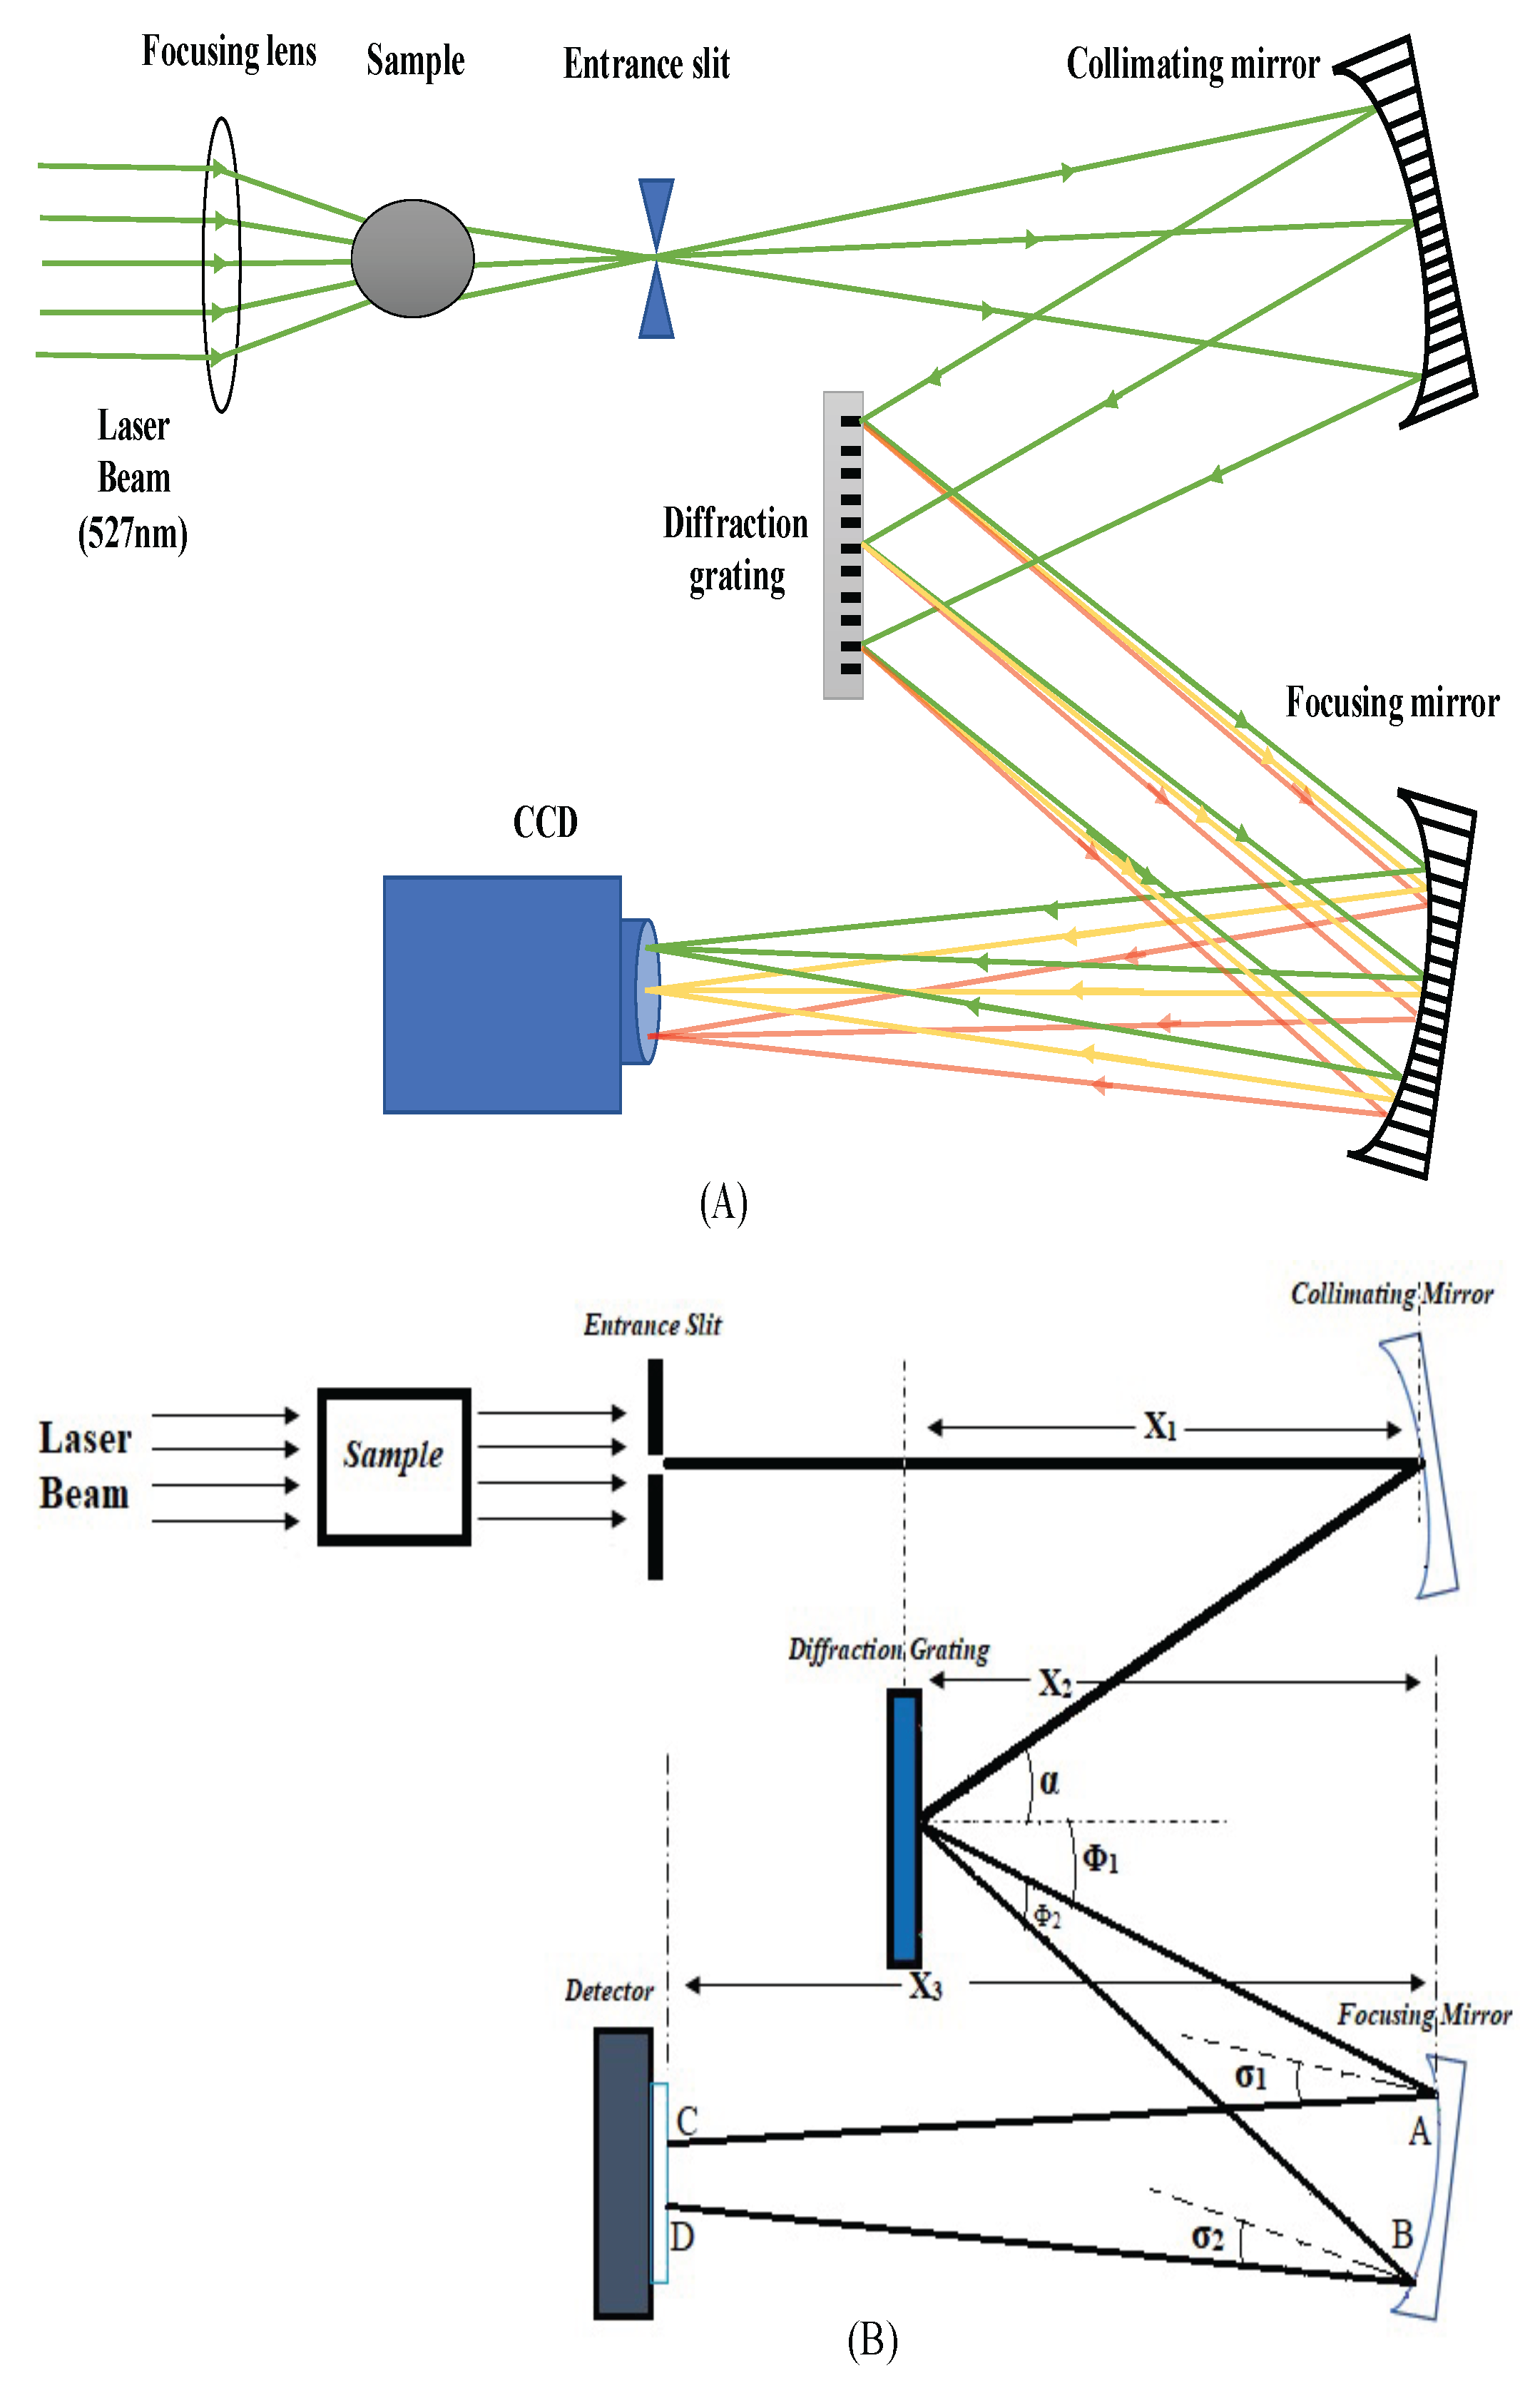
Figure 1. (A) Layout of Raman spectrometer: A laser beam is scattered from samples; this passes through the slit, is collimated by a mirror and is directed to diffraction grating, which resolves the wavelengths, which, in turn, are finally directed to the charge coupled device (CCD) by a focusing mirror. (B) Analysis of the imaging plane in Raman spectrometer.
Optics 03 00001 g001
Figure 2. (A) Spot diagram of 535 nm (blue), 540 nm (green), 575 nm (red), 580 nm (gold), 610 nm (purple) and 625 nm (sky blue). (B) Intensity distribution at various wavelengths: 535 nm, 540 nm, 575 nm, 580 nm, 610 nm and 625 nm.
Optics 03 00001 g002
Figure 3. Evolution of the modulation transfer function (MTF) curve at 575 nm.
Optics 03 00001 g003
Figure 4. (A) Wavelength band imaged on the plane of the detector. (B) Irradiance and beam spot at the detector surface.
Optics 03 00001 g004
Table 1. Lens data editor window in Zemax.
Object TypeRadius of Curvature (mm)Thickness (mm)Semi-Diameter (mm)
SourceInfinity0.900.00
SampleInfinity0.900.30
SlitInfinity4.500.08
Collimating mirror−10.00−3.000.61
Diffraction GratingInfinity3.000.52
Focusing mirror−10.00−4.500.61
CCDInfinity-0.30
Table 2. Initial structure parameters of Raman spectrometer design.
ParameterValue
Laser wavelength527 nm
Observed Raman spectra530–630 nm
Entrance pupil diameter0.16
Grating constant0.100 lines/ μ m
CCD pixel1024 × 1024
Slit width30 μ m
Size of pixel5 μ m
R 1 −10 mm
R 2 −10 mm
x 1 3 mm
x 2 3 mm
x 3 4.5 mm
Publisher’s Note: MDPI stays neutral with regard to jurisdictional claims in published maps and institutional affiliations.