Article

Interferometric Ice Particle Imaging in a Wind Tunnel

1
UMR CNRS 6614-CORIA, Normandie Université, BP 12, 76801 Saint-Etienne-du-Rouvray, France
2
Safran Aerosystems, 4 Rue Lesage Maille, 76320 Caudebec Les Elbeuf, France
*
Author to whom correspondence should be addressed.
Optics 2021, 2(4), 216-227; https://doi.org/10.3390/opt2040020
Submission received: 20 July 2021 / Revised: 17 August 2021 / Accepted: 26 September 2021 / Published: 5 October 2021
(This article belongs to the Special Issue Feature Papers in Optics)

Abstract

:
We report interferometric ice particle imaging and sizing in an icing wind tunnel with wind speeds of 70 m/s. Single particle interferograms are first analysed, size measurements are performed, and examples of possible reconstructed shapes are deduced from the interferometric images. Particle sizing is also performed in the case of ice particles whose out-of-focus images overlap, with or without Moiré phenomena. Results show that the IPI technique can be carried out for irregular rough particles in a critical environment such as in an icing wind tunnel with high wind speeds.

1. Introduction

Interferometric out-of-focus imaging of particles (or IPI for interferometric particle imaging) is an optical technique often used to measure the size of droplets, bubbles and irregular rough particles, in the size range from tens of micrometres to millimetres. It was first developed to measure the size of droplets: when droplets are illuminated by a laser beam, the light scattered gives interference fringes whose quantitative analysis gives the size of the droplet [1]. The cameras used are in an out-of-focus plane, which can be relatively small to observe many particles with the same camera, as in the ILIDS technique (interferometric laser imaging for droplet sizing) [2]. First developed to measure the size of droplets, IPI has since been used to measure the size of bubbles [3]. Set-ups have been optimized [4,5,6], and the technique has found many applications in different types of flows [7,8,9,10,11]. The technique has been extended to the analysis of irregular rough particles in a flow (such as sand, ice or coal particles and ashes) [12,13,14,15,16,17,18]. The technique is thus well adapted to the characterisation of triphasic flows such as the mixing of liquid water droplets and ice crystals in clouds [1,2,3,4,5,6,7,8,9,10,11,12,13,14,15,16,17,18,19,20,21]. Using this technique, the working distance between the measurement volume and the instrument can be larger than 10 cm while the field of view can exceed tens of cm2. Applications are found in meteorology, combustion and cosmetics, among other fields. One important application is aircraft safety: the technique offers the possibility of performing airborne size measurements of cooled droplets and ice particles beyond the boundary layer of an aircraft in flight [21]. As spread out-of-focus images are analysed, the technique is of interest in conditions where the concentration in particles remains relatively limited.
The working principle of particle size measurements using the IPI technique has been described in previous studies [1,2,3,4,5,6,7,14]. Using the IPI technique, we do not record the exact shape of the particles, but we obtain information about their dimensions, their orientations and morphology [22]. The characterization of irregular particles has become the object of intense efforts [23,24,25,26]. For an irregular rough particle such as an ice crystal, the interferometric out-of-focus image is a speckle-like pattern. There is no theoretical model that can rigorously describe the speckle pattern scattered by the particle. A simplified approach consists in assuming that these particles can be assimilated to an ensemble of many emitters located on the envelope of the particles [27]. Under this assumption, a scalar description shows that the two-dimensional (2D) autocorrelation of the 2D-contour of the particle (that would be projected in the plane of the CCD sensor) can be determined from the 2D-Fourier transform of the speckle pattern [14]. The use of this technique for the characterization of flows where the density of particles increases (such as in clouds of the troposphere) requires careful attention. For higher densities of particles, overlapping interferograms are observed, the analysis of which is more complex than the analysis of the interferogram of a single particle. Different phenomena, such as Moiré can then appear on the speckle image implying aliasing on the 2D-Fourier transform of the speckle patterns. Nevertheless, in most cases, the IPI technique can still be used in the case of overlapping of two or three interferograms on the same out-of-focus image [28,29,30].
The aim of this study is to validate the possible use of IPI in an icing wind tunnel to measure the size of ice particles. Experiments were performed in an icing tunnel with a wind speed of 70 m/s (the speed limit of the wind tunnel). Section 2 will present and describe the experimental setup. Section 3 will present the experimental results and confirm that all methods developed in previous studies to interpret the interferograms can be applied in the case of high-speed flows. The following experiments were performed: size measurement of single ice particles in the measurement field, determination of a family of possible particle shapes from an interferogram, analysis of interferograms of several ice particles whose out-of-focus images overlap and Moiré phenomena. Results will show that the IPI technique can be carried out in a critical environment such as in an icing wind tunnel with wind speeds of 70 m/s.

2. Experimental Set-Up

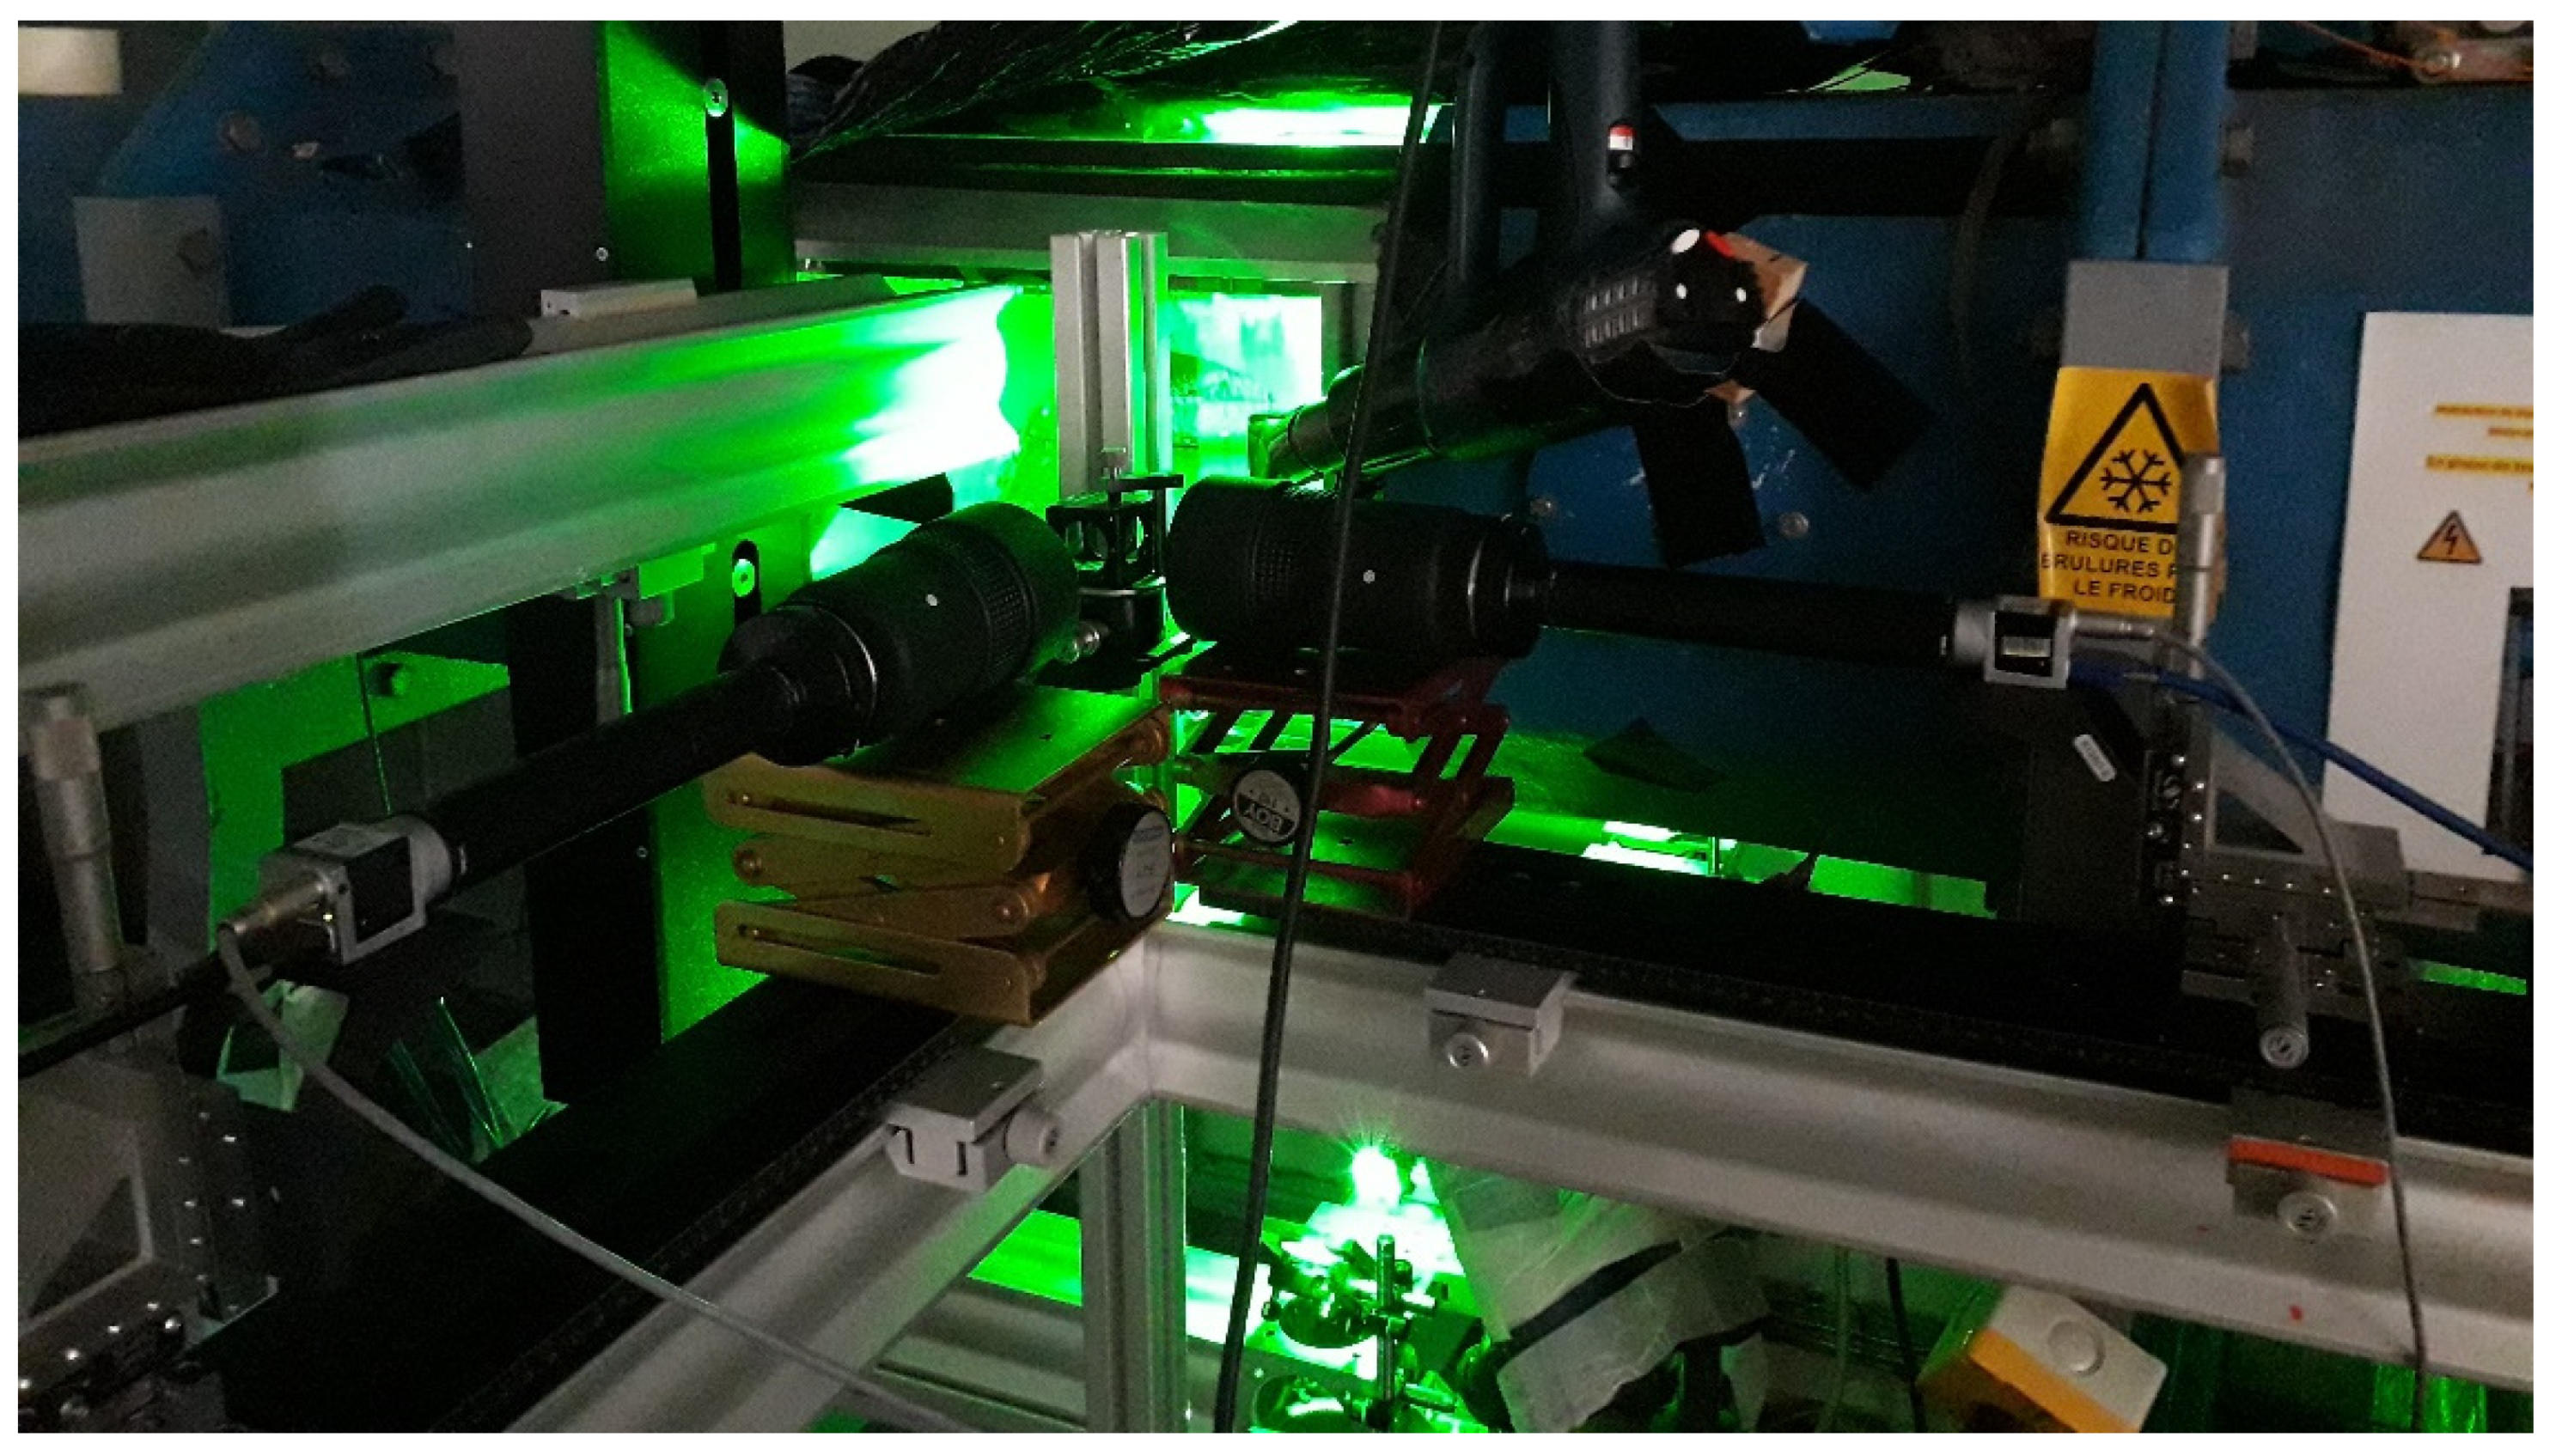
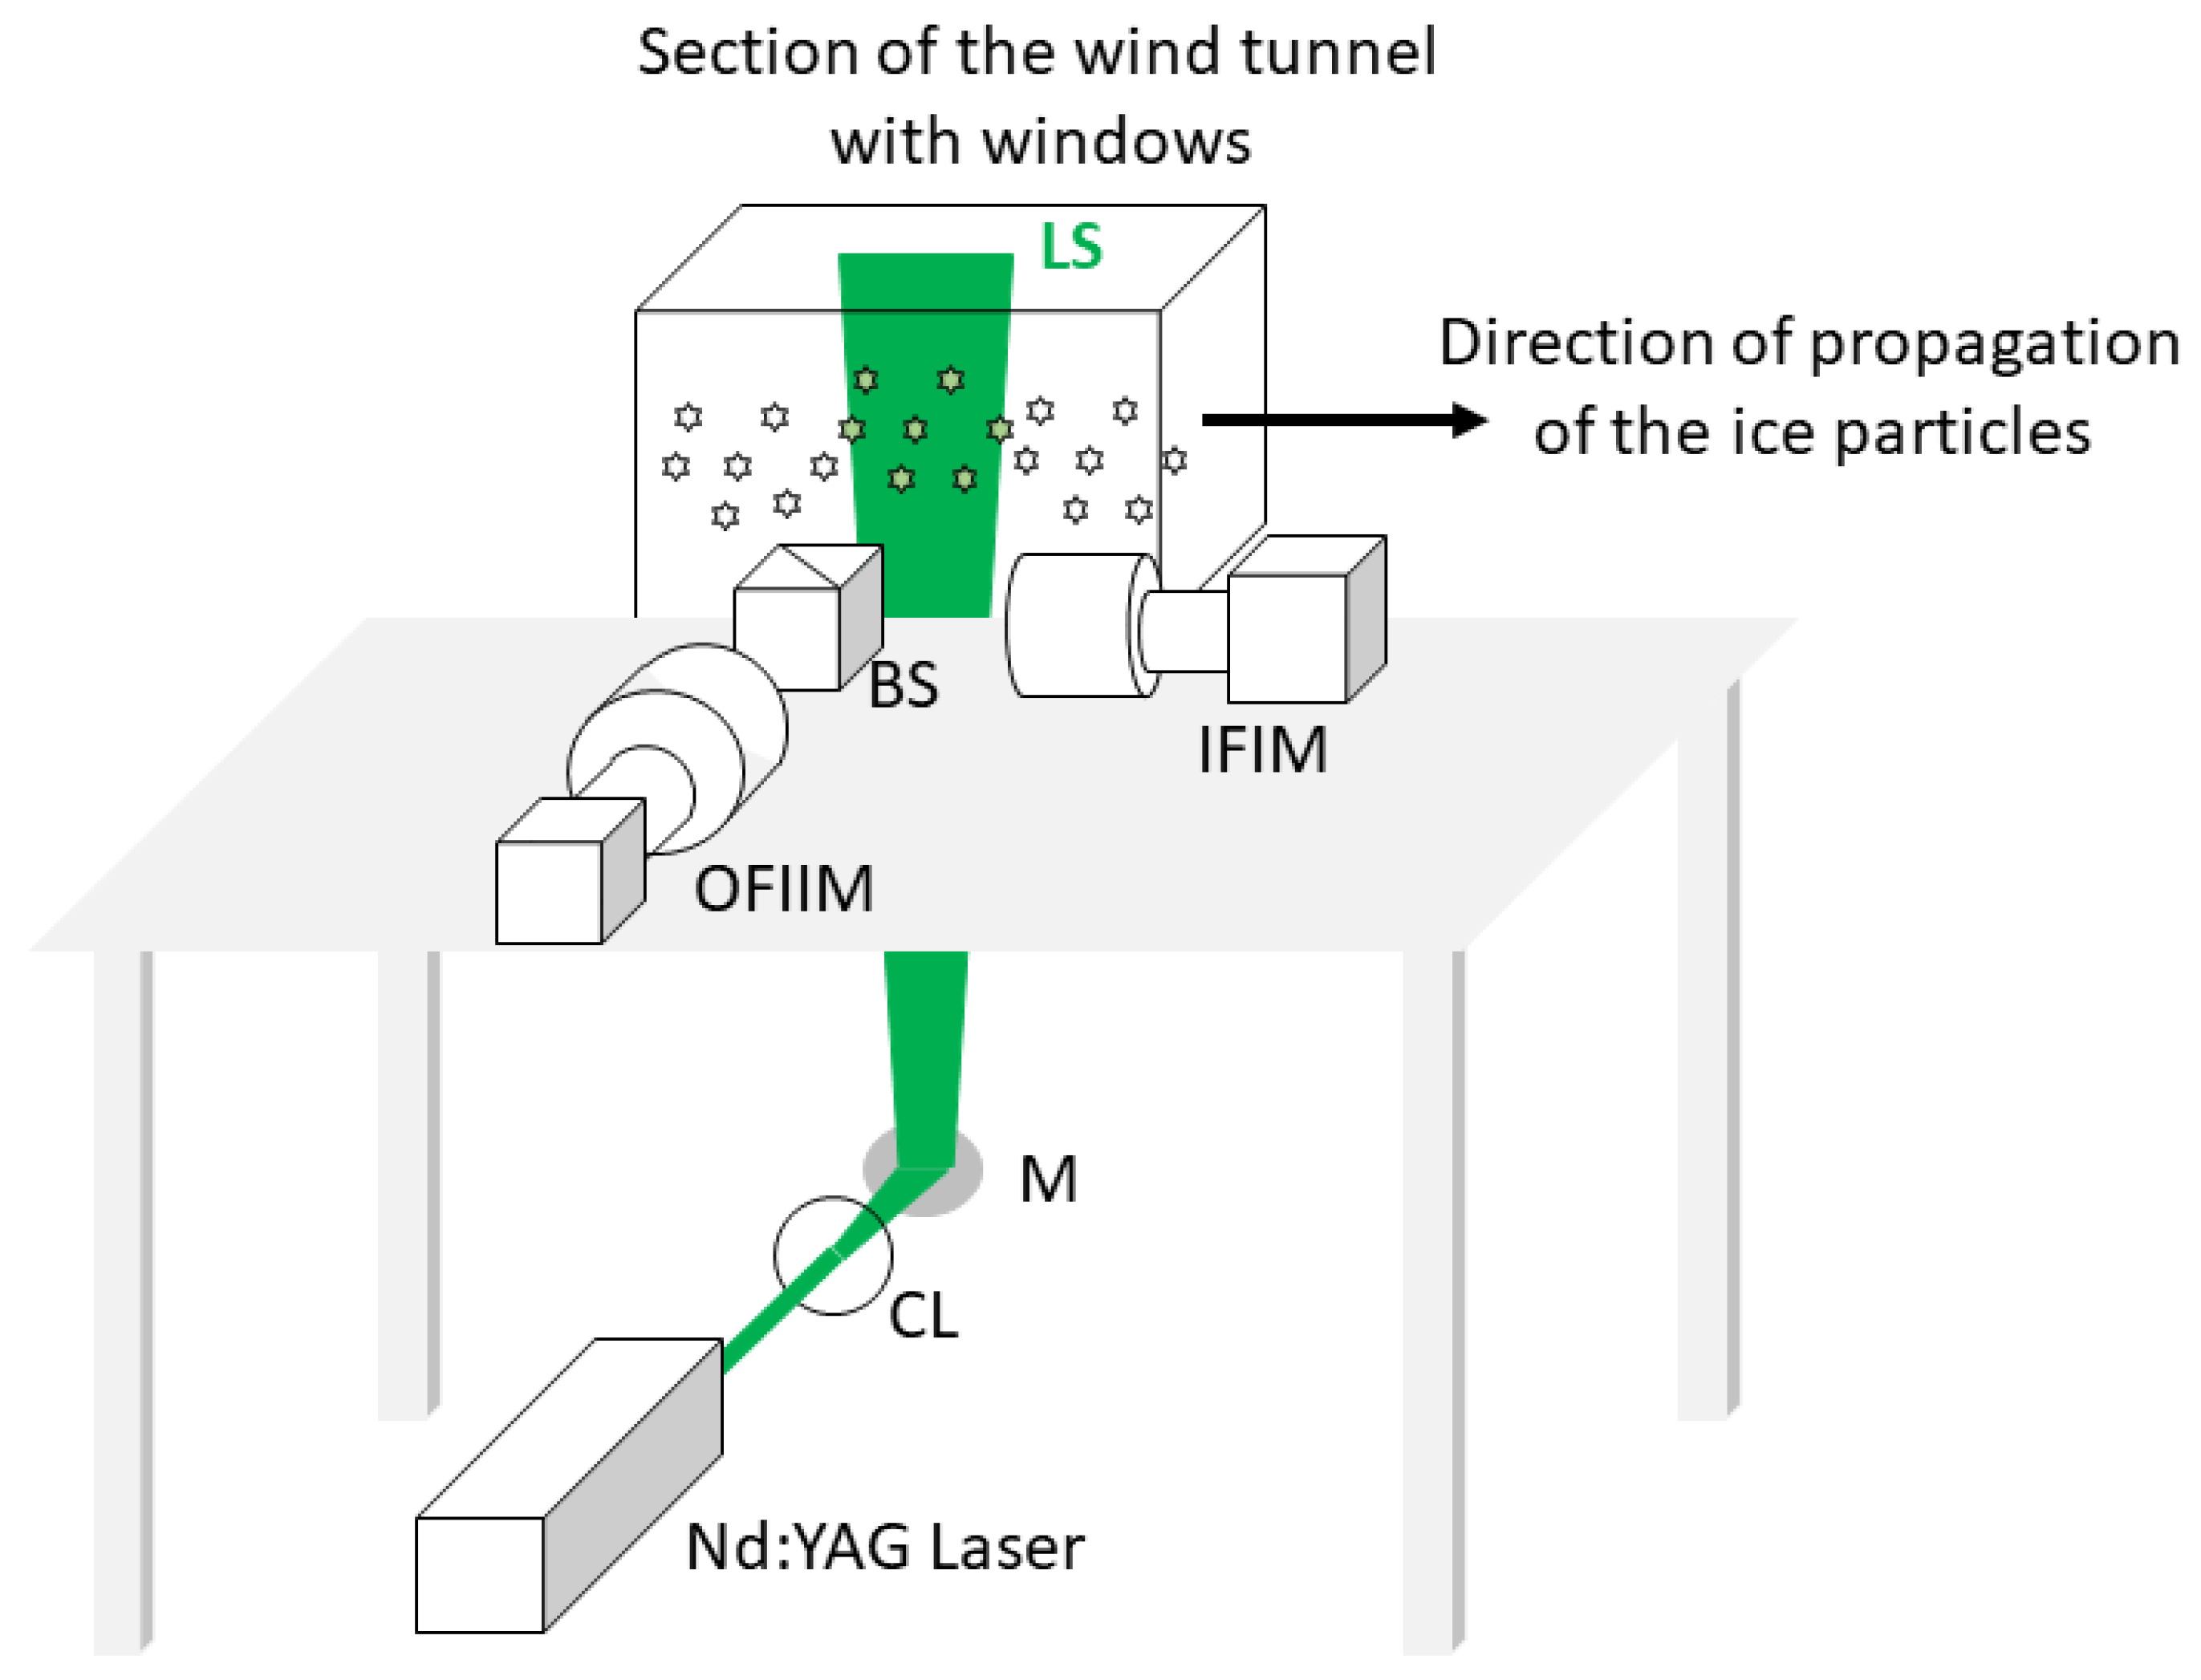
Experiments were performed using an icing wind tunnel. Water droplets were injected into the wind tunnel (the temperature of which can reach −30 °C) through a set of identical nozzles, and frozen. A laser sheet is injected into the narrow part of the tunnel where the speed of air is the highest. This part has optical windows of borosilicate glass, as illustrated in Figure 1. Nanosecond laser pulses are emitted by a frequency-doubled Nd:YAG laser and injected into the tunnel vertically, from the bottom. Interferometric particle imaging is performed using an imaging system that collects light scattered horizontally through a second transparent window on the side of the tunnel. The median light scattering angle is thus 90° in this configuration.
The icing tunnel presented in Figure 1 has a functional part (where the model is installed) 50 cm in length, 50 cm width and 30 cm height. Air is cooled by spraying nitrogen coupled to a cold unit. The temperature inside the tunnel is then in the range of −30–0 °C. The wind tunnel system can generate wind speeds between 10 m/s and 90 m/s inside. Upstream of the measuring area, droplets of liquid water are injected using 12 identical nozzles. The mean weight diameter (MWD) of the water droplets is in the range of 20–45 µm. The temperatures of the water and air injected through the various nozzles are adjustable. Therefore, by varying the above parameters, we can simulate the external atmospheric conditions of aircraft in flight.
The interferometric particle imaging device (IPI) presented on the Figure 2 includes the Nd:YAG laser emitting 20 mJ, 4 ns pulses at 532 nm and an acquisition system composed of a CCD sensor (2048 × 2048, pixel size: 5.5 μm) and numerous optics. The laser is shaped to generate a one-millimetre-wide laser sheet inside the tunnel, as can be seen in the Figure 2. When the particles generated inside the icing tunnel cross the laser sheet, they scatter light in all directions. We collect this scattered light at an angle of 90° to record an interferometric image of the particle using an out-of-focus optical system (CCD sensor, extension tube and lens). The IPI device is composed of several elements: Nikon objectives with focal length of 180 mm and a 17 cm extension tube. The sensor is first adjusted to obtain an in-focus image of the central point of the laser sheet inside the icing tunnel. Then, the whole out-of-focus optical system (CCD sensor, extension tube and lens) is translated by Δp = −15 mm (out-of-focus imaging). The CCD sensor is synchronized on the laser pulse for the acquisition of ice particle images. Thus, the CCD sensor records 20 images per second (i.e., the repetition rate of the laser). A second imaging set-up is added using a beam splitter. This is to enable verification of the interpretations deduced from the interferometric out-of-focus imaging experiment previously described. This in-focus imaging line is composed of a 180 mm focal length Nikon objective associated with a second CCD sensor (identical to the previous one and synchronized on the laser pulse as well).
Interferometric laser imaging for droplet sizing (ILIDS) is traditionally performed at the scattering angle of 67° with a perpendicular polarization of the laser light in the case of water droplets in air [2]. For visualization in a parallelepipedic wind tunnel, it is easier to work at the scattering angle of 90° with a parallel polarization of the laser light [3,9,31,32,33]. This configuration has been used frequently in the past and, although it requires careful interpretation of the results in the case of water droplets [33], it can be used for ice particle sizing too, which is the goal of the present study.

3. Results

In this section, we present and discuss the results obtained. They confirm that measurement of the size of ice particles is still possible using the IPI technique when the speed of the air flow reaches 70 m/s, as long as the concentration of particles is not too high, as commonly observed with ILIDS. With the present out-of-focus imaging setup, the field of view is 1 cm2 and the maximum number of interferograms that can be analysed per image is around 30. Experimental results show different cases already encountered in a freezing column. Analysis methods have been described in previous studies. We confirm here their applicability to such extreme conditions. First, we will analyse out-of-focus images containing only one ice particle. Secondly, we will deal with more complex cases where out-of-focus images of two or three nearby ice particles overlap without Moiré effects. Finally, we will present and analyse the cases where out-of-focus images of numerous nearby ice particles overlap generating a Moiré effect causing aliasing.
Assuming that a rough particle can be assimilated to an ensemble of coherent point emitters that cover the whole particle, it can be shown, using a simplified scalar Huygens–Fresnel model, that the two-dimensional Fourier transform of the interferometric pattern is linked to the 2D-autocorrelation of the envelope of the particle through relation (1):
| F T 2 D [ I ] ( λ B t o t u ,   λ B t o t v   ) |     | A 2 D [ G 0 ] ( d x ,   d y ) |
where I is the intensity of the out-of-focus pattern of the particle, G0 is the electric field scattered by the illuminated particle, λ is the wavelength of the laser and λBtot is the scaling factor between both functions which is deduced from the set-up. Experimentally, this correspondence between the two-dimensional autocorrelation of in-focus images with the corresponding two-dimensional Fourier transform (2DFT) of the IPI images has been validated in size and shape in many cases [13,14,15,27,28,29]. In the present study, we will use this formalism to estimate the dimensions of particles from the 2D-FT of the speckle images. To obtain the real dimension of the particles along x axis (resp. y), interferometric particle images will be 2D-Fourier transformed. After a binarization step, the size of the particle is then deduced from the size of the central spread spot (divided by a factor of two, as it can be assimilated to the 2D-autocorrelation of the initial envelope of the particle). The real particle’s size along the x axis will be noted δx. Similarly, it will be noted δy along y axis. We note that the coefficient Btot of the total optical transfer matrix of the IPI setup is about Btot = 0.0165 m in our experiment (from the particles to the CCD sensor). This coefficient Btot can vary slightly due to the thickness of the laser sheet.

3.1. Size Measurements of Single Ice Particles Using the IPI Technique

Using our setup, we first analysed the out-of-focus images of isolated single ice particles. Eight examples are presented in Figure 3. Columns (a) and (c) of Figure 3 show the out-of-focus images of eight ice crystals. Columns (b) and (d) of Figure 3 show the corresponding two-dimensional Fourier transforms.
Then, using 2DFTs of the speckle-like patterns presented in Figure 3b,d, we were able to estimate the size of the ice crystals along the x and y axes, noting xIPI_size and yIPI_size. To do this, we estimated the lengths of Δx and Δy in Figure 3c,d. The measurement accuracy is then ±26 pixels, i.e., ±20 µm. Due to the correspondence between the two-dimensional autocorrelation of the original particles with the 2D Fourier Transform of the corresponding IPI images, these values are divided by two to obtain the dimensions of the particles. The results obtained are listed in the following Table 1.
As can be seen in the table above, we were able to estimate single ice crystals’ dimensions from the 2DFT of the IPI images. Note that previous studies have shown that the error rate of IPI sizing with ice particles does not exceed 20% with single particle interferograms [16,21,30].
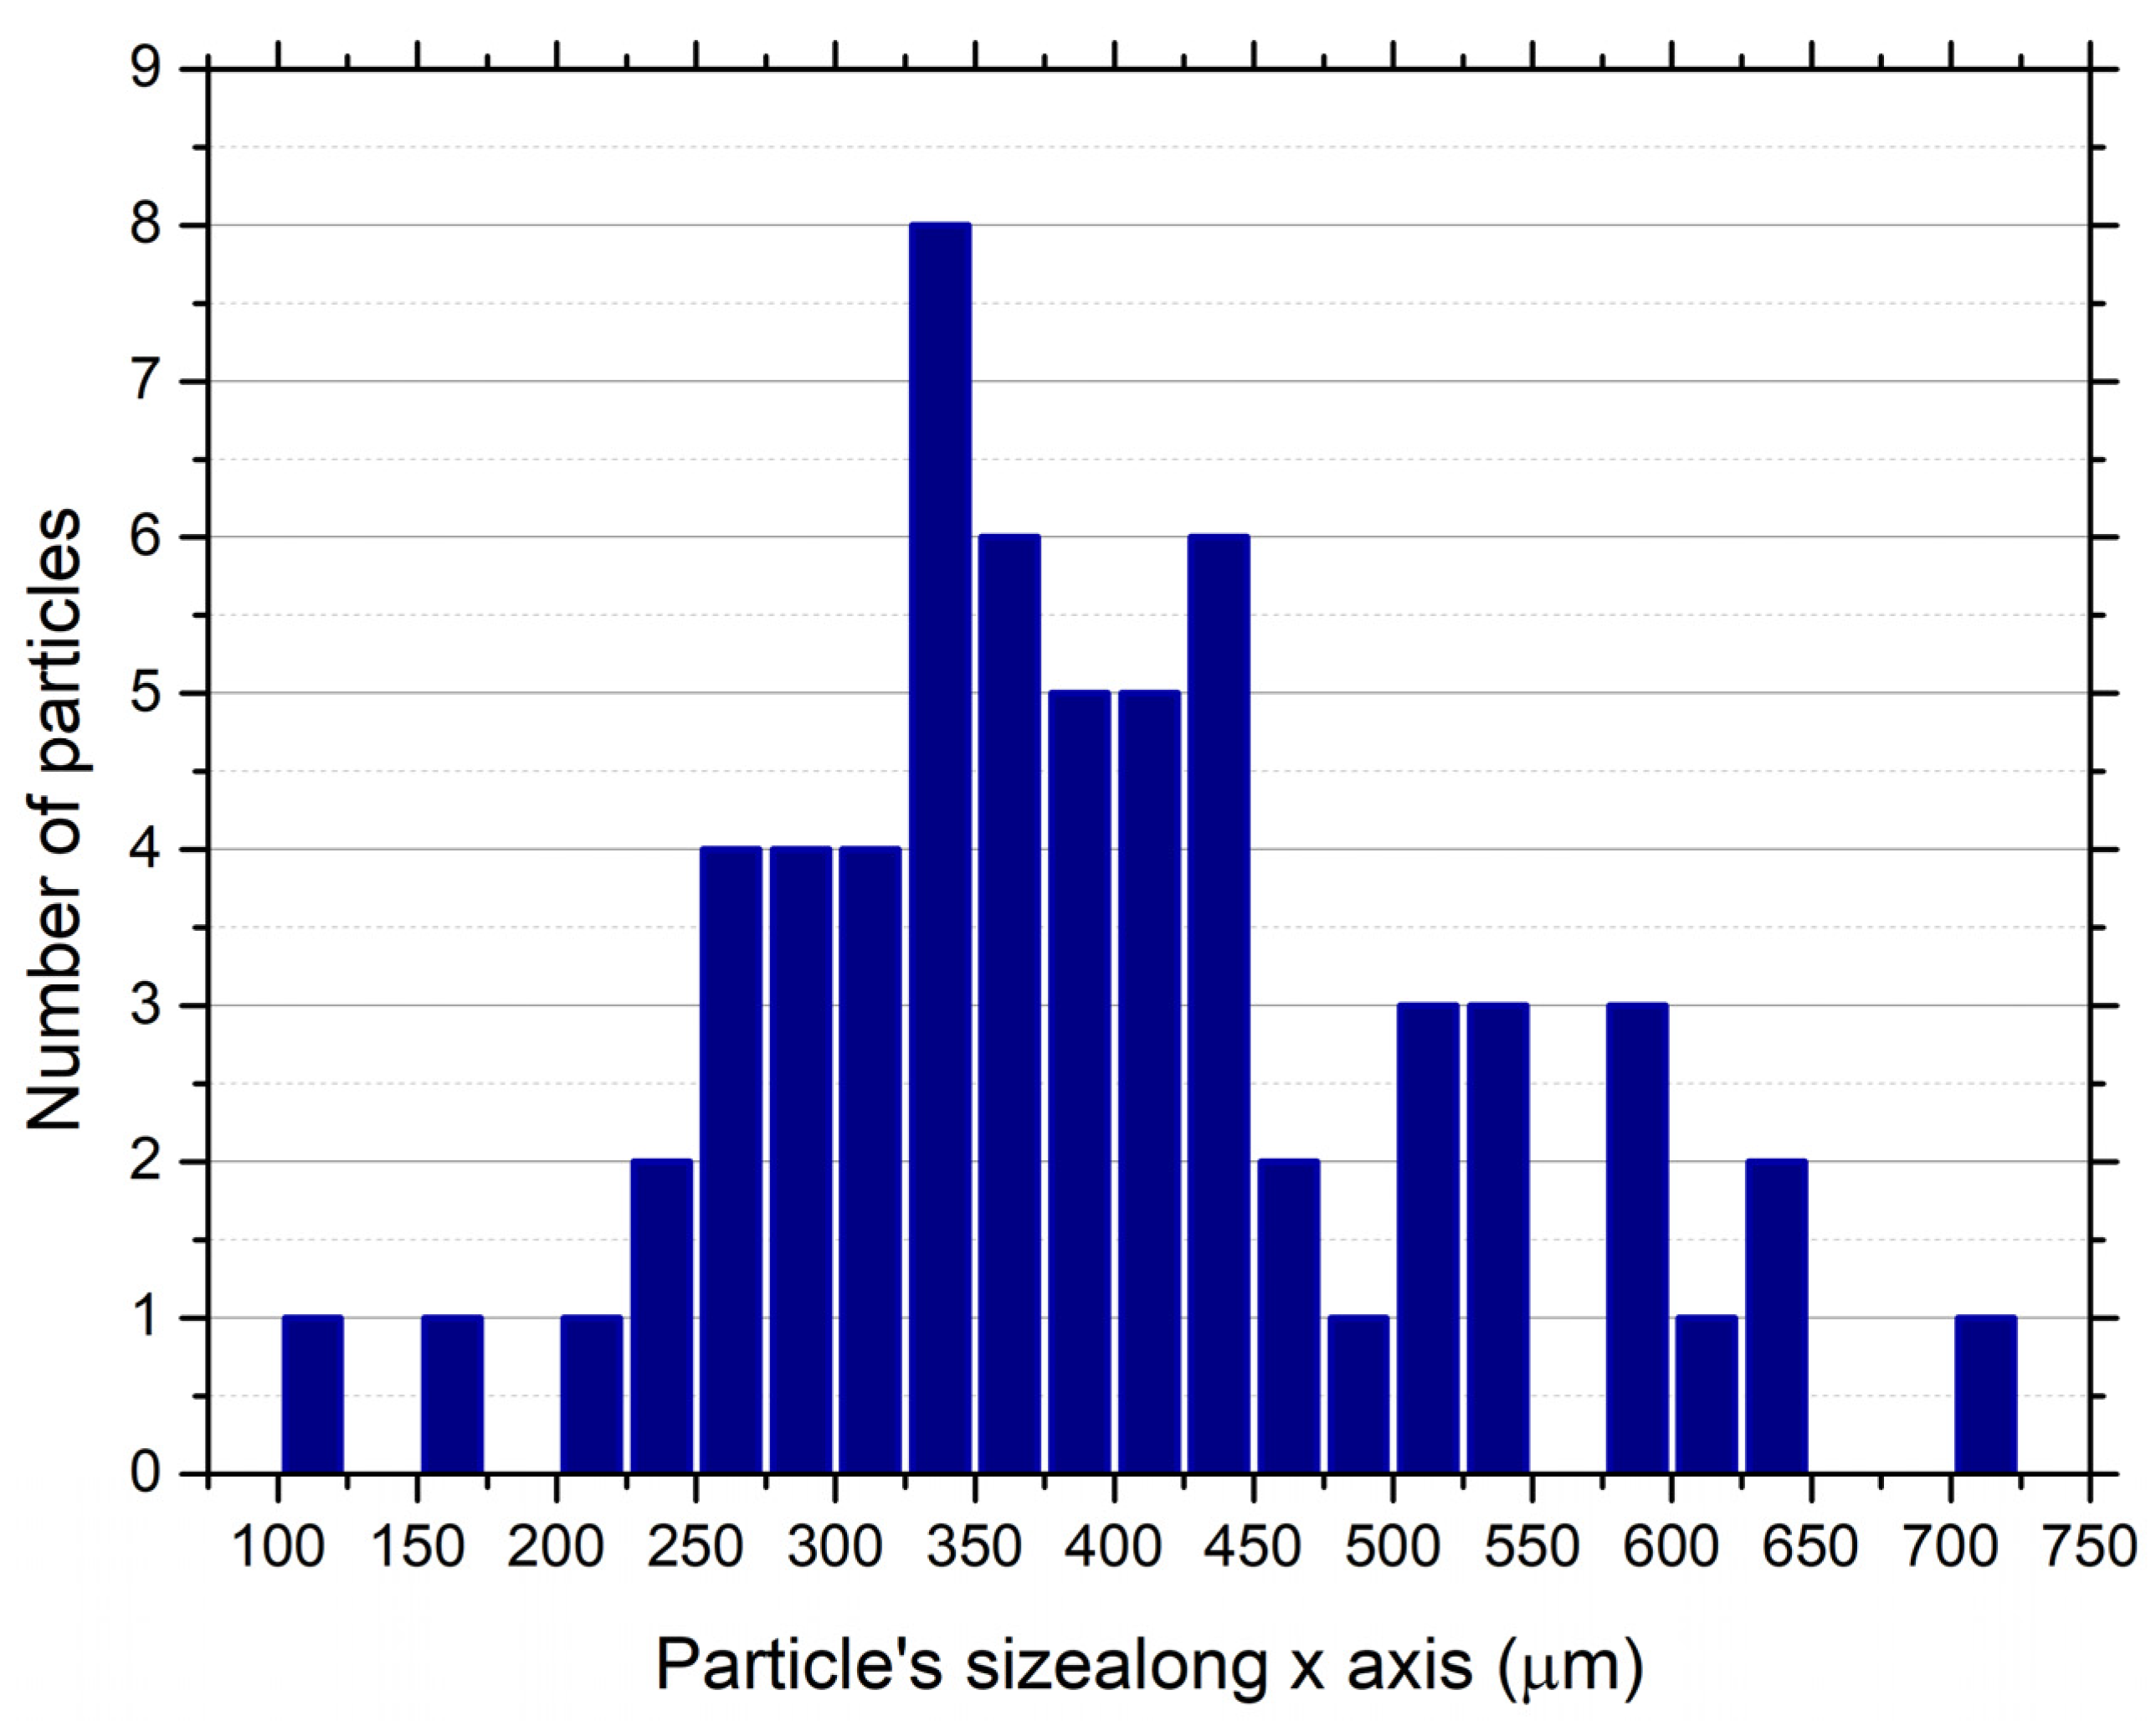
Figure 4 shows a histogram obtained from a series of interferometric image acquisitions, considering only single particle interferograms. At this stage, our image processing tools have not been automated and the analysis is performed image by image. The abscissa represents the x-axis particle’s size while the ordinate represents the number of particles measured in the corresponding size range.
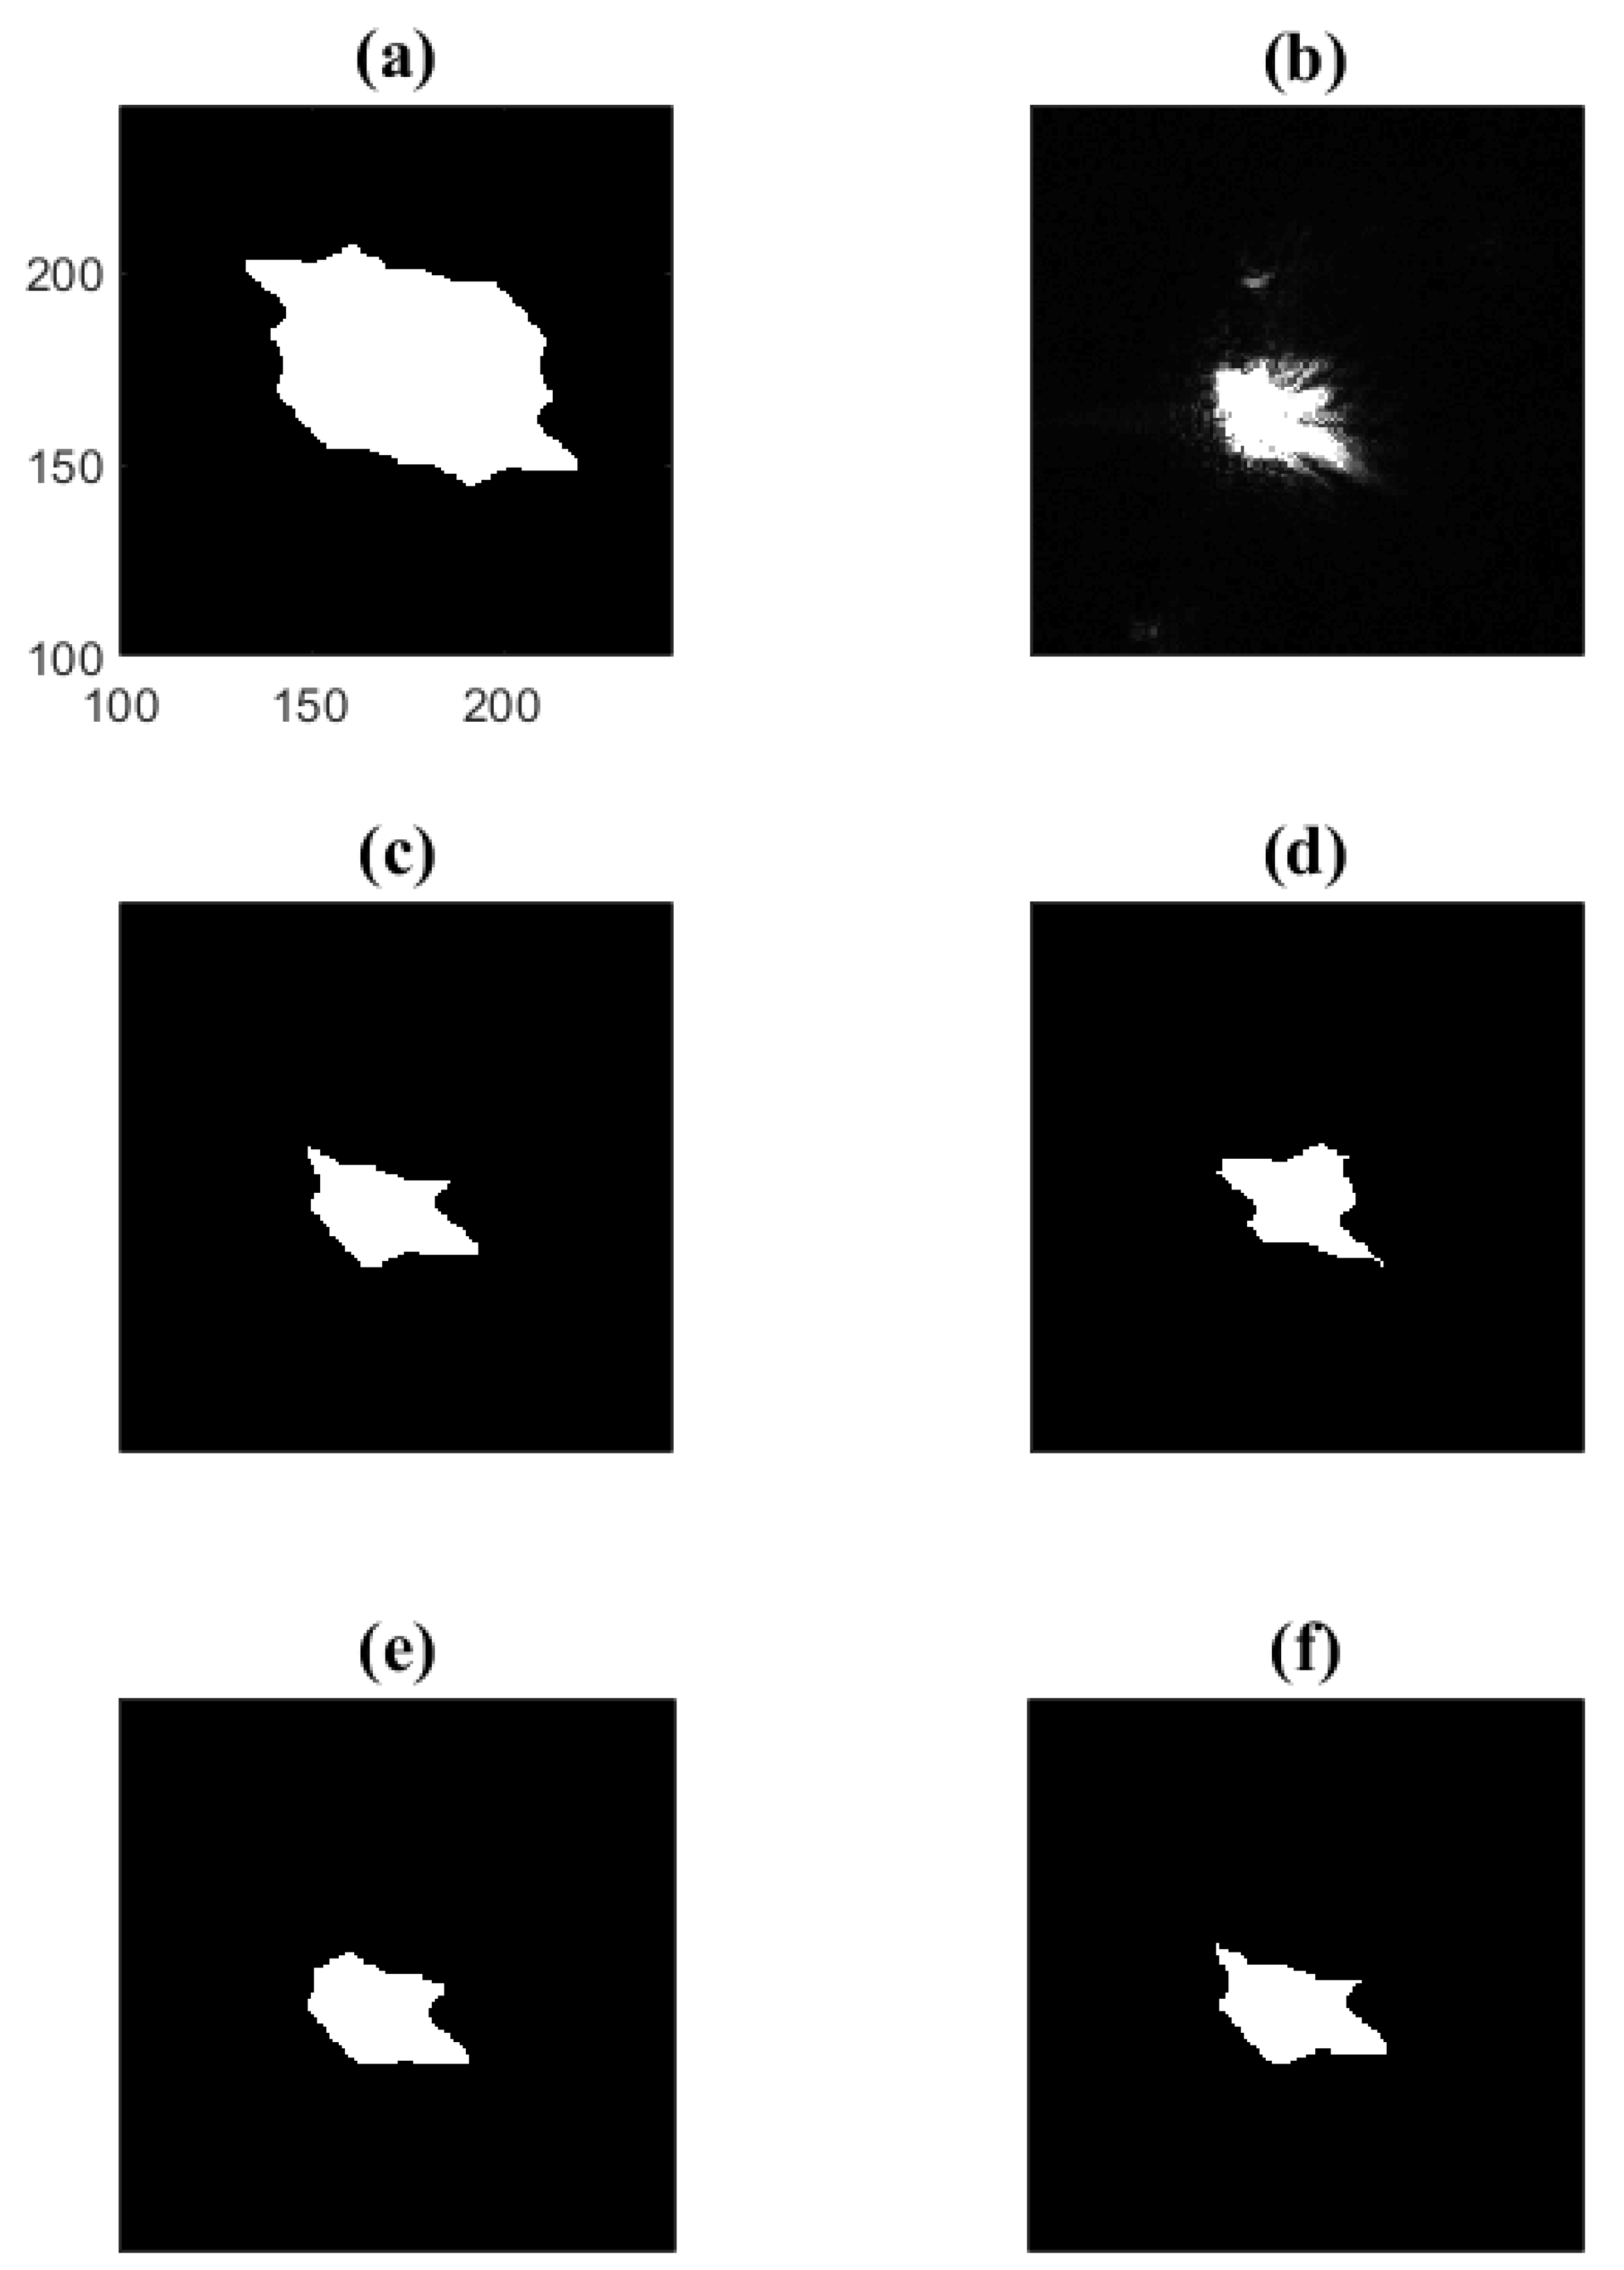
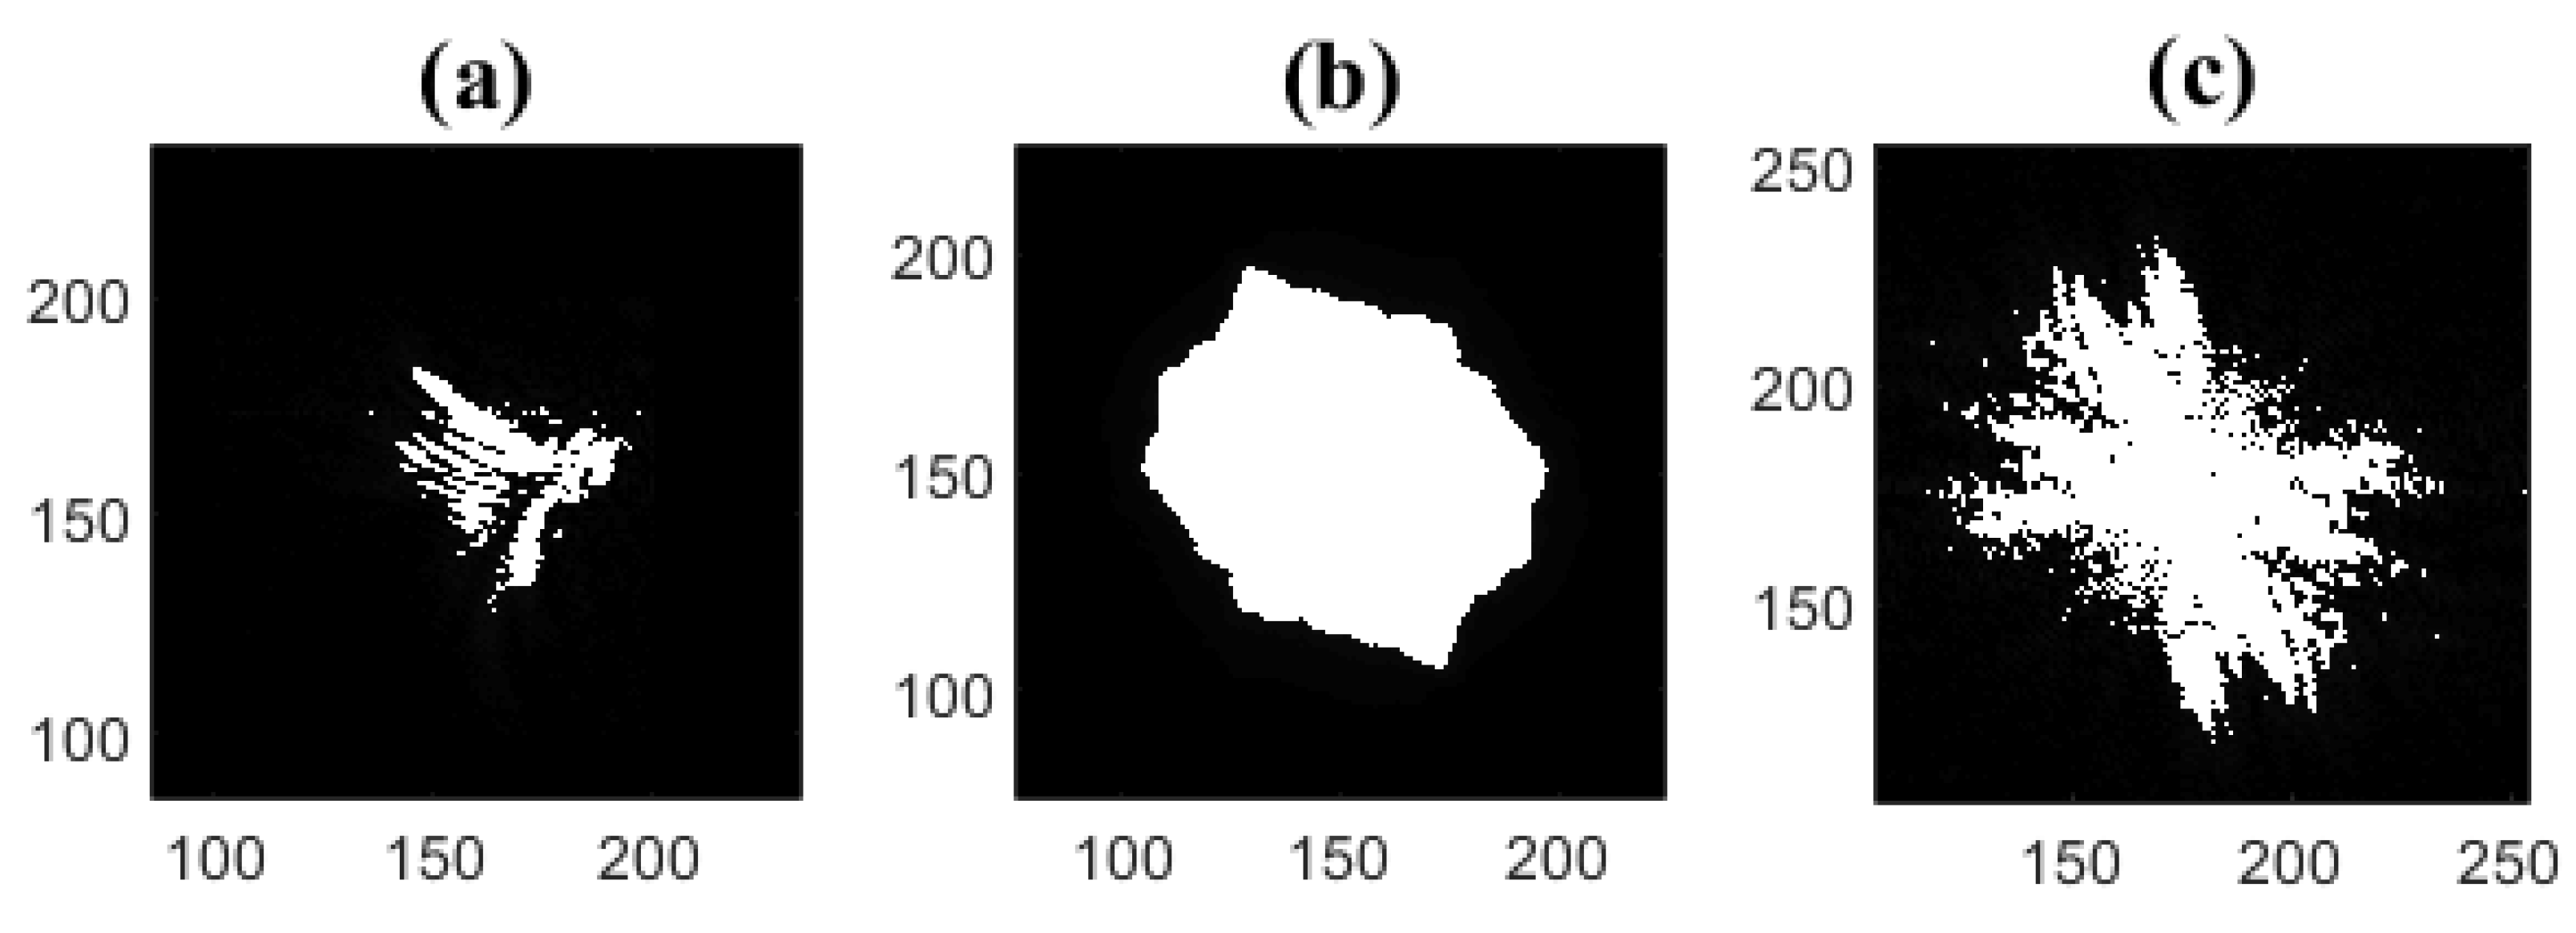
Assimilating the 2D-Fourier transform of the interferometric pattern to the 2D-autocorrelation of the contour of the particle (according to the simplified approach leading to relation (1)), it is possible to predict a family of particle shapes whose 2D-autocorrelations match the experimental results using a tri-intersection method [34,35,36]. Figure 5a shows the binarized 2D-Fourier transform of one of the interferometric patterns that was recorded. Figure 5c–f show four possible shapes deduced from the tri-intersection method, whose 2D-autocorrelations match approximately the contour plotted in Figure 5a. In our experimental set-up, an imaging line gives the simultaneous in-focus image using a 50/50 separator prism as in reference [16]. In this case, the in-focus image of the same particle has been recorded simultaneously and is shown in Figure 5b. It is relatively similar to the shape predicted in the case (e).

3.2. Size Measurements of Ice Particles When Their IPI Images Overlap

In this section, we present the more complex cases where the interferograms of two nearby particles overlap. An example of this case is presented in the Figure 6. Figure 6a shows the overlapping out-of-focus images of two nearby ice particles and Figure 6b shows the corresponding two-dimensional Fourier transform. The separation between both particles is sufficiently high to induce the presence of three spread spots after two-dimensional Fourier transform as observed in Figure 6b: the central spot corresponds to the summation of the two-dimensional autocorrelations of the 2D shapes of both particles considered separately. The two symmetric spots correspond to the two-dimensional cross-correlation of the 2D shape of one particle with the 2D shape of the other particle.
On the specific example in Figure 6, the two symmetric spots observed in Figure 6b (2D-FT of the IPI pattern) appear around half the size of the central one. This implies that one of the particles is much smaller than the other along the two axes x and y. Therefore, we will not be able to estimate the dimensions of the small particle from the symmetrical spots. Indeed, the uncertainty in the determination of the size of the smallest particle can be very high, as discussed in [28,29,30]. This is why, in this example, we can only estimate the dimensions of the largest particle. To do this, we note that the central spot corresponds to the exact two-dimensional autocorrelation of the large particle. Then, to estimate the sizes along the x and y axes, denoted xIPI_size_Large and yIPI_size_Large of the large particle, the lengths Δx and Δy of the central spot are divided by two as in previous section. The results are as follows: 273 ± 10 μm, and 261 ± 10 μm for x and y respectively.
One possibility in this case could be that we observed self-generated off-axis holography, i.e., the smallest particle can be assimilated to a point emitter (with respect to the biggest particle) creating a reference spherical wave that interferes with the light scattered by the biggest particle. After 2D-Fourier transform of the interferogram, the two symmetric spread spots are the cross-correlation between the shape of the biggest particle and a point emitter, i.e., the exact shape of the biggest particle itself. If this was the case, the 2D-autocorellation of one of the symmetric spread spots should give exactly the central spread spot [37]. To test this hypothesis, Figure 7 shows in (a) one of the two symmetric spots of Figure 6b, in (b) its 2D-autocorrelation and in (c) the central spot of Figure 6b. We can see that Figure 7b and c do not match perfectly. In this case, one particle is smaller than the other one, but not so small that it can be assimilated to a point.
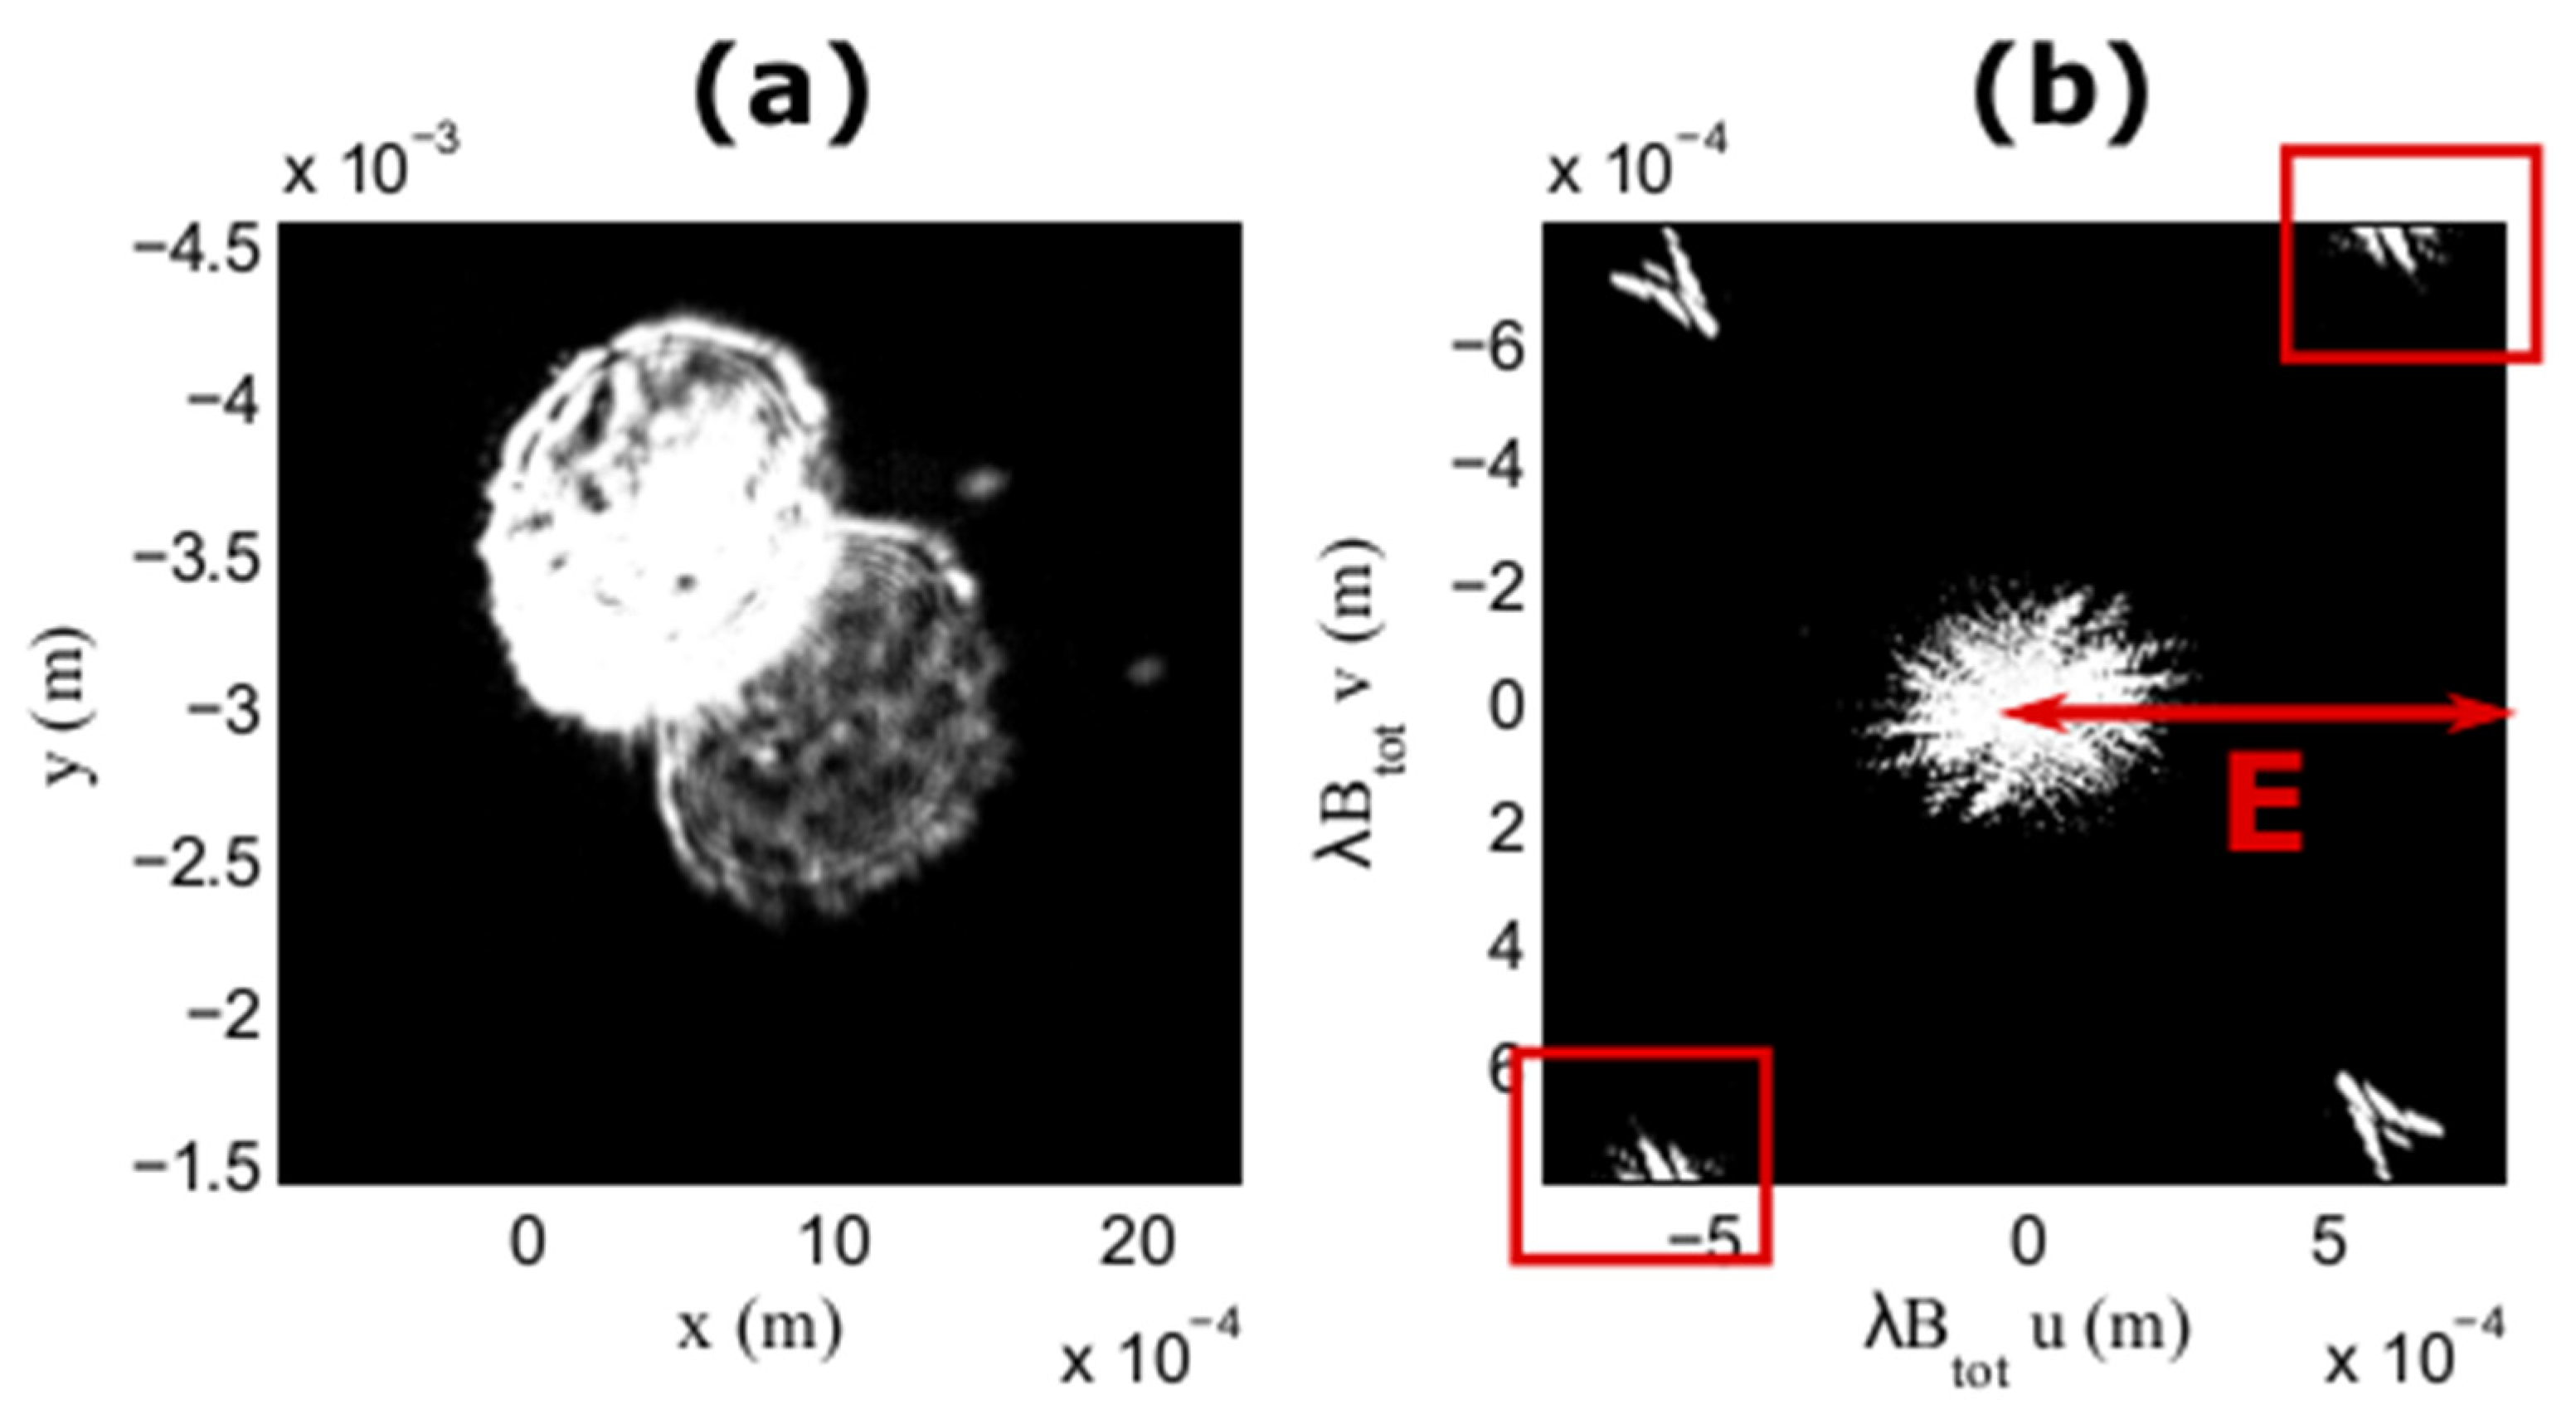
We present now a second case where the interferograms of two nearby particles overlap, clearly showing aliasing and the Moiré effect. This example is illustrated in Figure 8. Figure 8a shows the overlapping out-of-focus images of two nearby ice crystals and Figure 8b shows the corresponding two-dimensional Fourier transform (2DFT). The separation between both particles is sufficiently high to induce the presence of three spread spots after two-dimensional Fourier transform (as observed in Figure 6b). We enhanced the contrast of Figure 8b on its borders (top right and bottom left corners, outlined in red). We observed partial aliasing: the Moiré effect is present in this case.
Despite aliasing, size measurement can be done if the spacing between the centres of the central spot and one of the cross-correlation spots enables a separation of the three spots in the Fourier domain. The reduction of the Moiré effect is a compromise between different parameters: the range of particle sizes to be measured, field of view, size of the aperture, out-of-focus parameter and CCD pixel size. In our configuration, the distance E on Figure 8 is 800 µm. This size is well suited to measure the size of single particles between 40 µm and 400 µm (and bigger). But overlapping effects will become a problem in the upper part of this range (when the size of the particles increases and the three spread spot begins to cover the whole Fourier space (Figure 8b)). For example, if the images of two particles of around 400 µm overlap, the probability of observing three unseparated spots increases dramatically. The analysis to be done will depend on each specific case. Nevertheless, we see that the measurement principles previously established can be applied in a critical environment, where the wind speed can reach 70 m/s, for the complex case where out-of-focus images of nearby ice particles overlap inducing Moiré effects.
As in the previous section, the two symmetric spots observed in Figure 8b (2D-FT of the IPI pattern) look around half the size of the central one. This implies that one of the particles is much smaller than the other along the two axes x and y. Therefore, we will not be able to estimate the dimensions of the small particle from the symmetrical spots. This is why in this example, we can only estimate the dimensions of the largest particle (noted xIPI_size_Large and yIPI_size_Large) from the central spot of the 2D-Fourier Transform despite Moiré effects, using methods described in [29,30]. The results obtained are: 238 ± 10 μm, and 182 ± 10 μm for x and y respectively.

3.3. Noise Sources in Particle Size Measurements Using IPI Technique

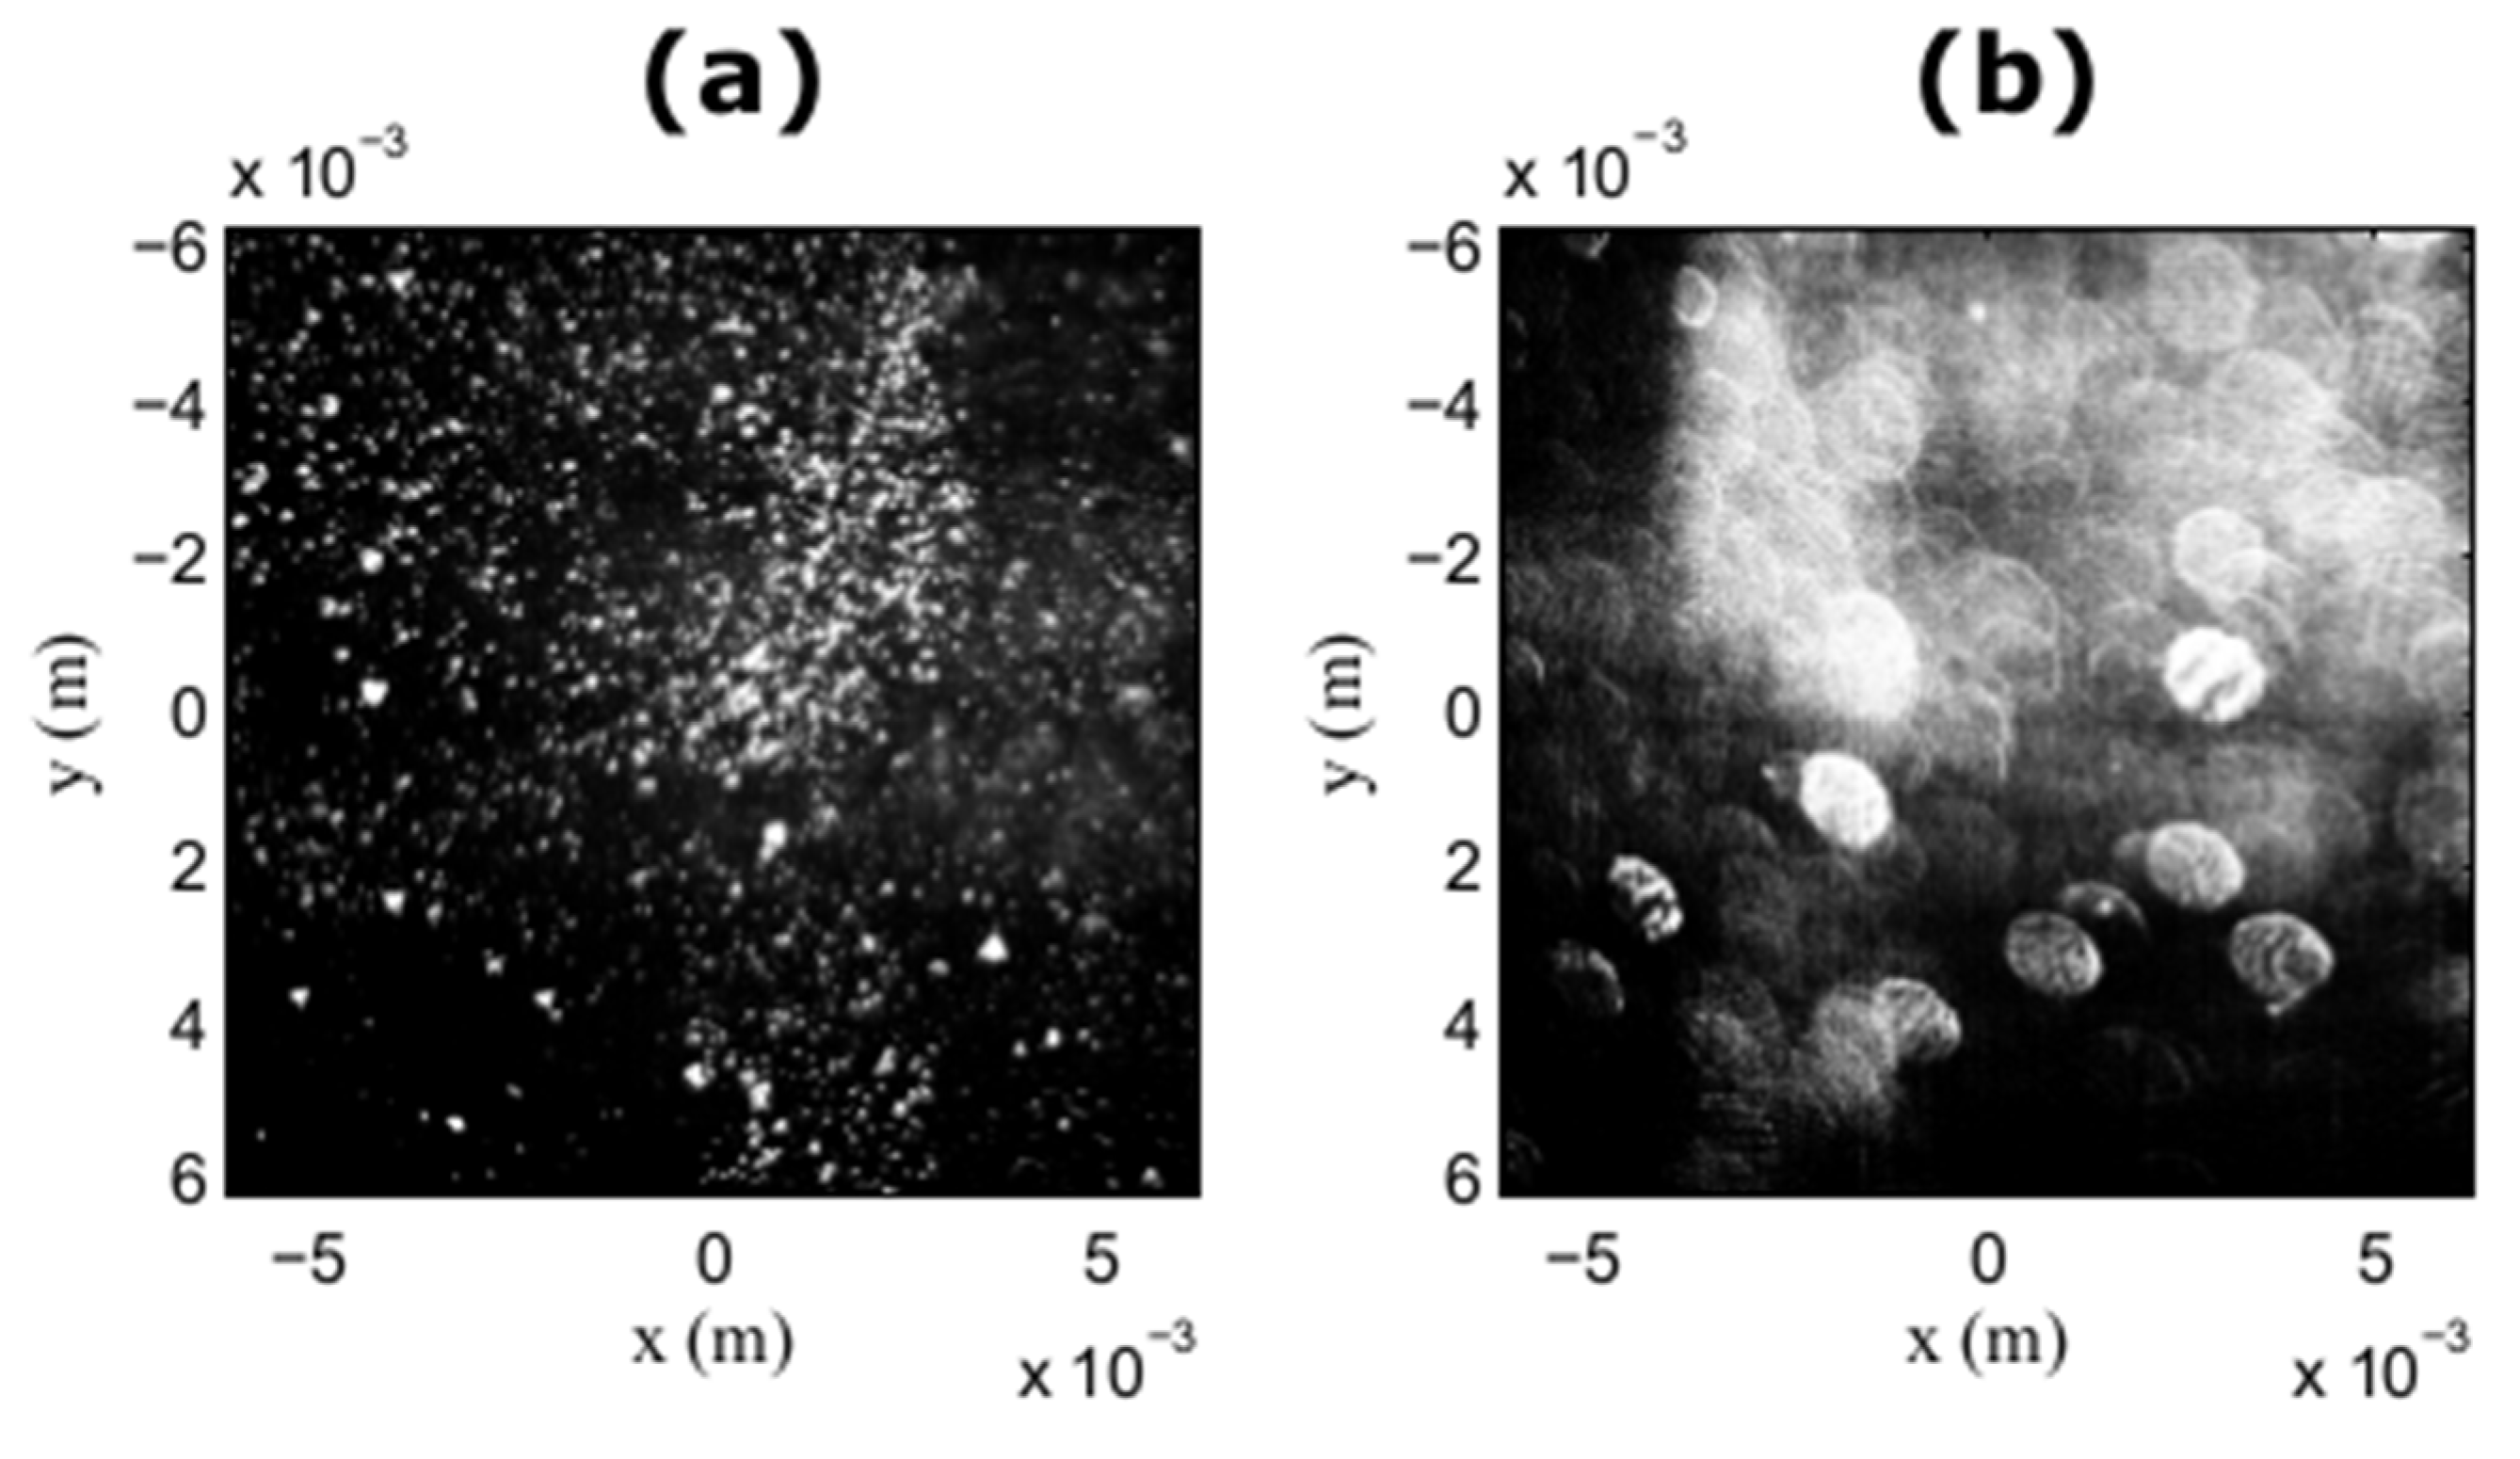
Our study was carried out in an icing tunnel cooled by injection of liquid nitrogen. Therefore, packets of nitrogen particles are present in the icing tunnel and can cross through our measurement area. The number of particles present in the measurement field becomes then too high to allow a correct analysis. An example is shown in Figure 9. Figure 9a shows the in-focus image recorded when a packet of nitrogen particles or fog produced by heterogeneous nucleation around these particles crosses the measurement field. Figure 9b shows the corresponding out-of-focus image recorded simultaneously. By observing the speckle image presented in Figure 9b, we note that the number of overlaps between the different interferograms is very high. When this happens, analysis becomes impossible; the medium is then too dense to be able to use the IPI technique, as is well known with ILIDS.

4. Conclusions

In this study, we carried out ice crystals size measurements in an icing tunnel where the wind speed can reach 70 m/s. The analysis of interferograms requires methods covering the case of interferograms of single particles to the more complex case of overlapping interferograms of closed particles. We see that the IPI technique can be used in an extreme environment where the wind speed can reach 70 m/s by following the same procedure as for IPI measurements in conventional environments [1,2,3,4,5,6,7,8,9,10,11,12,13,14,15,16,17,18,19]. Thus, the IPI technique seems usable for carrying out airborne measurements. However, as classically observed with ILIDS, IPI suffers the limitation of high concentrations of particles, especially when crossing a very dense cloud or a highly polluted area with a high concentration of aerosols. Important work now has to be done for the development of better reconstruction algorithms based on a deep learning approach or phase retrieval algorithms [25,35,38,39], and the improvement of real-time image processing [40].

Author Contributions

Experiments M.T., R.D., G.G. and M.B.; investigation and data curation M.T., R.D., B.D., G.G. and M.B.; writing—review and editing M.T. and M.B.; funding acquisition M.B. and R.D. All authors have read and agreed to the published version of the manuscript.

Funding

Authors acknowledge European Union and Region Normandy for FEDER/CPER project “THESIS”.

Institutional Review Board Statement

Not applicable.

Informed Consent Statement

Not applicable.

Data Availability Statement

Data underlying the results presented in this paper are not publicly available at this time but may be obtained from the authors upon reasonable request.

Conflicts of Interest

The authors declare no conflict of interest.

References

  1. König, G.; Anders, K.; Frohn, A. A new light-scattering technique to measure the diameter of periodically generated moving droplets of the article. J. Aerosol Sci. 1986, 17, 157–167. [Google Scholar] [CrossRef]
  2. Glover, A.R.; Skippon, S.M.; Boyle, R.D. Interferometric laser imaging for droplet sizing: A method for droplet-size measurement in sparse spray systems. Appl. Opt. 1995, 34, 8409–8421. [Google Scholar] [CrossRef]
  3. Kawaguchi, T.; Akasaka, Y.; Maeda, M. Size measurements of droplets and bubbles by advanced interferometric laser imaging technique. Meas. Sci. Technol. 2002, 13, 308. [Google Scholar] [CrossRef]
  4. Mounaïm-Rousselle, C.; Pajot, O. Droplet sizing by Mie scattering interferometry in a spark ignition engine. Part. Part. Syst. Charact. 1999, 16, 160–168. [Google Scholar] [CrossRef]
  5. Damaschke, N.; Nobach, H.; Tropea, C. Optical limits of particle concentration for multi-dimensional particle sizing techniques in fluid mechanics. Exp. Fluids 2002, 32, 143–152. [Google Scholar]
  6. Dehaeck, S.; van Beeck, J.P.A.P. Designing a maximum precision interferometric particle imaging set-up. Exp. Fluids 2007, 42, 767–781. [Google Scholar] [CrossRef] [Green Version]
  7. Hardalupas, Y.; Sahu, S.; Taylor, A.; Zarogoulidis, K. Simultaneous planar measurement of droplet velocity and size with gas phase velocities in a spray by combined ILIDS and PIV techniques. Exp. Fluids 2010, 49, 417–434. [Google Scholar] [CrossRef] [Green Version]
  8. Quérel, A.; Lemaitre, P.; Brunel, M.; Porcheron, E.; Gréhan, G. Real time global interferometric laser imaging for droplet sizing (ILIDS) analysis for airbone research. Meas. Sci. Tech. 2010, 21, 015306. [Google Scholar] [CrossRef]
  9. Lacour, C.; Durox, D.; Ducruix, S.; Massot, M. Interaction of a polydisperse spray with vortices. Exp. Fluids 2011, 51, 295–311. [Google Scholar] [CrossRef]
  10. Volkov, R.S.; Kuznetsov, G.V.; Strizhak, P.A. Influence of droplet concentration on evaporation in a high-temperature gas. Int. J. Heat Mass Transf. 2016, 96, 20–28. [Google Scholar] [CrossRef]
  11. Zhang, H.; Zhai, M.; Sun, J.; Zhou, Y.; Jia, D.; Liu, T.; Zhang, Y. Discrimination between spheres and spheroids in a detection system for single particles based on polarization characteristics. J. Quantum Spectrosc. Radiat. Transf. 2017, 187, 62–75. [Google Scholar] [CrossRef]
  12. Ulanowski, Z.; Hirst, E.; Kaye, P.H.; Greenaway, R.S. Retrieving the size of particles with rough and complex surfaces from two-dimensional scattering patterns. J. Quantum Spectrosc. Radiat. Transf. 2012, 113, 2457–2464. [Google Scholar] [CrossRef] [Green Version]
  13. Brunel, M.; Shen, H.; Coëtmellec, S.; Gréhan, G.; Delobel, T. Determination of the size of irregular particles using interferometric out-of-focus imaging. Int. J. Opt. 2014, 2014, 143904. [Google Scholar] [CrossRef] [Green Version]
  14. Brunel, M.; González Ruiz, S.; Jacquot, J.; van Beeck, J. On the morphology of irregular rough particles from the analysis of speckle like interferometric out-of-focus images. Opt. Commun. 2015, 338, 193–198. [Google Scholar] [CrossRef]
  15. García Carrascal, P.; González Ruiz, S.; van Beeck, J.P.A.J. Irregular particle sizing using speckle pattern for continuous wave laser applications. Exp. Fluids 2014, 55, 1851. [Google Scholar] [CrossRef]
  16. Jacquot-Kielar, J.; Lemaitre, P.; Gobin, C.; Wu, Y.; Porcheron, E.; Coetmellec, S.; Gréhan, G.; Brunel, M. Simultaneous interferometric in-focus and out-of-focus imaging of ice crystals. Opt. Commun. 2016, 372, 185–195. [Google Scholar] [CrossRef]
  17. Ruiz, S.G.; van Beeck, J. Sizing of sand and ash particles using their speckle pattern: Influence of particle opacity. Exp. Fluids 2017, 58, 100. [Google Scholar] [CrossRef]
  18. Wu, Y.; Gong, Y.; Shi, L.; Lin, Z.; Wu, X.; Gong, C.; Zhou, Z.; Zhang, Y. Backward interferometric speckle imaging for evaluating size and morphology of irregular coal particles. Opt. Commun. 2021, 491, 126957. [Google Scholar] [CrossRef]
  19. Qieni, L.; Kan, H.; Baozhen, G.; Xiang, W. High-accuracy simultaneous measurement of particle size and location using interferometric out-of-focus imaging. Opt. Express 2016, 24, 16530. [Google Scholar] [CrossRef]
  20. Garcia-Magarino, A.; Sor, S.; Bardera, R.; Munoz-Campillejo, J. Interferometric laser imaging for droplet sizing method for long range measurements. Measurement 2021, 168, 108418. [Google Scholar] [CrossRef]
  21. Porcheron, E.; Lemaitre, P.; van Beeck, J.; Vetrano, R.; Brunel, M.; Gréhan, G.; Guiraud, L. Development of a spectrometer for the airborne measurement of droplet sizes in clouds. J. Eur. Opt. Soc. 2015, 10, 15030. [Google Scholar] [CrossRef] [Green Version]
  22. Ouldarbi, L.; Talbi, M.; Coëtmellec, S.; Lebrun, D.; Gréhan, G.; Perret, G.; Brunel, M. 3D-shape recognition and size measurement of irregular rough particles using multi-views interferometric out-of-focus imaging. Appl. Opt. 2016, 55, 9154–9159. [Google Scholar] [CrossRef]
  23. Mishchenko, M.I.; Dlugach, J.M.; Yurkin, M.A.; Bi, L.; Cairns, B.; Liu, L.; Lee Panetta, R.; Travis, L.D.; Yang, P.; Zakharova, N.T. First-principles modeling of electromagnetic scattering by discrete and discretely heterogeneous random medi. Phys. Rep. 2016, 632, 1–75. [Google Scholar] [CrossRef] [Green Version]
  24. Walters, S.; Zallie, J.; Seymour, G.; Le Pan, Y.; Videen, G.; Aptowicz, K.B. Characterizing the size and absorption of single nonspherical aerosol particles from angularly-resolved elasric light scattering. J. Quantum Spectrosc. Radiat. Transf. 2019, 224, 439–444. [Google Scholar] [CrossRef]
  25. Piedra, P.; Kalume, A.; Zubko, E.; Mackowski, D.; Le Pan, Y.; Videen, G. Particle-shape classification using light scattering: An exercise in deep learning. J. Quantum Spectrosc. Radiat. Transf. 2019, 231, 140–156. [Google Scholar] [CrossRef]
  26. Laning, J.C.; Berg, M.J. Orthographic imaging of free-flowing aerosol particles. OSA Contin. 2019, 2, 3514–3520. [Google Scholar] [CrossRef]
  27. Brunel, M.; Coetmellec, S.; Gréhan, G.; Shen, H. Interferometric out-of-focus imaging simulator for irregular rough particles. J. Eur. Opt. Soc. 2014, 9, 14008. [Google Scholar] [CrossRef] [Green Version]
  28. Talbi, M.; Gréhan, G.; Brunel, M. Interferometric particle imaging of ice particles using a multi-view optical system. Appl. Opt. 2018, 57, 6188–6197. [Google Scholar] [CrossRef] [PubMed]
  29. Brunel, M.; Lemaitre, P.; Porcheron, E.; Coëtmellec, S.; Gréhan, G.; Jacquot-Kielar, J. Interferometric out-of-focus imaging of ice particles with overlapping images. Appl. Opt. 2016, 55, 4902–4909. [Google Scholar] [CrossRef] [PubMed]
  30. Talbi, M.; Brunel, M. Interferometric particle sizing with overlapping images despite Moiré. Opt. Commun. 2017, 400, 61–68. [Google Scholar] [CrossRef]
  31. Jacquot-Kielar, J.; Wu, Y.; Coëtmellec, S.; Lebrun, D.; Gréhan, G.; Brunel, M. Size determination of mixed liquid and frozen water droplets using interferometric out-of-focus imaging. J. Quant. Spectrosc. Radiat. Transf. 2016, 178, 108–116. [Google Scholar] [CrossRef]
  32. Sun, J.; Li, Z.; Tian, P.; Li, R.; Jia, D.; Liu, T.; Zhang, H. Measurement of cloud particles in a cloud chamber based on interference technology. Appl. Opt. 2019, 58, 8757–8764. [Google Scholar] [CrossRef]
  33. Jacquot, J.; Talbi, M.; Brunel, M. Third glare point effect in 90° Interferometric Laser Imaging for Droplet Sizing. Opt. Commun. 2020, 462, 125349. [Google Scholar] [CrossRef]
  34. Fienup, R.; Crimmins, T.R.; Holsztynski, W. Reconstruction of the support of an object fro the support of its autocorrelation. J. Opt. Soc. Am. 1982, 7, 3–13. [Google Scholar]
  35. Shen, H.; Wu, L.; Li, Y.; Wang, W. Two-dimensional shape retrieval from the interferometric out-of-focus image of a nonspherical particle—Part I: Theory. Appl. Opt. 2018, 57, 4968–4976. [Google Scholar] [CrossRef]
  36. Brunel, M.; Delestre, B.; Talbi, M. 3D-reconstructions for the estimation of ice particle’s volume using a two-views interferometric out-of-focus imaging set-up. Rev. Sci. Instrum. 2019, 90, 053109. [Google Scholar] [CrossRef] [PubMed]
  37. Talbi, M.; Gréhan, G.; Coëtmellec, S.; Brunel, M. Self-generated off-axis holography in interferometric out-of-focus imaging of ice particles. J. Electromag. Wav. Appl. 2019, 33, 1–17. [Google Scholar] [CrossRef] [Green Version]
  38. Zhang, H.; Li, Z.; Sun, J.; Fu, Y.; Jia, D.; Liu, T. Characterization of particle size and shape by an IPI system through deep learning. J. Quantum Spectrosc. Radiat. Transf. 2021, 268, 107642. [Google Scholar] [CrossRef]
  39. Delestre, B.; Abad, A.; Talbi, M.; Fromager, M.; Brunel, M. Experimental particle’s shapes reconstructions from their interferometric images using the Error-Reduction algorithm. Opt. Commun. 2021, 498, 127229. [Google Scholar] [CrossRef]
  40. Lemaitre, P.; Brunel, M.; Rondeau, A.; Gréhan, G.; Porcheron, E. Quasi real-time analysis of mixed-phase cloud using Interferometric out-of-focus imaging: Application the detection of freezing conditions. Meas. Sci. Technol. 2015, 26, 125403. [Google Scholar] [CrossRef] [Green Version]
Figure 1. The icing tunnel: without experiment (top), with the measurement set-up (bottom).
Optics 02 00020 g001aOptics 02 00020 g001b
Figure 2. Experimental setup (LS: laser sheet; BS: beam splitter; M: mirror; CL: cylindrical lens IFIM: in-focus imaging; OFIIM: out-of-focus interferometric imaging).
Optics 02 00020 g002
Figure 3. Typical IPI images of eight ice particles in columns (a,c), The corresponding 2-Dimensional Fourier transforms of the IPI images (presented in (a,c)) in columns (b,d). The number of grey levels has been reduced in this figure to enhance the contrast but all analyses were made with the original images.
Optics 02 00020 g003
Figure 4. Size histogram of ice particles obtained from a series of interferograms: number of particles versus the x-axis particle’s size range.
Optics 02 00020 g004
Figure 5. Binarized 2D-Fourier transform of the IPI image of an ice particle in the tunnel (a) (axes are in pixels, 5.5 μm per pixel). Four possible shapes deduced by the tri-intersection method, whose 2D-autocorrelations approximately match the contours in figure (a,cf), and an in-focus image of the real particle recorded simultaneously with a second CCD sensor (b) (same scale for all subfigures).
Optics 02 00020 g005
Figure 6. IPI image of the two nearby ice particles with overlapping interferograms (a) and the two-dimensional Fourier transform of the speckle-like pattern (presented in (a)) (b). (The number of grey levels has been reduced in this figure to enhance the contrast but all analyses were made with the original images).
Optics 02 00020 g006
Figure 7. One of the two symmetric spread spots of Figure 6b (a), its binarized 2D-autocorrelation (b) and the central spread spot of Figure 6b for comparison (c). Axes units are in pixels.
Optics 02 00020 g007
Figure 8. Overlapping out-of-focus images of two nearby ice particles inducing Moiré effects (a) and the two-dimensional Fourier transform of the speckle-like pattern (presented in (a)) (b). The number of grey levels has been reduced in this figure (a) to enhance the contrast, but all analyses were made with the original images.
Optics 02 00020 g008
Figure 9. In-focus image of the measurement field when packets of nitrogen particles cross the measurement area (a), the out-of-focus image recorded simultaneously (b).
Optics 02 00020 g009
Table 1. Ice particle size measurements obtained from the 2DFT of the speckle-like IPI patterns with measurement uncertainties, from columns (b) and (d) of Figure 3.
From Column (b) From Column (d)
xIPI,size (μm)yIPI,size (μm)xIPI,size (μm)yIPI,size (μm)
221 ± 10151 ± 10181 ± 10164 ± 10
243 ± 10165 ± 10158 ± 10164 ± 10
193 ± 10119 ± 10222 ± 10181 ± 10
141 ± 10155 ± 10104 ± 10104 ± 10
Publisher’s Note: MDPI stays neutral with regard to jurisdictional claims in published maps and institutional affiliations.