Article

Simulation and Experimental Validation of Splat Profiles for Cold-Sprayed CP-Ti with Varied Powder Morphology

1
ARC Training Centre in Surface Engineering for Advanced Materials (SEAM), Swinburne University of Technology, H38, P.O. Box 218, Hawthorn, VIC 3122, Australia
2
Titomic Limited, 365 Ferntree Gully Road, Mount Waverley, VIC 3149, Australia
3
Department of Mining and Materials Engineering, McGill University, Montréal, QC H3A 0C5, Canada
4
Centre of Expertise for Structural Mechanics, Department of Mechanical and Aerospace Engineering, Monash University, Clayton, VIC 3800, Australia
*
Author to whom correspondence should be addressed.
Appl. Mech. 2025, 6(2), 33; https://doi.org/10.3390/applmech6020033
Submission received: 13 January 2025 / Revised: 3 April 2025 / Accepted: 15 April 2025 / Published: 30 April 2025

Abstract

:
The cold spray (CS) process has gained momentum as an additive manufacturing technology, due to its low processing temperatures. Computational modelling can accompany CS experiments to optimise deposition parameters, as well as predict coating properties and their final performance. A commonly used plasticity model is the Johnson–Cook (JC) model; however, its accuracy is limited at the high strain rates typical of cold spray. This study aims to assess the robustness of predictions using a modified JC model, particularly for two material systems of commercially pure titanium (CP-Ti) and Al6061-T6, and feedstock powders of two sizes and three morphologies. CP-Ti powders of spherical and irregular morphologies were sprayed onto CP-Ti substrates using a Titomic TKF1000 cold spray system. The cross-sectional splat profiles and flattening ratios were compared against smoothed particle hydrodynamics (SPH) simulations. The deposition process of particles was simulated using a modified JC model, implemented as an ABAQUS (2020) VUHARD user subroutine programme. The results showed that SPH simulations predicted the depth of impact, the splat profiles and the flattening ratios. Additionally, the simulations indicated that the impacting particle temperature remained below the melting point of CP-Ti throughout the process. Lastly, it was demonstrated that the irregular CP-Ti feedstock showed greater tendency of restitution than spherical feedstock.

1. Introduction

Cold spray has been heavily used in the surface coating industry since the early 1990s [1]. Over decades of development, cold spray has started to gain momentum in the additive manufacturing sector [2,3]. Cold spray is a process whereby feedstock powder particles are accelerated to supersonic velocities to impinge upon suitable substrates to form coatings. A stream of nitrogen or helium gas is injected with metal or metal alloy feedstock powders, such as aluminium 6061, copper, and commercially pure titanium (CP-Ti), and accelerated to velocities ranging from 300 to 1200 m/s [4,5]. The cold spray torch is directed by an industrial robot, which can execute a series of precise spline movements to achieve free-form, layer by layer metal prints or coatings.
As the feedstock particles impact the surface of the substrate, they deform extensively and adhere to the substrate. The cold spray deposition process is generally thought to be happening below the melting point of the associated feedstock/substrate materials [6,7]. Cold spray bonding models such as adiabatic shear instability (ASI) [8], mechanical interlocking [9], atomic diffusion [10], interface amorphisation [11], hydrodynamic spalling [12], etc., have been proposed to explain how bonding between feedstock and substrate arises without melting. However, some studies observed the phenomenon of “outward jetting” [13], which could be a sign that localised melting took place before rapid solidification. Due to the lack of a unified cold spray bonding theory, ASI has remained the prevailing model to describe the bonding phenomena observed in cold spray process. Due to the high velocities and short time scales involved in cold spray, it is difficult or impossible to observe the deposition process experimentally. Therefore, numerical simulations can serve to overcome these challenges, providing insights such as stresses and strains experienced by the feedstock particle, and predicting deposition behaviour.
An extremely high strain rate (on order of magnitude 109 s−1) is required for plastic deformation of feedstock particles on the substrate’s surface and thus for bonding to occur [14]. To successfully estimate the temporal evolution of plastic flow stress throughout the deposition process, a material deformation model is required. The standard Johnson–Cook (JC) plasticity model offers a basic framework for the prediction of plastic flow stress due to variations in strain, strain rate, and temperature. However, this model consistently failed to predict the flow stress at high strain rates (on order of magnitude 104 s−1). Therefore, it is believed that using the standard JC model to simulate cold spray applications might also lead to greater prediction errors. Chakrabarty and Song [15] had modified the standard JC model with two additional parameters—the critical strain rate and a power-law parameter dictating the ratio of plastic strain rate to critical strain rate—to profile the flow stress when the strain rate is higher than a critical value.
In simulations of the cold spray deformation process, a large amount of discrete finite elements is used to model powder particles undergoing extensive distortions simultaneously. Therefore, the smoothed particle hydrodynamics (SPH) method was selected for this study to handle the rapid clustered motions during the deposition process. In comparison to the traditional tetrahedron mesh element, the points in SPH are not connected by their edges, as multi node element connectivity does not need to be defined. Meshing remains a means of distributing SPH particles at the initial time step; however, it is not required after time evolution begins. The meshless nature of SPH also helps avoid mesh distortion in the simulation, which is a very common problem to encounter in the modelling of highly dynamic phenomena [16,17,18,19]. In our previous work [5], Chakrabarty and Song’s modified JC model [15] was adopted to model the high strain rate impact response of an 80 µm Al6061-T6 particle impinging on an Al6061-T6 substrate. When the relative bond characteristics of the feedstock particles of spherical and elongated morphologies were investigated purely using the SPH modelling framework, it was found that particles with spherical morphology were more likely to rebound from substrates than for elongated particles [5].
The main objectives of this research are to investigate the effect of feedstock particle size and additional particle morphologies on deposition properties and behaviour. Furthermore, the modified JC model is validated against an additional material, CP-Ti. The simulations in the current study also adopted Chakrabarty and Song’s [15] modified JC model and implemented it as an ABAQUS (USA) VUHARD [20] user subroutine. As an extension of our previous work [5], smaller 40 µm Al6061-T6 feedstock particles were used in finite element analysis so that it could be determined whether a decrease in feedstock size plays a vital role in deposition. Subsequently, we applied the model to CP-Ti feedstock particles with spherical, elongated, and irregular morphologies impinging on CP-Ti substrates and compared the results against experimental studies. This study aims to validate the robustness of the modified JC model on two material systems, two particle sizes, and three particle morphologies. Additionally, we seek to gain insights into the influence of deposition behaviour, such as impact depth and recoverable strain energy, on the final adhesion and profile of the splat.

2. Materials and Methods

2.1. Simulation Setup

2.1.1. CAD Model Generation

For feedstock particles, three morphologies were simulated—spherical, elongated, and irregular. The CAD models of feedstock particles and substrate could either be created in ABAQUS part module, or externally through other CAD software such as OpenSCAD [21]. Version 2021.01 of OpenSCAD was used for this study. For elongated and irregular particle morphologies, the CAD models had to be created in OpenSCAD because the complexity of their respective geometries proved to be overly complicated for handling by the ABAQUS part module. The elongated feedstock particle was parametrically generated with a degree 5 Bezier function as the parent profile. For the irregular feedstock particle, the base geometry was a square block, and the resultant 3D model was the result of multiple Boolean operations [22] cutting away the arbitrary edges of the base geometry. The irregular morphology did not require surface modelling, therefore the need for initialising parameters was eliminated. The main parameters associated with generating the irregular feedstock particle were the height, width, and length of the base geometry and the tool geometries. After the irregular and elongated particle CAD models were created, they were imported into ABAQUS CAE. See Figure S1 of the Supplementary Materials for the CAD models of the irregular and elongated particle morphologies.
Following the previous methodology used by Tai et al. [5], the substrate, spherical-particle, and elongated particle CADs were generated. For both substrate and spherical particles, the geometries were created directly within ABAQUS CAE. The cylindrical substrate geometry was concentrically partitioned, with a smaller cylinder in the centre.

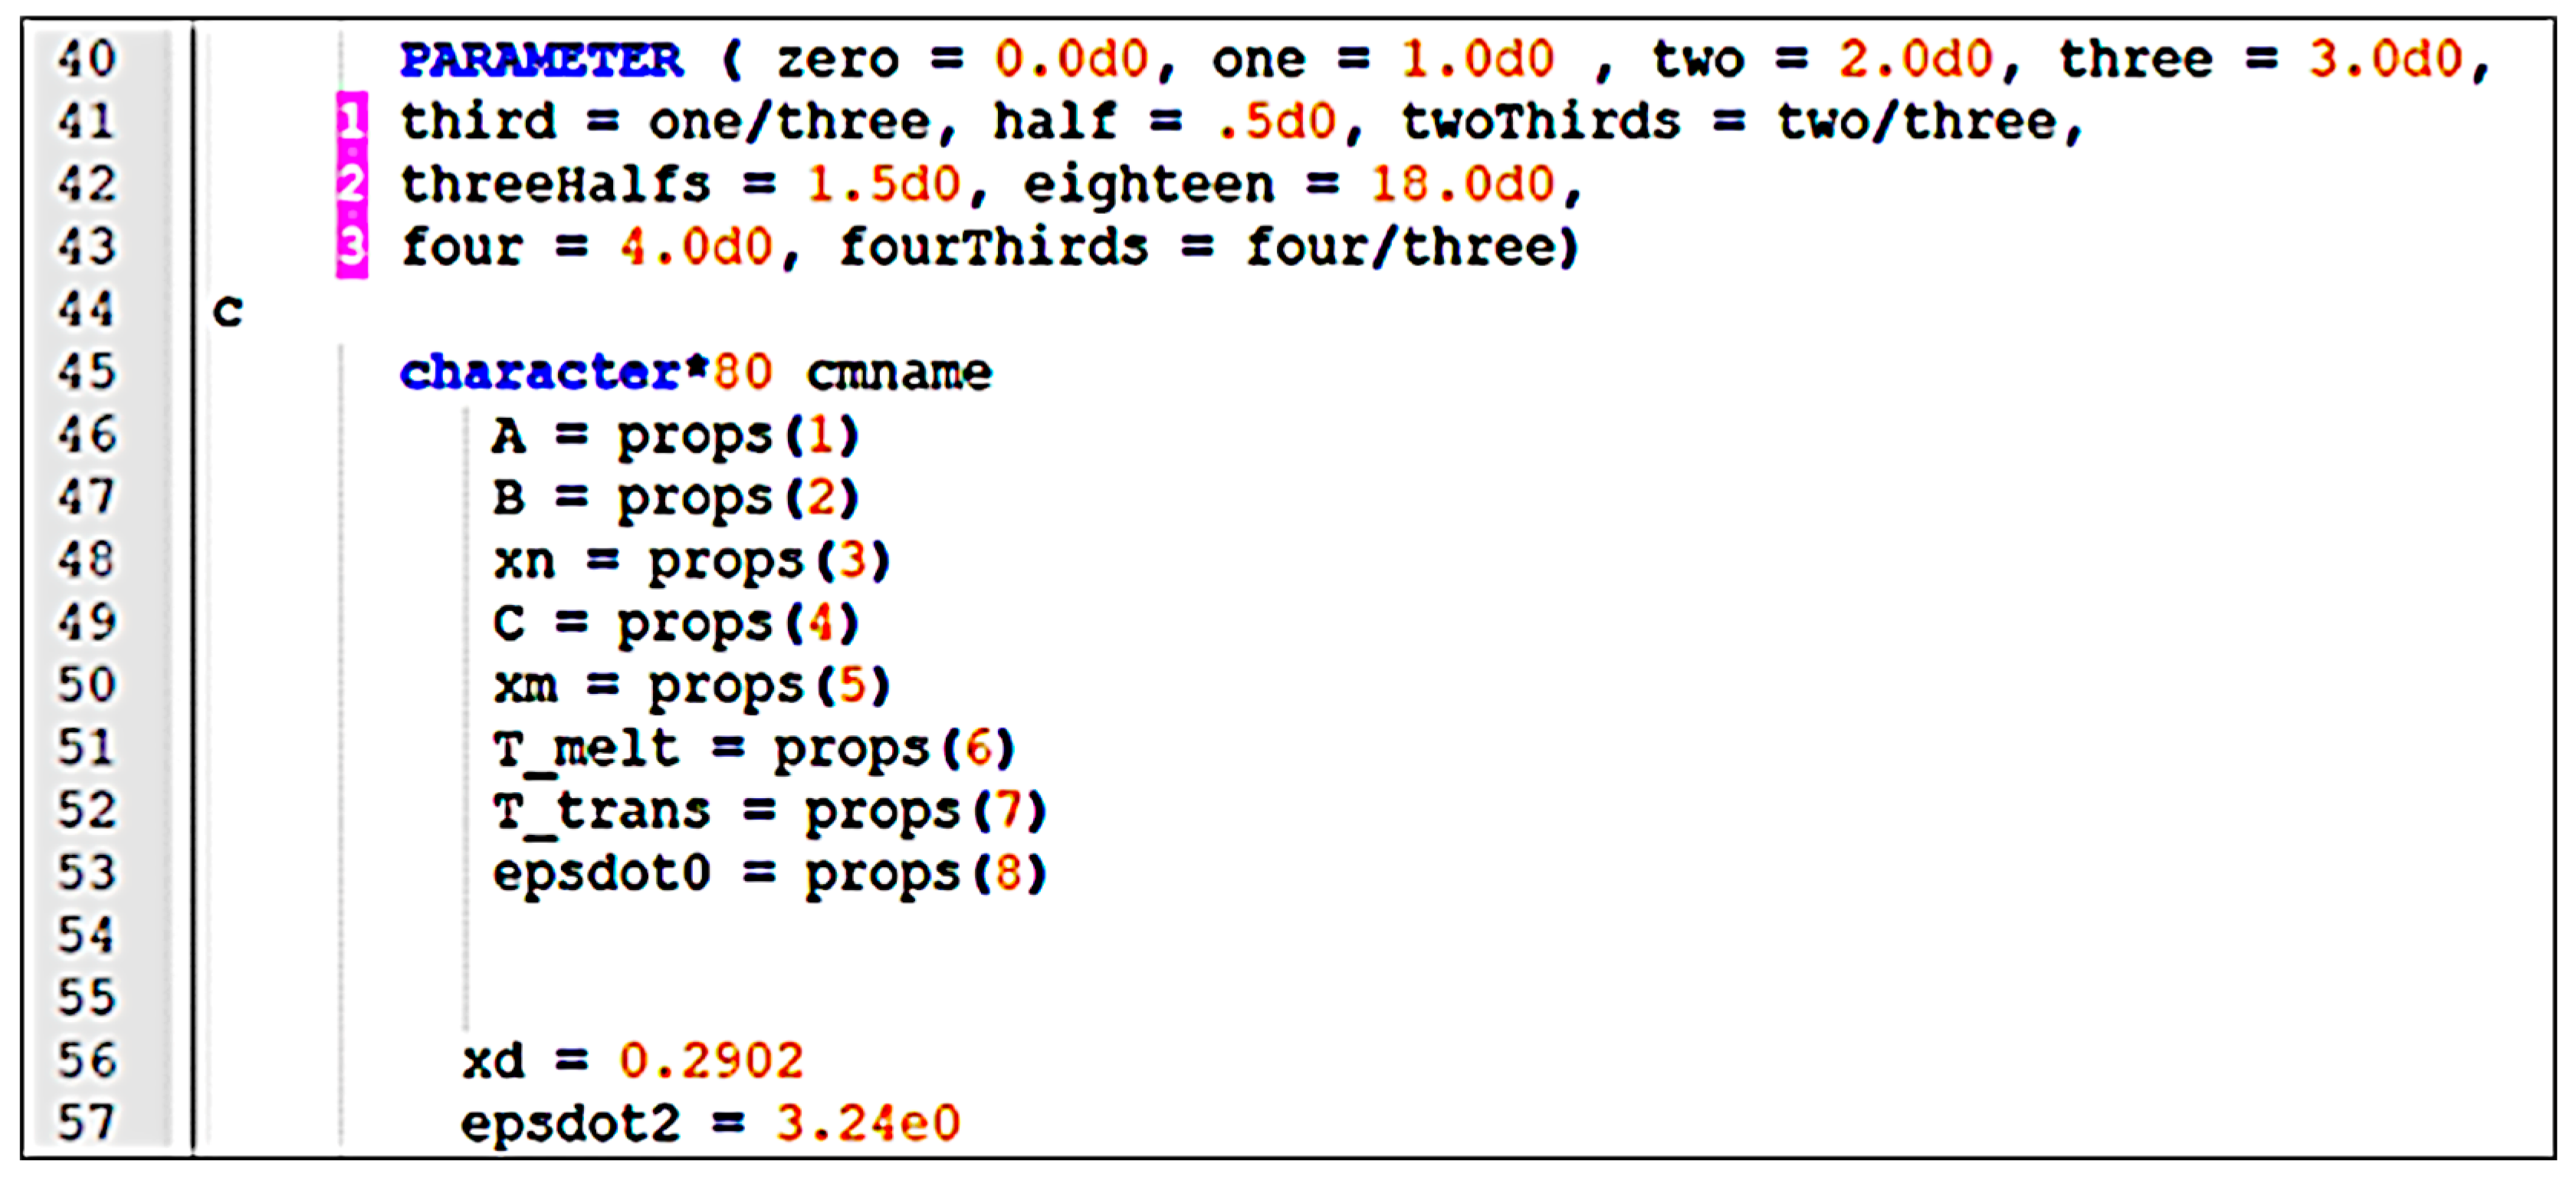
2.1.2. Modified Johnson–Cook (JC) Parameters

Equation (1) presents the standard Johnson–Cook (JC) equation, while Equation (2) presents the modified JC equation proposed by Chakrabarty and Song [15]:
σ J C s t a n d a r d = A + B ε p n 1 + C ln ε ˙ p ε ˙ 0   1 T T r e f T m T r e f m
where σ J C is the flow stress, ε p is the equivalent plastic strain (PEEQ), ε ˙ p is the plastic strain rate, ε ˙ 0 is a reference strain rate, T r e f   is the reference temperature, and T m is the melting temperature.
σ J C m o d i f i e d = A + B ε p n 1 + C ln ε ˙ p ε ˙ 0 ε ˙ p ε ˙ c D 1 T T r e f T m T r e f m
Here, D  = 0 ,   ε ˙ p < ε ˙ c x , ε ˙ p ε ˙ c   ε ˙ c = y s 1 , ε ˙ c is the critical strain rate.
The parameters for Al6061-T6 were referenced from Chakrabarty and Song [15] for both the standard and modified JC models. However, for CP-Ti, the values of fitting parameters ε c ˙ and D for the modified JC model had not been calibrated previously in the literature. Instead, procedures outlined in the work of Murugesan [23] were referenced to calibrate the standard JC parameters A, B, C, n, and m, while the fitting parameters, ε c ˙ and D , from the modified JC model were calibrated using the CP-Ti strain rate sensitivity data from Li et al. [24].
To obtain the values of fitting parameters ε c ˙ and D , the values of parameters A ,   B ,   c ,   n , and m were determined beforehand. Nemat-Nasser et al. [25] had investigated the mechanical properties of commercially pure titanium (CP-Ti) and produced the stress–strain curves in various temperatures and strain rates. This current study uses a reference temperature (Tref) of 296 K and reference strain rate ( ε 0 ˙ ) of 0.1 s−1 as the baseline to estimate the values of parameters A, B, C, n, and m.
When the deformation temperature, T, is at 296   K , and the strain rate, ε ˙ p , is at 0.1 s 1 , Equation (1) can be simplified to Equation (3):
σ J C = A + B ε p n
Rearranging and applying natural log on both sides of Equation (3) results in Equation (4) and a plot of l n σ J C A against l n ε p , as shown in Figure S2 in the Supplementary Materials.
l n σ J C A = n   l n ε p + l n ( B )
Parameter A refers to the yield stress, which was taken as 185.7 MPa from the stress–strain curve in Figure 1B of reference [25] at a low strain of 0.002. As l n B is the Y-intercept in Figure S2 in the Supplementary Materials, B was calculated to be 998.72 MPa. Substituting A as 185.7 MPa and B as 998.72 MPa into Equation (4), the gradient of the linearised plot, n, is determined to be 0.6757.
For the determination of parameter C, a simplification of T = Tref was applied and Equation (1) was rearranged to Equation (5):
σ J C s t a n d a r d A + B ε p n = 1 + C ln ε ˙ p ε 0 ˙    
Substituting in A = 185.7, B = 988.72, n = 0.6757, and ε 0 ˙   = 0.1, Equation (5) was plotted based on the stress–strain data sets at 0.001, 0.1, and 8000 s−1 (T: 296 K) in Figure S3 of the Supplementary Materials. To mimic the expression in Equation (5), Y-intercept = 1 was forced in the linear fit; C was determined to be 0.0029, see Figure S4 of the Supplementary Materials.
To determine the value of m, Equation (1) is re-arranged and natural logarithm applied. Thus, Equation (6) is formed:
l n 1 σ J C s t a n d a r d A + B ε p n = m   l n T T r e f T m T r e f
Based on Equation (6), the values were computed based on the stress–strain data sets data at T = 373, 473, 598, and 798 K ( ε 0 ˙ = 0.1 s−1) from Nemat-Nasser et al.’s study [25], presented in Figure S5 of the Supplementary Materials. By forcing the linear fit to have the Y-intercept = 0, Equation (6) was mimicked and the value of m was determined to be 0.4254 (see Figure S6 of the Supplementary Materials).
It is important to note that all strain rates and temperature values should be continuously considered to produce a more realistic set of JC parameters [23]. However, due to insufficient stress–strain data available from the literature, the least square curve fitting tool in MATLAB version 9.10 [26] was used to minimise the prediction error. Although the MATLAB optimisation tool could help minimise the prediction error, an appropriate range of initial values are still required. Therefore, the previously determined values for A, B, C, n, and m, were utilised as the initial values.
A set of strain rate sensitivity data for commercially pure titanium [24] with 72 μm size was used as the reference for the optimisation of standard JC parameters in this study. In addition to this, fitting a least-squares curve based on the modified JC model (see Equation (2)) onto the strain rate sensitivity data helped determine the values of the fitting parameters ε c ˙ and D. Therefore, instead of the standard JC equation (Equation (1)), the modified JC equation was directly implemented as the optimisation function in MATLAB. However, due to the unknown ε c ˙ and D values for CP-Ti, that of the Ti-6Al-4V was referenced from Chakrabarty and Song [15] as the initial values for the optimisation problem.
Table 1 summarises the results of the initial and optimised values for CP-Ti in the modified JC model. Previous authors have also identified JC model parameters for CP-Ti [27]. Parameter B has been reported to range from around 300 to 850, placing the calculated value in this work above the reported range. Exponent n has been reported in the literature as between approximately 0.1 to 0.6, so our optimised value is towards the lower end of the range. This could possibly be due to differences in the data set used for calculations. For example, the yield stress, given by A and taken as 185.7 MPa in this paper, is lower than that reported in the literature of around 250 to 400 MPa. The definition of yield stress, e.g., different strain or offset, can lead to varying results in the reported yield stress.
Figure 1 shows that with the optimised JC parameters, simulations using the modified JC model correlated better than the standard JC model for experimental data, especially at higher strain rates.

2.1.3. Preparation of Simulation Inputs

A standard workflow was used for the preparation of simulation with the ABAQUS analysis software. After CAD part creation, a material library was constructed for assignment. The material properties of Al6061-T6 alloy were referenced from Chakrabarty [15], while the standard and modified Johnson–Cook parameters of CP-Ti were calibrated based on the stress–strain data from Nemat-Nasser et al. [25] and the strain rate sensitivity data from Li et al. [24]. The parameters marked by * in Table 2 were initialised in ABAQUS CAE, while the rest were manually edited into the material section in the input file so that the VUHARD user subroutine programme (modified Johnson–Cook model) could externally process and calculate the instantaneous flow stress throughout the deposition simulation. The VUHARD user subroutine programme is written separately in FORTRAN. The values for the two additional fitting parameters in Chakrabarty and Song’s [15] modified Johnson–Cook model, D and ε ˙ c , can be varied in the Fortran code, as presented in Figure 2.
Once the material model was created, sections were defined in ABAQUS. Generally, independent sections must be defined based on the material used in each component in the simulation model. Since there was no joint structure in this study, each feedstock particle and substrate was defined as separate sections, and each had a material of interest assigned to them for each deposition simulation.
To set up the initial position of the feedstock particle relative to the substrate, instances were created from the feedstock particle and substrate. Once instances were initialised in ABAQUS, the feedstock particle instance was translated to the desired starting position based on Table 3.
Figure 3 shows the feedstock particles’ configurations for multiple particle simulations. For the single particle simulations, the same configuration was used, with particles 2 to 5 suppressed, leaving only the central particle 1.
In real world CS applications, the substrate is often fixed or bolted down to the fixture so that it does not move during the deposition process. Therefore, encastre boundary conditions were applied to the substrate, to ensure no translation or rotation on the sides, while the impact interface remained free for deformation.
In addition to the initial conditions, the feedstock particles and substrate temperature were set to 25 °C. The feedstock particles were set up to travel toward to substrate in perpendicular to the impact interface at constant impact velocity at 970 m/s for CP-Ti and 700 m/s for Al6061-T6 feedstock particles, which were experimentally determined and referenced from the literature [5], respectively.
This study focused purely on utilising the smoothed particle hydrodynamics (SPH) numerical simulation method for cold spray applications. As reviewed, although SPH required no mesh as soon as time evolution started, a mesh was needed for the initial distribution of SPH particles. The spherical feedstock particle was partitioned by XY, YZ, and XZ datum planes and meshed at a global size of 4.5 × 10⁻⁶ m with 8-node linear brick elements. The elongated and irregular feedstock particles were freely meshed with 4-node linear tetrahedron elements at a global size of 5 × 10⁻⁶ m. The global size is not defined in SPH and is instead defined when the CAD model is input into ABAQUS CAE. Please refer to Figure S1 of the Supplementary Materials for the dimensions of the irregular and elongated particle morphologies. The spherical particle morphology was created directly in ABAQUS CAE as a sphere of 80 µm diameter.
To reduce the computing effort required, the substrate was face-type partitioned into two concentric cylinders, meshed with a global mesh size of 3.5 × 10 6 , and an element size of 3 × 10 6 was applied as the local seeds to the middle cylindrical section of the substrate. Mesh convergence study of each particle morphology was conducted by maintaining a smoothing length large enough to scan 50 elements, and the mesh density was varied until the output maximum von Mises stress of each case converged [5].
The job created from ABAQUS CAE used the standard JC model, selected during material specification step, as a template for deposition simulations. To run the VUHARD user subroutine programme that represents the modified JC model in conjunction to ABAQUS computation, an input file for each deposition simulation was generated from ABAQUS CAE and manually edited. Then, an ABAQUS command was used to initiate job analysis.

2.2. Experimental Setup

To validate the performance of the modified JC model, the cross-sectional splats profiles of particles deposited by cold spray, were selected to be the key metric used to compare experiment against simulation. Single splat experimental data were obtained by using the Titomic’s TKF1000 (Titomic, Melbourne, Australia) [28] cold spray system, along with a Dual-slitted Pyrometry (DPV) inflight particle diagnostic system (Tecnar DPV-2000, Saint-Bruno, QC, Canada) used to measure the size distributions and velocity of feedstock particles in the spray plume. CP-Ti powders of spherical and irregular morphologies were supplied by Titomic Pty. Ltd. (Melbourne, Australia), as shown in SEM micrographs [29] in Figure 4.

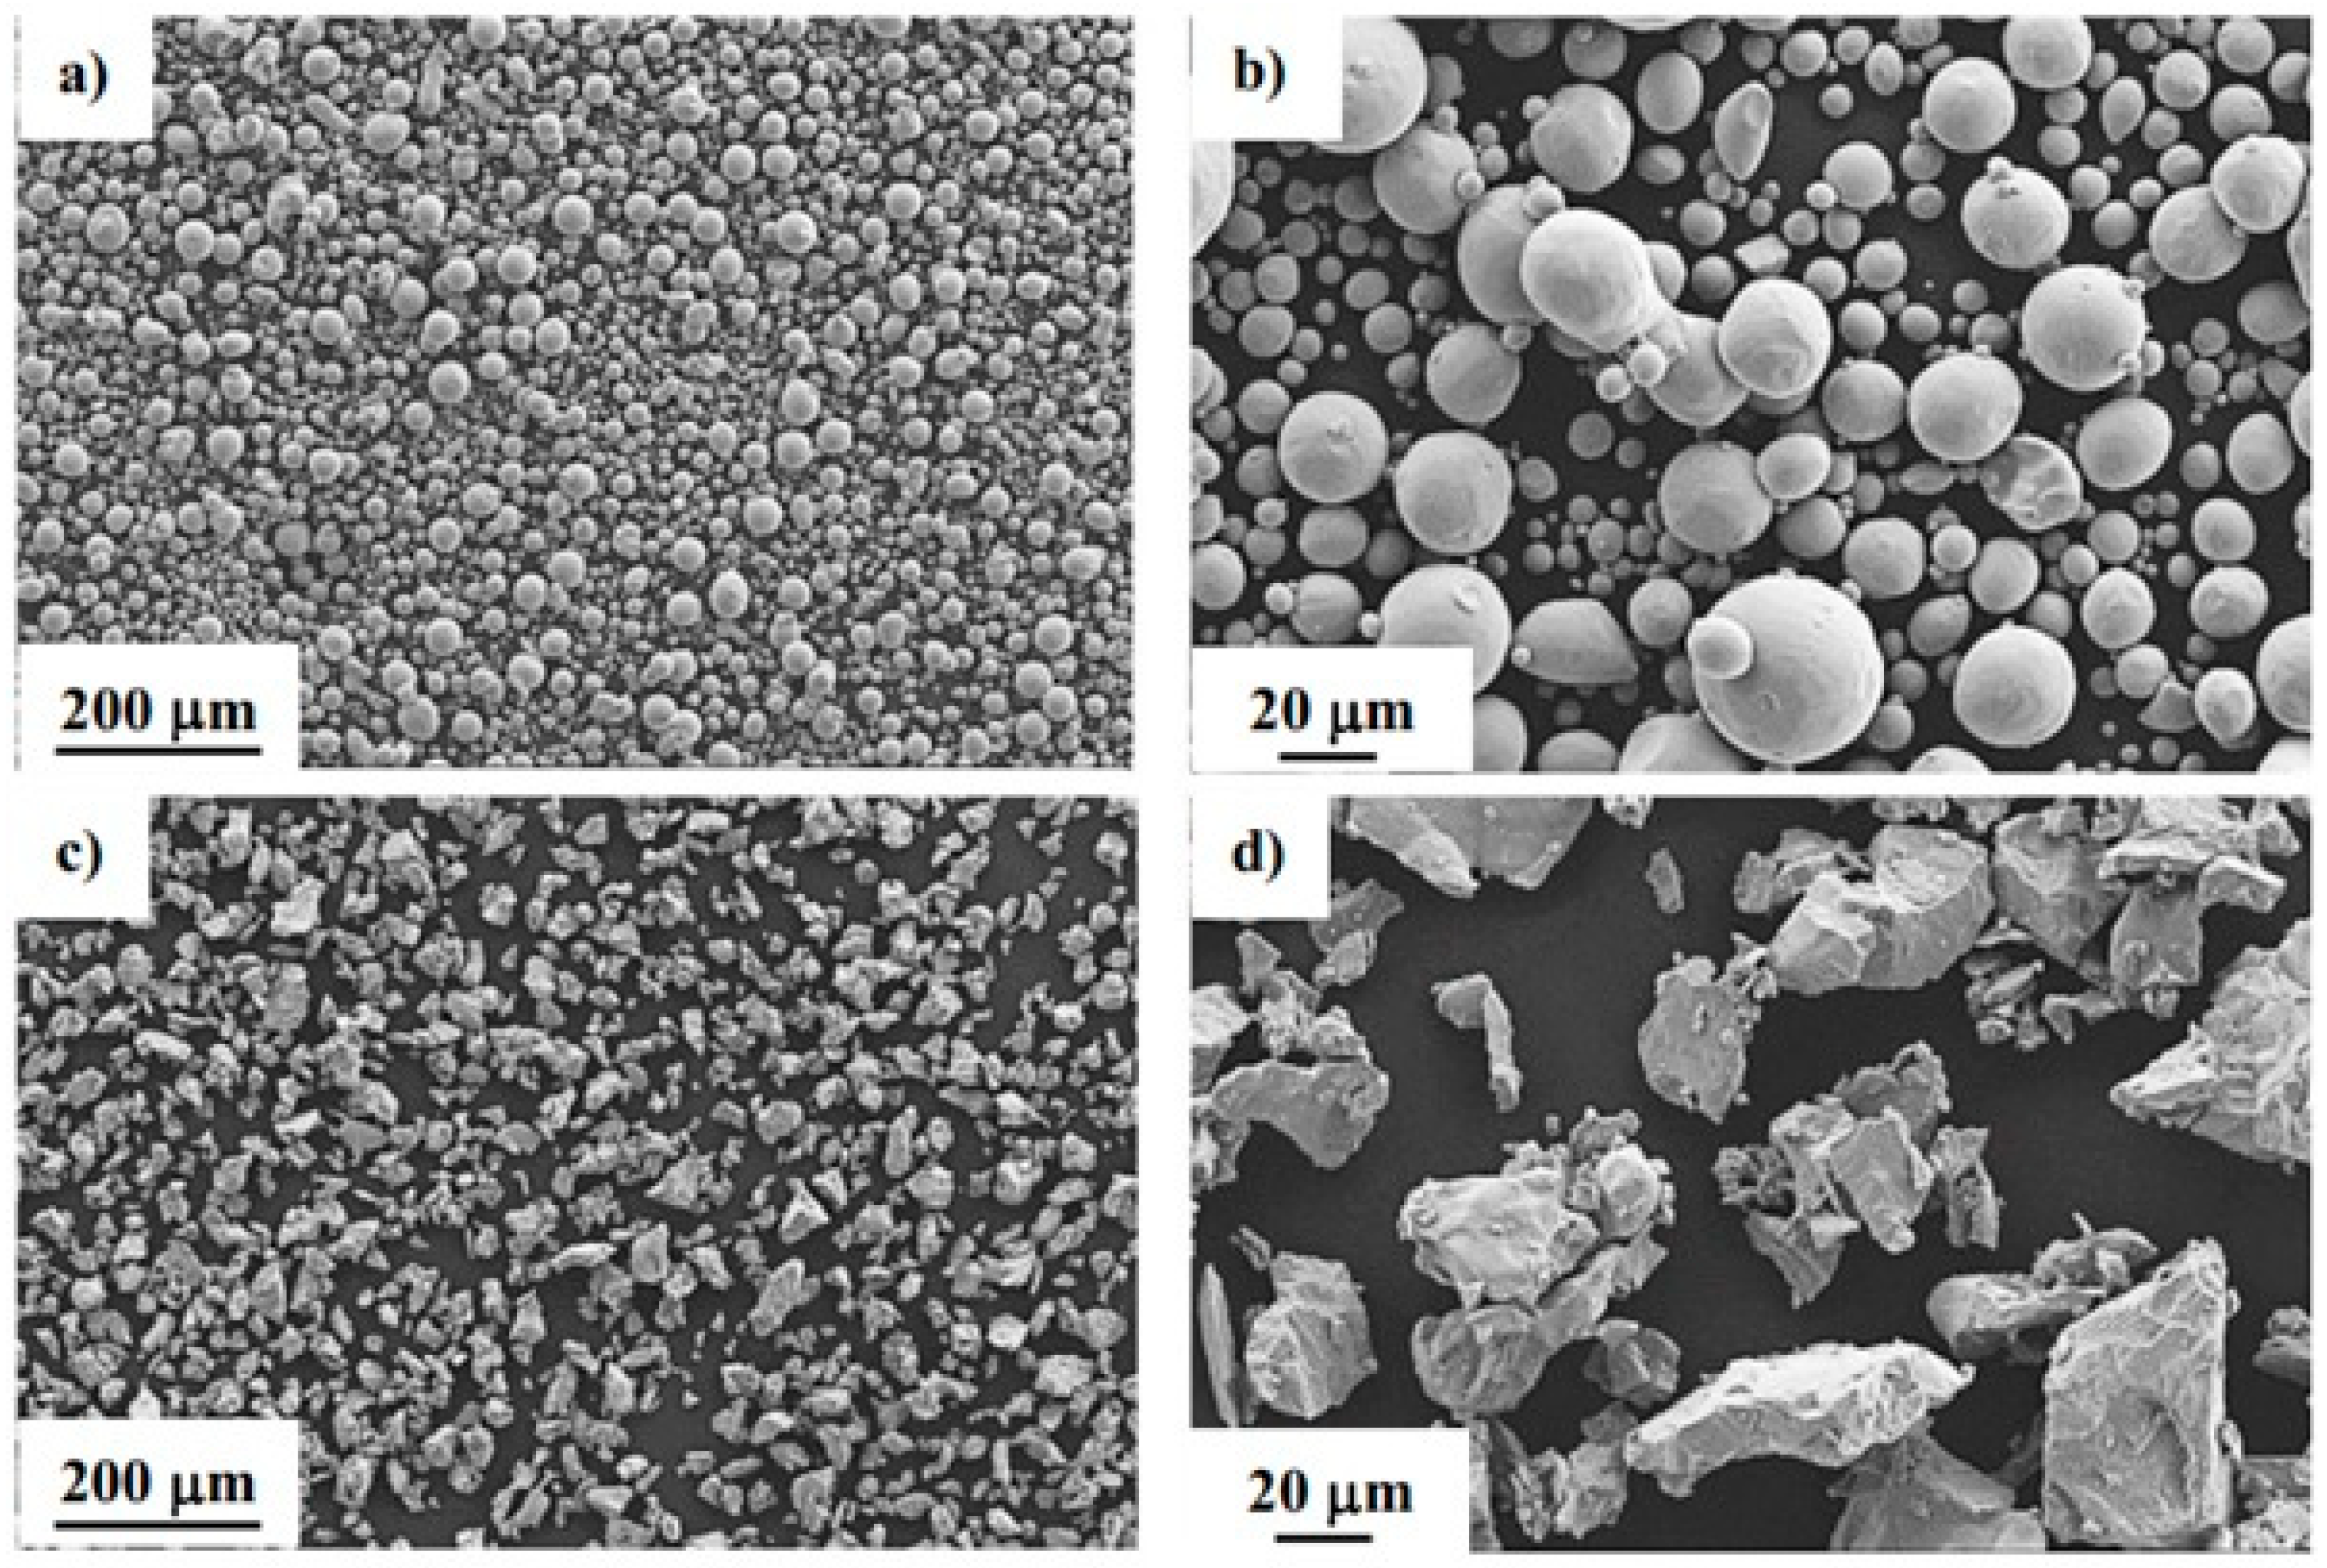
2.2.1. Feedstock Powder Preparation

To ensure that simulated and experimental results were reasonably comparable, the feedstock powders must be maintained within a narrow size distribution. The CP-Ti feedstock of both morphologies used were first mesh sieved to ensure that the particle size distribution was between 20 µm and 45 µm, by using a powder sieving machine. During each cycle of sieving, the vibration amplitude was set to 3 mm, with a cycle time of 10 min. At the beginning of every cycle, 200 g of feedstock powder was poured into the top sieve of 45 µm. At the end of each cycle, powders from the 20 µm sieve were collected as 20 µm to 45 µm feedstock for the experiments. To prevent moisture from playing a role in the experiments, all feedstock powders were dehumidified in a vacuum oven at 120 °C for 16 h prior to the experiment.

2.2.2. Substrate Preparation

The CP-Ti substrates were prepared by sanding and polishing to achieve a similar surface roughness Sa value of 0.36 ± 0.05 µm. The substrates were cleaned with isopropyl alcohol (IPA) and vacuum-sealed for transportation. Prior to the experiment, they were once again cleaned with IPA and then bolted down onto a vertical jig for spray operation.

2.2.3. Cold Spray Procedure

In each spray, the spray gun was moved to the DPV particle diagnostic system location. During this stage, the robot was positioned so that the nozzle exit was vertically 50 mm away from the DPV camera, and by feeding powder at a steady state for 30 s, particle velocities and particle size distribution data were then obtained. Following measurements, the spray gun moved across the substrates at 2 m/s to deposit a low-density trail. Lastly, the spray gun was returned to its original position and readied for the next sequence. Once all the required single-splat coupons were obtained, 5 mm-thick coatings for each powder morphology on CP-Ti substrate were obtained for the multiple-particle deposition study.

2.2.4. Post-Experimental Analysis

The single-splat coupons were observed under a Bruker AXS Contour GT-K Optical Profilometer (Billerica, MA, USA), using vertical scanning interferometry under 50× objective, 1× multiplier at 1× speed. The greatest possible variation in featured height was 30 µm and the increase in the peak-to-valley height was 15%. The vertical length for the system to scan for measurement varied within 40–60 µm for different samples. To achieve consistency in terms of the acceptable signal-to-noise ratio level, a modulation threshold value of 0.05% was used for all measurements. The surface contours of the single splats were then extracted as spatial 2D line data, with the maximum contour taken as the cross-section through the centre of the splat. As the raw data from the profiling were noisy, a data cleaning script was prepared using MATLAB, incorporating the smoothdata function [30] to filter out measurement noise. The cross-sectional profiles were used for the calculation of flattening ratios. A total of 20 single-splat profiles for the spherical feedstock and 25 for the irregular feedstock were obtained and averaged for the single-splat analysis.
To prepare the cold-sprayed coupons for observation and analysis, the sample preparation procedure from [31] was followed. The cold-sprayed coupons were clamped and aligned in a direction with respect to the rotation of the aluminium oxide cutting disc, and then they were cut and sectioned. Next, each cold-sprayed sample was cold mounted in epoxy resin (EpoFix, Struers, Copenhagen, Denmark) in a cylindrical resin mould. Fluorescent dye was added the resin and infiltrated under vacuum at 80 kPa for 10 min to infill pores and make them visible under UV illumination. Upon hardening, the mounted samples were extracted from the mould, and metallographically ground and polished, prepared for microscopic observation.
The samples were then etched in a solution of Kroll’s reagent (2% hydrofluoric acid, 6% nitric acid). Due to the hazards of the etchant, the etching procedure was performed externally at the Melbourne Centre for Nanofabrication facility. The samples were submerged in Kroll’s reagent for varying lengths of time, until the surface underwent a slight visible change in colour, before being rinsed with water to halt the etching process. Samples were then inspected under an optical microscope and further etched if deemed necessary. The length of time for etching was varied depending on the combination of deposit and substrate materials, with CP-Ti etching within 15–20 s. The samples were thoroughly rinsed after etching and then dried with nitrogen. Microscopic images of the coupons’ cross-sections were obtained and compared against the results of the multiple particle simulations.

3. Results and Discussion

3.1. Comparison of 80 µm and 40 µm Al6061-T6 Feedstock

The effects of varying feedstock particle size were investigated by comparing the cold spray deposition simulation results when using a 40 µm Al6061-T6 particle, to that from Tai et al.’s [5] earlier simulation study using 80 µm Al6061-T6 particles. Similarly, when examining the stress profile of the 80 µm Al6061-T6 feedstock simulations [5], the deformations observed in the 40 µm particle were greater in the standard JC model than the modified JC model, although the latter experienced higher maximum von Mises stress throughout the impact. At the end of the impact, the maximum stress experienced by the overall bonded system under the standard JC model, as shown in Figure 5a, was 381 MPa and that under the modified JC model, as shown in Figure 5b, was 521 MPa. The difference in stress experienced under both material models for 40 µm feedstock was 36.7% lower than the simulations using 80 µm feedstock, where the stress difference was 44.2%. This is within expectations, as jetting was less significantly observed under the modified JC model.
The decrease in stress experienced as a result of using standard and modified JC for 80 µm and 40 µm were 3% and 8%, respectively. This demonstrated that in general, the observed stress was affected by the feedstock particle size, where larger feedstock particles resulted in greater stress experienced than the smaller feedstock particles. The difference in stress experienced was also further magnified when using the modified JC model.
Figure 6 shows splats formed under the (a) standard and (b) modified JC models for splats of a 40 µm feedstock particle. The flattening ratio in cases (a) and (b) were 2.23 and 1.48, respectively. In comparison to the simulation cases of using an 80 µm feedstock particle, the flattening ratios differed by approximately 14% between the standard and modified JC models.
The maximum temperatures observed of the overall bonded system under the standard and modified JC models were 264 °C and 492 °C, respectively (see Figure S7 in the Supplementary Materials). In contrast, those for the 80 µm simulations were 374 °C and 498 °C. While the temperature evolution of all Al6061-T6/Al6061-T6 simulation cases stayed below the melting temperature of Al6061-T6, the observed maximum temperature from the simulations under the standard JC model using a 40 µm feedstock particle was far lower than that under modified JC model. This implied size could affect the evolution of temperature by a more significant extent if the standard JC model is used.

3.2. Impact of CP-Ti Feedstock on CP-Ti Substrate

In the previous section, Al6061-T6 was simulated for a feedstock particle size of 40 µm, which is closer and more representative to that of the CP-Ti powders used for the cold spray experiments. By input of the material parameters for CP-Ti into the 40 µm particle models, standard and modified JC models were generated for 40 µm spherical and irregular morphologies. The experimental verification of the simulations was therefore conducted by cold spray of CP-Ti spherical and irregular powders onto CP-Ti substrate.
This experiment was conducted to produce single splats by depositing CP-Ti feedstock particles onto CP-Ti substrate. The particle sizes and velocities of the spray plume were measured by the Tecnar DPV-2000 in-flight diagnostic system. Both measured particle sizes and impact velocities are presented in Figure 7. See Figures S8 and S9 of the Supplementary Materials for the distribution curves of particle sizes and velocity, respectively. The mean feedstock powder sizes were taken as the peak of the normal distribution curves and found to be 28.06 µm and 29.44 µm for irregular and spherical CP-Ti powders, respectively. Additionally, the mean velocities of the in-flight CP-Ti particles were found to be 921 m/s and 1017 m/s for spherical and irregular morphologies, respectively.
For simplicity, the simulated particle diameters for the feedstock particles were approximated for both morphologies as 40 µm. The average of the measured impact velocities, 970 m/s, was used as the impact velocity of all simulations. The experimental splat profiles and flattening ratios were then compared against the simulated results. The simulated stress profile and temperature evolution were compared for both morphologies and for simulations using both the standard and modified JC models. In addition to this, the recoverable strain energies in each morphology cases were extracted to evaluate the relative bond characteristics.

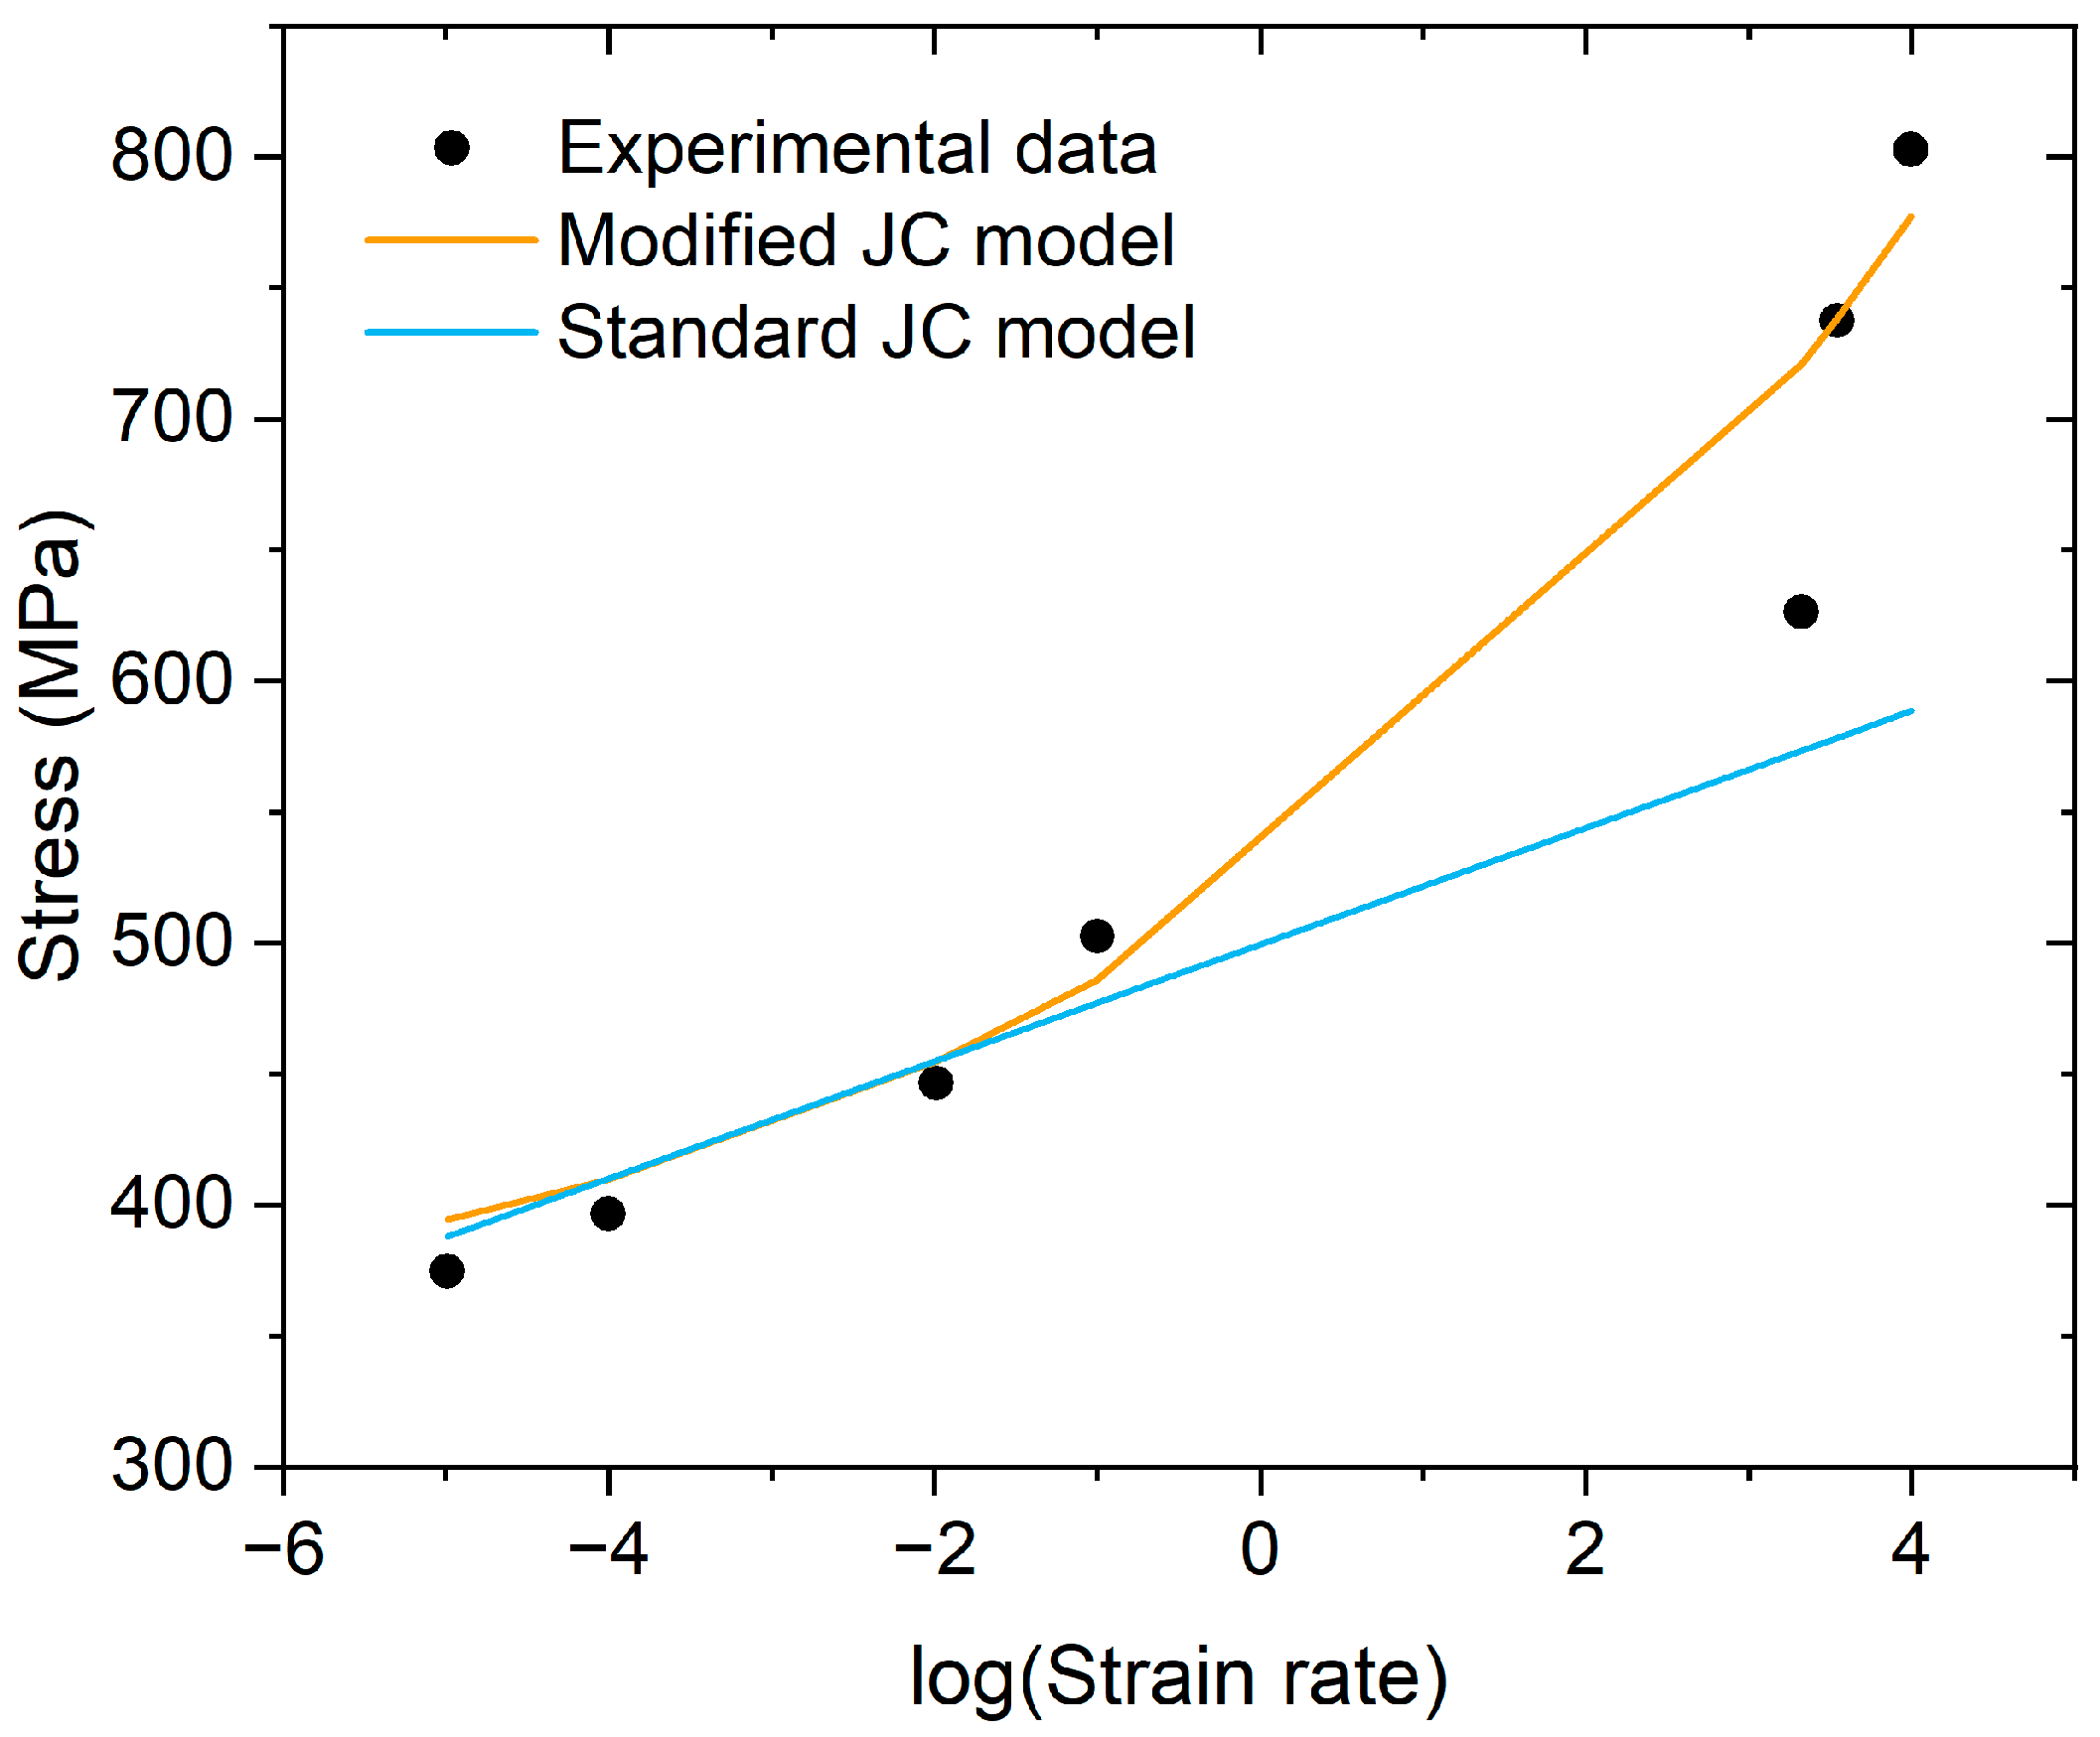
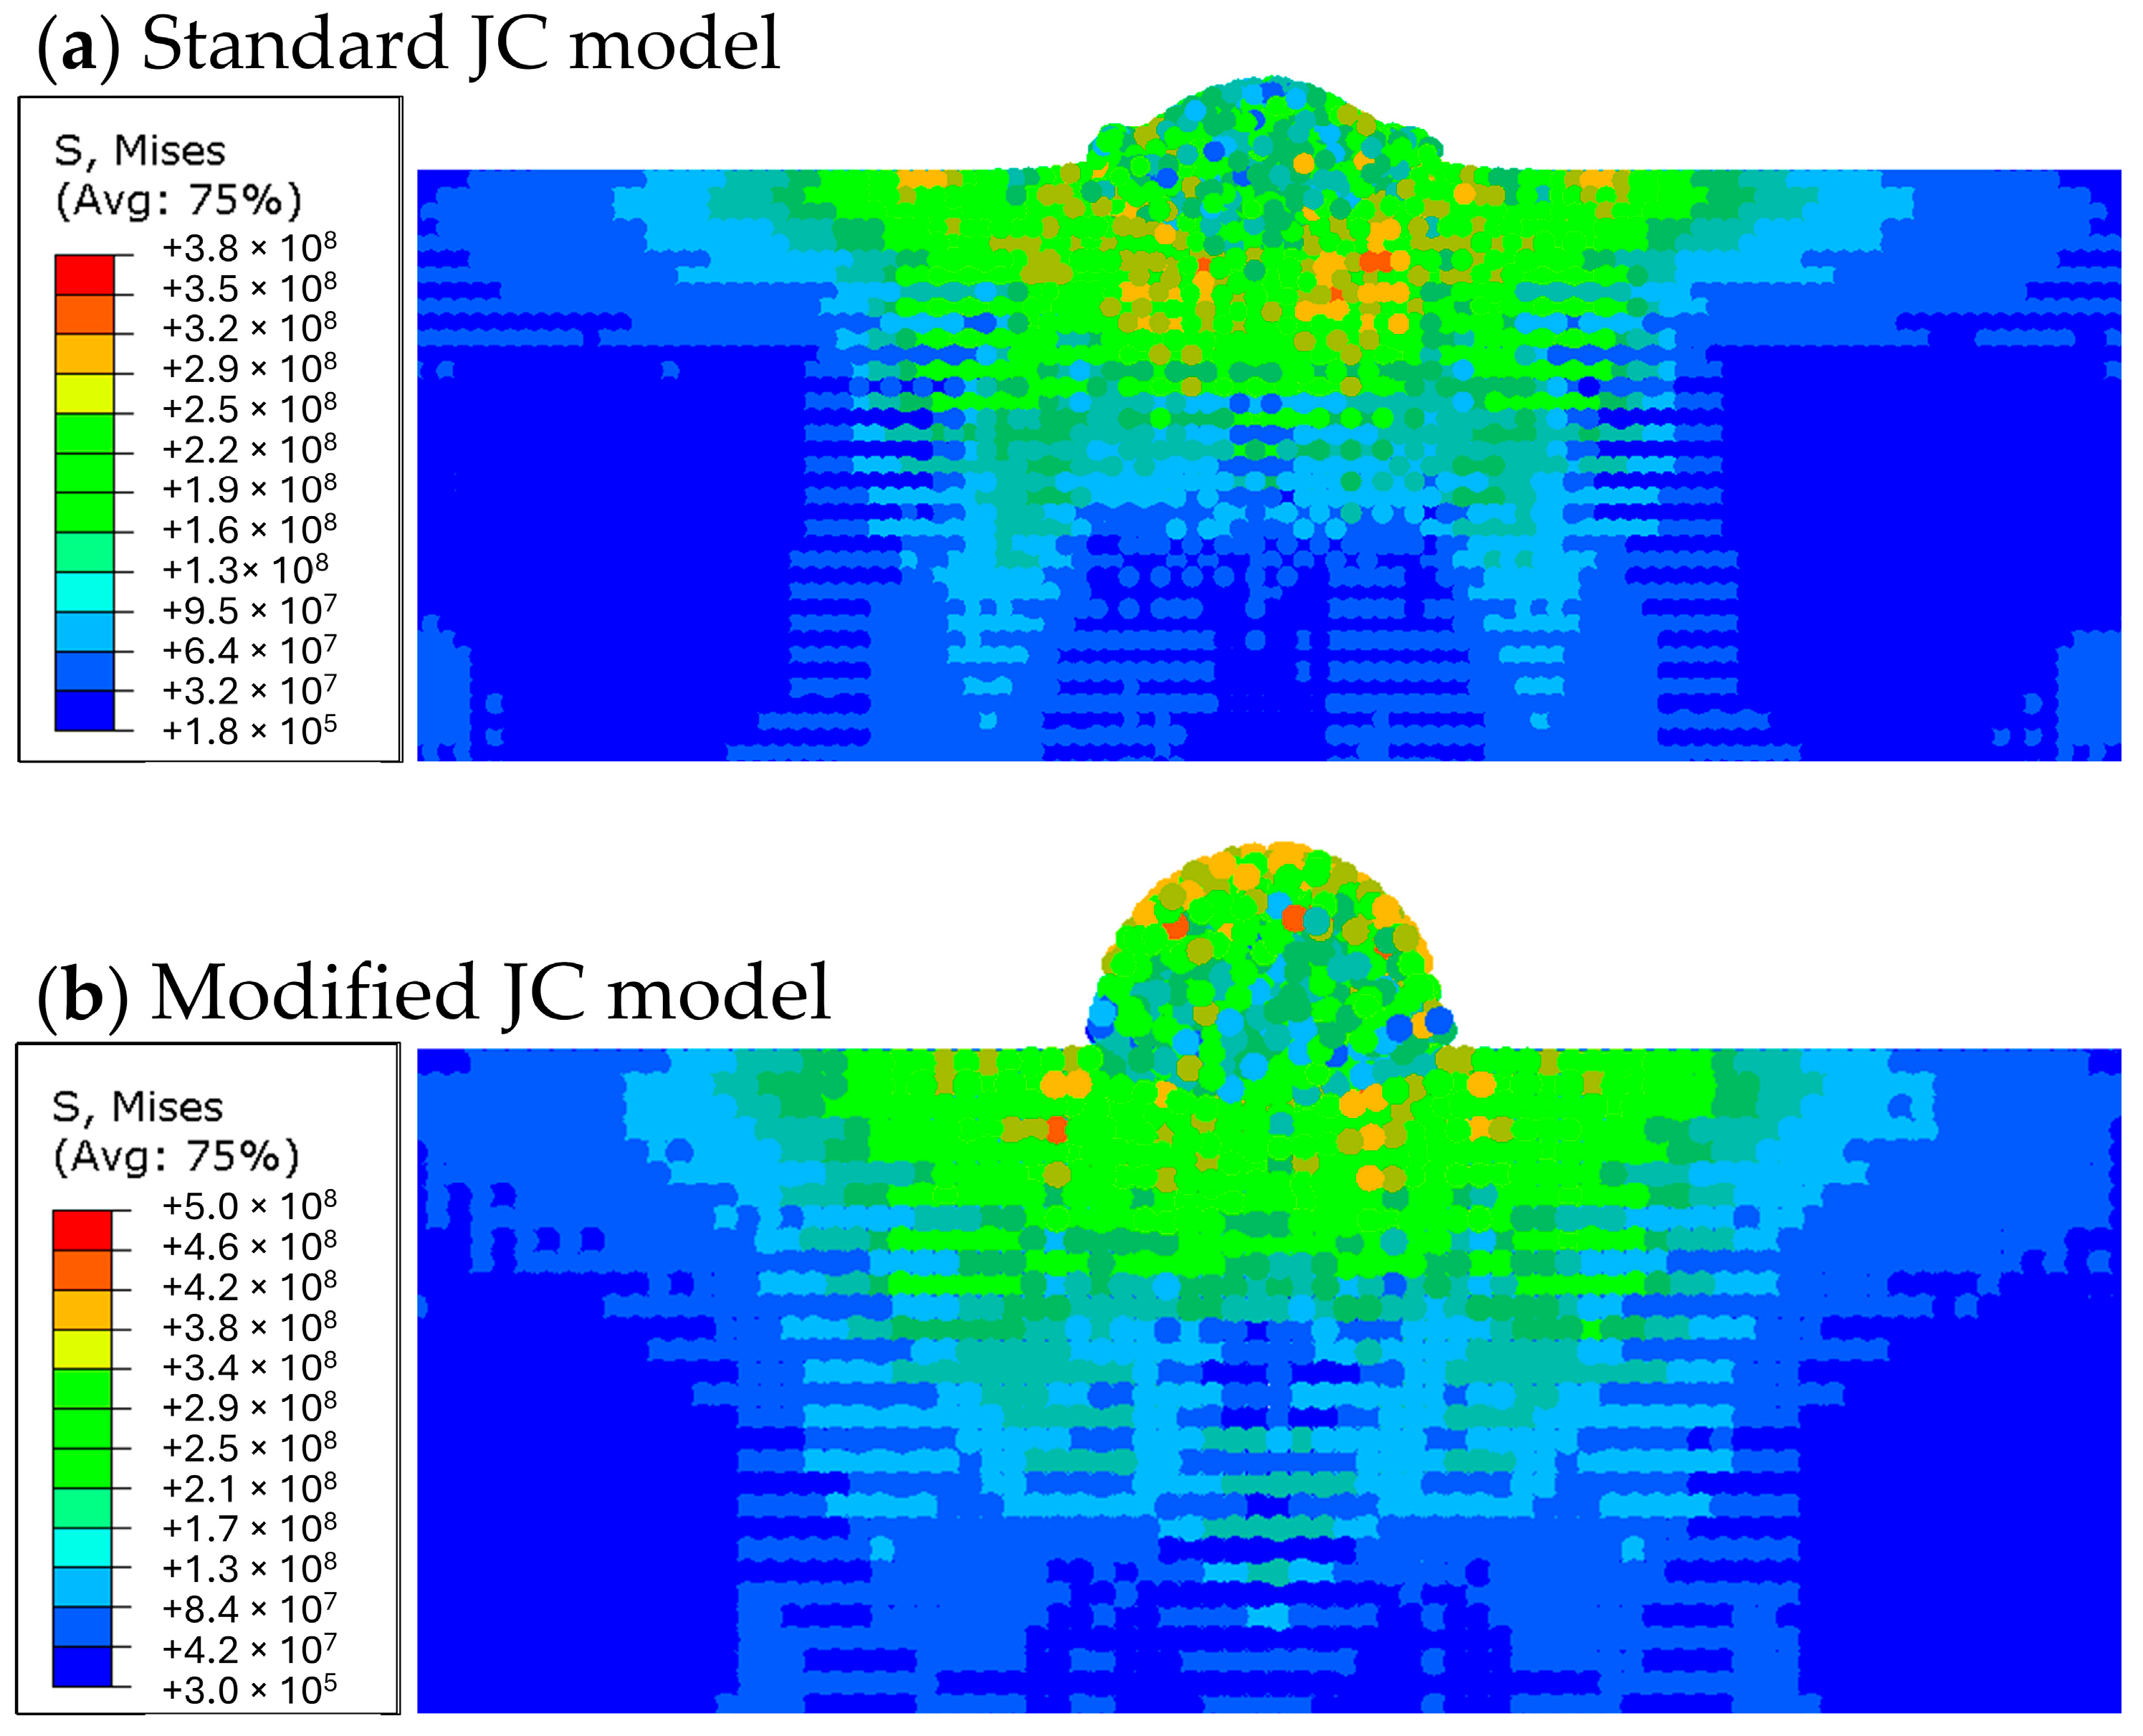
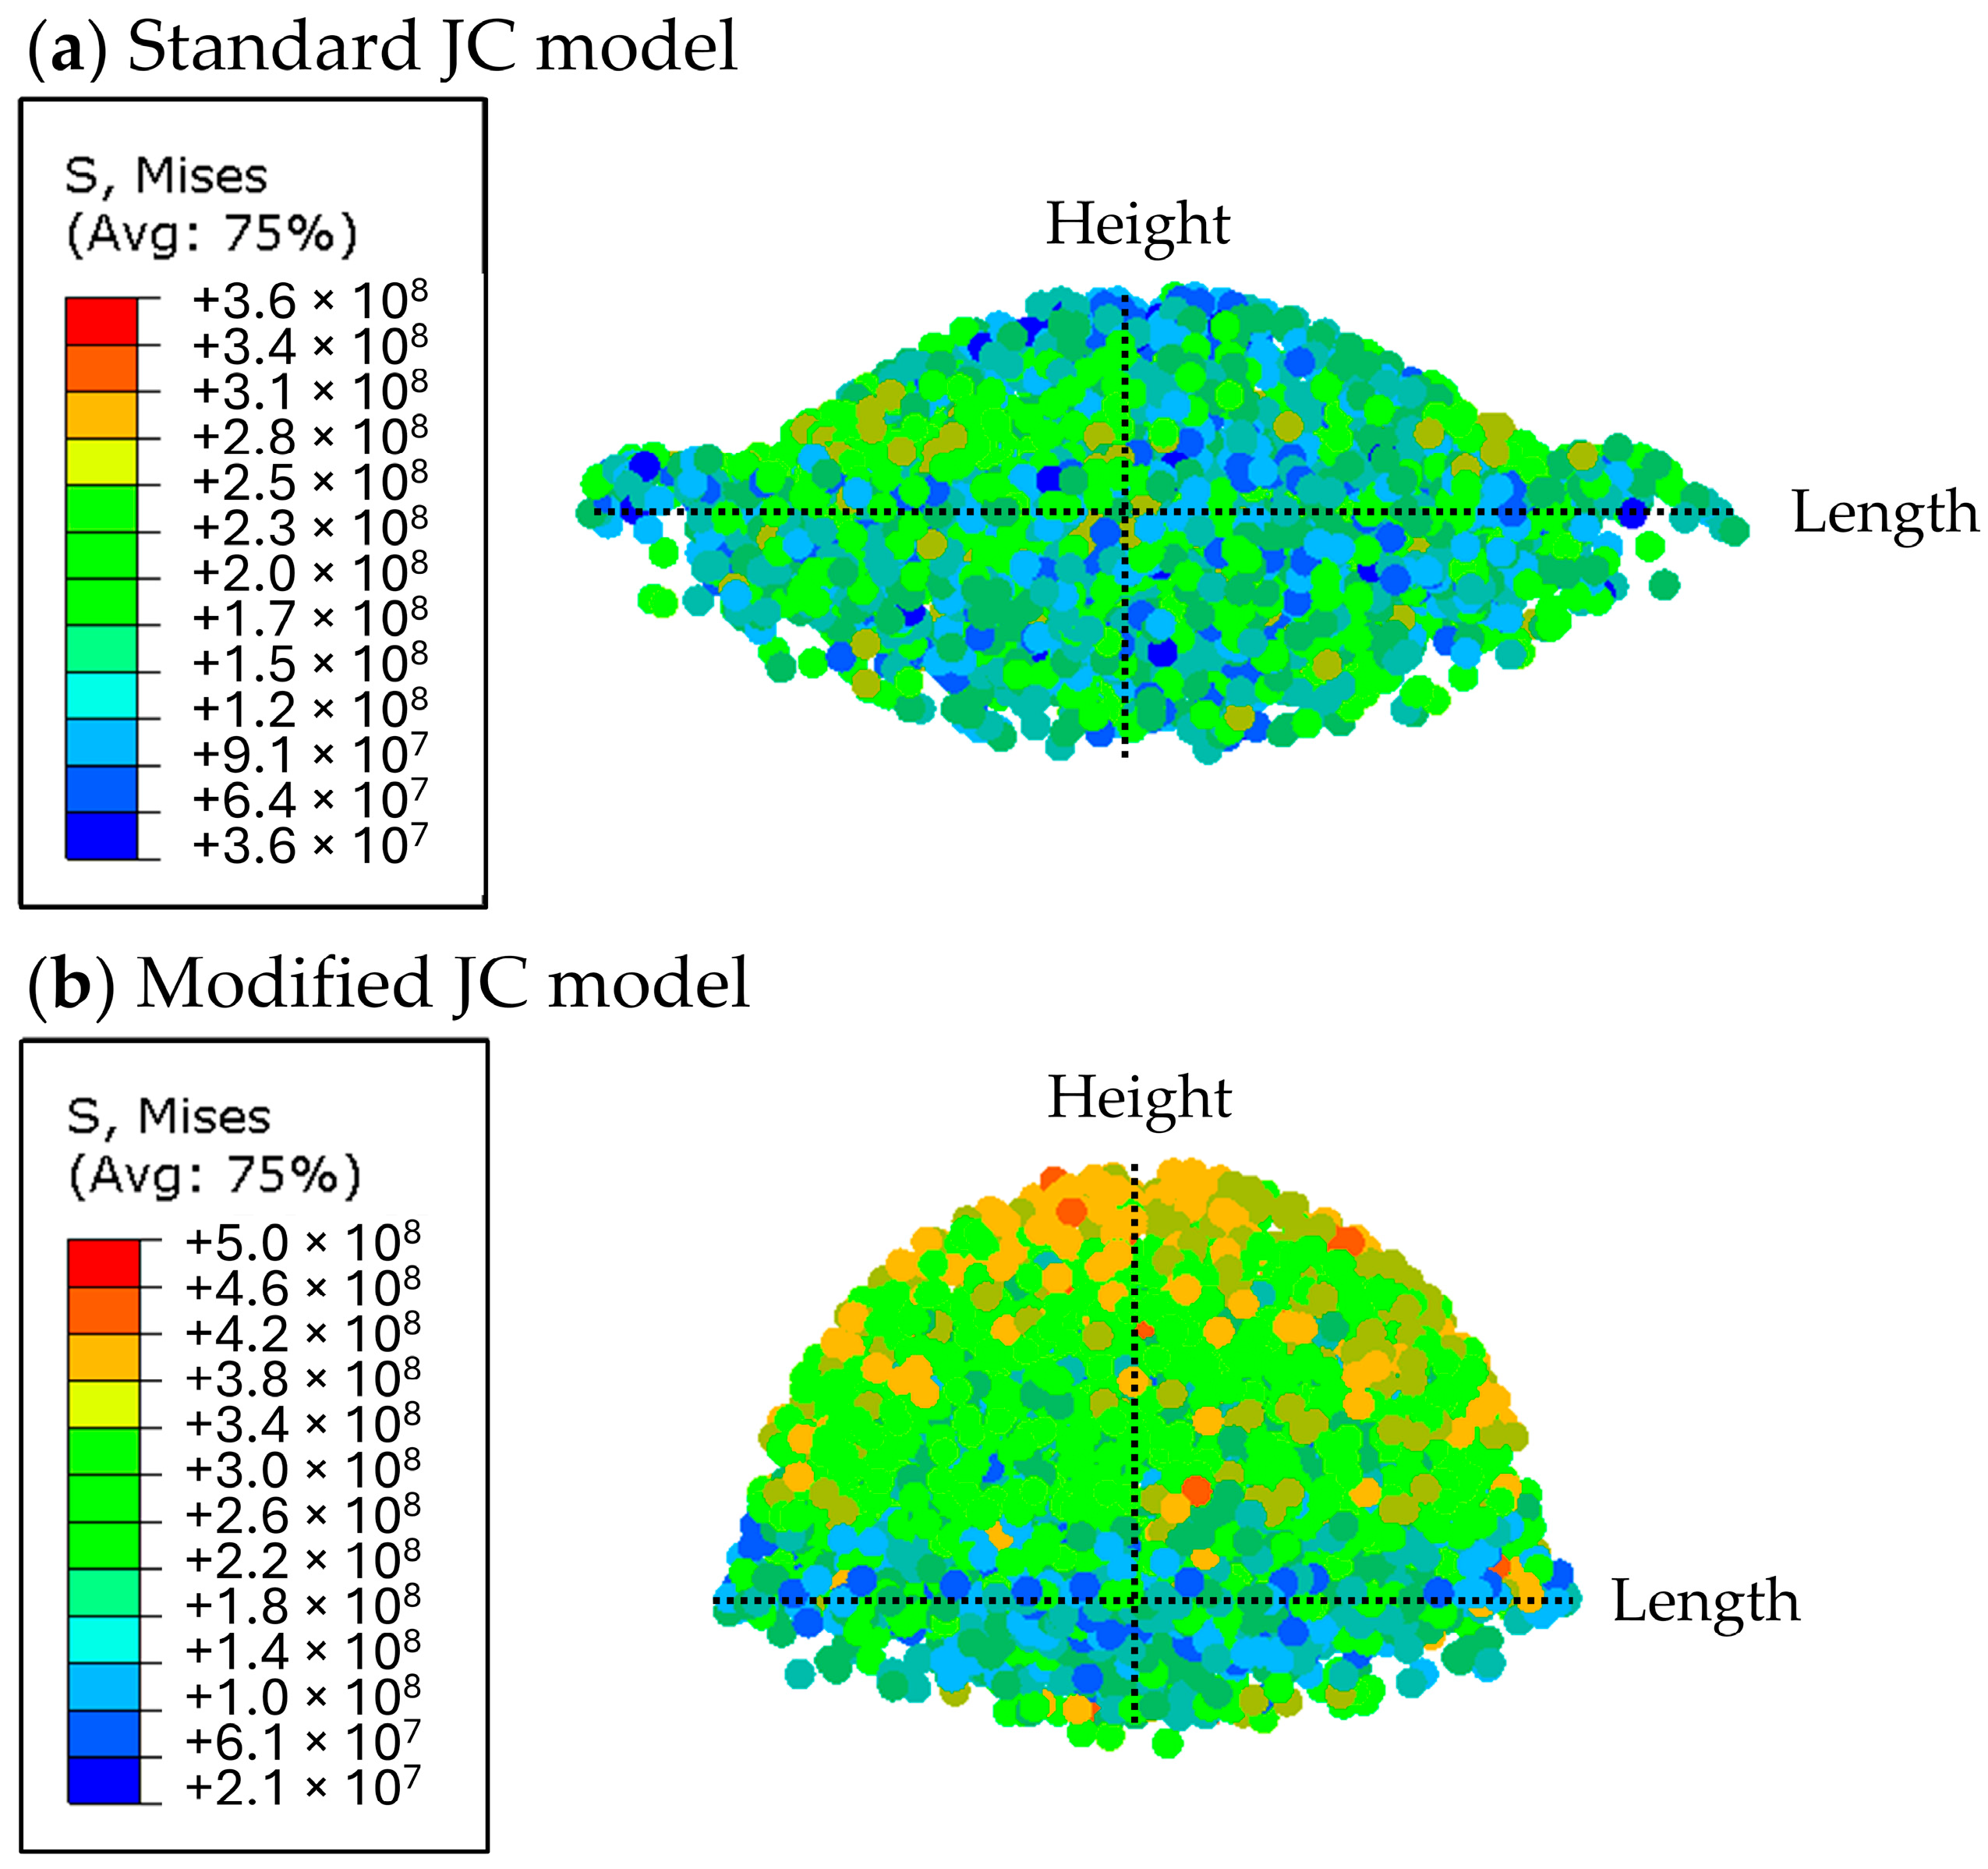
3.3. Comparison of Standard and Modified JC Models

The maximum temperature of all simulation cases remained below the melting temperature for CP-Ti, of 1650 °C [17] (see Figure S10 of the Supplementary Materials). As was seen in the Al6061-T6 simulations in the current as well as previous studies [5], the maximum temperature simulated under the modified JC model was significantly closer to the melting temperature than as predicted using the standard JC model.
The maximum von Mises stresses experienced by the overall feedstock–substrate system after impact were 960 MPa and 1147 MPa for the spherical CP-Ti feedstock under standard and modified JC models, respectively. In the case of using elongated feedstock, these were 977 MPa and 1206 MPa, while in the case of irregular CP-Ti feedstock, they were 930 MPa and 1140 MPa.
Comparing the Al6061-T6 feedstock to the Al6061-T6 substrate simulations, the von Mises stress experienced by the CP-Ti feedstock particle during deposition was also observed to be greater under the standard JC model than the modified JC model. The greater stress observed in the standard JC model translates to the simulated particle undergoing a greater plastic deformation than in the modified JC model. This was seen in all three particle morphologies. Figure 8 shows the von Mises stress profiles of the fully impacted system for all three morphologies considered, under the standard and modified JC models. It is important to note that the figures depicted here have been cropped to focus on the impact interface zone.
Figure 9a shows the cross-section of the spherical CP-Ti single splat, which showed that less significant jetting was observed in comparison to what was predicted by simulation under the standard JC model. Figure 9b,c show the comparison of experimental and simulated CP-Ti single splat cross-sections under both (b) standard and (c) modified JC models. While the modified JC model slightly underestimated the jetting region at 5% error, the standard JC model overestimated the deformation by 32%.

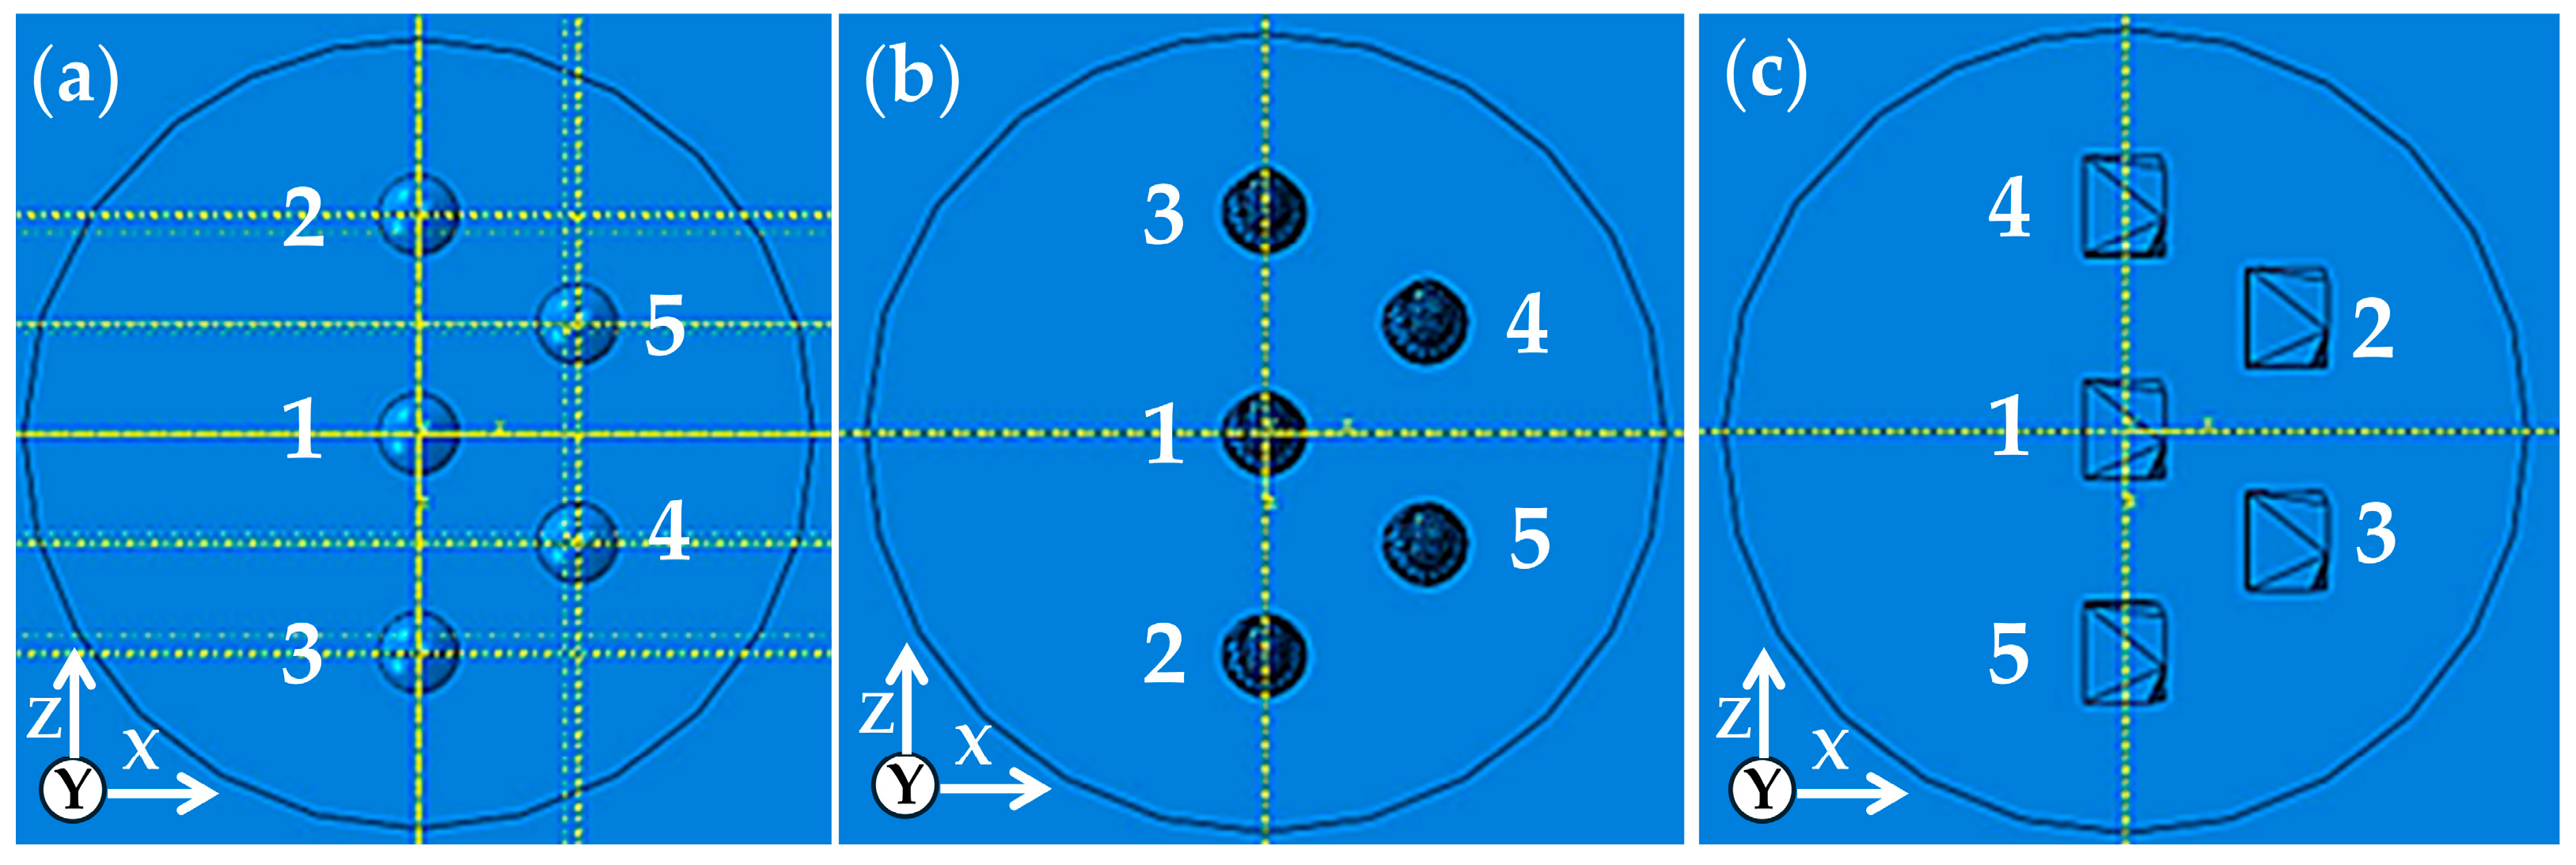
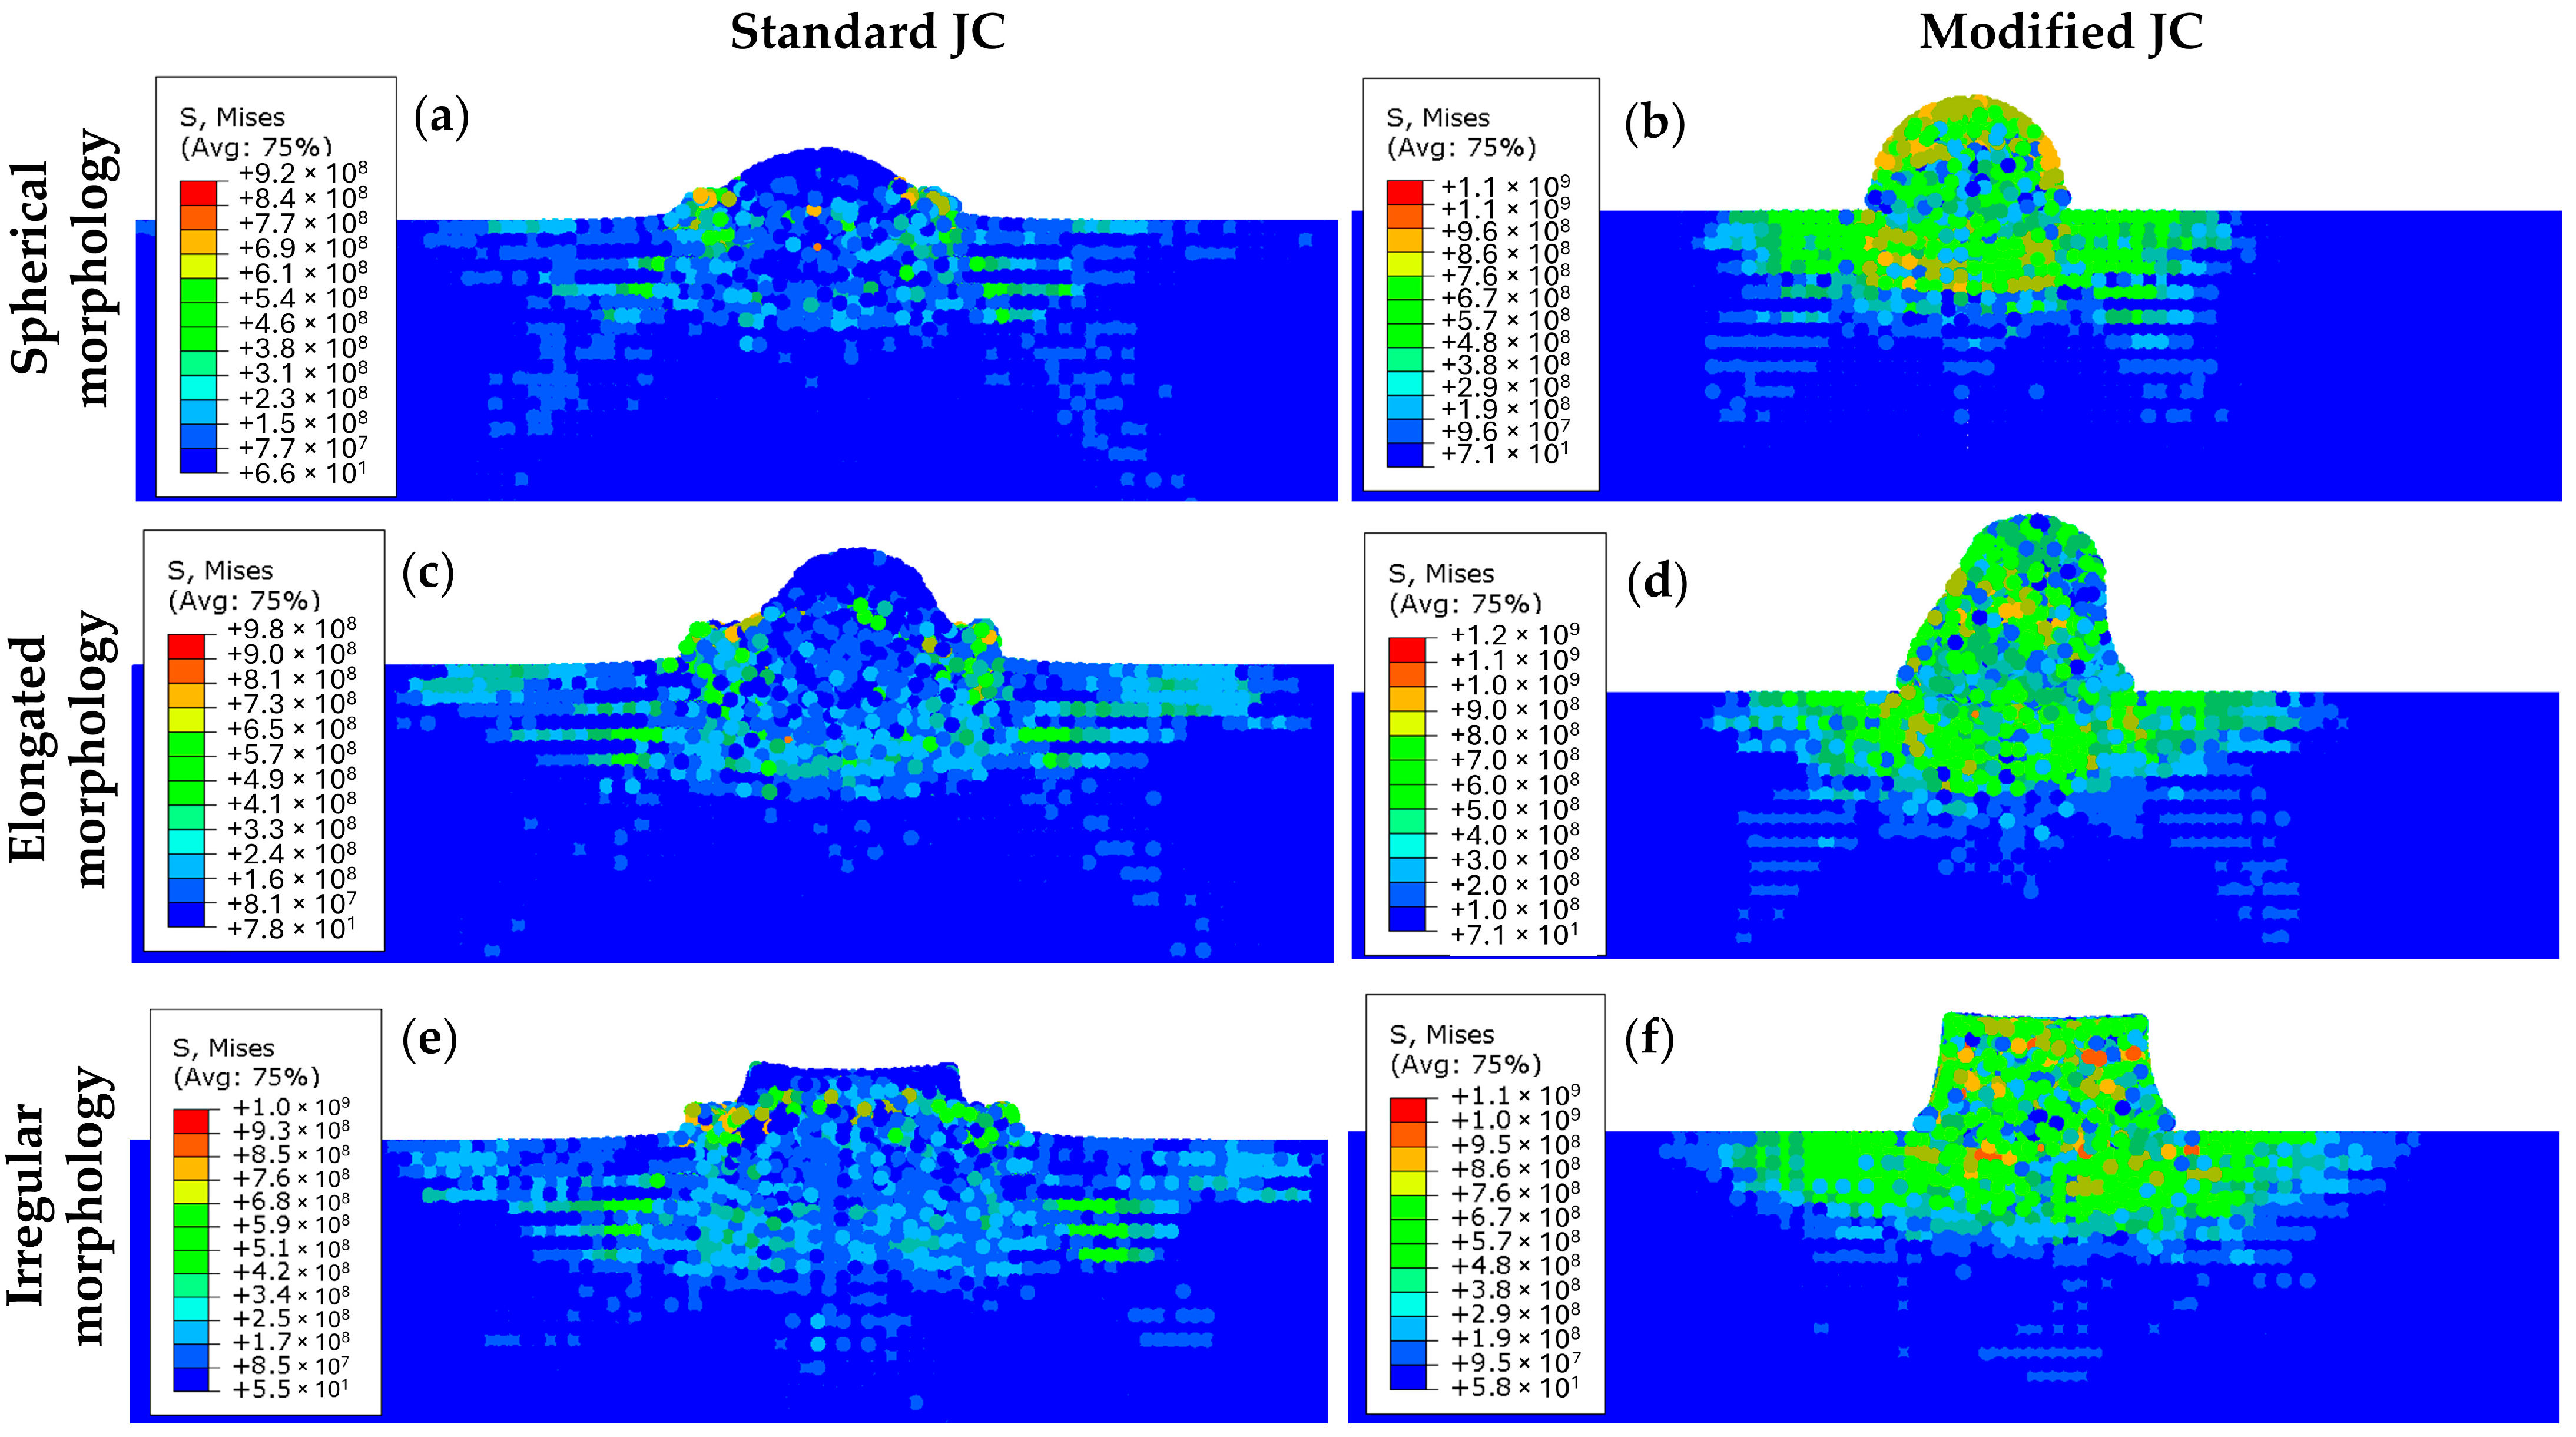
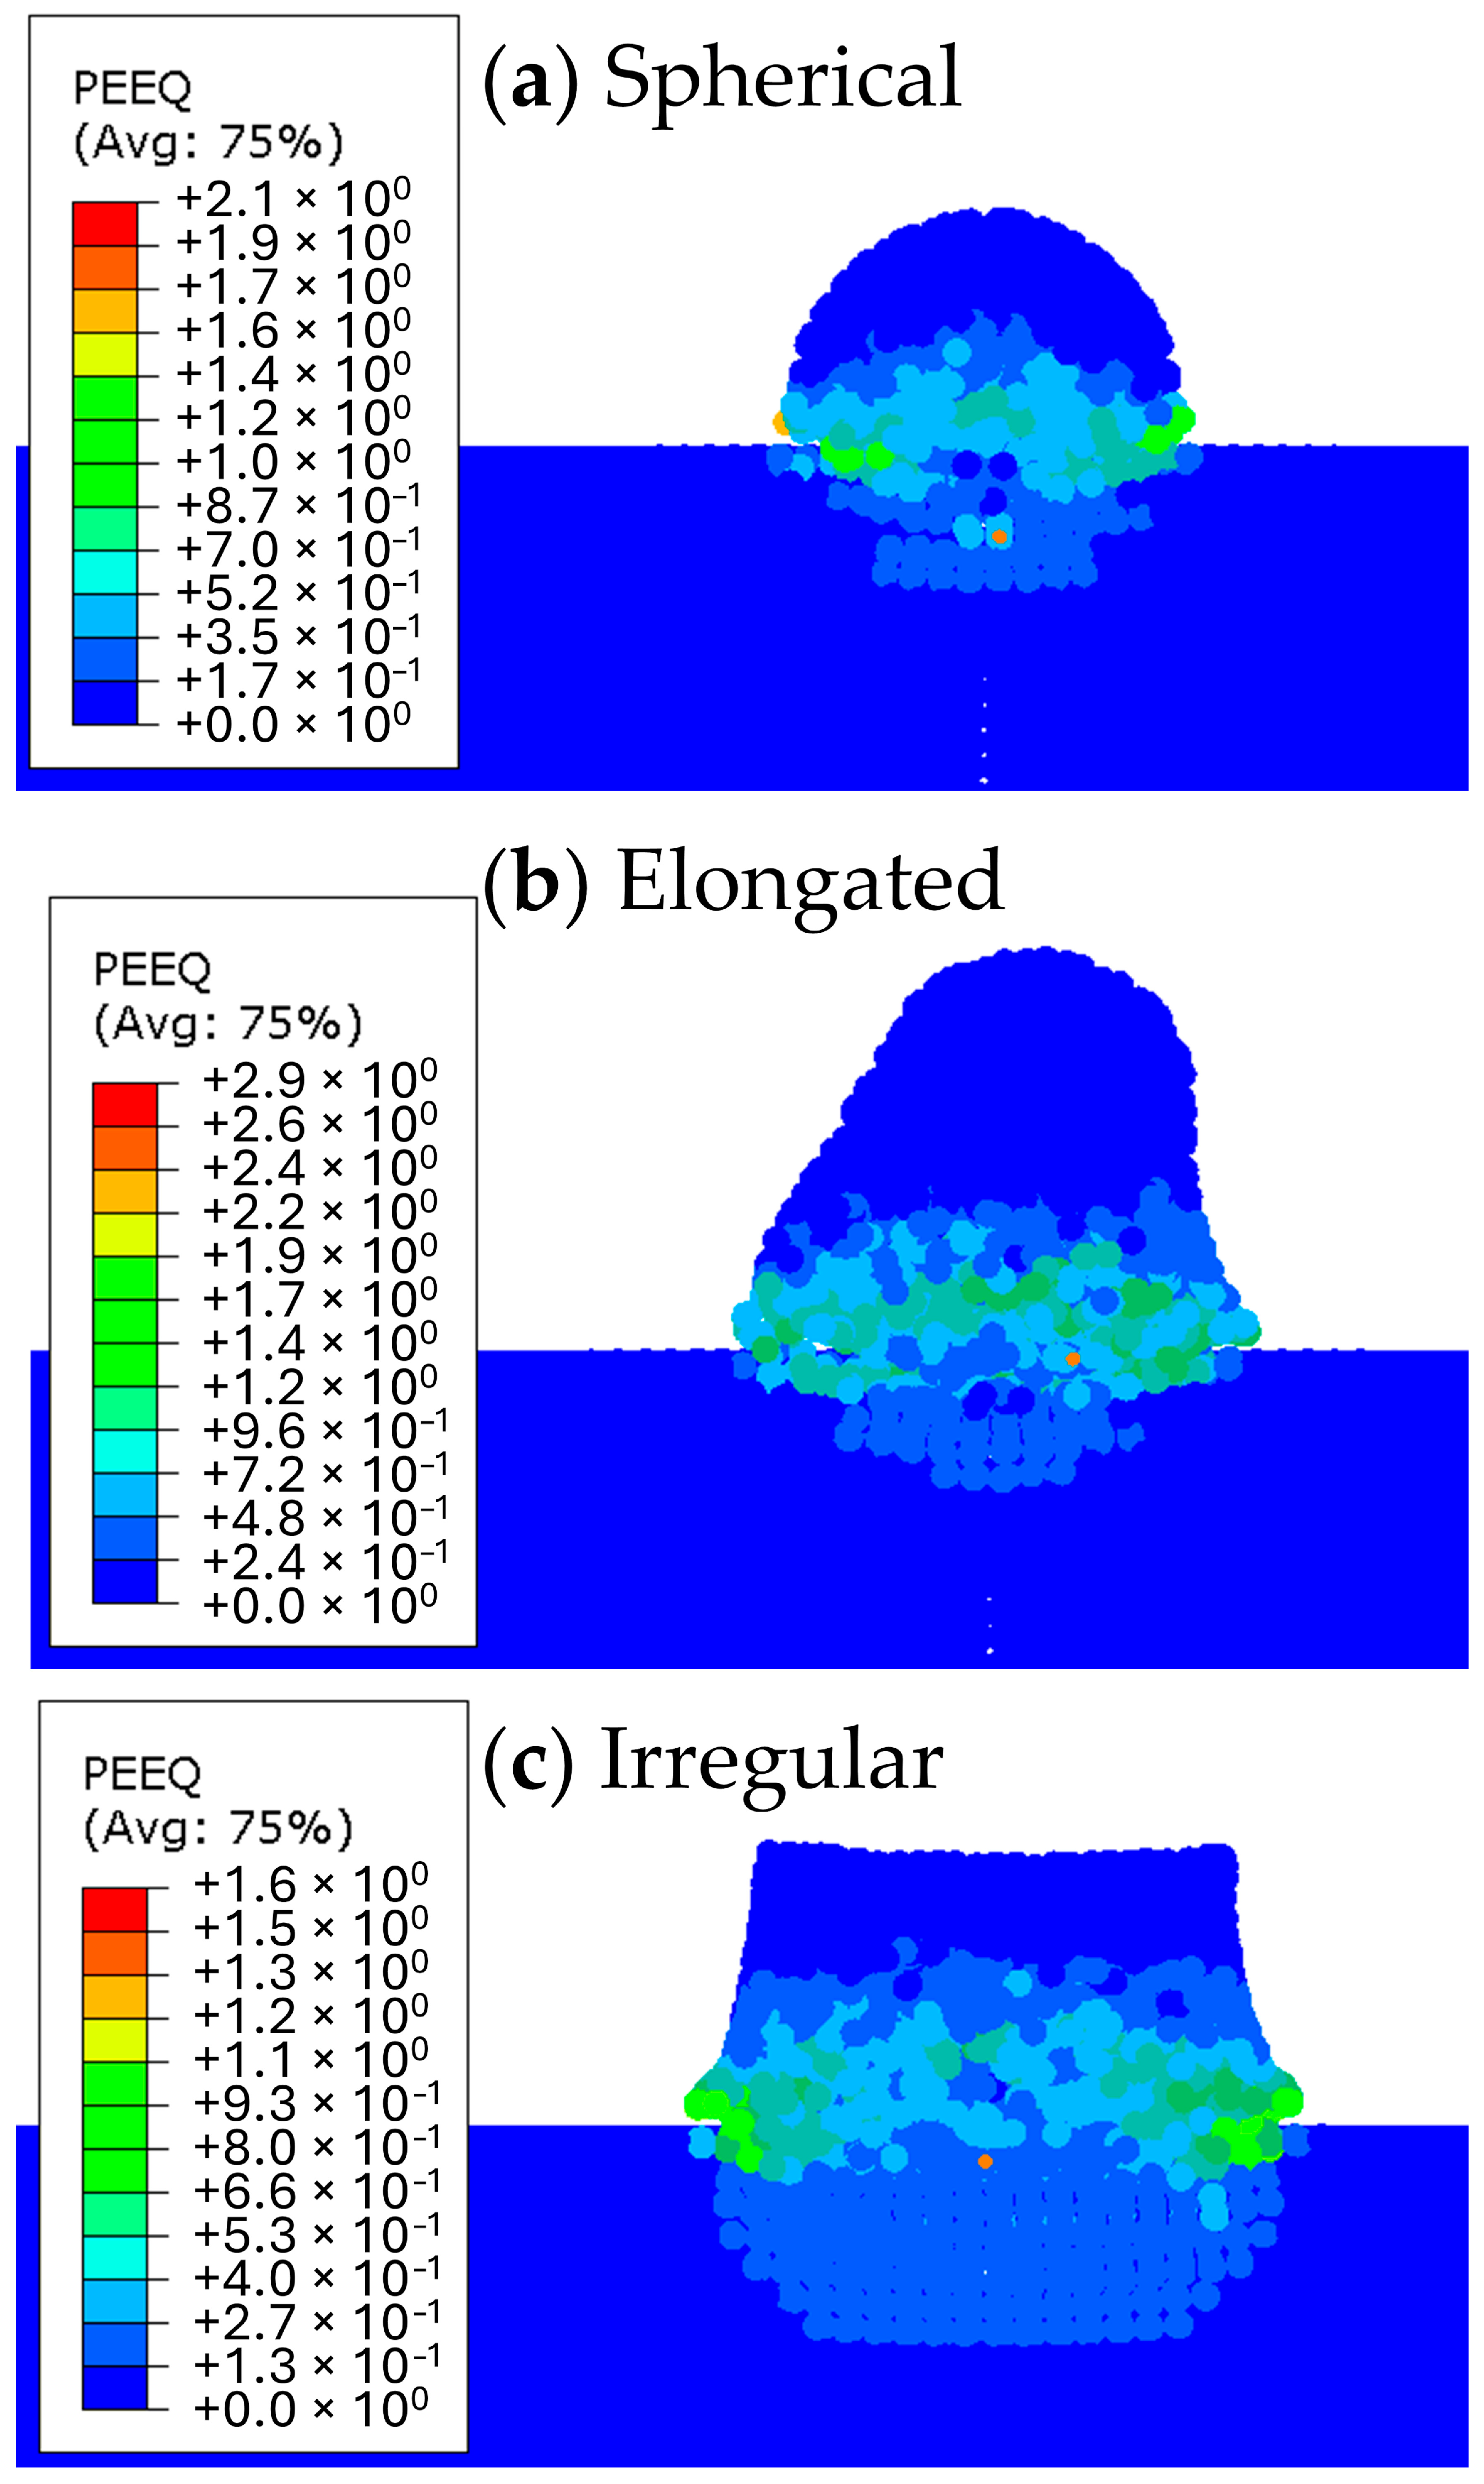
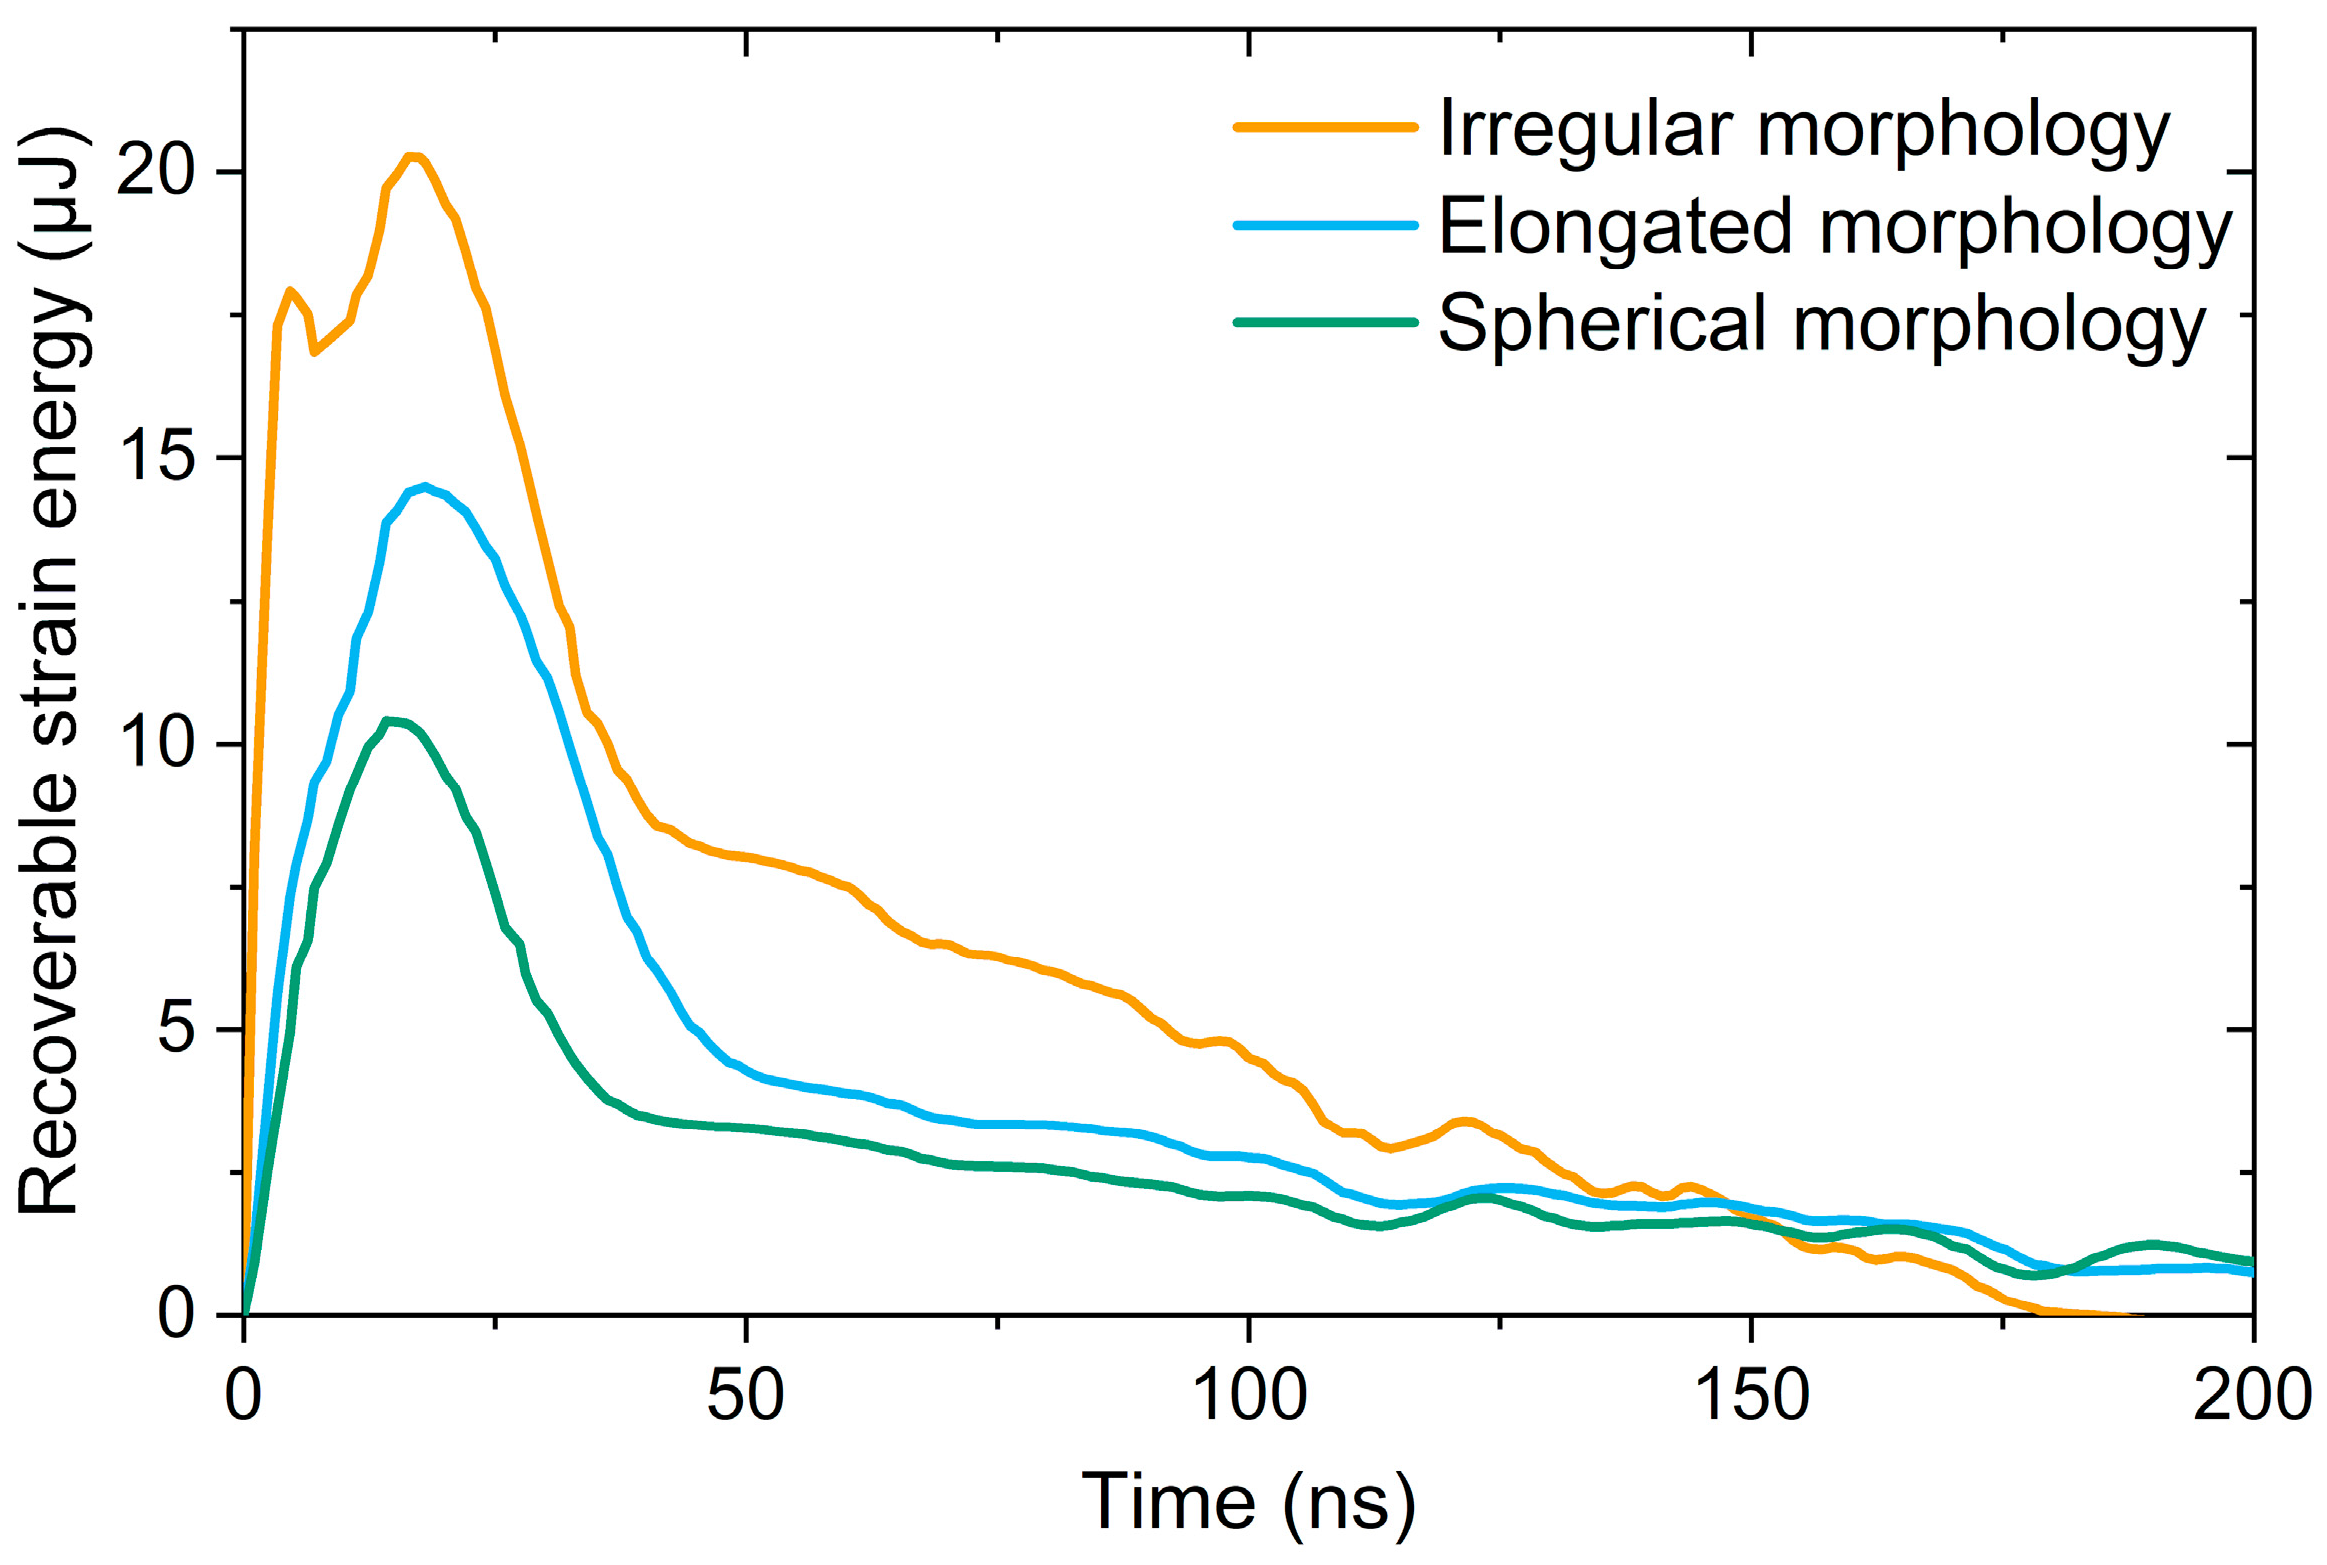
3.4. Spherical, Elongated, and Irregular Particle Morphologies

The displacements along the impact direction of the CP-Ti particles for the spherical, elongated, and irregular morphologies are shown in Figure 10. The simulation results suggested successful deposition for all morphologies considered. The elongated particle penetrated the substrate up to 8 µm deep, whereas the spherical and irregular CP-Ti particles only achieved a depth of 7 µm.
The impact of a feedstock particle creates ‘craters’ or depressions, which were scanned by an optical profilometer. From the 2D cross-sectional profiles (Figure S11 in the Supplementary Materials), the penetration depth was around 8 µm for a spherical CP-Ti particle and around 6 µm for an irregular CP-Ti particle. These experimental results were found in agreement with the simulated results in Figure 11. This result is also supported by the temperature evolution curve simulated by the modified JC model, in which the irregular morphology exhibited the lowest temperature at the end of the deposition process (see dashed lines in Figure S10 of the Supplementary Materials for details).
Figure 11 shows the equivalent plastic strain (corresponding to output variable PEEQ in ABAQUS) profiles of the impacted feedstock particles of all three morphologies. The maximum PEEQ values were found to be 2.09 for spherical particles, 2.88 for elongated particles, and 1.60 for irregular particles. Therefore, the elongated particles are expected to experience the most inelastic strain, followed by spherical particles and the least by irregular particles.
In the simulations, the only input energy was the kinetic energy of the feedstock particle. The remaining energy difference before and after particle impact can be attributed to a combination of work of adhesion, elastic strain energy, and plastic dissipation energy [32]. From the work of Bae et al. [33], the recoverable strain energy signified the remaining energy in the system after the impact of feedstock particles, which in turn represented the relative tendency of feedstock particle bouncing back from the substrate after impact. Therefore, the recoverable strain energy was used as a metric to compare the relative bond strength among all three morphologies.
In general, to categorise the success of bonding, the key metric is the kinetic energy of the feedstock particle. However, as the volumes of all three morphologies in this study were comparable and the impact velocities were identical, the recoverable strain energies could be compared at an appropriate level to deduce the relative bond characteristics of the three morphologies.
Figure 12 shows the evolution of the various CP-Ti feedstocks’ recoverable strain energies throughout the deposition process. From the results, it was observed that although the CP-Ti particle of irregular morphology achieved the highest level of strain energy during impact, it was eventually reduced to zero before 200 ns. In contrast, the CP-Ti particles with elongated and spherical morphologies achieved lower maximum strain energies throughout the deposition process but maintained a small amount of recoverable strain energy after 200 ns. The higher maximum strain energy of irregular particles suggest that they have a greater tendency to bounce back upon impact. Nonetheless, if deposited successfully, the irregular particles should be bonded to the substrate with a greater flattening ratio than the elongated and spherical particles.
To ascertain their flattening ratios, cross-sectional profiles of CP-Ti single splats of both morphologies were investigated under the profilometer. Since the CP-Ti particle deformation profiles could be affected by their initial orientation prior to impacting the substrate and the size distributions of the feedstock [34], the number of single splats under consideration in this study was correlated to the coefficient of variance of the computed flattening ratios. For the spherical feedstock, 20 single-splat profiles were obtained, and the average flattening ratio was 6.05, with a coefficient of variance of 0.15, whereas for the irregular morphology, it was 25 splats and the average flattening ratio was 5.31, with a coefficient of variance of 0.15. Table 4 summarises the computed flattening ratios of the CP-Ti single splats of both spherical and irregular morphologies, gathered from experiments and simulations.
Using the modified JC model in the simulation predicted the flattening ratios of the spherical and irregular CP-Ti feedstock with an error of 23.1% and 13.7%, respectively. Whereas the prediction error with the standard JC model was 53.3% and 32.7%, respectively. Figure 13 shows the overlay of experimentally determined 2D splat profiles onto the cross-section of the simulated splats. This demonstrated that the splat profiles predicted using modified JC model resembled the experimental data more closely than the standard JC model. Care has been taken to select a 2D splat profile representative of the multiple 3D profiles scanned. Future research could include the sectioning of more cross-sections for more confidence in reproducibility.

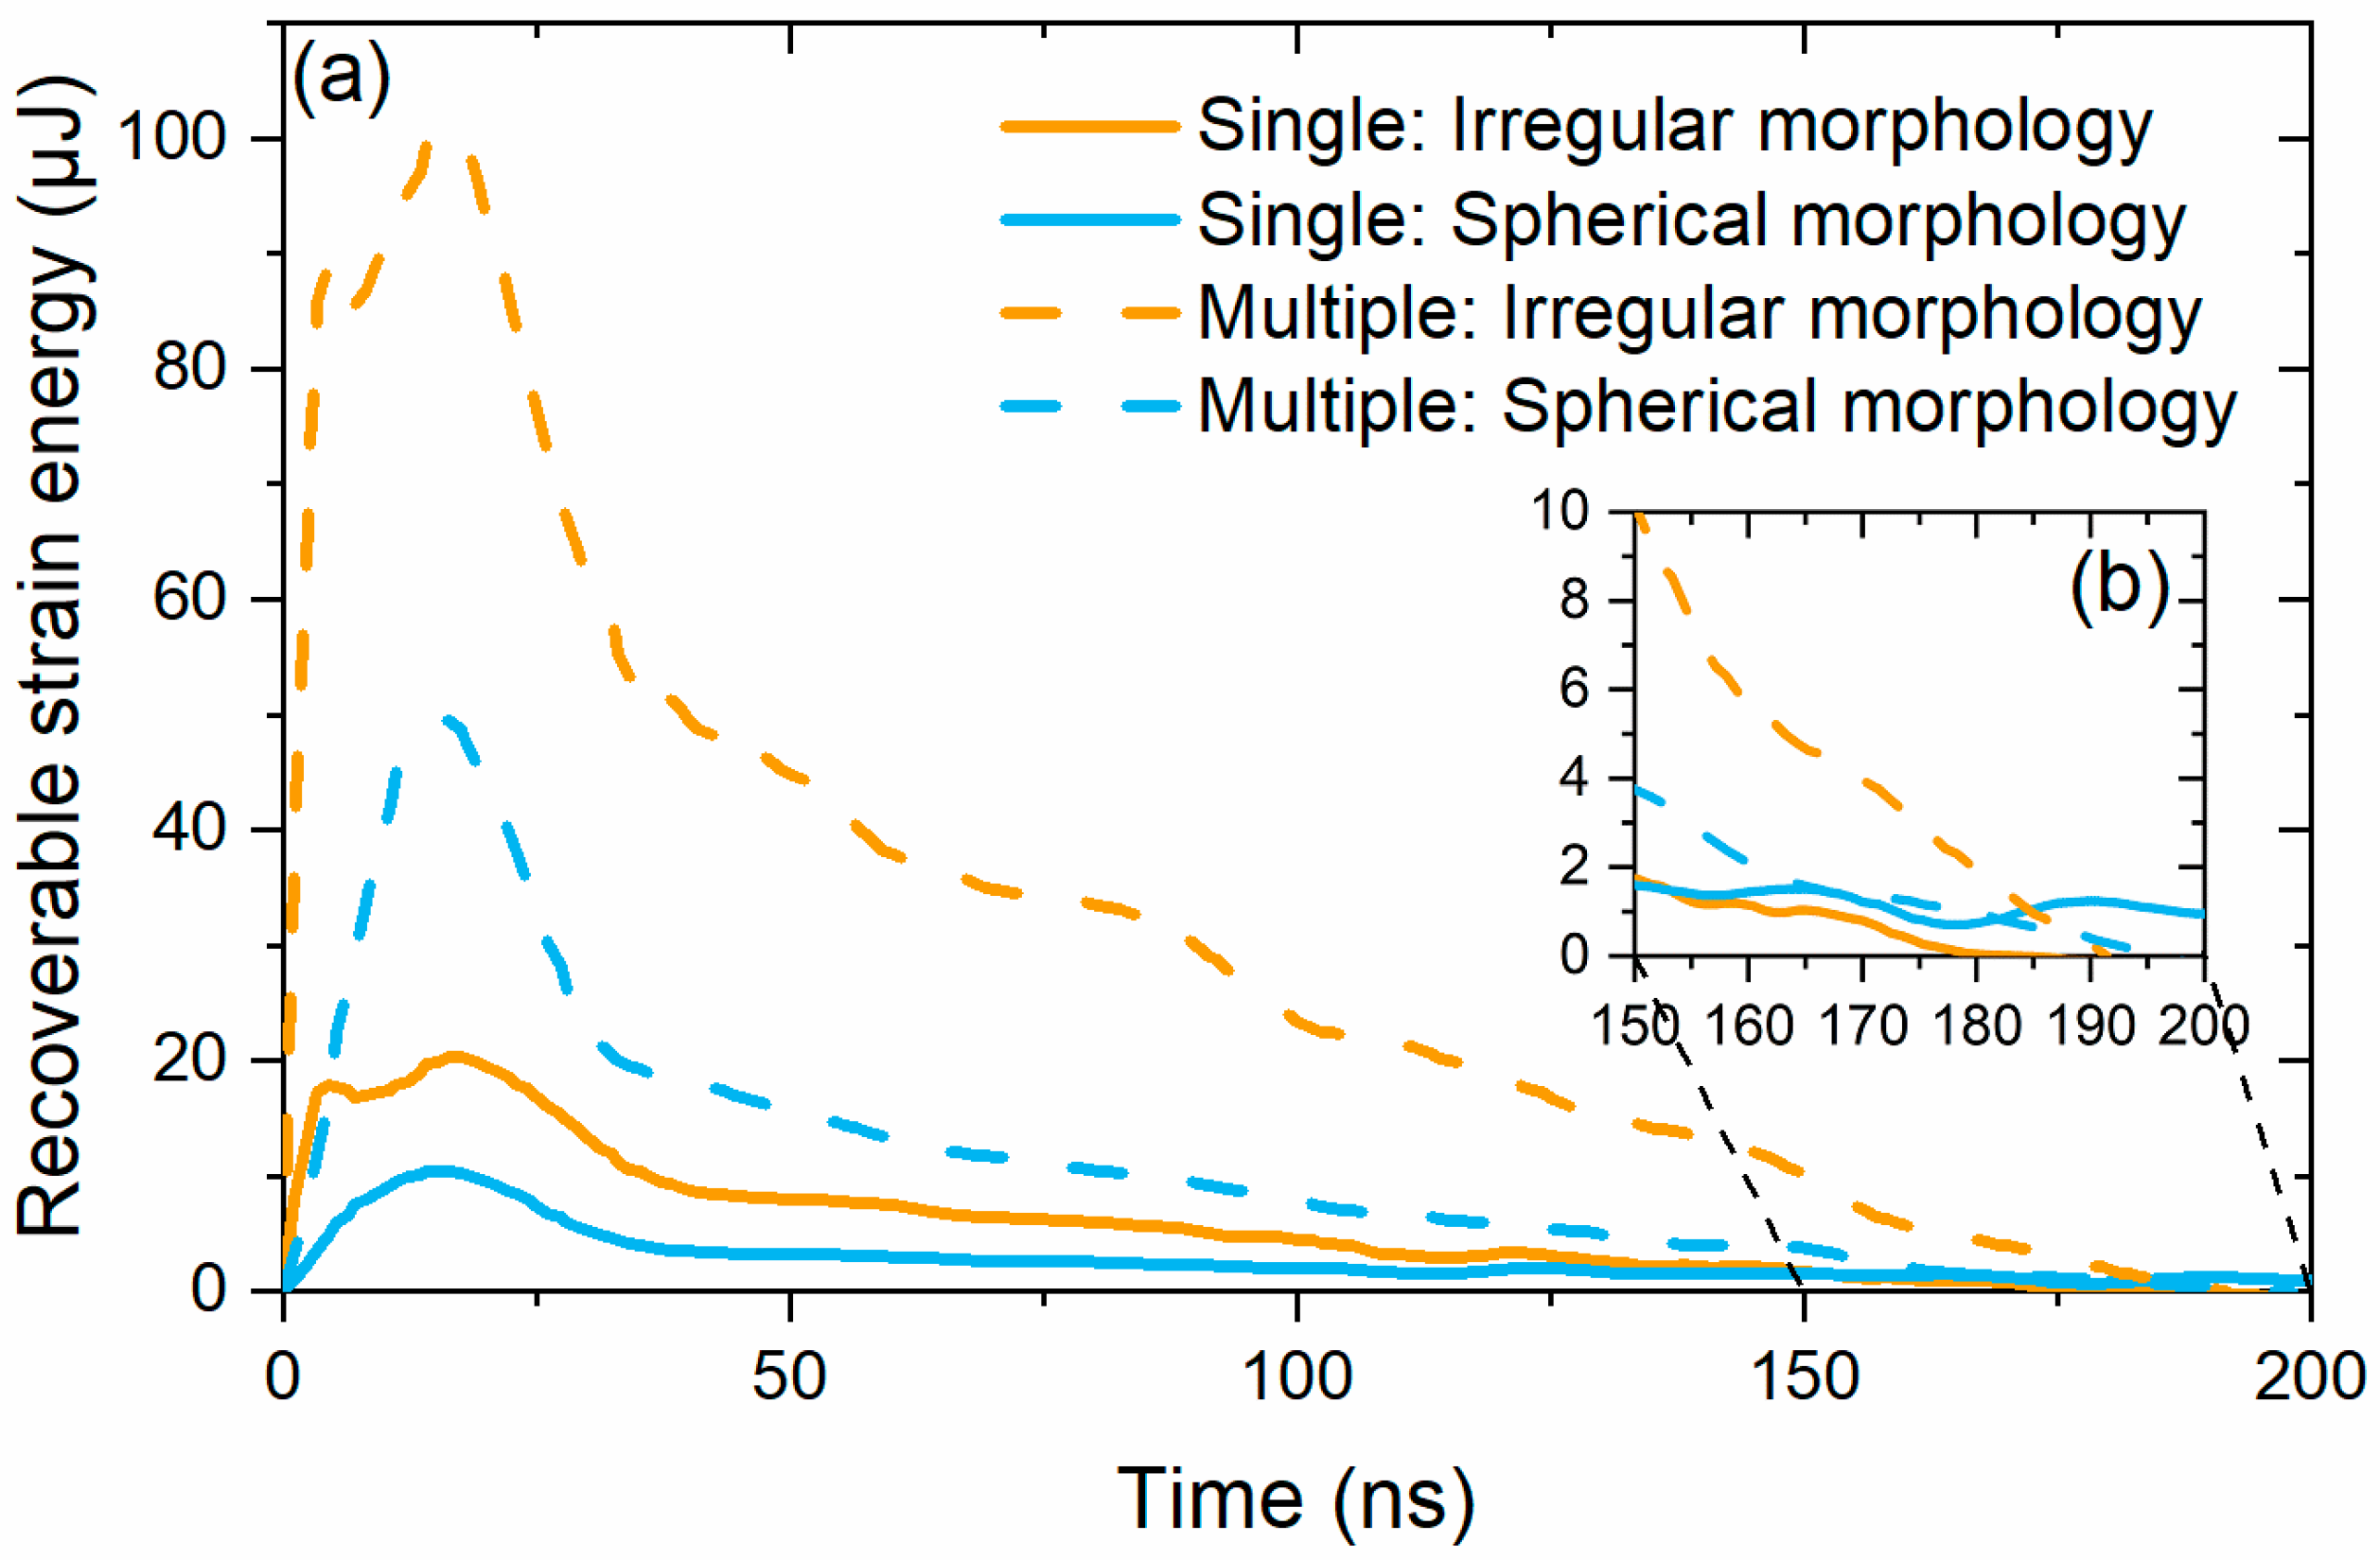
3.5. Comparison Between Single and Multiple Particle Simulations

Multiple simultaneous particle simulations were also performed using five particles of CP-Ti feedstock for comparison with the results from single particle simulations. Since the cold spray simulation validation experiments conducted only utilised spherical and irregular particles, these two validated morphologies are discussed below.
Figure 14a shows the evolution of recoverable strain energies of both single and multiple feedstock particle systems, using spherical and irregular feedstock particles. The recoverable strain energies of multiple particle simulation appear to be much higher than for single particle simulations, but the extent of increase varies depending on the morphology type. This result agrees with the outcome of previously reported simulations conducted for the deposition of Al6061-T6 feedstock particles onto Al6061-T6 substrate, which signified higher tendency for delamination to occur as coatings build. However, as shown in Figure 14b, the recoverable energies in the multiple particle systems of both morphologies tended towards zero at the end of 200 ns.
The evolution of recoverable strain energies implies that single spherical CP-Ti feedstocks have a lower tendency to detach from the substrate at the end of the deposition process. However, as more CP-Ti particles are deposited and overlapped with the initial splat, the recoverable strain energy of the overall system increases. The multiple spherical particle simulation demonstrates that it only required as few as five spherical CP-Ti particles impacted onto the substrate within a 150 µm radius to reduce the recoverable strain energy to zero at the end of the deposition process.
As presented earlier in Figure 10 and Figure S11, irregular particles did not penetrate the surface of the substrate as deeply as spherical particles. This could translate to a greater tendency to detach from the substrate upon impact. Thus, if the irregular CP-Ti particles were not fully deposited, i.e., the recoverable strain energy had not returned to zero, if a second particle were to impact the same area, the splat could detach from the substrate. If this phenomenon is repeated during deposition, as further layers are deposited, it could result in coating delamination. Figure 15 shows the cross-sections of cold-spray coated coupons using (a) spherical and (b) irregular CP-Ti particles. The delamination observed in Figure 15b between the coating made from irregular particles and its substrate supports the above-mentioned interpretation of the simulated results. See Figure S12 of the Supplementary Materials for the same cross-sections at a higher magnification.

4. Conclusions

To overcome the limitations of traditional meshed elements, the smoothed particle hydrodynamics (SPH) method was adopted in this study to model the large amount of powder particles undergoing extensive deformations simultaneously. In particular, the standard Johnson–Cook (JC) model and Chakrabarty and Song’s modified JC model were compared in their simulations of two material systems—Al6061-T6 particles on Al6061-T6 substrate and CP-Ti particles on CP-Ti substrate. Additionally, three particle morphologies—spherical, elongated, and irregular—were investigated. The findings are as follows:
1.
From the simulations using CP-Ti as the feedstock particles, it was shown that the maximum temperature of both feedstock and substrate remained below the melting temperature of the associated materials throughout the deposition process.
2.
During simulation of CP-Ti feedstock particle deposition, the observed von Mises stress was higher under the standard JC model than the modified JC model.
3.
The particles simulated under the modified JC model appeared to undergo less plastic deformation than those under the standard JC model.
4.
Experimental validation was undertaken for the verification of simulation results. The cross-section profiles of spherical single splats were obtained from experiments and were compared against the simulated profiles. This comparison showed that while the modified JC model typically underestimated the particle profile after impact by 5%, the standard JC model often significantly overestimated the entire deformed profile by 32%.
5.
The simulation results showed that the impact depth of particle splats accurately correlated with the experimental results, including the effect when varying feedstock morphology for both spherical and irregular particles deposited onto CP-Ti substrates.
6.
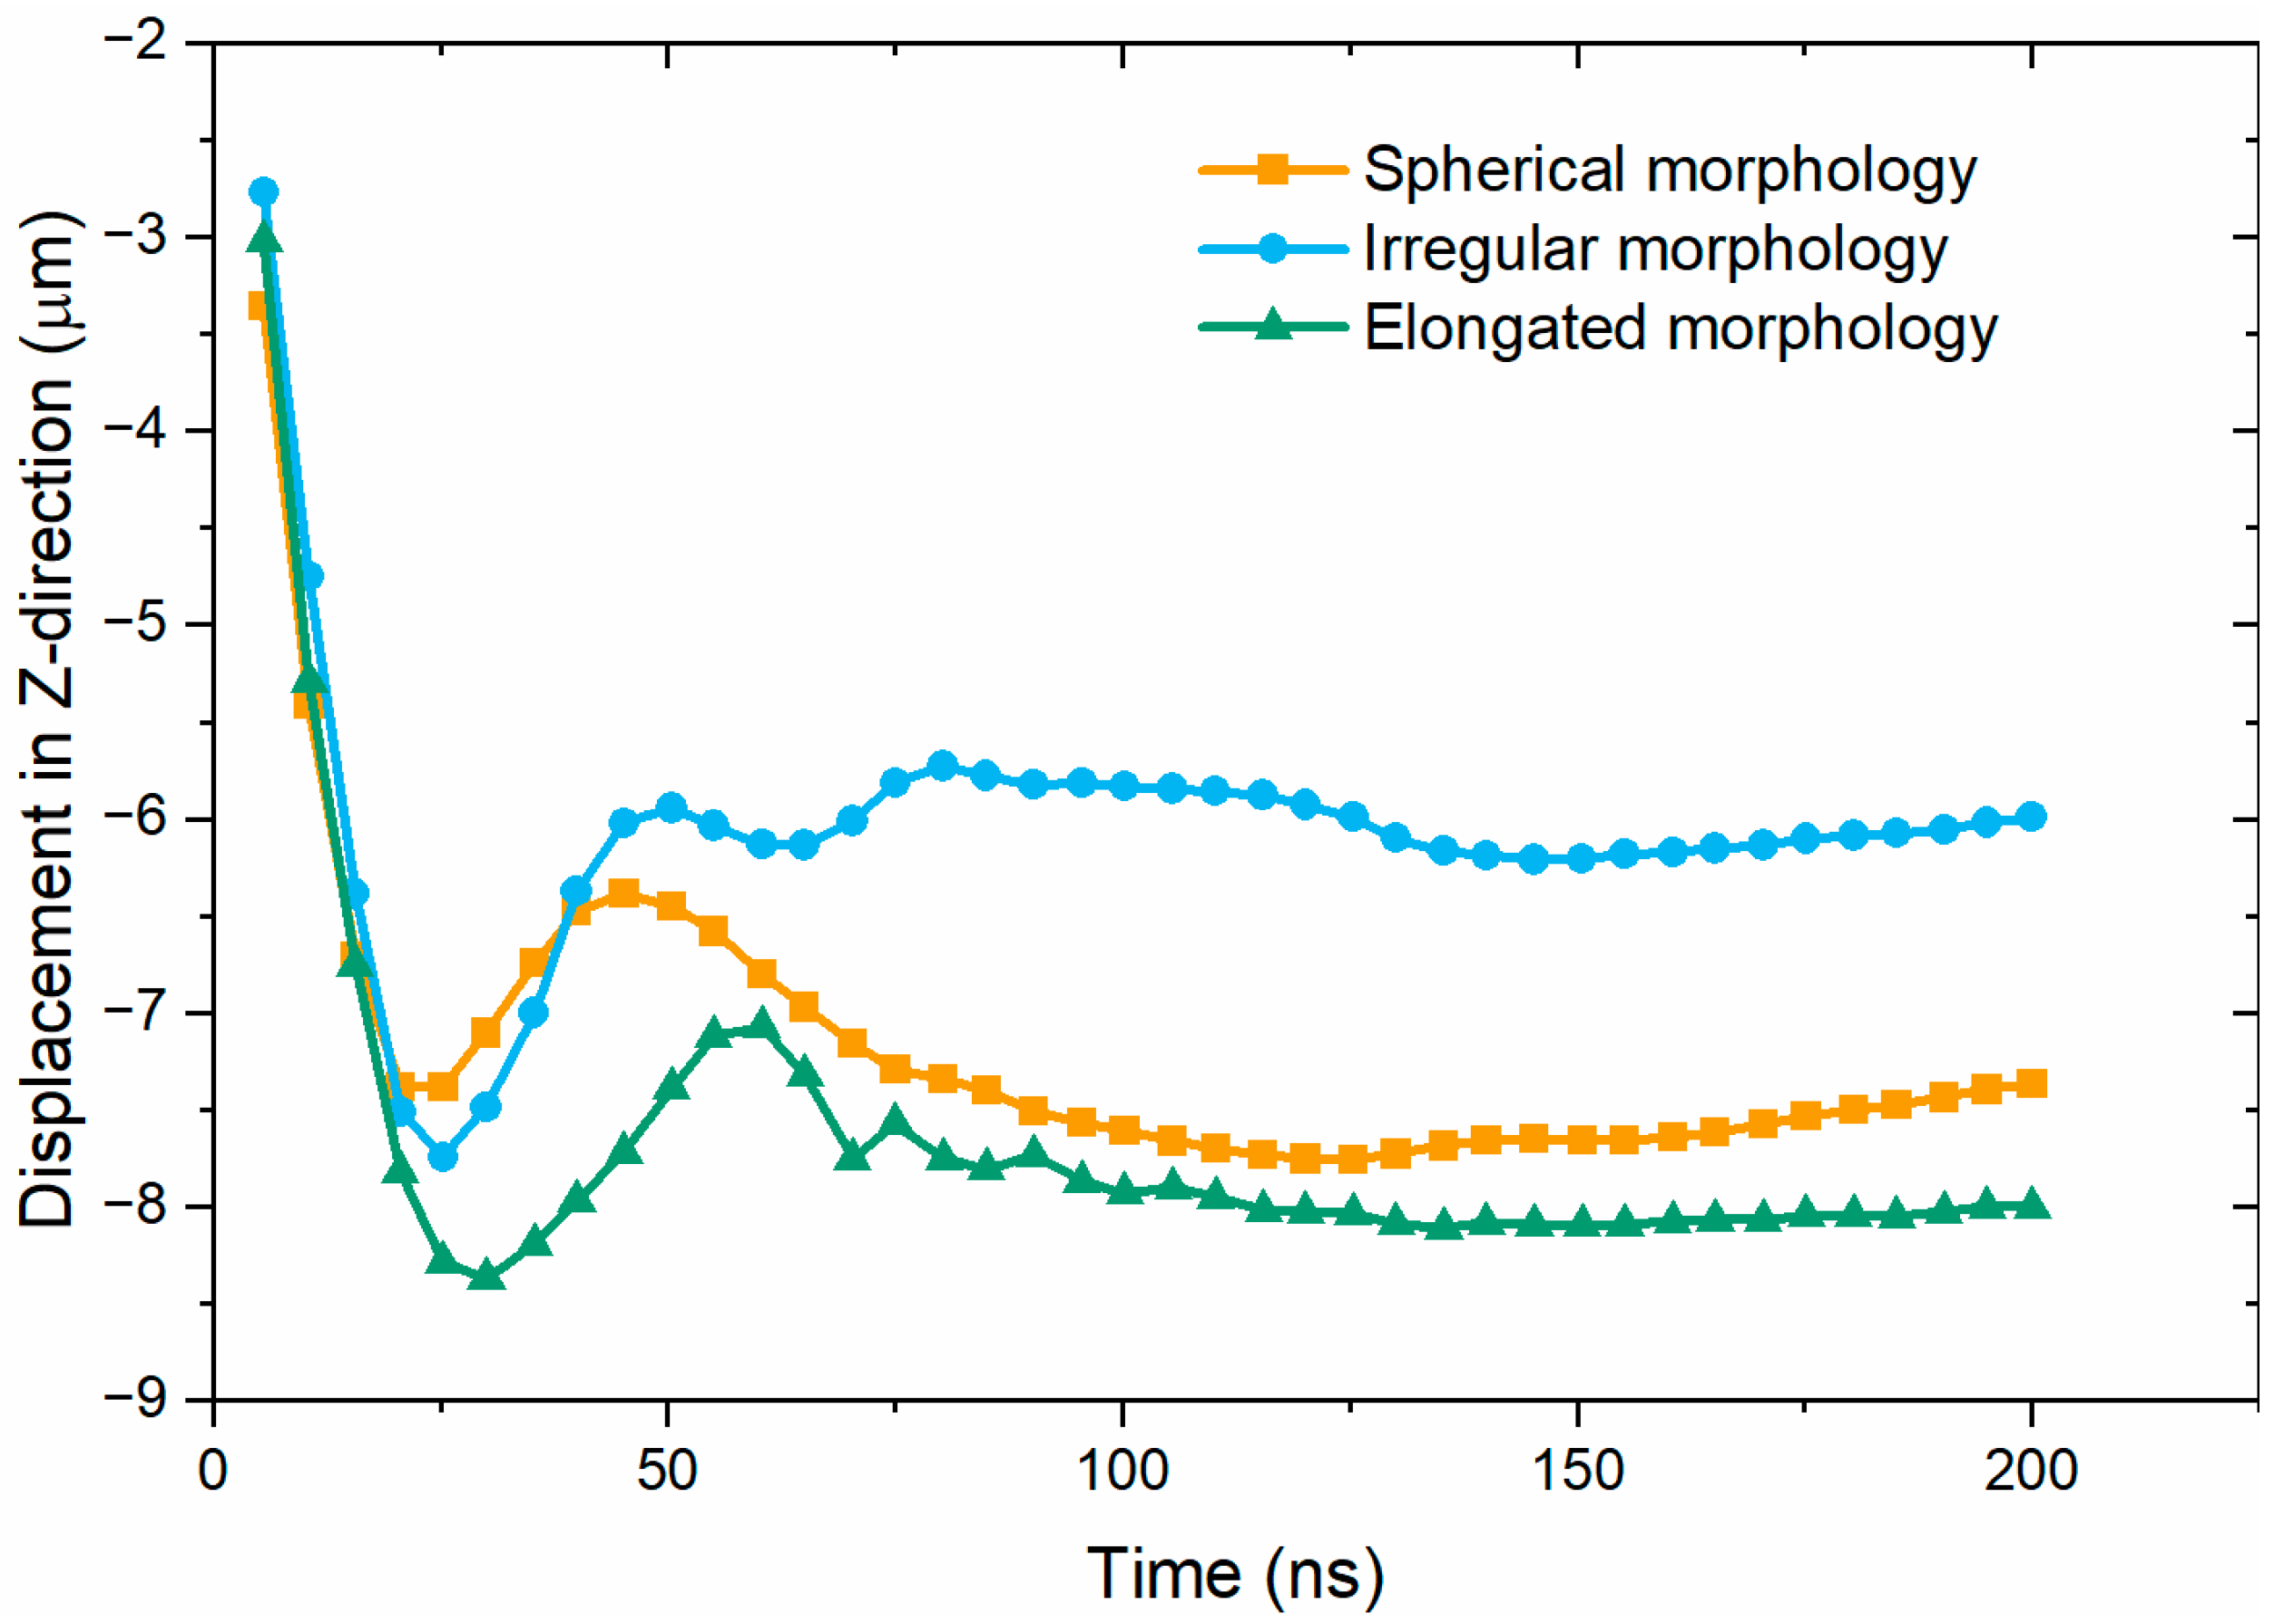
The time evolution of recoverable strain energy of the impacted systems and the particles’ displacement curves of each morphology were studied. It was deduced that the feedstock particles with irregular morphology bond to the substrate with greater flattening ratio than spherical particles. However, irregular particles possess a higher tendency to detach from the substrate upon impact.
In summary, simulations using the modified JC model were found to provide a closer prediction of particle deposition behaviour during the cold spray process. The robustness of this model has been demonstrated with two material systems, two particle sizes, and three particle morphologies. Lastly, the insights gained from the present study would be beneficial in developing numerical models for cold spray, as well as furthering the understanding of cold spray deposition mechanisms.

Supplementary Materials

The following supporting information can be downloaded at: https://www.mdpi.com/article/10.3390/applmech6020033/s1, Figure S1. CAD models of (a) elongated and (b) irregular feedstock particles generated in OpenSCAD, before being input into ABAQUS CAE. Spherical particles were generated directly in ABAQUS CAE as standard spheres of 80 µm diameter; Figure S2. Graph vs. Ln(σJC – 185.7) vs. Ln(εp) at T = 296 K and ε p ˙ = 0.1 s−1 for commercially pure titanium (CP-Ti); Figure S3. Stress-strain curves of CP-Ti at T = 296 K and ε ˙ 0 = 0.001, 0.1 and 8000 s−1, adapted from Nemat-Nasser et al.’s [25] Figure 1A,B,D; Figure S4. JC parameter of C calibrated at T = 296 K and ε ˙ 0 = 0.001, 0.1 and 8000 s−1 for commercially pure titanium (CP-Ti); Figure S5. Stress-strain curves of CP-Ti at ε ˙ 0 = 0.1 s−1 and T = 373 K, 473 K, 598 K, and 798 K, adapted from Nemat-Nasser et al.’s [25] Figure 2B; Figure S6. JC parameter of m calibrated at ε ˙ 0   = 0.1 s−1 and T = 373 K, 473 K, 598 K and 798 K for commercially pure titanium (CP-Ti); Figure S7. The maximum temperature evolution of the 200 ns simulations of using 30 μm Al 6061 feedstock; Figure S8. The distribution of CP-Ti particle sizes as measured by the Tecnar DPV-2000 camera system; Figure S9. The distribution of the CP-Ti particle in-flight velocity as measured by the Tecnar DPV-2000 camera system; Figure S10. The maximum temperature evolution of the 200 ns simulations of using 30 µm CP-Ti feedstock for all three morphologies using standard and modified JC models; Figure S11. Profilometer cross-section of a crater formed on the CP-Ti substrate as a result of the impact of a CP-Ti feedstock particle of (a) spherical, and (b) irregular morphologies. Raw data is presented in orange, while a Gaussian filter smoothed profile is presented in blue; Figure S12. Optical images showing the cross-sections of multiple deposited CP-Ti particles of (a–c) spherical, and (d–f) irregular morphologies onto CP-Ti substrate.

Author Contributions

Conceptualization, W.K.W.T., S.P. and A.S.M.A.; methodology, W.K.W.T., S.P. and R.C.; software, W.K.W.T., S.P., D.P. and R.C.; validation, W.K.W.T., M.E, S.P. and A.S.M.A.; formal analysis, W.K.W.T.; investigation, W.K.W.T., S.P. and A.S.M.A.; resources, M.O. and A.S.M.A.; data curation, W.K.W.T., M.E. and S.P.; writing—original draft preparation, W.K.W.T.; writing—review and editing, W.K.W.T., S.P., D.P., S.S.L.C., R.C., M.O., R.J. and A.S.M.A.; visualisation, W.K.W.T., S.S.L.C. and S.P.; supervision, S.P., M.O. and A.S.M.A.; project administration, A.S.M.A.; funding acquisition, A.S.M.A. All authors have read and agreed to the published version of the manuscript.

Funding

This work is supported under a Swinburne University Postgraduate Research Award. The authors acknowledge the support from the Australian Research Council (ARC). The ARC Training Centre in Surface Engineering for Advanced Materials, SEAM, has been funded under the ARC Industrial Transformation Training Centre (ITTC) scheme via Award IC180100005.

Data Availability Statement

The original contributions presented in the study are included in the article and Supplementary Material; further inquiries can be directed to the corresponding author.

Acknowledgments

We are grateful for the support from Titomic Limited, industrial, university, and other organisation partners who have contributed to the establishment and support of SEAM. In addition, we are also grateful for the image/visual processing contribution made by Zhi Ying Loh in this paper.

Conflicts of Interest

Authors W.K.W. Tai, M. Eberle and M. Osborne were employed by the company Titomic Limited. The remaining authors declare that the research was conducted in the absence of any commercial or financial relationships that could be construed as a potential conflict of interest.

References

  1. Kuroda, S.; Kawakita, J.; Watanabe, M.; Katanoda, H. Warm spraying-a novel coating process based on high-velocity impact of solid particles. Sci. Technol. Adv. Mater. 2008, 9, 033002. [Google Scholar] [CrossRef]
  2. Limited, T. Titomic Kinetic Fusion. Available online: https://titomic.com/ (accessed on 3 March 2022).
  3. Defence & Space. Titomic Ramps Up Commercialisation. Available online: https://spaceanddefense.io/titomic-ramps-up-commercialisation/ (accessed on 10 August 2022).
  4. Kim, K.; Watanabe, M.; Mitsuishi, K.; Iakoubovskii, K.; Kuroda, S. Impact bonding and rebounding between kinetically sprayed titanium particle and steel substrate revealed by high-resolution electron microscopy. J. Phys. D Appl. Phys. 2009, 42, 065304. [Google Scholar] [CrossRef]
  5. Tai, W.K.W.; Chakrabarty, R.; Pinches, S.; Huang, X.; Lang, J.; Song, J.; Ang, A.S.M. Comparing Relative Bond Characteristics Between Spherical and Elongated Morphologies for Cold Spray Process Using SPH Simulation. J. Therm. Spray Technol. 2022, 31, 2489–2504. [Google Scholar] [CrossRef]
  6. Assadi, H.; Kreye, H.; Gärtner, F.; Klassen, T. Cold spraying–A materials perspective. Acta Mater. 2016, 116, 382–407. [Google Scholar] [CrossRef]
  7. Meng, F.; Hu, D.; Gao, Y.; Yue, S.; Song, J. Cold-spray bonding mechanisms and deposition efficiency prediction for particle/substrate with distinct deformability. Mater. Des. 2016, 109, 503–510. [Google Scholar] [CrossRef]
  8. Assadi, H.; Gärtner, F.; Stoltenhoff, T.; Kreye, H. Bonding mechanism in cold gas spraying. Acta Mater. 2003, 51, 4379–4394. [Google Scholar] [CrossRef]
  9. Friderikos, O.; Sagris, D.; David, C.N.; Korlos, A. Simulation of adiabatic shear bands in orthogonal machining of Ti6Al4V using a rigid-viscoplastic finite element analysis. Metals 2020, 10, 338. [Google Scholar] [CrossRef]
  10. Wang, Q.; Birbilis, N.; Zhang, M.-X. On the formation of a diffusion bond from cold-spray coatings. Metall. Mater. Trans. A 2012, 43, 1395–1399. [Google Scholar] [CrossRef]
  11. Ko, K.; Choi, J.; Lee, H. Intermixing and interfacial morphology of cold-sprayed Al coatings on steel. Mater. Lett. 2014, 136, 45–47. [Google Scholar] [CrossRef]
  12. Hassani-Gangaraj, M.; Veysset, D.; Champagne, V.K.; Nelson, K.A.; Schuh, C.A. Adiabatic shear instability is not necessary for adhesion in cold spray. Acta Mater. 2018, 158, 430–439. [Google Scholar] [CrossRef]
  13. Bae, G.; Kumar, S.; Yoon, S.; Kang, K.; Na, H.; Kim, H.-J.; Lee, C. Bonding features and associated mechanisms in kinetic sprayed titanium coatings. Acta Mater. 2009, 57, 5654–5666. [Google Scholar] [CrossRef]
  14. Schmidt, T.; Gärtner, F.; Assadi, H.; Kreye, H. Development of a generalized parameter window for cold spray deposition. Acta Mater. 2006, 54, 729–742. [Google Scholar] [CrossRef]
  15. Chakrabarty, R.; Song, J. A modified Johnson-Cook material model with strain gradient plasticity consideration for numerical simulation of cold spray process. Surf. Coat. Technol. 2020, 397, 125981. [Google Scholar] [CrossRef]
  16. Gnanasekaran, B.; Liu, G.-R.; Fu, Y.; Wang, G.; Niu, W.; Lin, T. A Smoothed Particle Hydrodynamics (SPH) procedure for simulating cold spray process-A study using particles. Surf. Coat. Technol. 2019, 377, 124812. [Google Scholar] [CrossRef]
  17. Manap, A.; Nooririnah, O.; Misran, H.; Okabe, T.; Ogawa, K. Experimental and SPH study of cold spray impact between similar and dissimilar metals. Surf. Eng. 2014, 30, 335–341. [Google Scholar] [CrossRef]
  18. Yin, S.; Wang, X.-F.; Xu, B.-P.; Li, W.-Y. Examination on the calculation method for modeling the multi-particle impact process in cold spraying. J. Therm. Spray Technol. 2010, 19, 1032–1041. [Google Scholar] [CrossRef]
  19. Saleh, M.; Luzin, V.; Spencer, K. Evaluation of the residual stress in the cold spray technique using smooth particle hydrodynamics modelling and neutron diffraction. In Materials Science Forum; Trans Tech Publications Ltd.: Bäch, Switzerland, 2014; pp. 205–212. [Google Scholar]
  20. Muiruri, A.; Maringa, M.; du Preez, W. Development of VUMAT and VUHARD Subroutines for Simulating the Dynamic Mechanical Properties of Additively Manufactured Parts. Materials 2022, 15, 372. [Google Scholar] [CrossRef]
  21. OpenSCAD. OpenSCAD Is a Software for Creating Solid 3D CAD Objects. Available online: https://openscad.org/ (accessed on 7 June 2022).
  22. Lin, J. Boolean Operations and Hull. Available online: https://openhome.cc/eGossip/OpenSCAD/BooleanOperationsHull.html (accessed on 19 June 2022).
  23. Murugesan, M.; Jung, D.W. Johnson Cook material and failure model parameters estimation of AISI-1045 medium carbon steel for metal forming applications. Materials 2019, 12, 609. [Google Scholar] [CrossRef]
  24. Li, Z.; Wang, B.; Zhao, S.; Valiev, R.Z.; Vecchio, K.S.; Meyers, M.A. Dynamic deformation and failure of ultrafine-grained titanium. Acta Mater. 2017, 125, 210–218. [Google Scholar] [CrossRef]
  25. Nemat-Nasser, S.; Guo, W.; Cheng, J. Mechanical properties and deformation mechanisms of a commercially pure titanium. Acta Mater. 1999, 47, 3705–3720. [Google Scholar] [CrossRef]
  26. MathWorks. Least Square Curve Fitting Tool. Available online: https://www.mathworks.com/help/optim/ug/lsqcurvefit.html (accessed on 27 May 2022).
  27. Siegel, A.; Laporte, S.; Sauter-Starace, F. Johnson-Cook Parameter Identification for Commercially Pure Titanium at Room Temperature under Quasi-Static Strain Rates. Materials 2021, 14, 3887. [Google Scholar] [CrossRef] [PubMed]
  28. Limited, T. TKF Systems. Available online: https://titomic.com/products-services/tkf-systems/ (accessed on 20 May 2022).
  29. Morks, M.F.; Zahiri, S.H.; Lang, J.; Chen, X.-B.; Gulizia, S.; Cole, I.S. The influence of powder morphology on the microstructure and mechanical properties of as-sprayed and heat-treated cold-sprayed CP Ti. Int. J. Adv. Manuf. Technol. 2022, 118, 3869–3881. [Google Scholar] [CrossRef]
  30. MathWorks. Smoothing Noisy Data. Available online: https://www.mathworks.com/help/matlab/ref/smoothdata.html (accessed on 7 May 2022).
  31. Society, A.T.S. Accepted Practice for Metallographic Preparation of Thermal Spray Coating Samples. In Thermal Spray Technology: Accepted Practices; ASM Thermal Spray Society: Materials Park, OH, USA, 2022. [Google Scholar] [CrossRef]
  32. Simulia, D. Energy Balance. Available online: https://abaqus-docs.mit.edu/2017/English/SIMACAETHERefMap/simathe-c-energybalance.htm (accessed on 1 April 2022).
  33. Bae, G.; Xiong, Y.; Kumar, S.; Kang, K.; Lee, C. General aspects of interface bonding in kinetic sprayed coatings. Acta Mater. 2008, 56, 4858–4868. [Google Scholar] [CrossRef]
  34. Yusof, S.; Manap, A.; Afandi, N. Numerical analysis of Al coating using different particle shape in LPCS. In Proceedings of the IOP Conference Series: Earth and Environmental Science, Putrajaya, Malaysia, 23–25 February 2016; p. 012038. [Google Scholar]
Figure 1. Strain-rate sensitivity study of CP-Ti with experimental data (black solid dots, reproduced with permission from ref. [24]), standard JC fitting (blue line), and modified JC fitting (orange line).
Applmech 06 00033 g001
Figure 2. Code fragment from Chakrabarty and Song’s [15] VUHARD user subroutine. The xd from line 56 corresponds to the fitting parameter D and the epsdot2 from line 57 corresponds to the fitting parameter ε ˙ c .
Applmech 06 00033 g002
Figure 3. The top view of the 40 μm (a) spherical, (b) elongated, and (c) irregular feedstock particles on the substrate. Please refer to Table 3 for the particle numbers and their rotation and/or translation end points relative to the initially imported positions.
Applmech 06 00033 g003
Figure 4. SEM micrographs of CP-Ti powders of (a,b) spherical and (c,d) irregular morphologies [29].
Applmech 06 00033 g004
Figure 5. Stress distributions of 200 ns simulation of a 40 μm Al6061-T6 particle hitting on a Al6061-T6 substrate with (a) the standard JC model and (b) the modified JC model.
Applmech 06 00033 g005
Figure 6. The splat profiles of a 40 µm Al6061-T6 feedstock particle formed with the (a) standard JC model and (b) modified JC model.
Applmech 06 00033 g006
Figure 7. Plot of CP-Ti feedstock particle sizes against their impact velocity. The coloured lines are indicative of the respective mean values for irregular (orange) and spherical (blue) particle morphologies.
Applmech 06 00033 g007
Figure 8. The simulated stress distribution from a 40 µm CP-Ti feedstock impacting the CP-Ti substrate, under (a,c,e) standard JC and (b,d,f) modified JC models, for feedstock particles of (a,b) spherical, (c,d) elongated, and (e,f) irregular morphologies.
Applmech 06 00033 g008
Figure 9. (a) An optical image of the cross-section of spherical CP-Ti feedstock particles deposited onto a CP-Ti substrate. Its experimentally measured profile (black line) is compared to the profiles simulated with the (b) standard JC and (c) modified JC models.
Applmech 06 00033 g009
Figure 10. The evolution of particle displacement before and after impact for spherical, elongated, and irregular CP-Ti feedstock particles.
Applmech 06 00033 g010
Figure 11. The equivalent plastic strain (PEEQ) profile of (a) spherical, (b) elongated, and (c) irregular CP-Ti particles after impact.
Applmech 06 00033 g011
Figure 12. The evolution of the CP-Ti feedstocks’ recoverable strain energies of all three morphologies considered.
Applmech 06 00033 g012
Figure 13. Comparison of the experimentally determined CP-Ti (a,b) spherical particle and (c,d) irregular particle splat profiles (red lines) against their respective simulations based on the (a,c) standard JC and (b,d) modified JC models.
Applmech 06 00033 g013
Figure 14. (a) The evolution of recoverable strain energies of single-particle (solid lines) and multiple-particle (dashed lines) simulations, with spherical (blue) and irregular (orange) CP-Ti particles. (b) Inset showing a zoom-in of time period 150–200 ns, which demonstrates a trend towards zero recoverable strain energy.
Applmech 06 00033 g014
Figure 15. Optical cross-sectional images of the cold-sprayed coupons with multiple CP-Ti (a) spherical and (b) irregular feedstock particles deposited onto a CP-Ti substrate.
Applmech 06 00033 g015
Table 1. The initial and optimised values of modified JC model parameters for CP-Ti. A, B, n, C, and m are material dependent constants used in the standard JC model. Particular to the modified JC model, D is the parameter that is non-zero when the plastic strain rate, ε c ˙ equals or exceeds the critical strain rate.
ParameterInitial ValuesOptimised Values
A185.67185.65
B998.716998.84
n0.67570.2593
C0.00290.0492
m0.42540.5309
D0.040.227
ε c ˙ 1002716
Table 2. Material properties for Al6061-T6 and CP-Ti.
Material PropertyAl6061-T6 [15]CP-Ti [25,26]
* Density (kg/m3)27004510
* Young’s modulus (GPa)70116
* Poisson’s ratio0.330.34
* Inelastic heat fraction0.90.9
* Specific heat capacity (J·kg−1·K−1)875528
* A (MPa)324185.7
* B (MPa)114998.8
* n0.420.26
* C0.0020.049
* m
* Reference temperature (°C)
1.34
25
0.53
23
* Melting temperature (°C)5821650
* Reference strain rate, ε 0 ˙ (s−1)
Modified JC fitting parameter, D
Modified JC fitting parameter, ε ˙ c (s−1)
1
0.2902
3.243
0.1
0.2270
2716
* Parameter initialised in ABAQUS CAE.
Table 3. The rotation and translation end points for the 40 μm feedstock particles, relative to the initially imported location. Please refer to Figure 3 for a visual representation of the feedstock particles’ configurations.
FeedstockParticleRotationX (μm)Y (μm)Z (μm)
Spherical2042110
Spherical3042−110
Spherical10420
Spherical5804255
Spherical48042−55
Elongated1−90° about X0018
Elongated3−90° about X00128
Elongated2−90° about X00−92
Elongated5−90° about X800−37
Elongated4−90° about X80073
Irregular1−110−4−25
Irregular4−110−485
Irregular5−110−4−135
Irregular2−30−430
Irregular3−30−4−80
Table 4. The flattening ratios of CP-Ti spherical and irregular feedstock particles from experiments and simulations.
Flattening RatioSpherical ParticlesIrregular Particles
Experimental4.285.31
Simulation with standard JC
Simulation with modified JC
6.567.89
3.294.58
Disclaimer/Publisher’s Note: The statements, opinions and data contained in all publications are solely those of the individual author(s) and contributor(s) and not of MDPI and/or the editor(s). MDPI and/or the editor(s) disclaim responsibility for any injury to people or property resulting from any ideas, methods, instructions or products referred to in the content.

