Article

Numerical and Experimental Analysis of Impact Force and Impact Duration with Regard to Radiosondes: Is a PUR Foam Shell an Effective Solution?

1
Department of Vehicle Production and Engineering, Audi Hungaria Faculty of Vehicle Engineering, Széchenyi István University, H-9026 Győr, Hungary
2
Department of Materials Science and Technology, Audi Hungaria Faculty of Vehicle Engineering, Széchenyi István University, H-9026 Győr, Hungary
*
Authors to whom correspondence should be addressed.
Appl. Mech. 2025, 6(1), 19; https://doi.org/10.3390/applmech6010019
Submission received: 19 December 2024 / Revised: 19 February 2025 / Accepted: 2 March 2025 / Published: 5 March 2025

Abstract

:
This study investigates the effect of a polyurethane (PUR) foam layer on impact force, impact duration, and deformation with regard to radiosondes during drop tests. Numerical (Finite Element Method) and experimental approaches were used to model collisions with and without protective PUR layers. The numerical results demonstrated that adding a soft PUR foam layer reduced peak impact force by 10% while it increased impact duration up to 71%. Experimental drop tests confirmed the numerical outcomes as peak impact force difference was 7% between simulations and experiments, while impact duration differed only by 11%. Besides force and duration, impact deformation was also investigated by an FEM model and high-speed camera footage on radiosondes with a PUR foam layer. The FEM model was able to approximate well the deformation magnitude since the numerical deformation was only 2% lower compared to the experimental data. In summary, a reliable and validated FEM model was created. On the one hand, this model allows the analysis of different protective layers around a radiosonde. On the other hand, it can adequately predict the impact behavior of radiosondes by incorporating multiple important factors. In addition, it has been confirmed that incorporating a soft PUR foam layer significantly improves safety by reducing impact force and extending impact duration.

1. Introduction

Unmanned free balloons are non-power-driven, lighter-than-air aircraft in free flight. They often carry payloads such as radiosondes or individually developed probes. Unmanned free balloons are regulated by Commission Implementing Regulation (EU) No. 923/2012 in the European Union and are categorized based on their payload mass and other properties into light, medium, and heavy types [1]. Typically, they are composed of a payload, a parachute, and a balloon. These balloons are primarily for meteorological data measurements through modern compact instruments in radiosondes or through specially designed payload packages for unique purposes [2].
To enhance the survivorship (and to lower damage level) of the payload package, which is regularly a radiosonde, two main factors must be taken into account: the structure of the radiosonde, and the type of impact, which can be a low- or high-velocity impact.
With regard to the structure of radiosondes, it must be noted that their parts are commonly arranged in a self-reinforcing manner.
The internal electronic components are made of materials like epoxy/glass fiber, while the body (or frame) is made of EPS (Expanded Polystyrene). While EPS is generally regarded as a soft material, it proves to be more rigid than polyurethane foam (PUR foam) in this context.
It must be noted that EPS is a more commonly applied material if radiosondes are considered; however, PUR foam has also essential aspects that makes it a prominent contender. For example, the mechanical characteristics of PUR foams can be utilized to create soft foam packaging that effectively disperses collision energy [3,4,5]. Studies also introduced novel polyurea foam with a semi-closed, partially perforated microcellular structure reinforced by in situ polyurea microspheres. These microspheres exhibit a stiffening effect, which can be described analytically, offering insights into advanced material performance [6].
With regard to the impact, two types can be differentiated: low-velocity impacts, occurring at speeds under 10 m/s [7], and high-velocity impacts, occurring at ballistic test speeds [8,9].
Methods for detecting damage from low-velocity impacts (effective for impacts occurring at speeds under 10 m/s) on composite materials (EPE (Expanded polyethylene), PUR, etc.) and their associated structures have been widely investigated. A major aim in these methods is to maximize energy absorption and to minimize damage to the environment or to human beings [10,11,12,13]. In this regard, it has been pointed out by several numerical studies on mechanical damage modeling [14,15,16,17] that the exerted damage level on an object can be substantially reduced if a special protective layer is used.
Besides damage detection, damage characterization is also a vital issue during the impact of objects. While impact force is widely used to evaluate the performance of impact-mitigation systems, recent studies emphasize the importance of incorporating additional indices, such as impact-induced damage and failure progression besides the conventional impact force and collision duration, to better assess structural behavior under dynamic loading [18].
It must be noted, with regard to damage characterization, that damage level is often specified by the magnitude of deformation. Deformation itself can be calculated by means of Finite Element Modeling (FEM) or it can be measured by a high-speed video system. Combining these approaches, the accuracy of damage (deformation) detection in real-world situations can be improved with machine learning models [19].
Despite these advancements, radiosondes and light free unmanned balloon payload designs lack dedicated impact-mitigation structures. Conventional radiosondes rely on rigid EPS for protection, which offers just a limited energy absorption, increasing the risk of damage upon impact.
The introduction of soft layered bodies can distribute the impact force across a wider area due to increased body width, potentially prolonging the duration of impact and reducing localized stresses. This directly means that the risk of damage can be certainly minimized. In contrast, bodies without the protecting layer typically concentrate force over a shorter duration, increasing the likelihood of localized damage. The material properties of both the dropped bodies and their targets, including elasticity and damping characteristics, also play crucial roles in how they deform and recover during impact, further influencing the peak force experienced.
Unlike previous studies on rigid EPS or high-energy impacts [8,9], this research focuses on low-velocity conditions relevant to radiosonde usage, considering both mechanical protection and human safety in accidental collisions. By integrating soft-layered protective structures, this study explores a novel approach to radiosonde design, extending the application of PUR foams.
The first aim of this paper is to introduce an FEM model which is capable of simulating drop tests with and without different PUR protecting foams for radiosondes. The obtained numerical results are supported with experiments taken by high-speed video cameras.
The second aim of this paper is to demonstrate that PUR foam coating on radiosondes can significantly mitigate the damaging effects of impacts on the payload itself, or accidentally on a human being. Adding soft, energy-absorbing layers to the design of radiosondes and other unmanned free balloon payloads marks an important step forward in enhancing both safety and functionality.

2. Methods and Materials

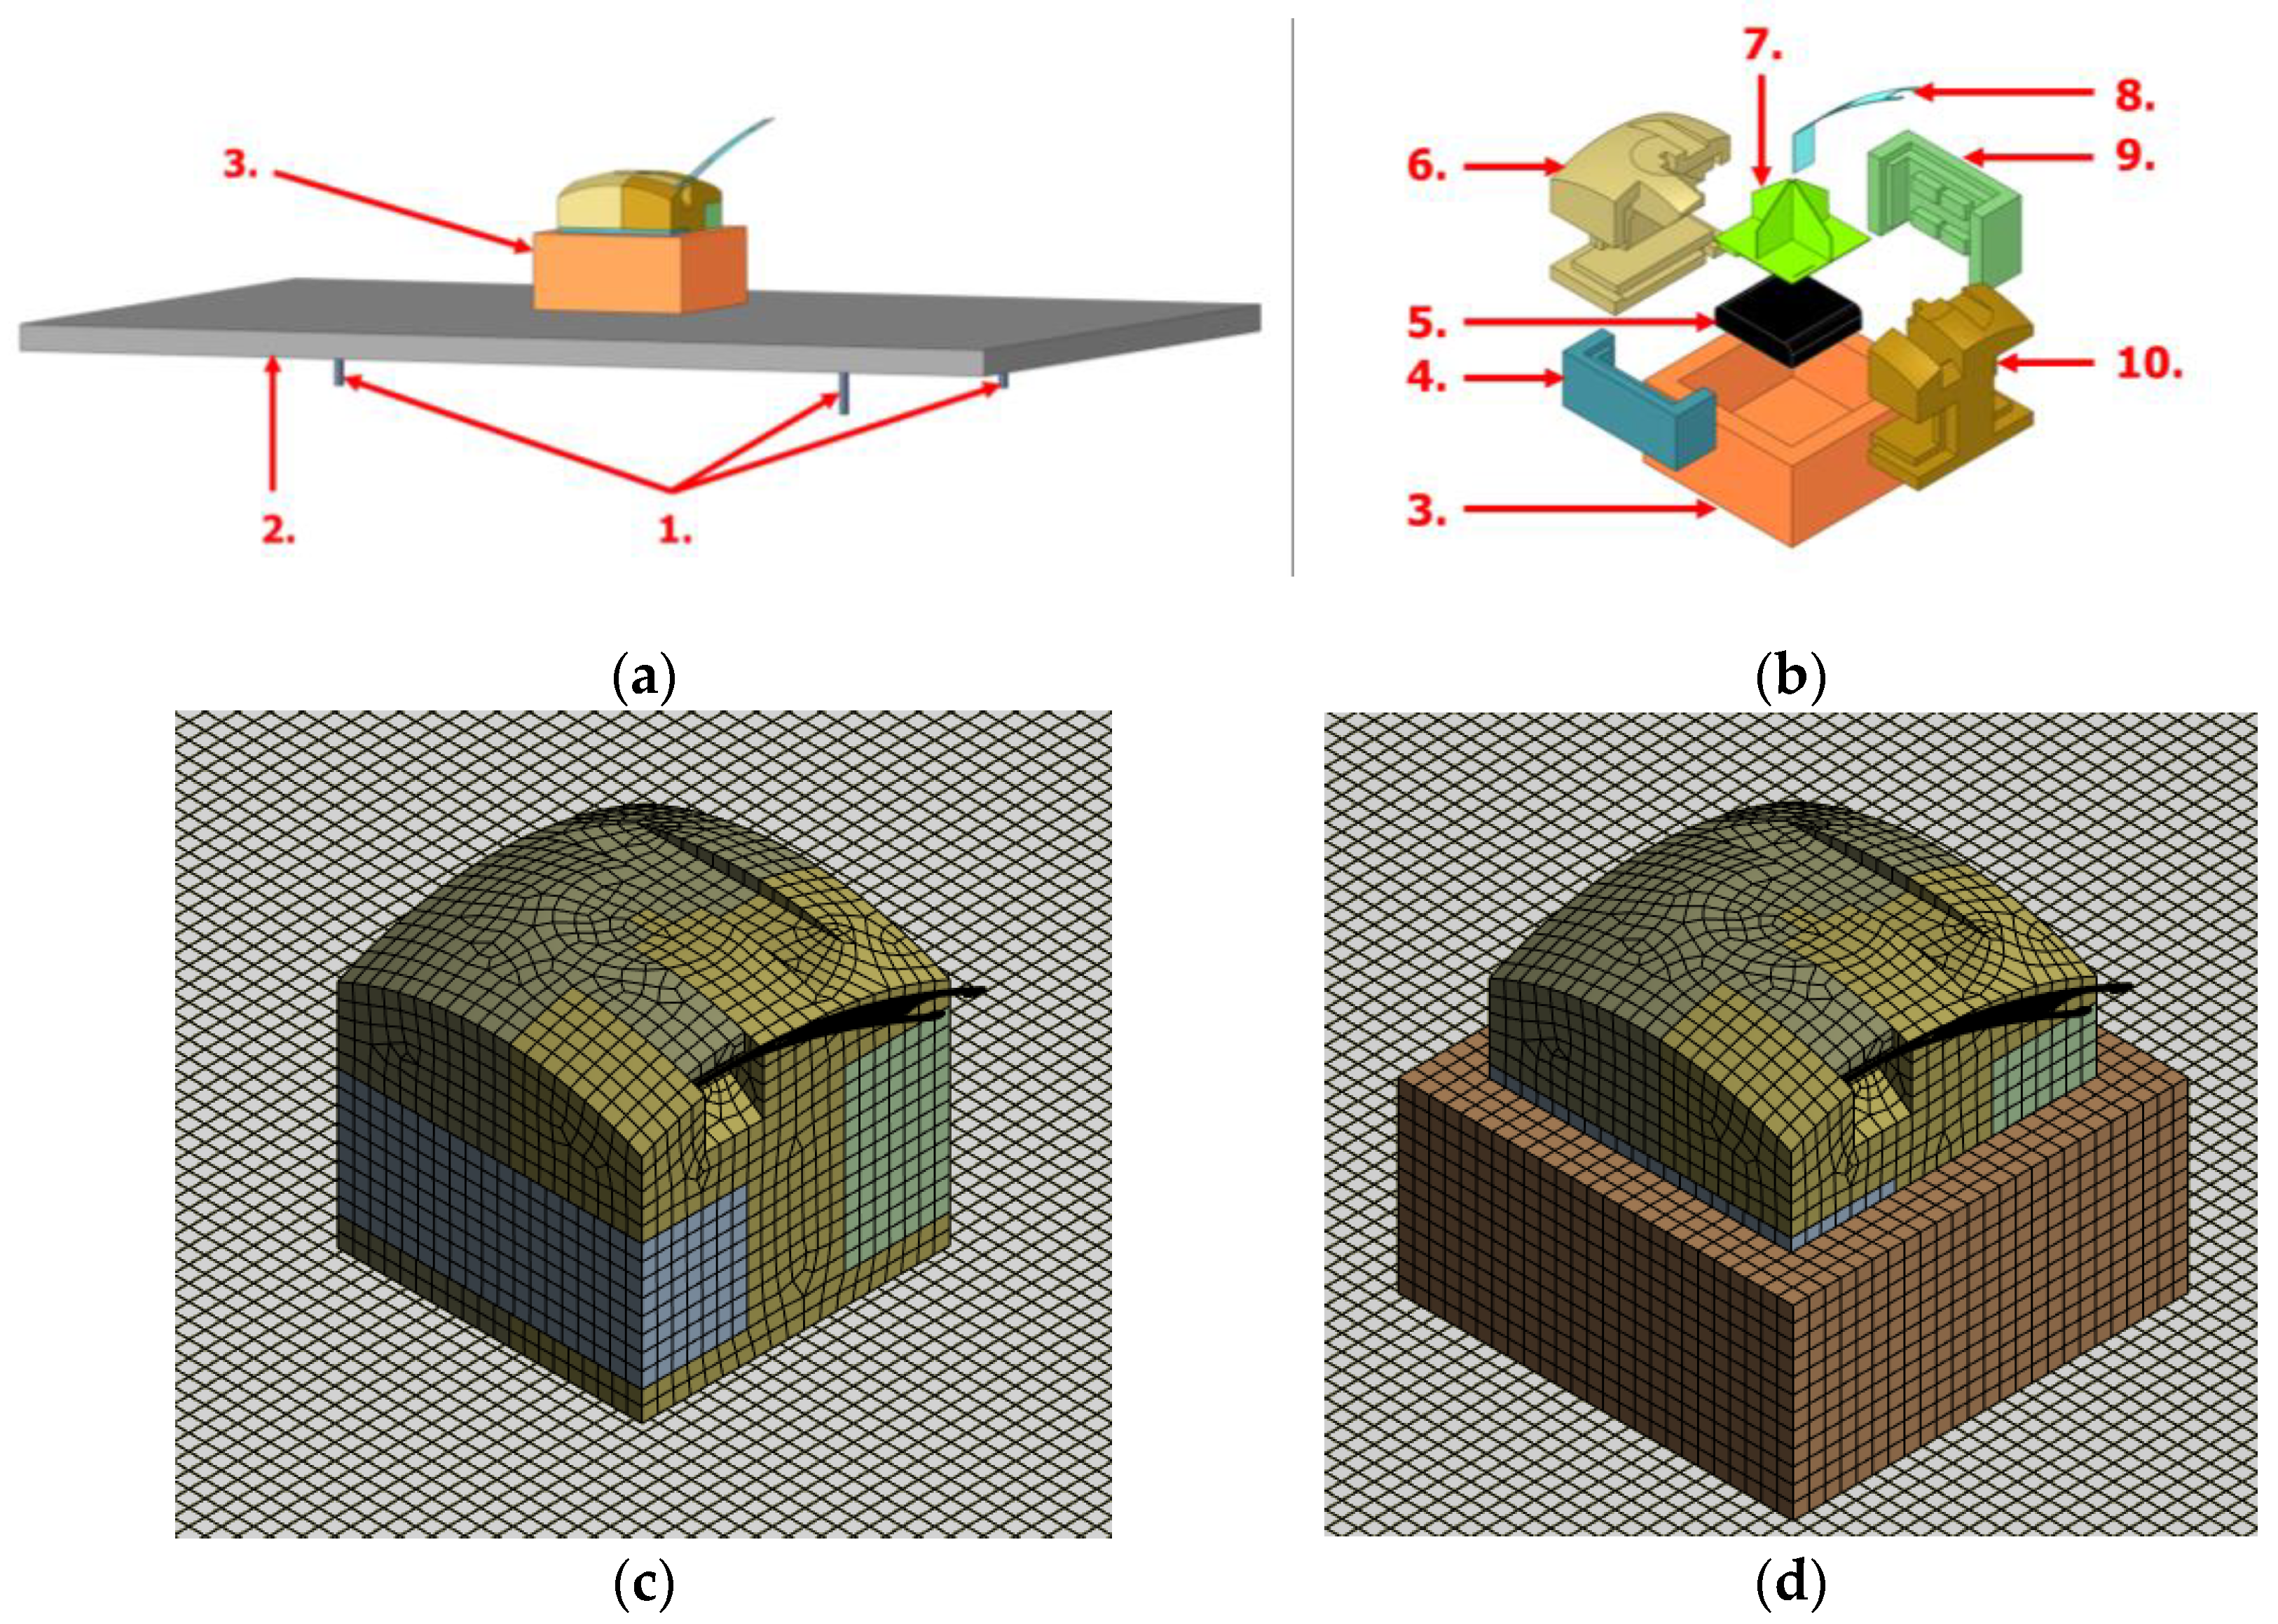
2.1. Methods of FEM Drop Tests

The primary aim of the numerical analyses was to determine the effect of protective PUR foam coating on the collision force and duration in case of radiosondes. In order to gain these information, FEM simulations were carried out using Ansys Workbench 16.2 (in Hungary) with 3 different coatings.
The first radiosonde had no coating (further referred to as Version A), the second one is denoted as radiosonde with PUR foam 1 (further referred to as Version B), while the last one is denoted as radiosonde with PUR foam 2 (further referred to as Version C).
Moreover, the radiosondes were also investigated under four different collision angles (0°, 2.5°, 5°, 7.5°). The angles were referenced to the target plate’s normal surface to simulate real world criteria.
With regard to the dimension of the simulated contact area, the target plate was modelled as a C45 steel plate, with 800 mm × 520 mm × 20 mm (length × width × height) size. The M10 radiosondes’ dimensions were set as follows: 94 mm × 94 mm × 88 mm, with a measured mass of 150 g.
FEM simulations utilized an explicit dynamics system for calculations, whereas the meshing involved adaptive sized hexagonal-dominant optimized settings.
The normal radiosonde model incorporated 113,010 elements and 116,982 nodes, whereas the versions with a soft layer included 118,882 elements and 121,233 nodes.
Figure 1a highlights the parts of the FEM simulation’s 3D model. The inner electronics (denoted by nr. 7 in Figure 1b) and batteries (denoted by nr. 5 in Figure 1b) had an initial 2.8 mm element size. The flat meteorological sensor had an initial 1.8 mm element size (denoted by nr. 8 in Figure 1b). The force measuring sensors had an initial 1.5 mm element size (denoted by nr. 1 in Figure 1a). The target plate (denoted by nr. 2 in Figure 1a), the soft shell (denoted by nr. 3 in Figure 1b), and all other parts of the radiosonde had an initial 5 mm element size (denoted by nrs. 4, 6, 9, and 10 in Figure 1b).
Figure 1b highlights the parts a soft shelled radiosonde’s 3D model, while Figure 1c,d highlights the meshing of the models.
The target plate was constrained by three rigid pins, which were attached to the plate. No rotations or displacement were allowed for in the connection between the pins and the plate or the pins and the environment. As stated previously, the target plate was set to be 20 mm thick, so it could be assumed that with this thickness, sensor readings remained unaffected.
The first pressure sensor was positioned at 150 mm from the 800 mm long left edge and 260 mm from the 520 mm long bottom edge. The second sensor was located at 635 mm from the left edge and 410 mm from the bottom edge. The third sensor was placed at 635 mm from the left edge and 110 mm from the bottom edge.
The material of the soft shell is Smooth-On FlexFoam-iT! III (Smooth-On Inc., Macungie, PA, USA), which is a PUR foam with rubber-like behaviors [20]. It exhibited 60 mm height with a 14 mm wall thickness on all sides (denoted by nr. 3).
The outer layer’s height was selected to allow the radiosonde’s structure to compress, providing space for potential disassembly during impact, though it also increased the impact surface area.
All components were modeled as flexible bodies in order to accurately simulate deformation and energy dissipation during impact. This also provided the possibility to validate the numerical results with the experiments.
The FEM model accounted for interactions within the radiosonde and also between the radiosonde and the target plate. All components of the radiosonde, including the EPS body, electronics, the sensor, and battery pack, were modeled as separate parts but interacting through contact mechanics. Contact properties were set to frictional interactions to accurately simulate energy dissipation, force transmission, and deformation upon impact. The effect of friction between the colliding parts was not part of this research.
Initial conditions were set for the simulations. The impact speed of each radiosonde was 9.8 m/s. Impact speed was calculated from the possible maximum drop height for a real world test of 4.95 m. The radiosonde was elevated 6 mm above the target plate with the initial speed.
As for the material selection, besides Version A which lacked the protective layer, two different cover materials (Versions B and C) were applied to assess their effectiveness in absorbing impact during drop tests.
Version B (PUR foam 1) is a commonly applied material (see properties in Table 1), known for its energy-absorbing properties. By covering the radiosonde with this soft shell, its mass became 23 g heavier compared to the original Version A. Subsequently, Version C was introduced (PUR foam 2, see Table 1), which was 3% softer than the PUR foam 1 used in Version B, but 2 times denser. By covering the radiosonde with this soft shell, its mass became 46 g heavier compared to the original Version A.
The basic material properties (ρ for density, E for Young’s modulus, ν for Poisson’s ratio, K for bulk modulus, and G for shear modulus) for the simulations are shown in Table 1.
After setting the initial conditions, the FEM drop test simulations were conducted. Simulations on Versions A, B, and C were carried out at four different collision angles (0°, 2.5°, 5°, 7.5°). It must be noted that such angles generate not only perpendicular but also tangential forces upon impact. The perpendicular forces tend to compress and potentially deform the radiosonde, while the tangential forces may introduce shearing, causing the device to slide or skid post-impact.
Face-to-face tests are visualized in Figure 2, where radiosondes without (Figure 2a–c) and with (Figure 2d–f) soft-shelled coating are separately shown to highlight the process of deformation during impact.
To ensure the validity of the numerical results, mesh sensitivity analysis was carried out. Peak impact force was chosen as a parameter to observe how its value changed depending on the mesh size. The first mesh version contained 37,557 elements and 49,420 nodes, while the second version contained 118,882 elements and 121,233 nodes.
After determining impact peak forces in both cases, a 9.2% difference was found between the two simulations. This indicated that the coarser mesh was definitely not adequate.
Therefore, a third mesh was created, which contained 167,107 elements and 196,532 nodes. After comparing the obtained impact peak forces between the second and the third mesh, only a 1.1% difference was found. For this reason, the second mesh was chosen for efficiency.

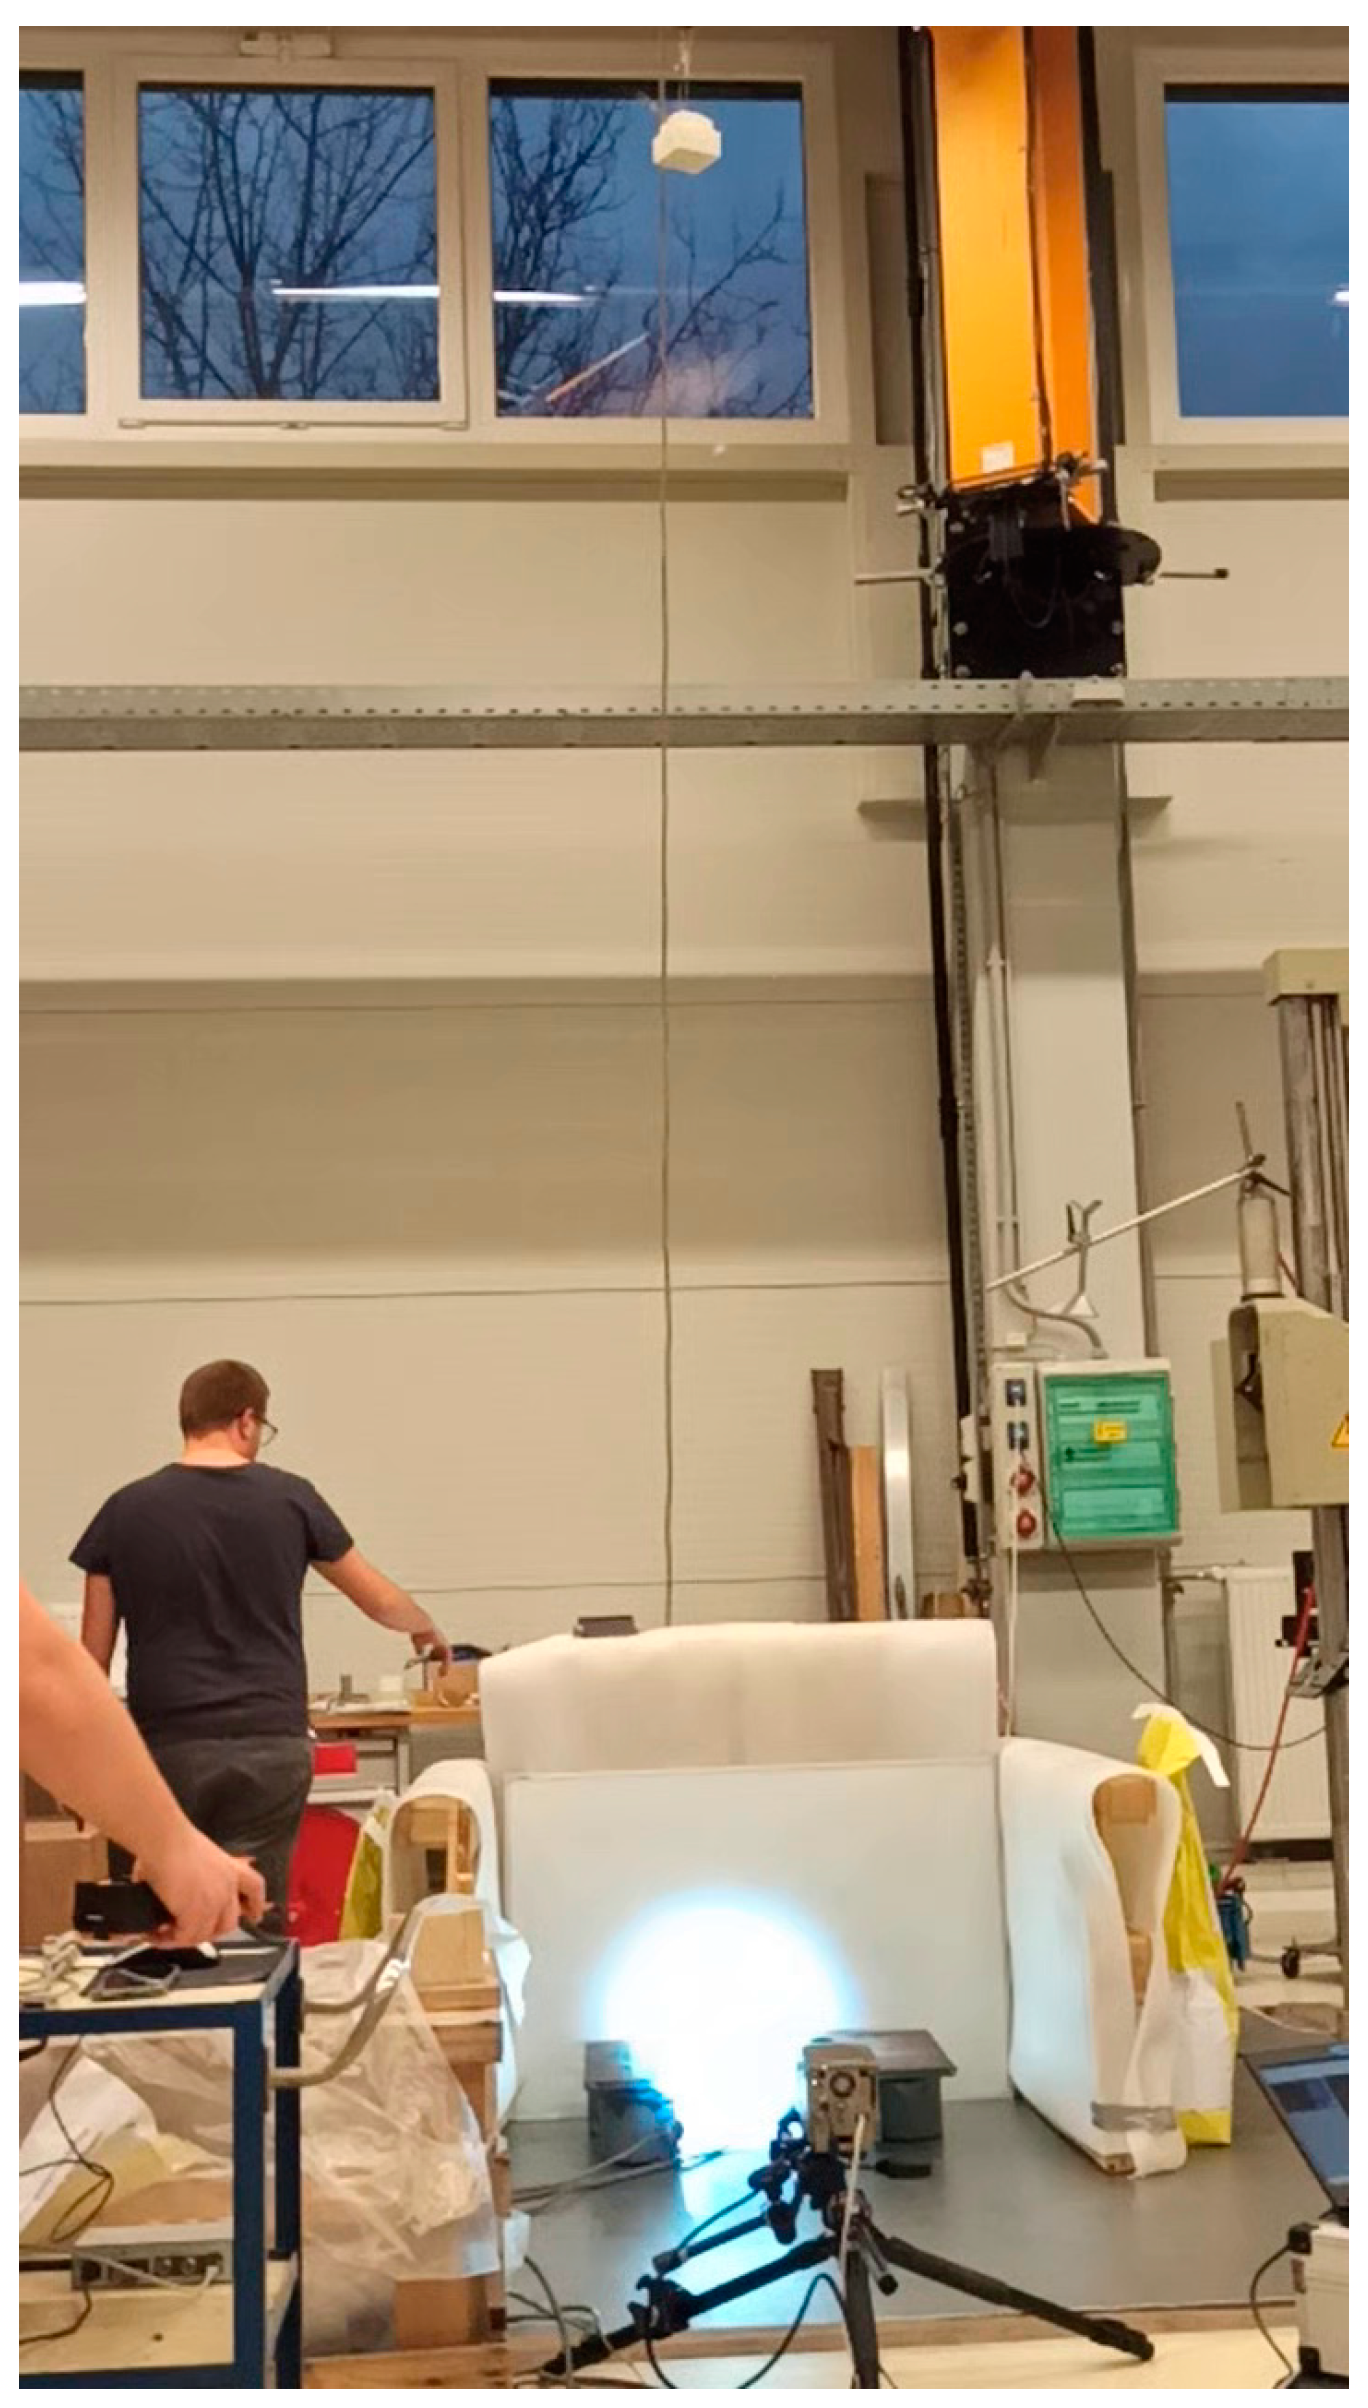
2.2. Method of Experimental Drop Tests

In the experimental drop tests, the collision process was comprehensively monitored using a set of pressure cells, and the events were simultaneously captured using high-speed video equipment. All physical (e.g., speed, density, mechanical, etc.) and geometrical (e.g., the main form of the radiosonde’s parts, the main dimensions of the radiosonde’s parts, the main dimensions of the target plate, etc.) parameters had the same values as they were set in the FEM models. The initial inclination angle for each experimental test was set to 0°.
Impact forces were measured five separate times using the pressure sensors. This method of repetition was deliberately employed to ensure the reliability and accuracy of the force measurement data.
Data from these collisions were analyzed using the Savitzky–Golay filtering technique, employing RStudio (version number 2024.04.2+761 with R programming language) and the R programming language for detailed analysis. This method is particularly effective for smoothing noisy data, helping to highlight underlying trends without distorting the true signal data [21].
Visual documentation of the impacts was recorded during 3 separate events using an iX i-SPEED 3 high-speed camera (iX Cameras Ltd., Rochford, Essex, UK), fitted with a Tamron AF 28–300 mm f/3.5–6.3 XR Di LD Aspherical Macro lens (Tamron Co., Ltd.; Saitama, Japan). This camera captured footage at 2000 frames per second with a resolution of 1280 × 1024 pixels, enabling precise visual examination of deformations every 0.5 milliseconds. This high frame rate and detailed resolution allowed us to observe the minutiae of the impact interactions, crucial for assessing the dynamics and effects of collision forces on the materials tested. The frames were analyzed, the impact angles were measured, and the deformation of the soft shell was determined. The experimental setup is shown in Figure 3.

3. Results and Discussion

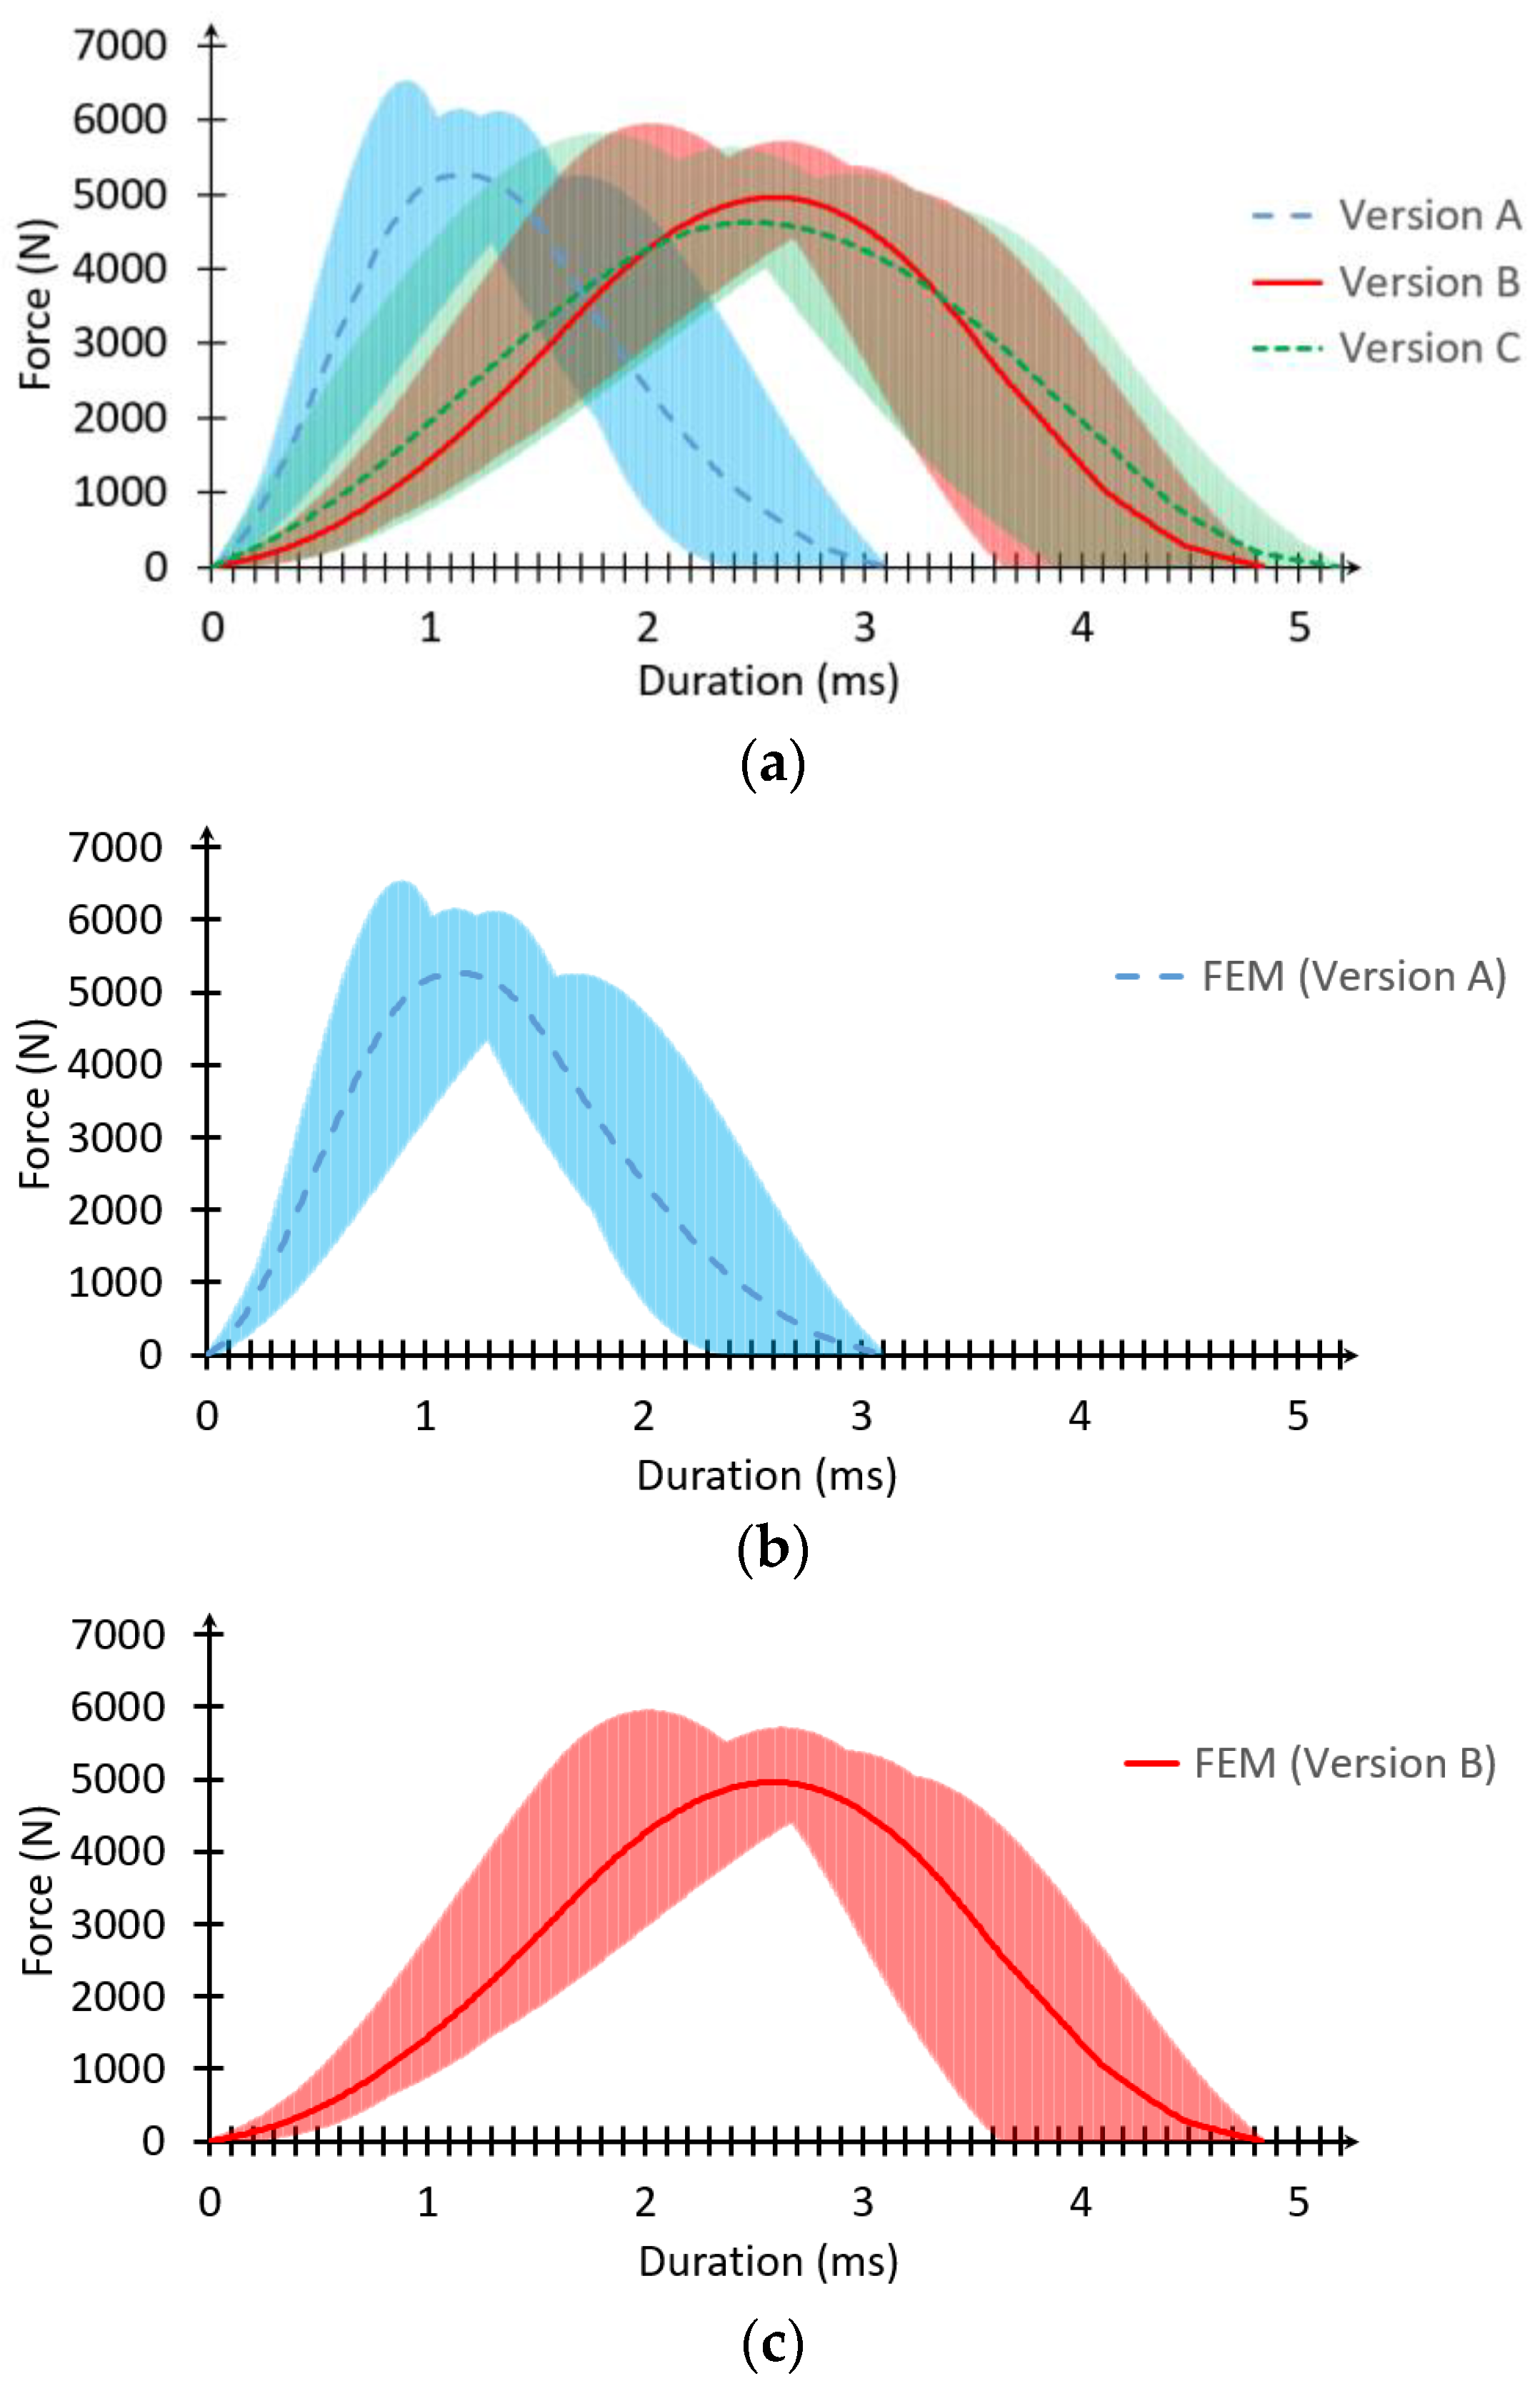
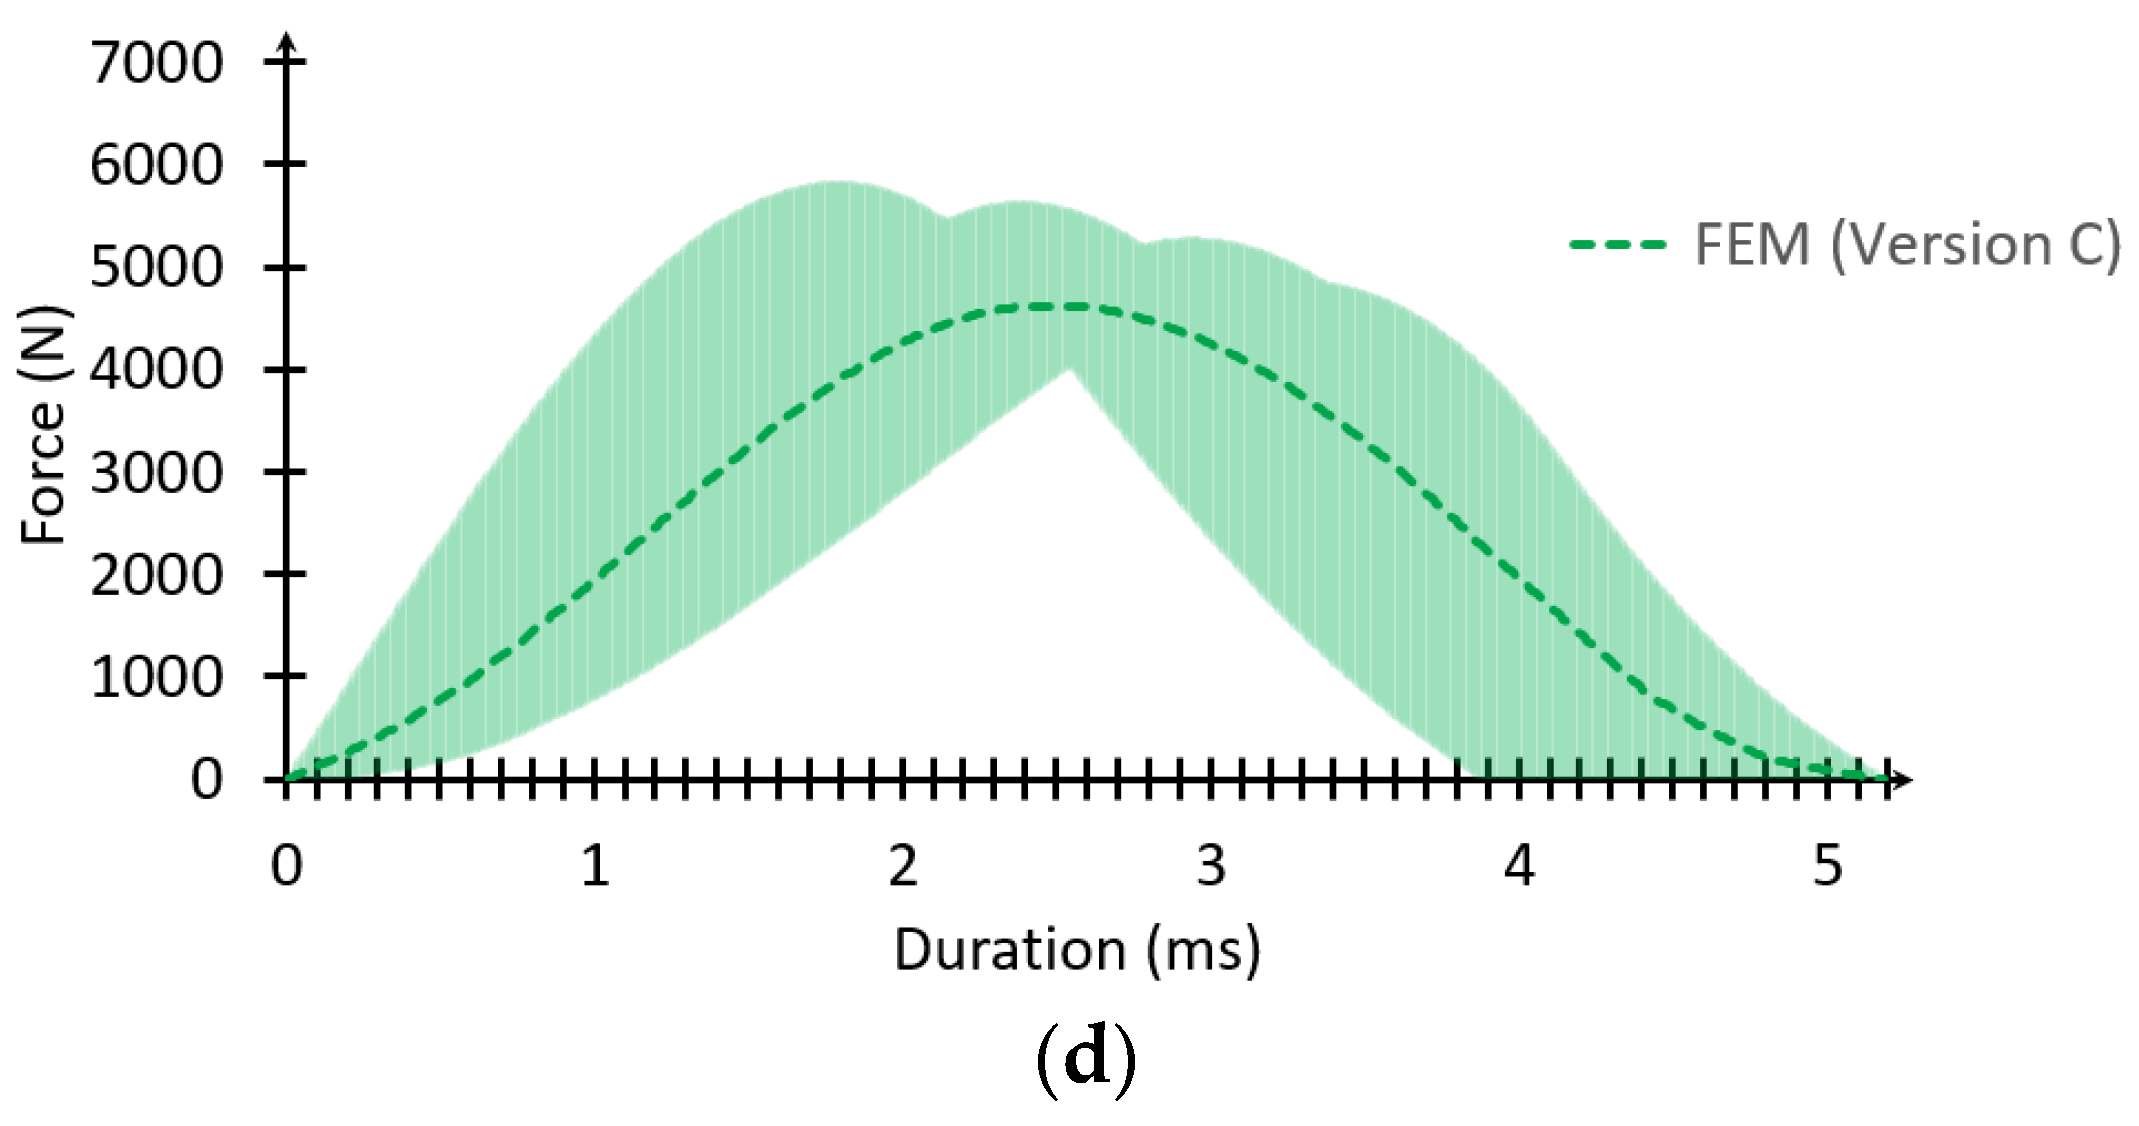
3.1. Results of FEM Drop Tests

In Table 2, a detailed comparison of the simulations is provided, which includes the duration of the collision, the maximum force exerted, and the average forces encountered. These data support the significant impact that soft layering has on modifying the dynamics of collision.
In Figure 4, the graphical representation of the simulation data shows the dynamics of various simulated collisions of radiosondes with different material versions. All graphs display an average function with corresponding margins. Fluctuations at the margins, presented as light blue, green, and red, arise from variations caused by the applied impact angles (0°, 2.5°, 5°, 7.5°). The average force of Version A serves as the baseline for comparison. Version B shows an 8% reduction in average force compared to Version A. Version C achieves the lowest average force, which is 10% lower compared to Version A and 2.2% lower than Version B. Using Version A as the baseline, Version B demonstrates a 59.5% increase in average duration. Version C achieves the longest average duration, extending impact time by 71% over Version A and by 7% over Version B. For a clear view, Figure 4a shows all the graphs, while Figure 4b–d shows them separately.
Clear differences can be observed on the graphs between FEM Versions A, B, and C. Soft-layered versions (B and C) show a significant reduction in impact force and increase in collision duration, indicating improved energy absorption. Versions B and C significantly enhance impact mitigation by reducing peak impact forces and prolonging collision duration. Version A, being the stiffest, undergoes minimal deformation, resulting in a shorter impact duration and higher peak forces. Version B, having a more flexible outer shell, deforms to a greater extent, which helps absorbing impact energy more effectively by extending collision duration under its deformation. Version C, the most deformable, exhibits the highest structural flexibility, allowing for maximum energy dissipation through deformation
The progression from the Version A to the softer Versions B and C indicates a possible shift towards denser but softer materials which can reduce the force of impact and also modulate the collision duration better to enhance overall shock absorption. Version C, with its lowest impact force and longest duration, could be particularly beneficial in scenarios where the mitigation of impact shock is crucial.
FEM simulations showed that Version A radiosonde’s body parts structure slightly deformed and partially separated in some places after the impact. It was not analyzed as it was not an aspect of this research. Version B and Version C radiosonde’s body parts were also structurally deformed and partially separated in some places; however, they were held together by the soft outer shell. The soft shell’s bottom edge deformed from basic size to a maximum and back to the original size during collision time. These described separations and deformations can be observed in Figure 4.
Table 3 shows the deformed size of the soft-shelled versions. Since Version A does not have any additional soft shell, it is not listed in Table 3.
These data also suggest that denser but softer materials can better reduce the force of impact.

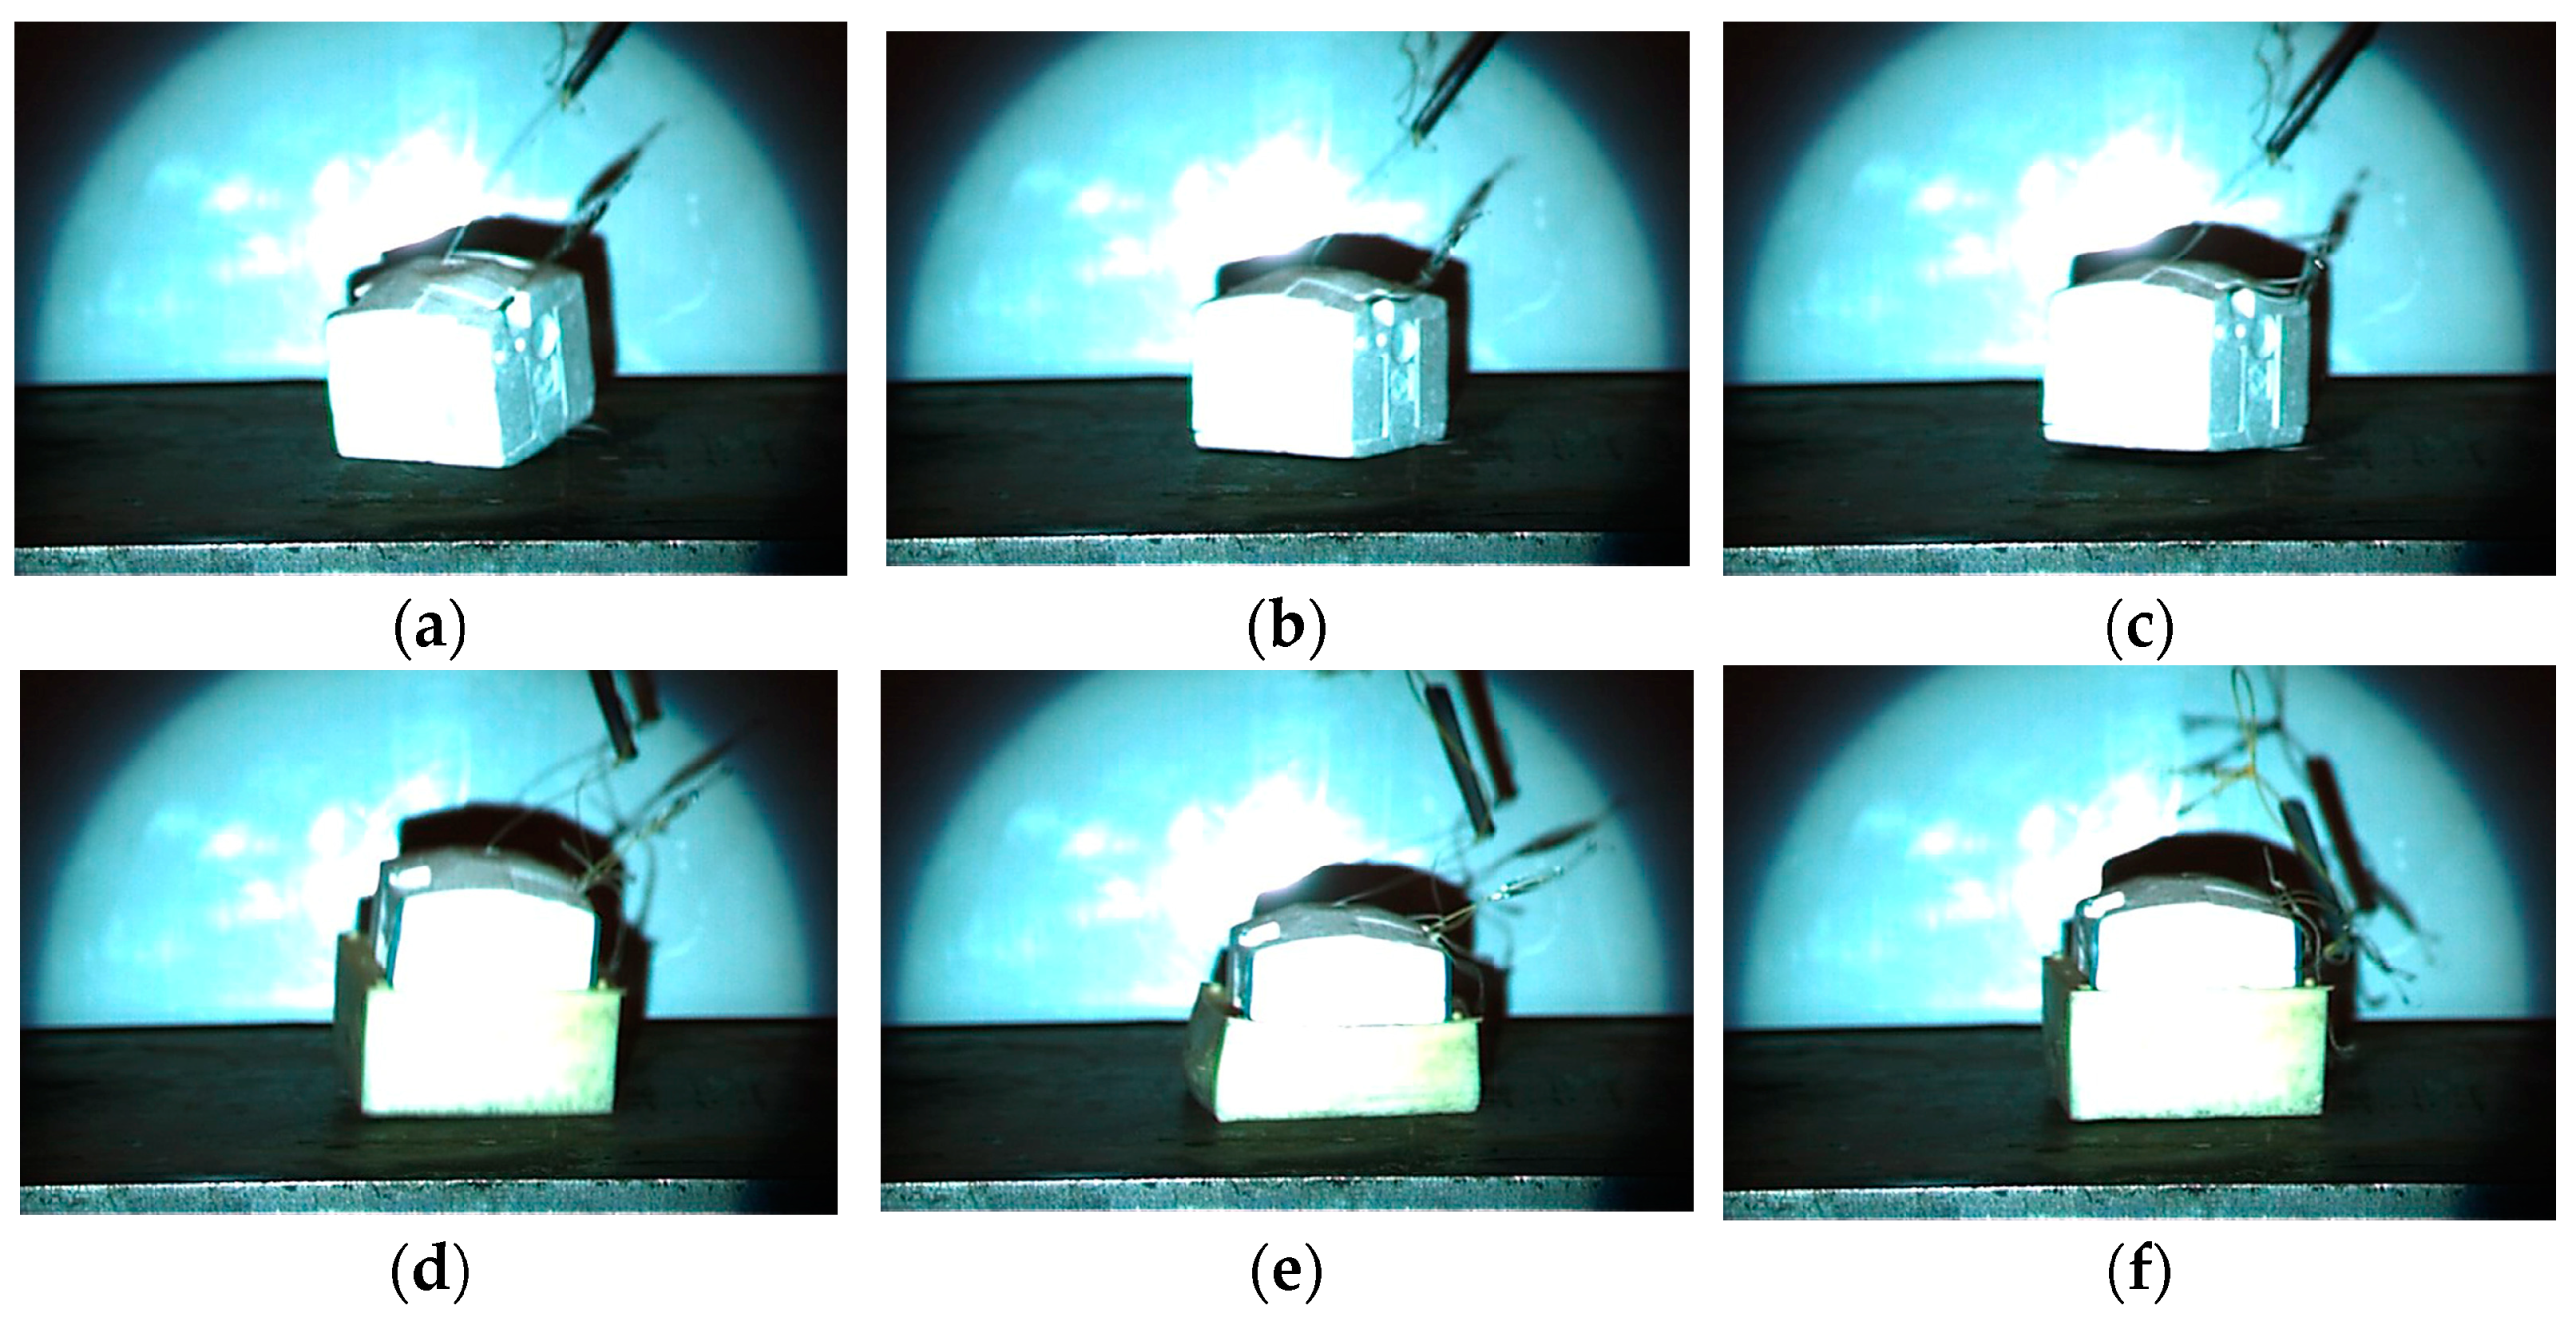
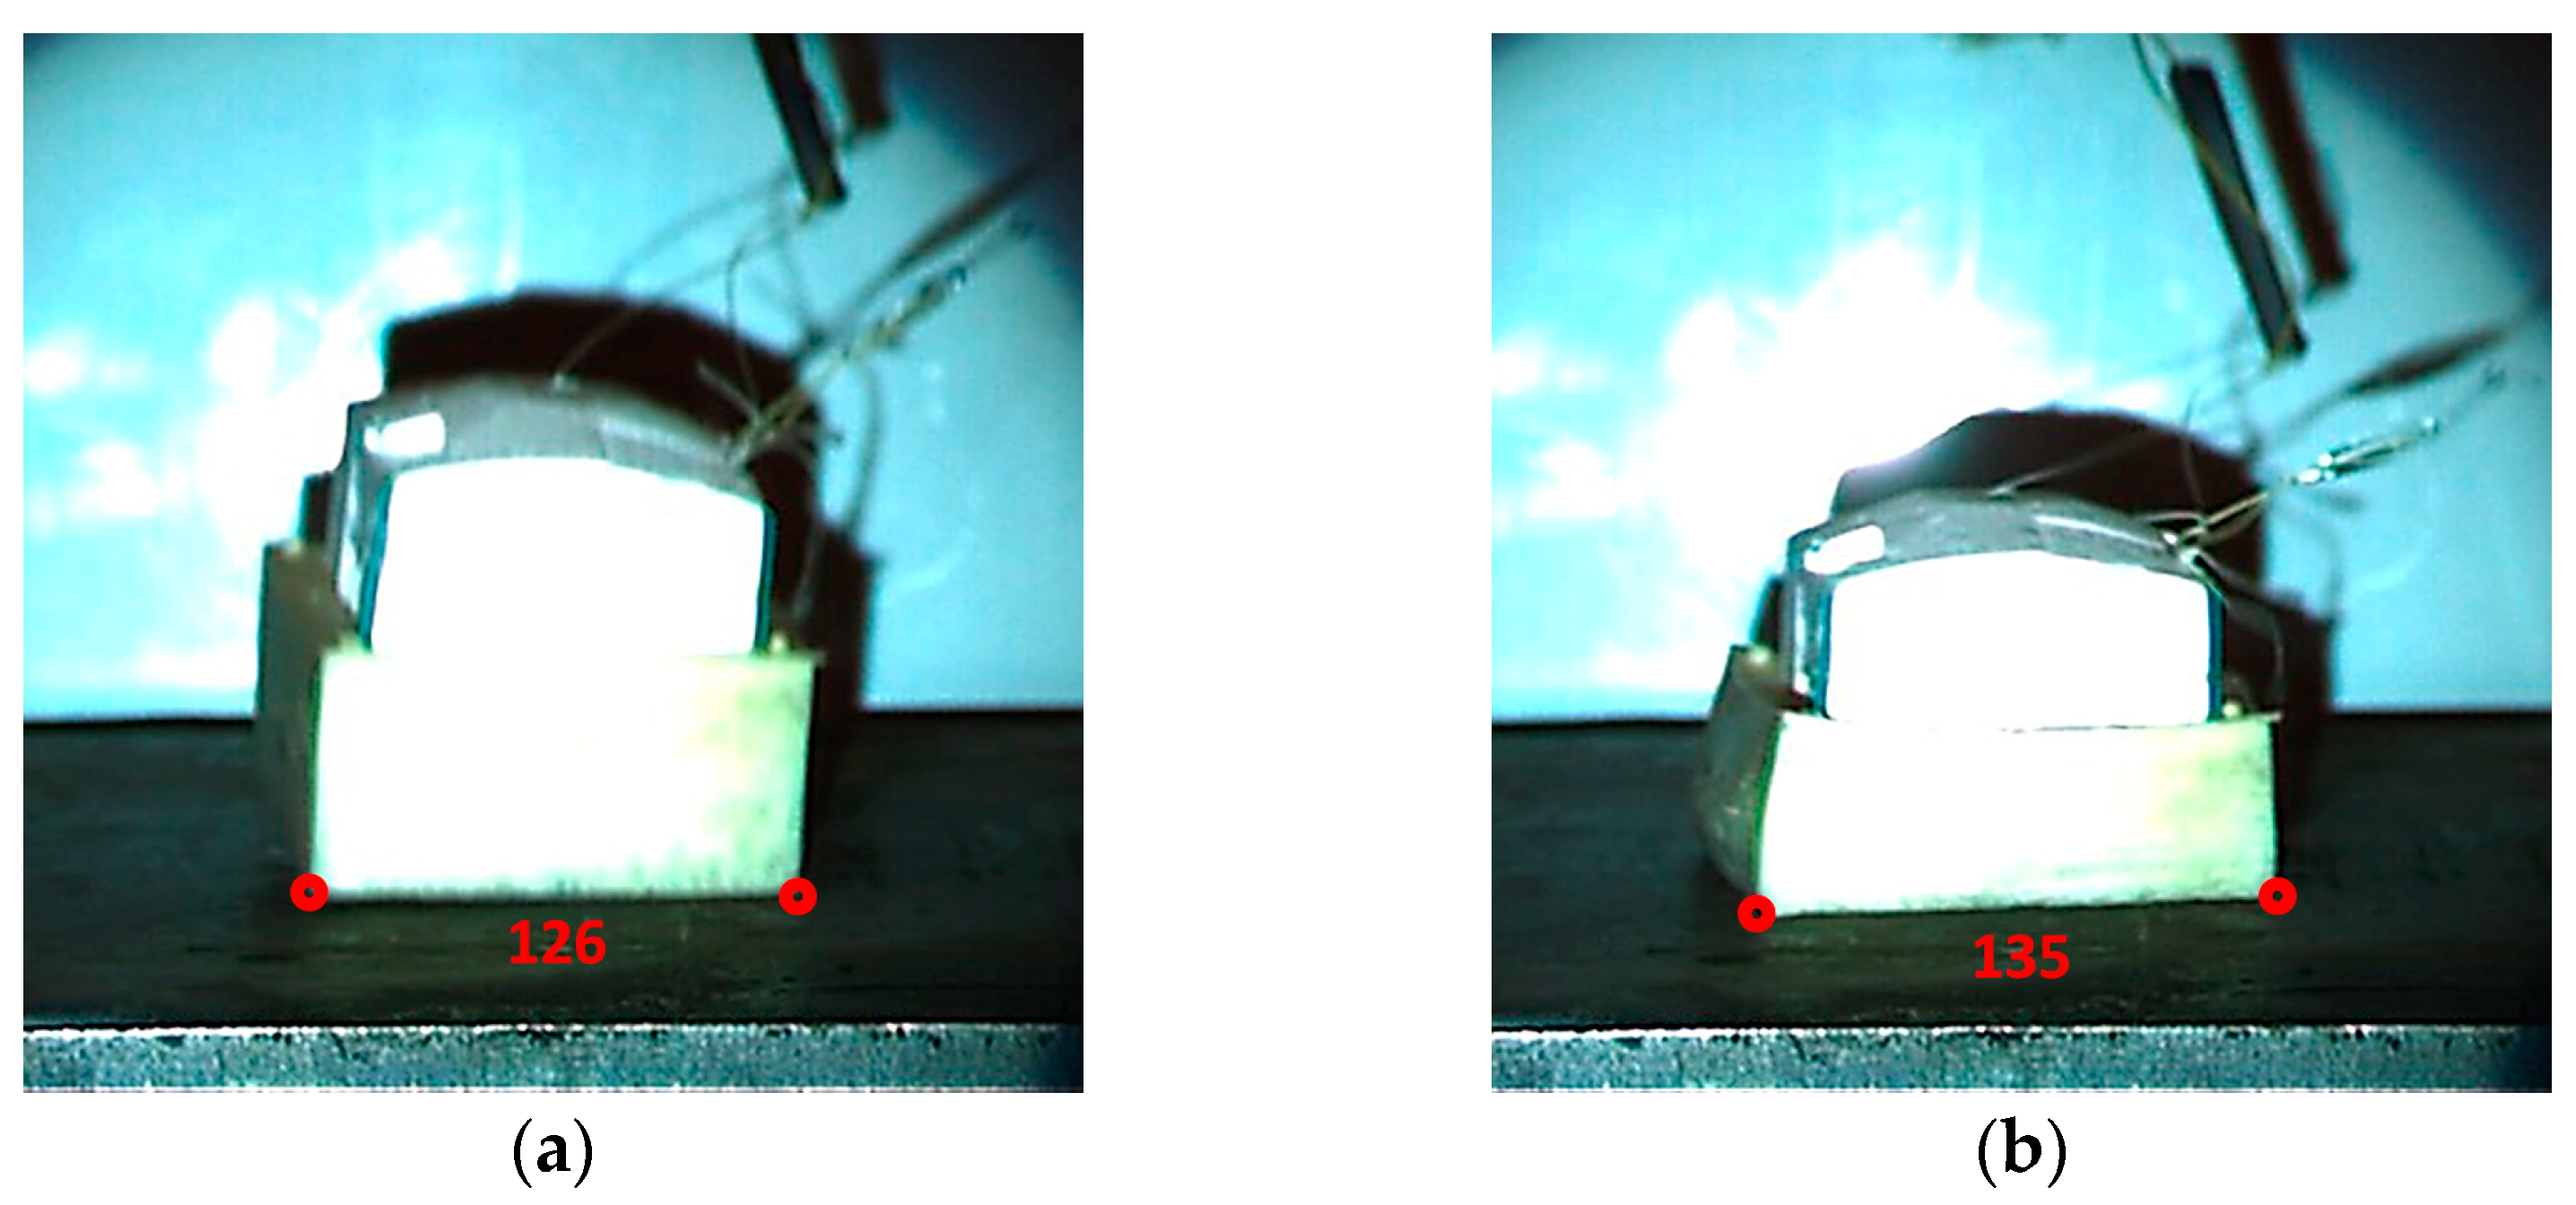
3.2. Results of the Experimental Drop Tests

Table 4 presents the processed data from the drop tests. In these experimental drop tests, Versions A and B were used. Analysis of the average maximal forces indicated that a soft-shelled radiosonde, which is on average 23 g heavier, exerts 5% less average collision force compared to the normal version. Besides a lower impact force, a 37% longer duration of the collision was measured for soft-shelled radiosondes. This implied that the softer shell enhanced its protective efficiency and ultimately led to reduced potential damage compared to the more rigid normal version. The longer impact duration indicated that energy was absorbed over an extended period, which could help in minimizing the peak stress experienced during impact. This can be advantageous in minimizing potential damage or stress to the instrument or its surroundings.
Figure 5 displays two force–time graphs representing the collision dynamics. The dashed blue line represents a normal M10 drop test, while the red line represents a drop test where the radiosonde is equipped with a PUR foam layer (Version B type). Analysis of these graphs shows that the initial contact phase is slightly longer for the soft PUR foam-layered radiosonde.
In contrast, during the collision of the standard radiosonde, the impact force graph spikes sharply upwards, illustrating the low ability of the structure to translate and absorb energy during the critical first phase of the collision. This distinction highlights the enhanced impact mitigation provided by the soft PUR foam layer.
By analyzing the frames, captured by a high-speed camera, it can be stated that all phases of the collisions can be distinctly observed and accurately categorized. Figure 6a illustrates the initial contact of a normal radiosonde with the target plate, marking the beginning of the impact sequence. Figure 6b captures the moment of full contact, displaying the maximum deformation exerted on the radiosonde. Figure 6c shows the moment when the radiosonde left the target plate, indicating the resilience of the material. In contrast, Figure 6d displays the first contact of a soft PUR foam-layered radiosonde with the target, while Figure 6e shows it achieving full contact with the target surface, providing a clear visual of the impact absorption process. Finally, Figure 6f shows the moment when the soft-layered radiosonde bounced back from the target plate, completing the sequence of collision phases.
Deformations of the soft shells were measured by analyzing the difference in the coordinates of given points of the frames. Figure 7 shows an example for the deformation of the soft shell.
The analysis of high-speed camera footage and FEM simulations provide complementary insights, allowing for a detailed comparison of theoretical predictions against experimental test outcomes. Deformation of the Version B radiosonde, obtained from experimental tests and FEM simulations, is compared in Table 5. As can be seen, the experimentally measured average deformation is only 2% below the FEM-simulated average deformation, which underlines the validity of the FEM model.

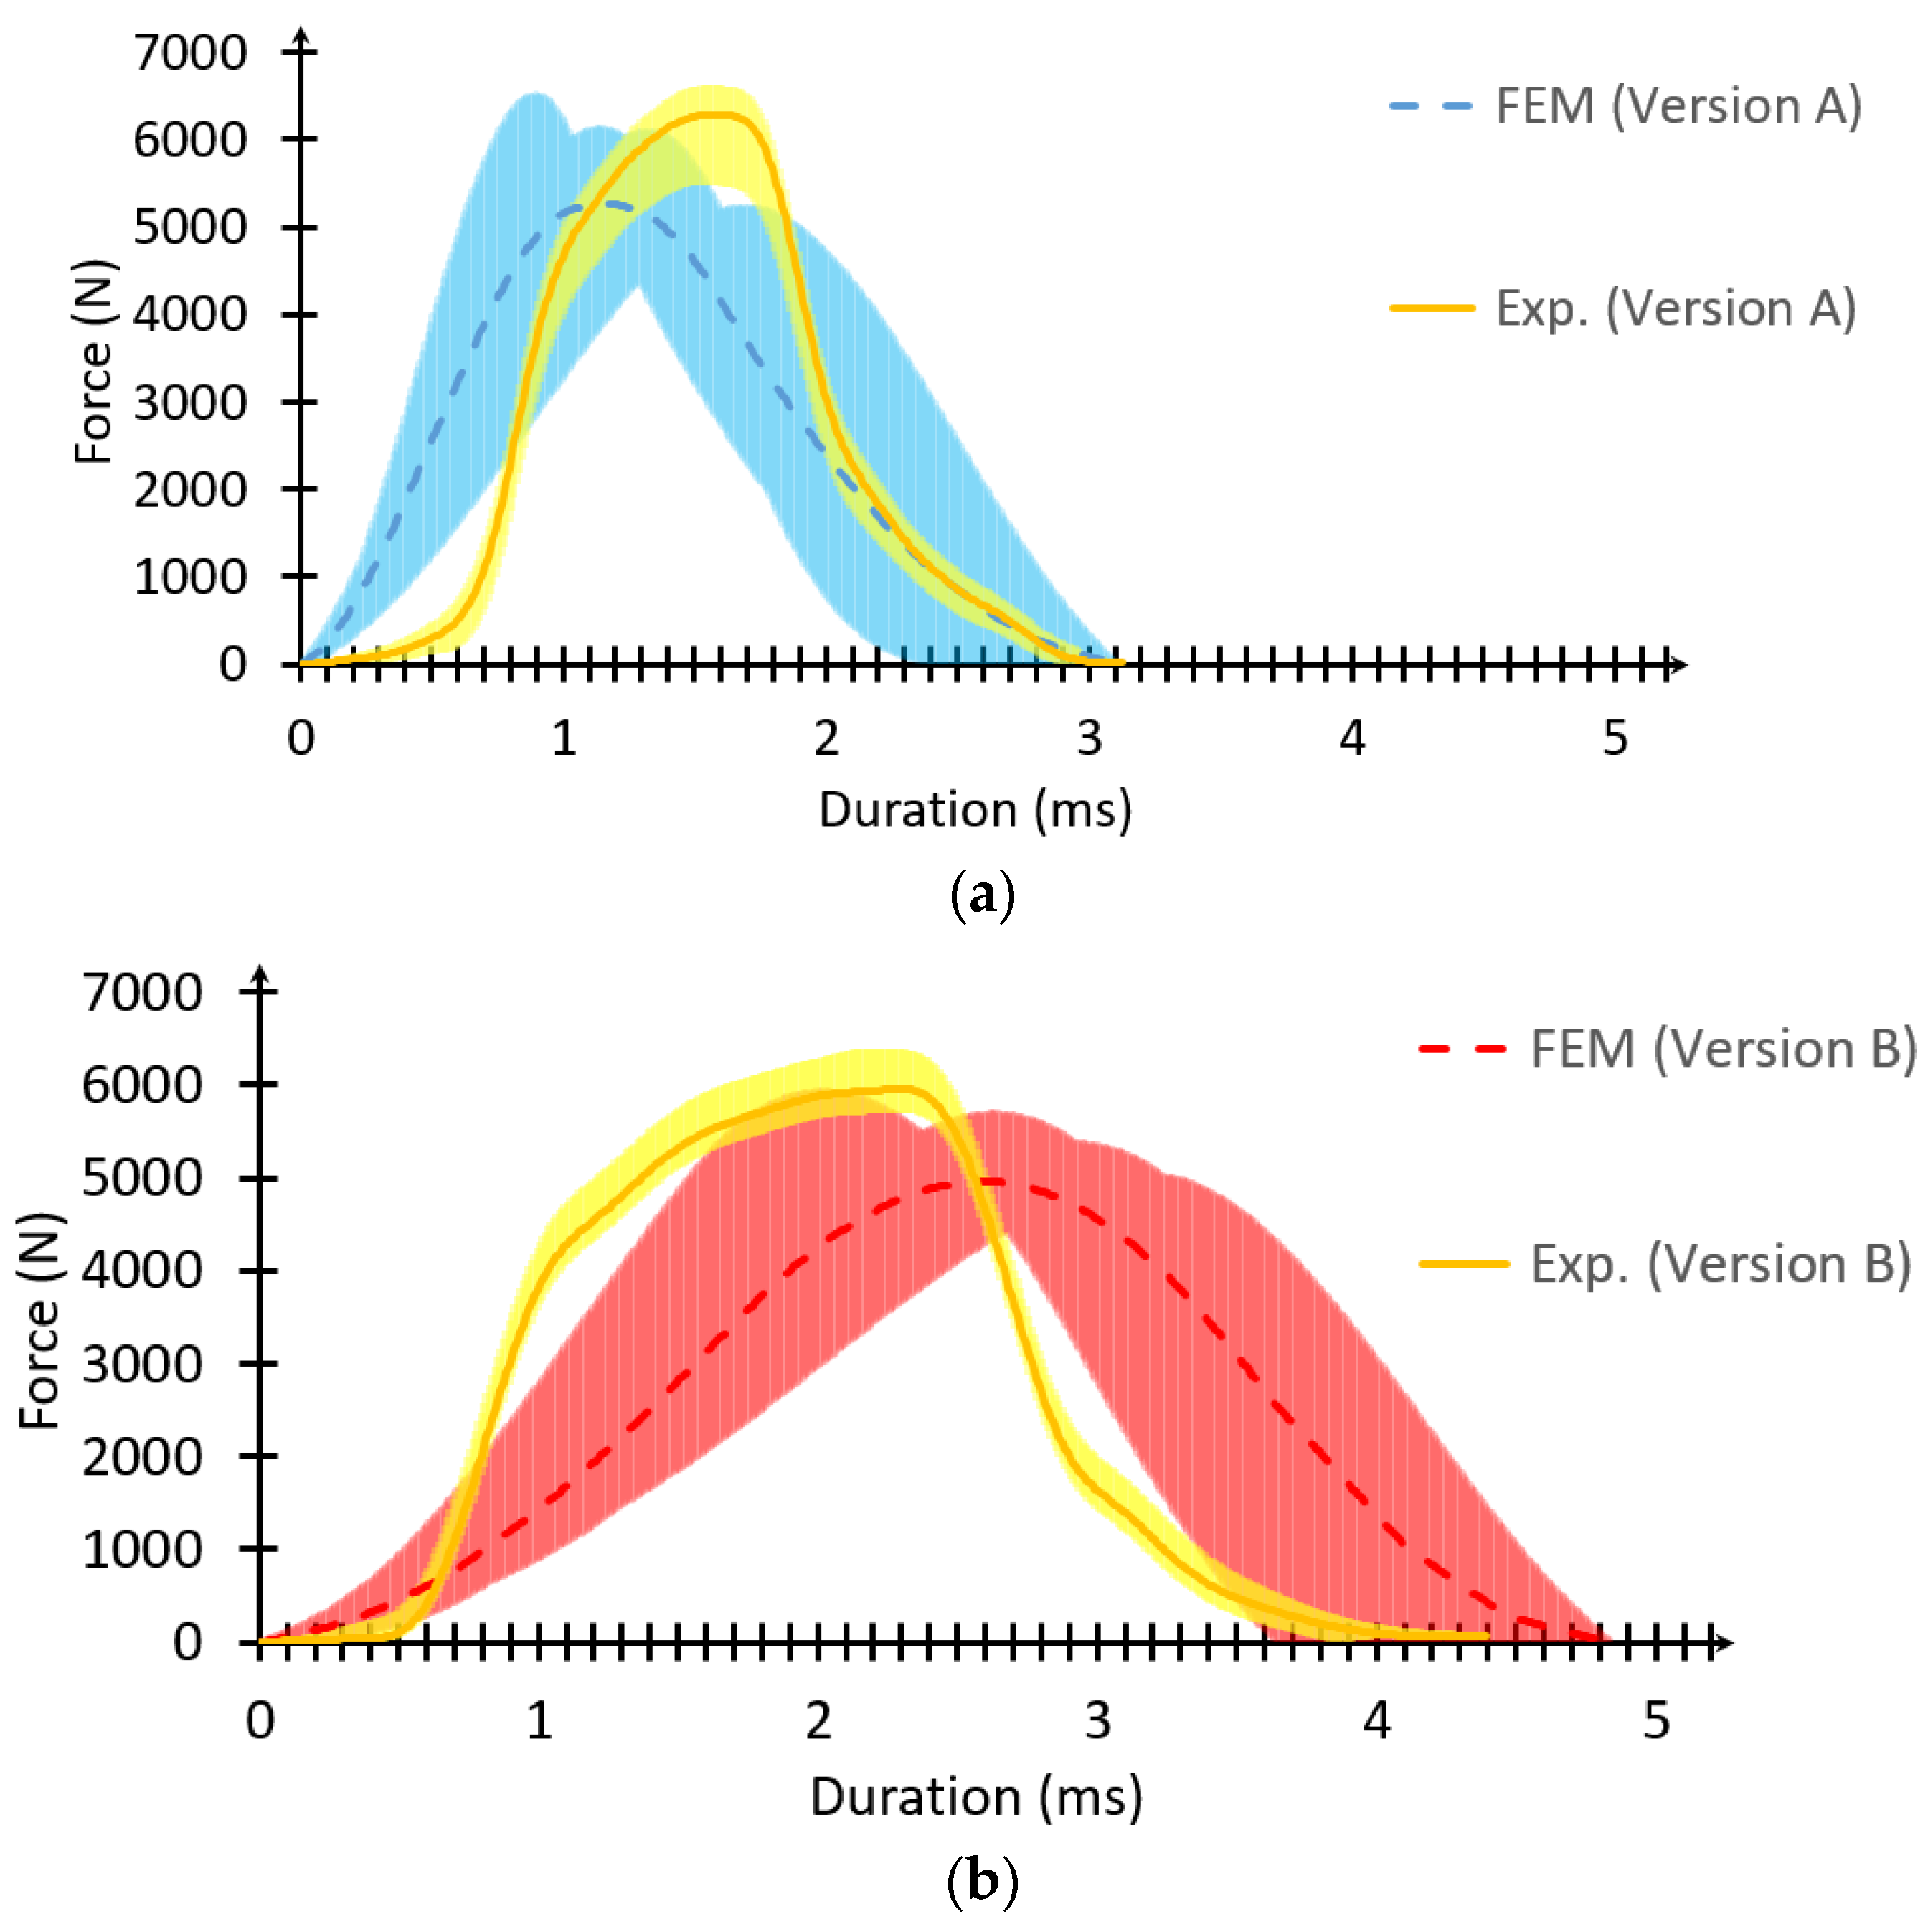
3.3. Comparison of FEM Results to Experimental Drop Tests

Numerical and experimental data, shown in Table 2 and Table 4, can be compared. It must be stated that the collision angle has not been set in the experiments; therefore, experimental values are compared to the averaged values of the FEM calculations.
When Version A is considered, the FEM model slightly underestimates both the peak force by 4% and the collision time by 11% compared to the experimental value.
As for Version B, the FEM results shows similar patterns with slightly different margins. The numerical average peak force is underestimated by 7% compared to the experimental average results, while the duration prediction aligns well with only a 3.3% overestimation. These results indicate that FEM achieves a fair quality of validity in capturing duration dynamics across both versions, demonstrating reliable alignment with experimental measurements.
Besides the tables, Figure 2, Figure 6 and Figure 7 provide the possibility of comparison of FEM simulations and experimental results for radiosonde impacts.
Figure 2 shows FEM=simulated collisions for Versions A, B, and C, illustrating key phases such as pre-impact positioning, maximum deformation, and bounce back. Simulations also revealed smooth and controlled deformation patterns, with Versions B and C showing significant outer-layer compression. In contrast, Version A, without having a soft shell, exhibited minimal deformation but nonetheless higher peak force spikes in its trend.
Figure 6 captures real-world drop tests using high-speed video, displaying similar impact phases for normal and soft-shelled radiosondes.
The results align closely with FEM predictions, particularly in the deformation behavior of soft-shelled radiosondes. Nonetheless, slight deviations in timing, peak force, and angular impact irregularities are observed, reflecting the inherent variability of real-world conditions.
Figure 7 shows the deformation of soft-shelled radiosondes, presenting close-up images before impact and at maximum compression. The experimental deformation patterns align well with FEM predictions, with a margin of error of 2%. Minor discrepancies arise from material properties and environmental dynamics, such as uneven compression or angular impact. Together, these figures validated the FEM model as a reliable predictor of radiosonde impact behavior, particularly for energy absorption and deformation patterns.
Figure 8a provides an overview of the graphs of FEM Version A and the experimental Version A. The graphs demonstrate a high degree of accuracy when FEM results are compared to the experimental ones. Peak forces are similar since only 4% higher experimental peak force was measured compared to the FEM results. With regard to the timeline of the force trend, 0.8 ms delay was observable between the numerical and experimental peak forces. The trend of the force, in both cases, was similar. These results indicated that the simulation effectively captured the behavior of the stiffer version, with minimal deviations in both magnitude and duration.
Similarly, a comparison of numerical and experimental results can be seen in Figure 8b. Peak forces are analogous since only 8% higher experimental peak force was measured compared to the FEM results. With regard to the timeline of the force trend, 1.2 ms delay was observable between the numerical and experimental peak forces.
The trend of the force, in both cases, was similar. Based on the obtained results, the dynamics of the collision could be also well described with regard to magnitude and duration.

3.4. Limitations of This Study

It is crucial to note that during the drop tests, slight variations in the trajectories of the dropped radiosondes were observed. These discrepancies are likely attributed to the manner in which the gripper mechanism released the handle of the radiosonde’s cord. Additionally, the analysis of high-speed video footage showed the radiosondes making contact with the target surface with their faces tilted up to approximately 7°. In experimental conditions, impacts occurring at an angle can result in the generation of oblique force components, which can significantly affect the outcome of such events. By doing so, a more comprehensive understanding of the varied potential outcomes could be achieved, providing valuable insights into the dynamics of angled impacts and enhancing the predictive validity of the simulations.

4. Conclusions

This research successfully integrated PUR foam layers on radiosondes, enhancing their impact behavior. A Finite Element Method (FEM) model was developed to simulate radiosonde impacts (with and without a protective PUR layer) under various drop test conditions.
FEM simulations and experimental drop tests confirmed that reduced impact forces and prolonged impact duration can be achieved in case of radiosondes with protective PUR layers. In the simulations, Version A, which had no protective outer layer, served as a reference model. Compared to Version A, Version B, featuring a PUR foam layer, demonstrated lower impact forces and increased duration, indicating improved energy absorption. Version C further enhanced these effects, achieving the lowest impact force and the longest duration.
Experimental drop tests supported these findings, showing that the Version B radiosonde reduced impact force and extended collision duration compared to the Version A radiosonde. These results highlight the potential of soft-shelled structures to enhance impact protection, providing a more effective approach for minimizing damage.
Overall, the study confirmed that this FEM model is a reliable tool for predicting radiosonde impact behavior. In addition, the PUR foam layer significantly improved structural integrity and safety, offering a practical and effective solution for increasing radiosonde durability. These insights serve as a basis for further design improvements, particularly in material selection and structural modifications aimed at enhancing radiosonde reliability in operational environments.

Author Contributions

Conceptualization, N.H. and J.J.; methodology, N.H.; software, N.H. and J.J.; validation, N.H. and J.J.; formal analysis, N.H. and J.J.; investigation, N.H.; resources, N.H.; data curation, N.H.; writing—original draft preparation, N.H.; writing—review and editing, G.F., N.H. and J.J.; visualization, N.H. and J.J.; supervision, J.J. and G.F.; project administration, N.H. and J.J.; funding acquisition, N.H. All authors have read and agreed to the published version of the manuscript.

Funding

This research received no external funding.

Institutional Review Board Statement

Not applicable.

Informed Consent Statement

Not applicable.

Data Availability Statement

The original contributions presented in this study are included in the article. Further inquiries can be directed to the corresponding authors.

Conflicts of Interest

The authors declare no conflicts of interest.

References

  1. European Commission. Commission Implementing Regulation (EU) No 923/2012; European Union: Brussels, Belgium, 2012. [Google Scholar]
  2. Dabberdt, W.F.; Turtiainen, H. OBSERVATIONS PLATFORMS|Radiosondes. In Encyclopedia of Atmospheric Sciences, 2nd ed.; North, G.R., Pyle, J., Zhang, F., Eds.; Academic Press: Oxford, UK, 2015; pp. 273–284. ISBN 978-0-12-382225-3. [Google Scholar] [CrossRef]
  3. Mills, N.J. Chapter 12—Product Packaging Case Study. In Polymer Foams Handbook; Mills, N.J., Ed.; Butterworth-Heinemann: Oxford, UK, 2007; pp. 281–306. ISBN 978-0-7506-8069-1. [Google Scholar] [CrossRef]
  4. Bhagavathula, K.B.; Meredith, C.S.; Ouellet, S.; Romanyk, D.L.; Hogan, J.D. Density, Strain Rate and Strain Effects on Mechanical Property Evolution in Polymeric Foams. Int. J. Impact Eng. 2022, 161, 104100. [Google Scholar] [CrossRef]
  5. Nie, Z.; Lin, Y.; Tong, Q. Modeling Structures of Open Cell Foams. Comput. Mater. Sci. 2017, 131, 160–169. [Google Scholar] [CrossRef]
  6. Do, S.; Huynh, N.U.; Reed, N.; Mohammad Shaik, A.; Nacy, S.; Youssef, G. Partially-Perforated Self-Reinforced Polyurea Foams. Appl. Sci. 2020, 10, 5869. [Google Scholar] [CrossRef]
  7. Raut, N.P.; Kolekar, A.B.; Gombi, S.L. Methods of Damage Detection on Composites under Low Velocity Impact: Review. Mater. Today Proc. 2020, 27, 2823–2827. [Google Scholar] [CrossRef]
  8. Gara, N.; Ramachandran, V.; Rengaswamy, J. Analytical and FEM Analyses of High-Speed Impact Behaviour of Al 2024 Alloy. Aerospace 2021, 8, 281. [Google Scholar] [CrossRef]
  9. Zochowski, P.; Bajkowski, M.; Grygoruk, R.; Magier, M.; Burian, W.; Pyka, D.; Bocian, M.; Jamroziak, K. Comparison of Numerical Simulation Techniques of Ballistic Ceramics under Projectile Impact Conditions. Materials 2022, 15, 18. [Google Scholar] [CrossRef] [PubMed]
  10. Yan, L.; Liu, C.; Zhu, X.; Zhou, D.; Lv, X.; Kuang, X. Translational Medical Bioengineering Research of Traumatic Brain Injury among Chinese and American Pedestrians Caused by Vehicle Collision Based on Human Body Finite Element Modeling. Front. Neurol. 2024, 14, 1296902. [Google Scholar] [CrossRef] [PubMed]
  11. Wdowicz, D.; Ptak, M. Numerical Approaches to Pedestrian Impact Simulation with Human Body Models: A Review. Arch. Comput. Methods Eng. 2023, 30, 4687–4709. [Google Scholar] [CrossRef]
  12. Aleksandrowicz, P. Modeling Head-On Collisions: The Problem of Identifying Collision Parameters. Appl. Sci. 2020, 10, 6212. [Google Scholar] [CrossRef]
  13. Porkolab, L.; Lakatos, I. Possibilities for Further Development of the Driver’s Seat in the Case of a Non-Conventional Seating Positions. Heliyon 2024, 10, e28909. [Google Scholar] [CrossRef] [PubMed]
  14. Yousefi, S.; Farsi, H.; Kheiralipour, K. Drop Test of Pear Fruit: Experimental Measurement and Finite Element Modelling. Biosyst. Eng. 2016, 147, 17–25. [Google Scholar] [CrossRef]
  15. Zhu, Y.; Zhu, L.; Guo, W.; Han, Z.; Wang, R.; Zhang, W.; Yuan, Y.; Gao, J.; Liu, S. Multiscale Static Compressive Damage Characteristics of Kiwifruit Based on the Finite Element Method. Foods 2024, 13, 785. [Google Scholar] [CrossRef] [PubMed]
  16. Li, Z.; He, Z.; Hao, W.; Li, K.; Ding, X.; Cui, Y. Kiwifruit Harvesting Damage Analysis and Verification. Processes 2023, 11, 598. [Google Scholar] [CrossRef]
  17. An, X.; Zhu, P.; Li, Z.; Fadiji, T.; Wani, A.A. Effect of Expanded Polyethylene (EPE) Foam Packing Net Design on the Mechanical Damage Resistance of Strawberry Fruit during Transportation. Food Packag. Shelf Life 2023, 40, 101193. [Google Scholar] [CrossRef]
  18. Zhang, Y.; Zhou, Y. Investigation of Bird-Strike Resistance of Composite Sandwich Curved Plates with Lattice/Foam Cores. Thin-Walled Struct. 2023, 182, 110203. [Google Scholar] [CrossRef]
  19. Wang, F.; Lv, C.; Pan, Y.; Zhou, L.; Zhao, B. Efficient Non-Destructive Detection for External Defects of Kiwifruit. Appl. Sci. 2023, 13, 11971. [Google Scholar] [CrossRef]
  20. Hegyi, N.; Jósvai, J. Material Analysis For Light Unmanned Free Balloon Payload’s Outer Shell. In Proceedings of the 12th IEEE International Conference on Cognitive Infocommunications (2021), Online, 23–25 September 2021; Nikodem, J., Klempous, R., Eds.; IEEE: Piscataway, NJ, USA, 2021; pp. 903–908. [Google Scholar]
  21. Savitzky, A.; Golay, M.J.E. Smoothing and Differentiation of Data by Simplified Least Squares Procedures. Anal. Chem. 1964, 36, 1627–1639. [Google Scholar] [CrossRef]
Figure 1. The soft-shelled 3D model with numbered outside parts: (1) fixed force sensors, (2) soft shell, (3) soft shell (a); 3D model of a soft-shelled radiosonde: (3) soft shell, (4) EPS body part, (5) battery pack, (6) EPS body part, (7) inner (fiberglass) electronics, (8) meteorological sensor, (9) EPS body part, (10) EPS body part (b); normal radiosonde and target plate mesh (c); soft-shelled radiosonde and target plate mesh (d).
Applmech 06 00019 g001
Figure 2. Version A: parallel face-to-face impact (a); Version A: maximal contact during collision (b); Version A: bounce back (c); Version B: before parallel face-to-face impact (d); Version B: maximal deformation during collision (e); Version B: bounce back (f).
Applmech 06 00019 g002
Figure 3. Experimental setup of soft-shelled drop test.
Applmech 06 00019 g003
Figure 4. (a) FEM drop tests. Version A (average function denoted by the dashed blue line, variations caused by impact angles denoted by the light blue stripe). Version B (average function denoted by the red line, variations caused by impact angles denoted by the light red stripe). Version C (average function denoted by the dashed green line, variations caused by impact angles denoted by the light green stripe). (b) FEM drop test. Version A (average function denoted by the dashed blue line, variations caused by impact angles denoted by the light blue stripe). (c) FEM drop test. Version B (average function denoted by the dashed red line, variations caused by impact angles denoted by the light red stripe). (d) FEM drop test. Version C (average function denoted by the dashed green line, variations caused by impact angles denoted by the light green stripe).
Applmech 06 00019 g004aApplmech 06 00019 g004b
Figure 5. Experimental drop tests.
Applmech 06 00019 g005
Figure 6. Radiosonde (Version A): first contact with target (a); maximal contact and deformation (b); bounce back (c); Radiosonde (Version B): first contact with target (d); maximal contact and deformation (e); bounce back (f).
Applmech 06 00019 g006
Figure 7. Radiosonde (Version B): before deformation (a); maximal deformation (b).
Applmech 06 00019 g007
Figure 8. The first graph is the FEM Version A drop test mean function; the second graph is experimental Version A drop test mean function (a); The first graph is the FEM Version B drop test mean function, the second graph is experimental Version B drop test mean function (b).
Applmech 06 00019 g008
Table 1. Main material properties for the models.
Materialρ
(kg/m3)
E
(Pa)
ν
(-)
K
(Pa)
G
(Pa)
Constitutive Equation
EPS481.3767 × 1070.06215.2400 × 1066.481 × 106Crushable Foam
PUR foam 1483.4500 × 1050.04001.2500 × 1051.659 × 105Mooney–Rivlin two-parameter model
PUR foam 2963.3465 × 1050.04001.2125 × 1051.6089 × 105Mooney–Rivlin two-parameter model
C4578002.1000 × 10110.31251.8670 × 10118.0000 × 1010Linear Elastic Model
PCB laminate, Epoxy/Glass fiber, FR-5.010453.5500 × 1080.41446.9120 × 1081.2549 × 108Linear Elastic Model
Table 2. FEM drop test force and duration measurements.
TestPeak
Force (N)
Average
±SD (N)
Duration
(ms)
Average
±SD (ms)
Radiosonde
0° tilted (Version A)
6121.475988.61 ± 540.032.452.68 ± 0.32
Radiosonde
2.5° tilted (Version A)
6508.562.41
Radiosonde
5° tilted (Version A)
6094.542.77
Radiosonde
7.5° tilted (Version A)
5229.873.10
Radiosonde
0° tilted (Version B)
5928.165501.68 ± 392.433.654.28 ± 0.52
Radiosonde
2.5° tilted (Version B)
5687.114.11
Radiosonde
5° tilted (Version B)
5366.804.49
Radiosonde
7.5° tilted (Version B)
5024.664.86
Radiosonde
0° tilted (Version C)
5803.695378.03 ± 421.943.894.58 ± 0.55
Radiosonde
2.5° tilted (Version C)
5608.854.43
Radiosonde
5° tilted (Version C)
5254.924.82
Radiosonde
7.5° tilted (Version C)
4844.675.18
Table 3. Maximal deformations of soft-layered models during FEM drop test measurements.
TestMaximal Size at
Deformation
(mm)
Average
±SD (mm)
Radiosonde (Version B)134.21140.77 ± 5.93
Radiosonde 2.5° tilted (Version B)137.91
Radiosonde 5° tilted (Version B)143.23
Radiosonde 7.5° tilted (Version B)147.71
Radiosonde (Version C)133.84140.86 ± 6.13
Radiosonde 2.5° tilted (Version C)138.31
Radiosonde 5° tilted (Version C)143.27
Radiosonde 7.5° tilted (Version C)148.02
Table 4. Comparison between normal and soft-layered radiosonde drop test measurements.
TestPeak
Force (N)
Average
±SD (N)
Duration
(ms)
Average
±SD (ms)
Radiosonde (Version A)–Exp. 15976.56244.58 ± 484.533.13.02 ± 0.13
Radiosonde (Version A)–Exp. 26628.62.9
Radiosonde (Version A)–Exp. 36492.12.9
Radiosonde (Version A)–Exp. 46607.13.0
Radiosonde (Version A)–Exp. 55518.63.2
Radiosonde (Version B)–Exp. 16390.55928.2 ± 332.843.74.13 ± 0.26
Radiosonde (Version B)–Exp. 25981.44.2
Radiosonde (Version B)–Exp. 35685.54.4
Radiosonde (Version B)–Exp. 46047.24.2
Radiosonde (Version B)–Exp. 55536.44.2
Table 5. Deformation of soft shell during experimental drop tests.
TestMaximal Size
at Deformation
(mm)
Average
±SD (mm)
Radiosonde (Version B)–Exp. 1135138 ± 3.61
Radiosonde (Version B)–Exp. 2142
Radiosonde (Version B)–Exp. 3137
FEM (Version B)-140.77 ± 5.93
Disclaimer/Publisher’s Note: The statements, opinions and data contained in all publications are solely those of the individual author(s) and contributor(s) and not of MDPI and/or the editor(s). MDPI and/or the editor(s) disclaim responsibility for any injury to people or property resulting from any ideas, methods, instructions or products referred to in the content.

