1. Introduction
The human heart is a vital organ responsible for maintaining blood circulation throughout the body via a complex network of arteries, veins, and capillaries [
1]. This circulation ensures the delivery of oxygen and nutrients to tissues while removing metabolic waste [
2]. Given its essential role, any heart malfunction can lead to serious health consequences. Despite continuous advances in medicine, the heart remains vulnerable to a wide range of diseases and conditions that can compromise its function [
3].
Cardiovascular diseases, including conditions like coronary artery disease, stroke, and heart failure, are the leading cause of death globally. According to the World Health Organization, CVDs account for approximately 18 million deaths annually, representing nearly 32% of all global deaths [
4]. Among these, coronary artery disease is the most prevalent, making it a major public health challenge due to its widespread impact on morbidity and mortality.
The general problem lies in the silent and progressive nature of cardiovascular diseases. In many cases, symptoms appear only at advanced stages, when therapeutic interventions are less effective [
5]. This delayed manifestation makes early detection particularly difficult, yet it is critical for preventing fatal events. From a clinical standpoint, early identification of individuals at high risk of developing CVDs—or experiencing a recurrence—enables more effective preventive strategies and better management of healthcare resources [
6].
Several well-known risk factors are associated with cardiovascular diseases, including smoking, high blood pressure, high cholesterol levels, obesity, and diabetes [
7]. These factors are routinely monitored in medical practice. However, the challenge lies in integrating and interpreting this complex array of data to make timely and accurate predictions. Traditional diagnostic methods, which often rely on medical imaging, electrocardiography, and laboratory tests, are not always sufficient. They can be limited by subjectivity, variability in clinical interpretation, and time constraints.
With the increasing digitization of healthcare and the rise of connected devices, such as those enabled by the Internet of Things, large volumes of patient data are now generated in real time. This data explosion, while valuable, poses a new challenge: it is no longer feasible for healthcare professionals to manually analyze and synthesize all available information. This has given rise to a pressing question: How can we leverage Artificial Intelligence, and in particular machine learning, to process and interpret complex medical data for more accurate and early prediction of cardiovascular risks? Machine learning offers promising solutions in this context by enabling the identification of hidden patterns and complex associations within large datasets [
8] insights that may not be evident through conventional analysis. Recent advances in ML techniques have made it possible to build predictive models capable of assessing the probability of cardiovascular events in individual patients based on their personal and clinical profiles [
9]. These models can significantly improve clinical decision-making, optimize treatment plans, and support preventive care tailored to each patient [
10]. However, developing robust ML models for medical prediction is not without challenges. The success of any predictive model relies heavily on the quality and structure of the data used. This includes managing missing values, handling imbalanced classes, and selecting the most relevant features. Moreover, due to the heterogeneity of patient populations and the complexity of cardiovascular conditions, there is a need for ensemble methods that combine the strengths of multiple learning algorithms. In this study, we propose a stacking-based ensemble approach that integrates several base learners and a meta-learner to improve the reliability and generalizability of predictions related to cardiovascular disease. Our work specifically addresses the need for accurate, generalizable, and scalable predictive models in the context of cardiovascular risk assessment. By adopting an ensemble stacking framework and incorporating advanced data preprocessing, we aim to overcome limitations of individual models and contribute to the development of intelligent clinical decision support tools.
Numerous studies have harnessed the potential of Artificial Intelligence (AI) to enhance disease prediction in the healthcare domain. These works have led to the development of models capable of anticipating the onset of diseases based on clinical, biological, or sensor-derived data, thereby contributing to earlier, more personalized, and more effective patient management. For example, the electrocardiogram (ECG) is the primary tool for detecting cardiac arrhythmias, where early diagnosis is essential to prevent serious complications. The study [
11] proposes a lightweight deep learning method combining CNN and LSTM to classify eight types of arrhythmias and normal rhythm, without manual feature extraction. ECG signals are preprocessed (resampling, baseline wander removal) and analyzed through an 11-layer network. Data were sourced from the MIT-BIH and AFDB databases. The model achieved an average diagnostic accuracy of 98.24%, making it suitable for integration into wearable medical devices.
Similarly, the diagnosis of colorectal cancer (CRC) remains challenging due to nonspecific symptoms and the low sensitivity of existing biomarkers. The study [
12] developed a model based on biomarkers and age, using data from 489 patients, including 337 with CRC. Logistic Regression Analysis identified six independent risk factors, including CEA and CYFRA 21-1. The model achieved a sensitivity of 90% in the validation cohort and an AUC of 0.872. It proved particularly effective for detecting early-stage CRC (95.45%).
The study [
13] also evaluates the prediction of early-onset xerostomia in 80 patients with head and neck cancers treated with radiotherapy, by combining radiomic features extracted from MRI and CT images with dosimetric and demographic data. Features extracted from T1-weighted MRI images demonstrate better predictive performance than those from T2-weighted images. The Random Tree (RT) and Bayesian Network (BN) classifiers based on T1 images achieve AUCs of 0.90 and 0.84, respectively. Combined (ensemble) models outperform individual classifiers, with AUC values reaching up to 0.97. These results suggest that MRI-based radiomic features can serve as personalized biomarkers for predicting xerostomia.
Extensive research has been conducted to develop medical applications leveraging machine learning techniques for cardiovascular disease (CVD) prediction. In [
14], the authors evaluate the performance of five widely used machine learning classifiers: Support Vector Machine (SVM), K-Nearest Neighbors (K-NN), Logistic Regression (LR), Decision Tree (DT), and Naïve Bayes (NB). The study utilizes a Kaggle dataset for validation, employing multiple performance metrics for comparative analysis. The results indicate that SVM and LR exhibit the highest predictive accuracy, achieving 72.66% and 72.36%, respectively, in diagnosing CVD. In [
15], the authors implement an Artificial Neural Network (ANN) consisting of two hidden layers with a total of 33 neurons. The Rectified Linear Unit (ReLU) activation function is applied to the hidden layers, while the sigmoid function is used in the output layer. Experimental simulations using the Kaggle dataset yield an accuracy of 71.86%, with a precision of 75.20% and a specificity of 78.40%.
Similarly, the research [
16] investigates supervised machine learning algorithms specifically designed for disease prediction. The findings demonstrate that the Decision Tree model outperforms Naïve Bayes, Logistic Regression, Random Forest, SVM, and K-NN, achieving the highest classification accuracy of 73%.
A comparative study in [
17] assesses various supervised learning algorithms applied to a CVD dataset, focusing on a feature selection technique with 12 key attributes. The findings highlight Random Forest as the most effective model, attaining an accuracy of 72.69% across different experimental setups. The study in [
18] explores CVD prediction using seven machine learning algorithms, including Random Forest, Logistic Regression, Decision Tree, Naïve Bayes, K-NN, ANN, and SVM, along with an ontology-based classification model. Evaluation using Accuracy, Precision, Recall, and F-Measure demonstrates that the ontology-based approach achieves the highest accuracy of 75.5%, even without feature selection. Maiga and Hungilo [
19] further analyze ML-based methods for CVD prediction, utilizing Logistic Regression, Random Forest, Gaussian Naïve Bayes, and K-NN on the same Kaggle dataset. The Random Forest model demonstrates the highest performance, achieving 73% accuracy. The study [
20] highlights the significance of machine learning in early cardiovascular disease (CVD) detection. Utilizing hospital data, the proposed CatBoost model achieves 92.3% F1-score and 90.94% accuracy, outperforming existing methods by enhancing classification performance, precision, and clinical efficiency. The paper [
21] emphasizes early heart disease detection using machine learning. Utilizing the IEEE Data Port dataset, which integrates multiple sources, a stacked ensemble classifier (ExtraTrees, Random Forest, XGBoost) is proposed. The model achieves 92.34% accuracy, surpassing existing methods in predictive performance. In [
22], the study proposes the NCDG stacking ensemble model for heart disease prediction, integrating Naive Bayes, CatBoost, and Decision Tree with Gradient Boosting as a meta-learner. Using SMOTE, SHAP, and K-Fold Cross-Validation, it achieved 91% accuracy, outperforming existing models.
The remainder of the paper is organized as follows:
Section 2 details the methodology and explains the adaptive learning approach.
Section 3 presents key findings from our case study, focusing on the proposed model and evaluating its effectiveness. Finally, the paper concludes with a summary and suggestions for future research.
2. Materials and Methods
The prediction of cardiovascular disease using a stacking ensemble learning model follows a structured process to ensure optimal performance. The process starts with data collection, where relevant patient information is gathered to serve as the foundation for analysis. This is followed by data preprocessing, which involves cleaning, transforming, and preparing the dataset for modeling.
Next, the focus shifts to model selection, where individual machine learning algorithms—including Logistic Regression, Random Forest, SVM, KNN, XGBoost, LightGBM, and CatBoost—are evaluated to identify the best-performing model for single-model predictions (Scenario 1).
To ensure robustness and mitigate overfitting, the study then advances to Scenario 2, where a more comprehensive performance evaluation is conducted using cross-validation. This approach provides a deeper insight into each model’s generalization capabilities across different data splits.
Building upon the insights from the first two scenarios, Scenario 3 introduces a stacking ensemble learning strategy. In this setup, the three top-performing models from the previous evaluations are used as base learners. To enhance the predictive performance, two stacking approaches are explored using the same base models but with different meta-models: In the first configuration, Logistic Regression is employed as the meta-learner, while in the second, a Multilayer Perceptron (MLP) is used to capture more complex, nonlinear relationships among the base model predictions.
Finally, the results from all three scenarios are systematically compared to determine the most effective strategy for predicting cardiovascular disease. The proposed stacking models are also benchmarked against standard machine learning models and prior research to assess their real-world applicability and performance.
2.1. Data Collection
The dataset used in this study is the publicly available Kaggle dataset [
23], which is widely used for cardiovascular disease (CVD) prediction based on patient examination results. It consists of 1190 patient records and includes 11 features, such as age, gender, chest pain type, cholesterol levels, and more. The target variable, “HeartDisease,” is coded as 1 for patients diagnosed with cardiovascular disease and 0 for healthy individuals.
This dataset was built by merging five independent heart disease datasets which had previously not been combined. This integration resulted in a dataset that contains 11 common features, making it one of the largest heart disease datasets available for research. The five contributing datasets are as follows: Cleveland (303 observations), Hungarian (294 observations), Switzerland (123 observations), Long Beach VA (200 observations), and Statlog (270 observations). After removing 272 duplicate entries, the final dataset comprises 918 observations. A detailed description of each variable of the Heart Disease Dataset is provided in
Table 1.
The dataset includes 918 patients and contains a variety of clinical and physiological features relevant to the prediction of cardiovascular disease (CVD) as it is described in
Table 2. Patient age ranges from 28 to 77 years, with a mean of 53.51 years (±9.43), and an interquartile range (IQR) of 47 to 60 years, indicating that the population is predominantly composed of middle-aged to older adults. The mean resting systolic blood pressure is 132.40 mmHg (±18.51), with values extending from 0 to 200 mmHg. Cholesterol levels exhibit a wide range (0 to 603 mg/dL), with a mean of 198.80 mg/dL (±109.38) and a median of 223 mg/dL, suggesting that a substantial proportion of the population has elevated cholesterol levels. Fasting blood sugar (FastingBS), a binary variable, has a mean of 0.23, indicating that approximately 23% of patients had fasting blood sugar levels greater than 120 mg/dL. The maximum heart rate achieved (MaxHR) varies between 60 and 202 bpm, with a mean of 136.81 bpm (±25.46) and an IQR from 120 to 156 bpm, suggesting an overall preserved cardiac response during exertion. The variable Oldpeak, representing ST depression induced by exercise, has a mean of 0.89 (±1.07) and ranges from –2.6 to 6.2, displaying a right-skewed distribution with some clinically questionable negative values. Finally, the target variable HeartDisease is binary, with a mean of 0.55, indicating that 55% of the patients were diagnosed with cardiovascular disease. This shows a slight class imbalance in favor of positive cases.
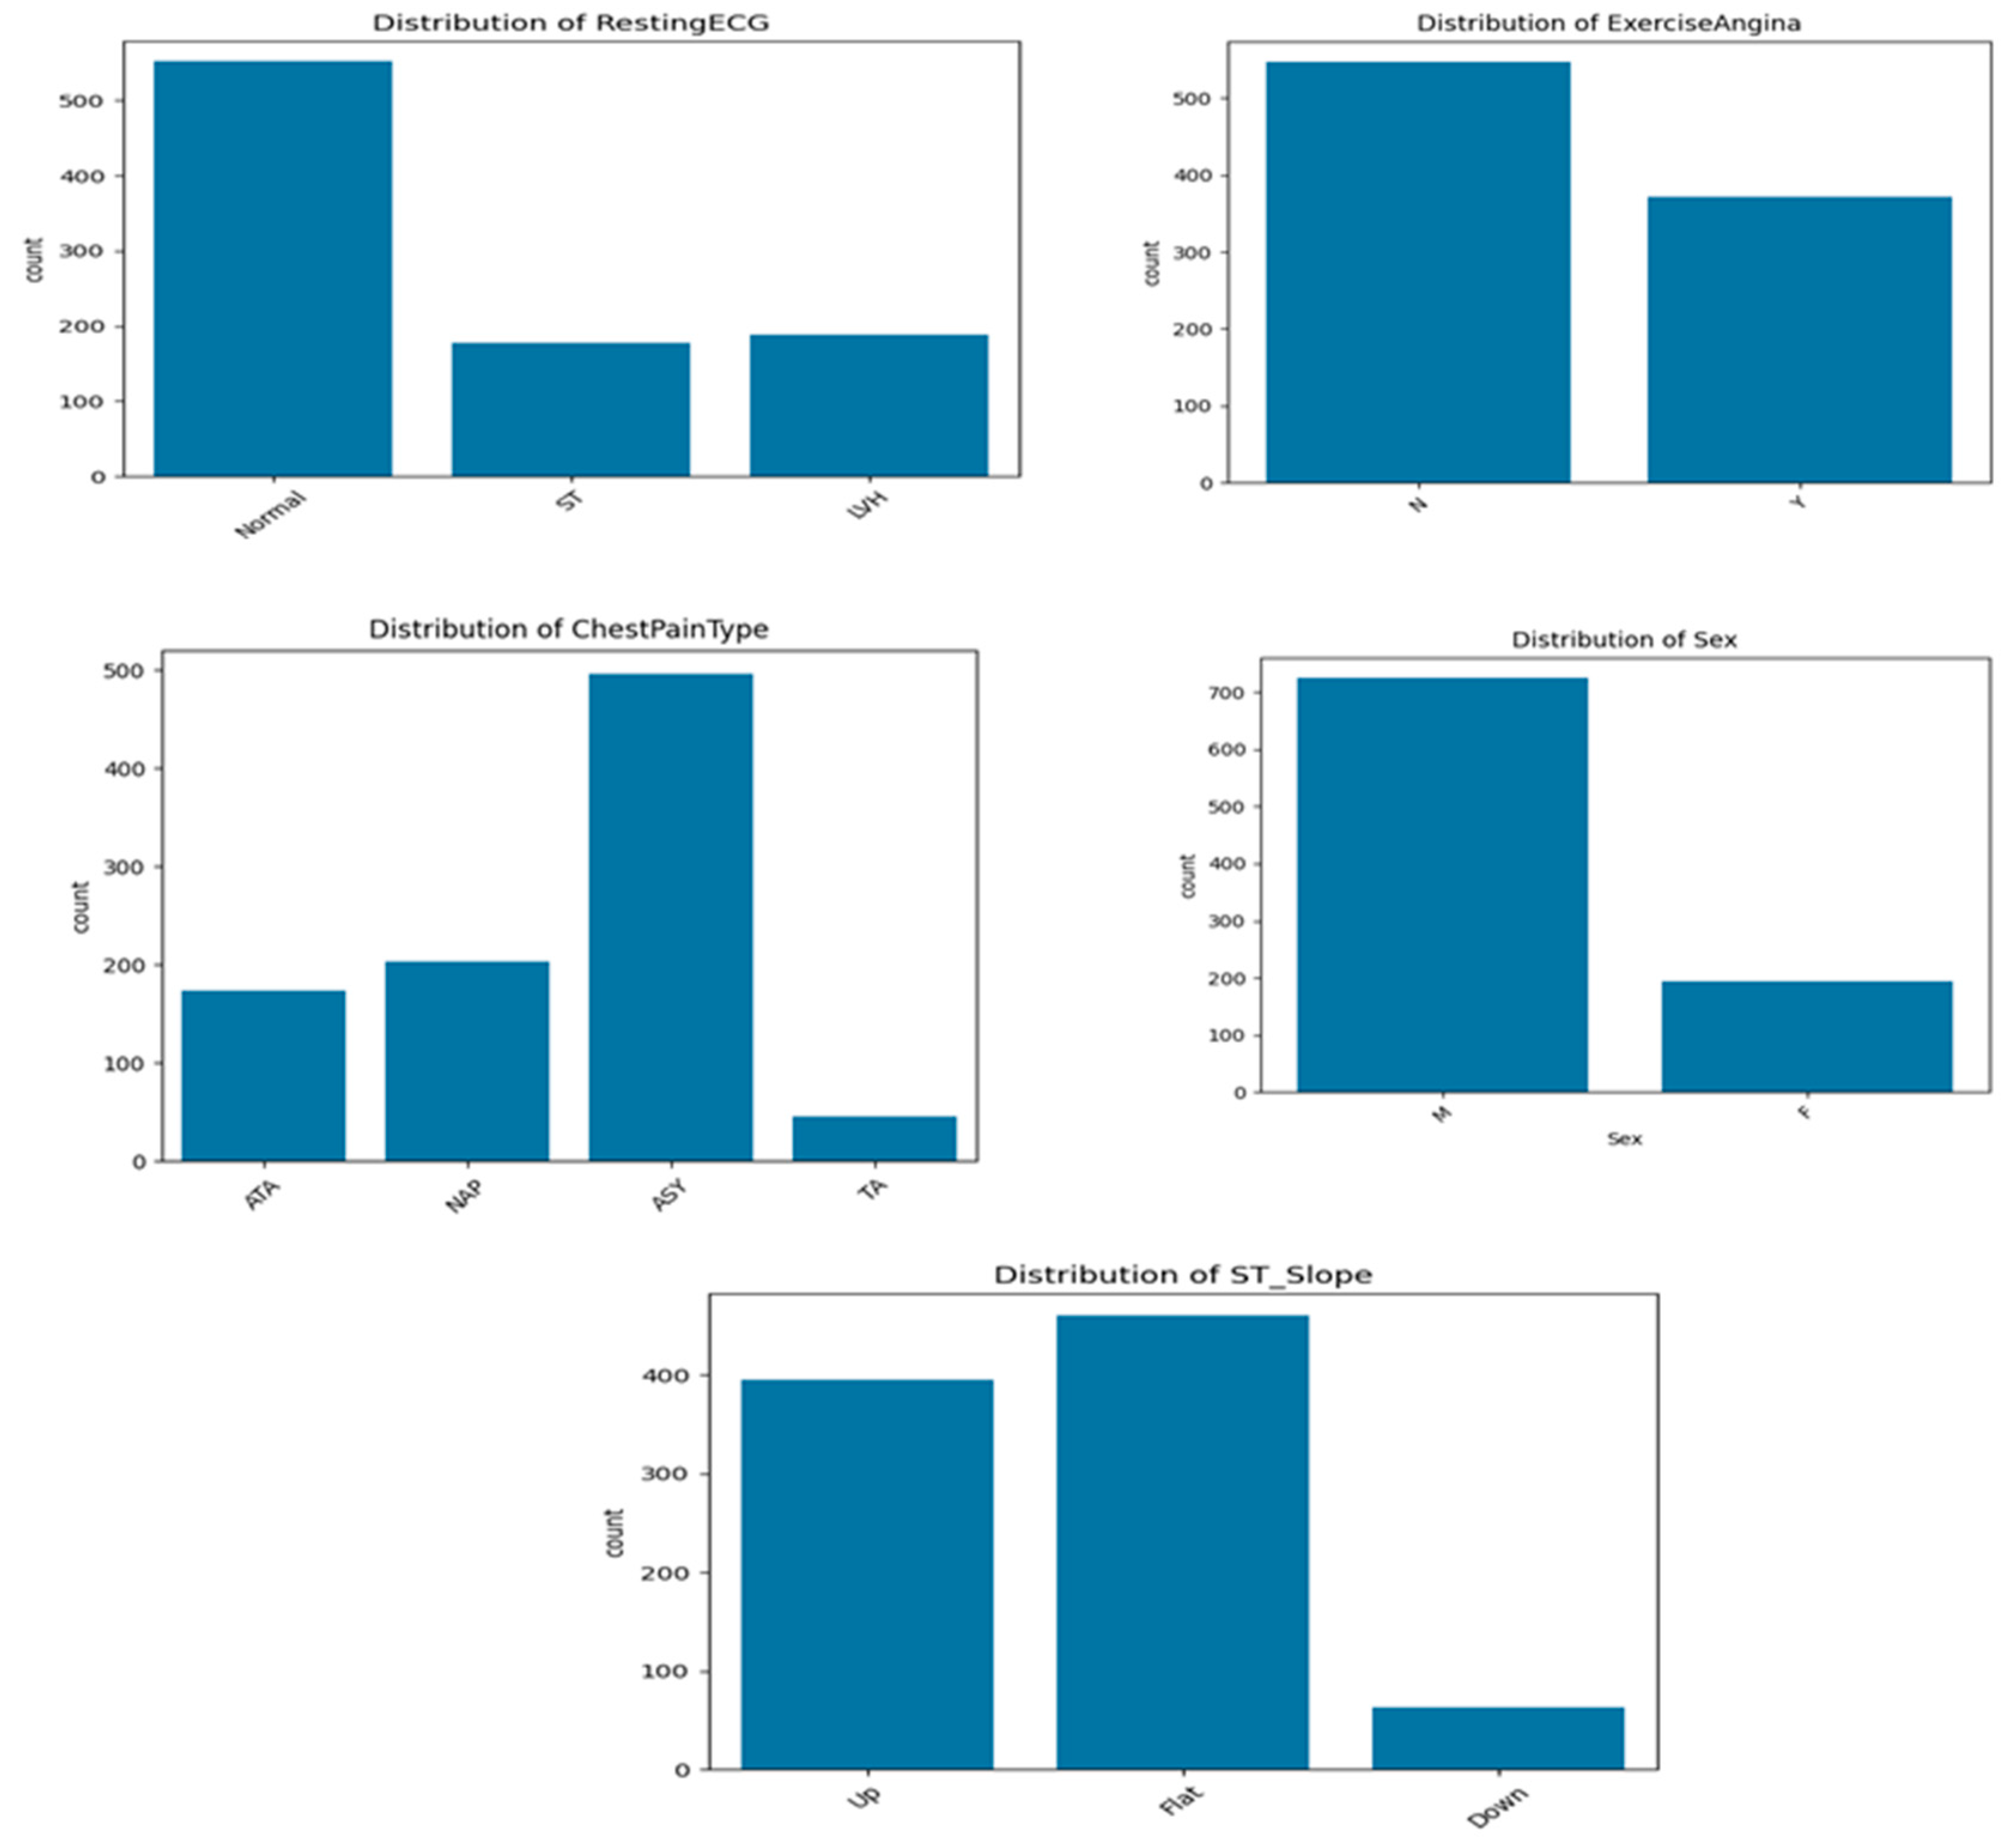
On the other hand, the dataset includes several categorical variables (
Figure 1) that provide clinically relevant information for cardiovascular disease prediction. Regarding five distribution, the cohort is predominantly male, with 725 men (79.0%) and 193 women (21.0%), indicating a significant sex imbalance. The variable ChestPainType shows that the most frequent type is asymptomatic pain (ASY), affecting over half of population, followed by non-anginal pain (NAP) and atypical angina (ATA). Typical angina (TA) is rare, reported in less than 50 cases. This suggests that most patients do not exhibit classic symptoms, reinforcing the need for predictive models that go beyond symptom-based diagnosis.
For ExerciseAngina, 40.4% of patients reported angina during physical exertion (Y), while the majority (59.6%) did not (N). This feature is clinically important, as exercise-induced angina is often indicative of myocardial ischemia. The ST_Slope variable, which captures the slope of the ST segment during stress ECG, shows that 50.1% of patients have a flat ST segment, a pattern commonly associated with ischemia. Upsloping patterns are observed in 43.0% of patients, while downsloping ST segments, typically the most pathological, are the least represented (6.9%).
Finally, the RestingECG results indicate that 60.1% of patients had a normal resting electrocardiogram, while 20.5% presented signs of left ventricular hypertrophy (LVH), and 19.4% exhibited ST-T wave abnormalities. Overall, these categorical variables contribute important diagnostic and prognostic information and are key features in the machine learning framework developed for cardiovascular disease prediction.
2.2. Data Preparation
Data preparation is a critical step in the data analysis and machine learning process, as the quality and relevance of the data have a significant impact on the performance and reliability of the models. The sources of the collected data vary, ranging from human inputs to sensors, each with differing levels of complexity and reliability. Therefore, data analysis should be able to extract valuable insights to facilitate informed decision-making and problem-solving, even when the data may contain imperfections such as corrupt entries, irrelevant or insufficient attributes, or missing values [
24].
2.2.1. Handling Missing Data
The presence of significant missing data can have a profound impact on the results [
25]. Therefore, it is essential to ensure that the dataset does not contain incomplete or missing values. In cases where missing data is present, it is important to apply appropriate techniques to address the issue. The Kaggle dataset used in this study consists of 918 patient records, all of which have complete data with no missing values.
2.2.2. Distribution of the Target
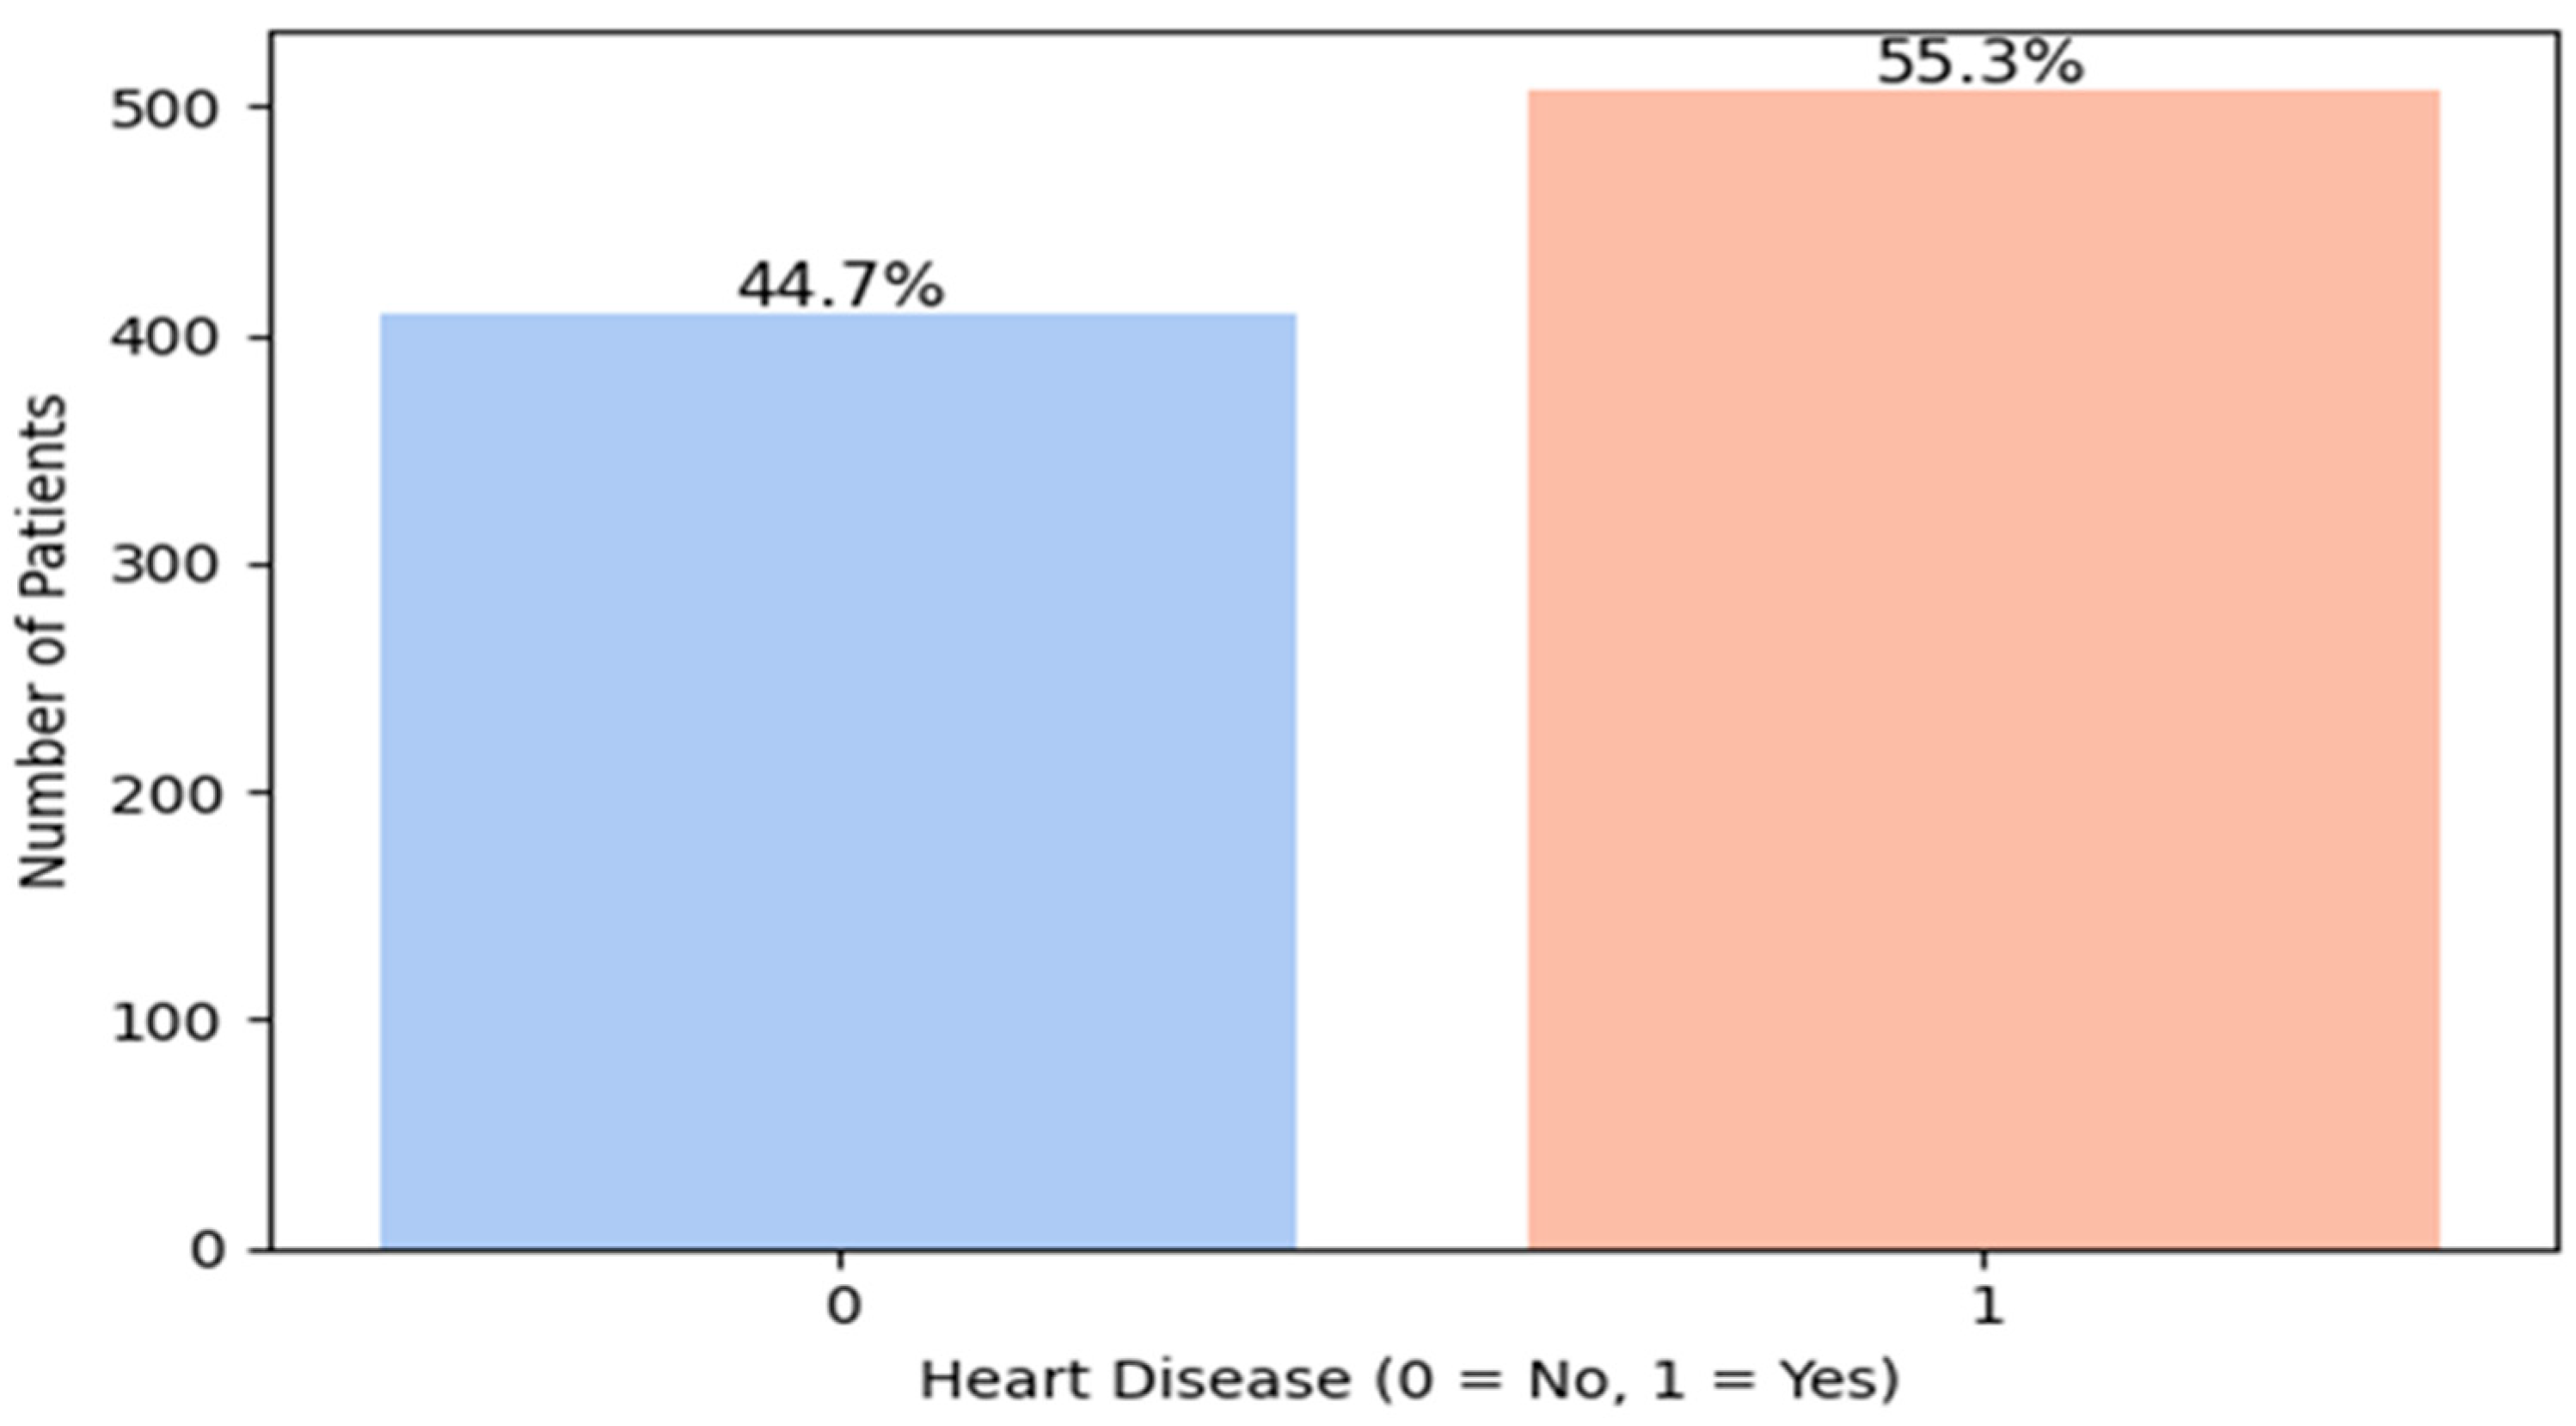
Verifying the distribution of the target variable (presence or absence of cardiovascular disease) (
Figure 2) is a crucial step in predictive modeling, as it helps identify potential class imbalance that may negatively affect model performance. In our dataset, the analysis of the “HeartDisease” variable revealed a class imbalance, with 55.3% positive cases (patients with heart disease) and 44.7% negative cases (healthy individuals). This corresponds to an imbalance ratio of approximately 1.24:1, indicating a moderate but non-negligible skew toward the positive class.
Although this imbalance is not severe, it can still introduce bias during training, causing models to favor the majority class and reducing their ability to correctly identify minority class instances, i.e., patients without heart disease. Therefore, applying class balancing techniques is essential.
To address this issue, we suggested to use in this study the Synthetic Minority Over-sampling Technique (SMOTE) [
26]. Unlike random over-sampling (which simply duplicates existing instances) or random under-sampling (which discards samples from the majority class), the SMOTE technique generates synthetic samples by interpolating between close neighbors of the minority class. This approach enriches the minority class without introducing redundant or duplicated data, while preserving important patterns.
Our choice of SMOTE is further supported by the findings of a recent study [
27], which compared SMOTE with random over-sampling and random under-sampling on a low-imbalance medical dataset. Their experiments demonstrated that SMOTE consistently outperformed RUS (Random Under-Sampling) in terms of overall predictive performance, particularly for metrics such as F1-score and accuracy, even when class imbalance was relatively low. In their results, SVM, Random Forest, and CatBoost models achieved notably better performance using SMOTE, reinforcing its suitability for structured health datasets.
Accordingly, SMOTE was applied during the preprocessing phase of our pipeline to correct the imbalance and enhance the model’s representativeness, ultimately aiming for a more accurate system for cardiovascular disease detection.
2.2.3. Categorical Encoding
Machine learning models require numerical input, yet many datasets include categorical variables like gender and diagnosis. Since most algorithms cannot process categorical data directly [
28], categorical encoding is essential for transforming these variables into numerical formats without distorting their distribution. This preprocessing step enhances model performance and ensures data utility. In our dataset, five categorical features: Sex, ChestPainType, RestingECG, ExerciseAngina, and ST_Slope, were encoded using OneHotEncoder, which assigns a unique binary vector to each category. This method prevents the introduction of implicit ordering, ensuring accurate model interpretation and improving the predictive capabilities of machine learning algorithms.
2.2.4. Standardization of Numeric Variables
Standardization is a key preprocessing technique that transforms numerical data to have a mean of 0 and a standard deviation of 1 [
29]. This process is particularly crucial for models such as Logistic Regression, Support Vector Machines (SVMs), neural networks, and distance-based methods like kNN, which assume centered data with homogeneous variance across features. Standardization ensures that features are comparable, especially when they have different units or scales, and helps prevent certain variables from dominating the model due to their magnitude.
In this study, we used the StandardScaler() tool from the scikit-learn library to automate and efficiently apply this transformation. The standardization was applied after handling missing values and encoding categorical features, and before model training and SHAP (SHapley Additive exPlanations) analysis. This order is critical, as computing SHAP values on non-standardized features can lead to misleading interpretations of feature importance, particularly in models sensitive to feature scale.
The numerical features to which standardization was applied include the following: Age, RestingBP, Cholesterol, FastingBS, MaxHR, and Oldpeak. By ensuring that all preprocessing steps preceded the SHAP-based feature importance computation, we maintained methodological consistency and robustness in both the modeling and interpretability phases.
2.2.5. SHAP Analysis
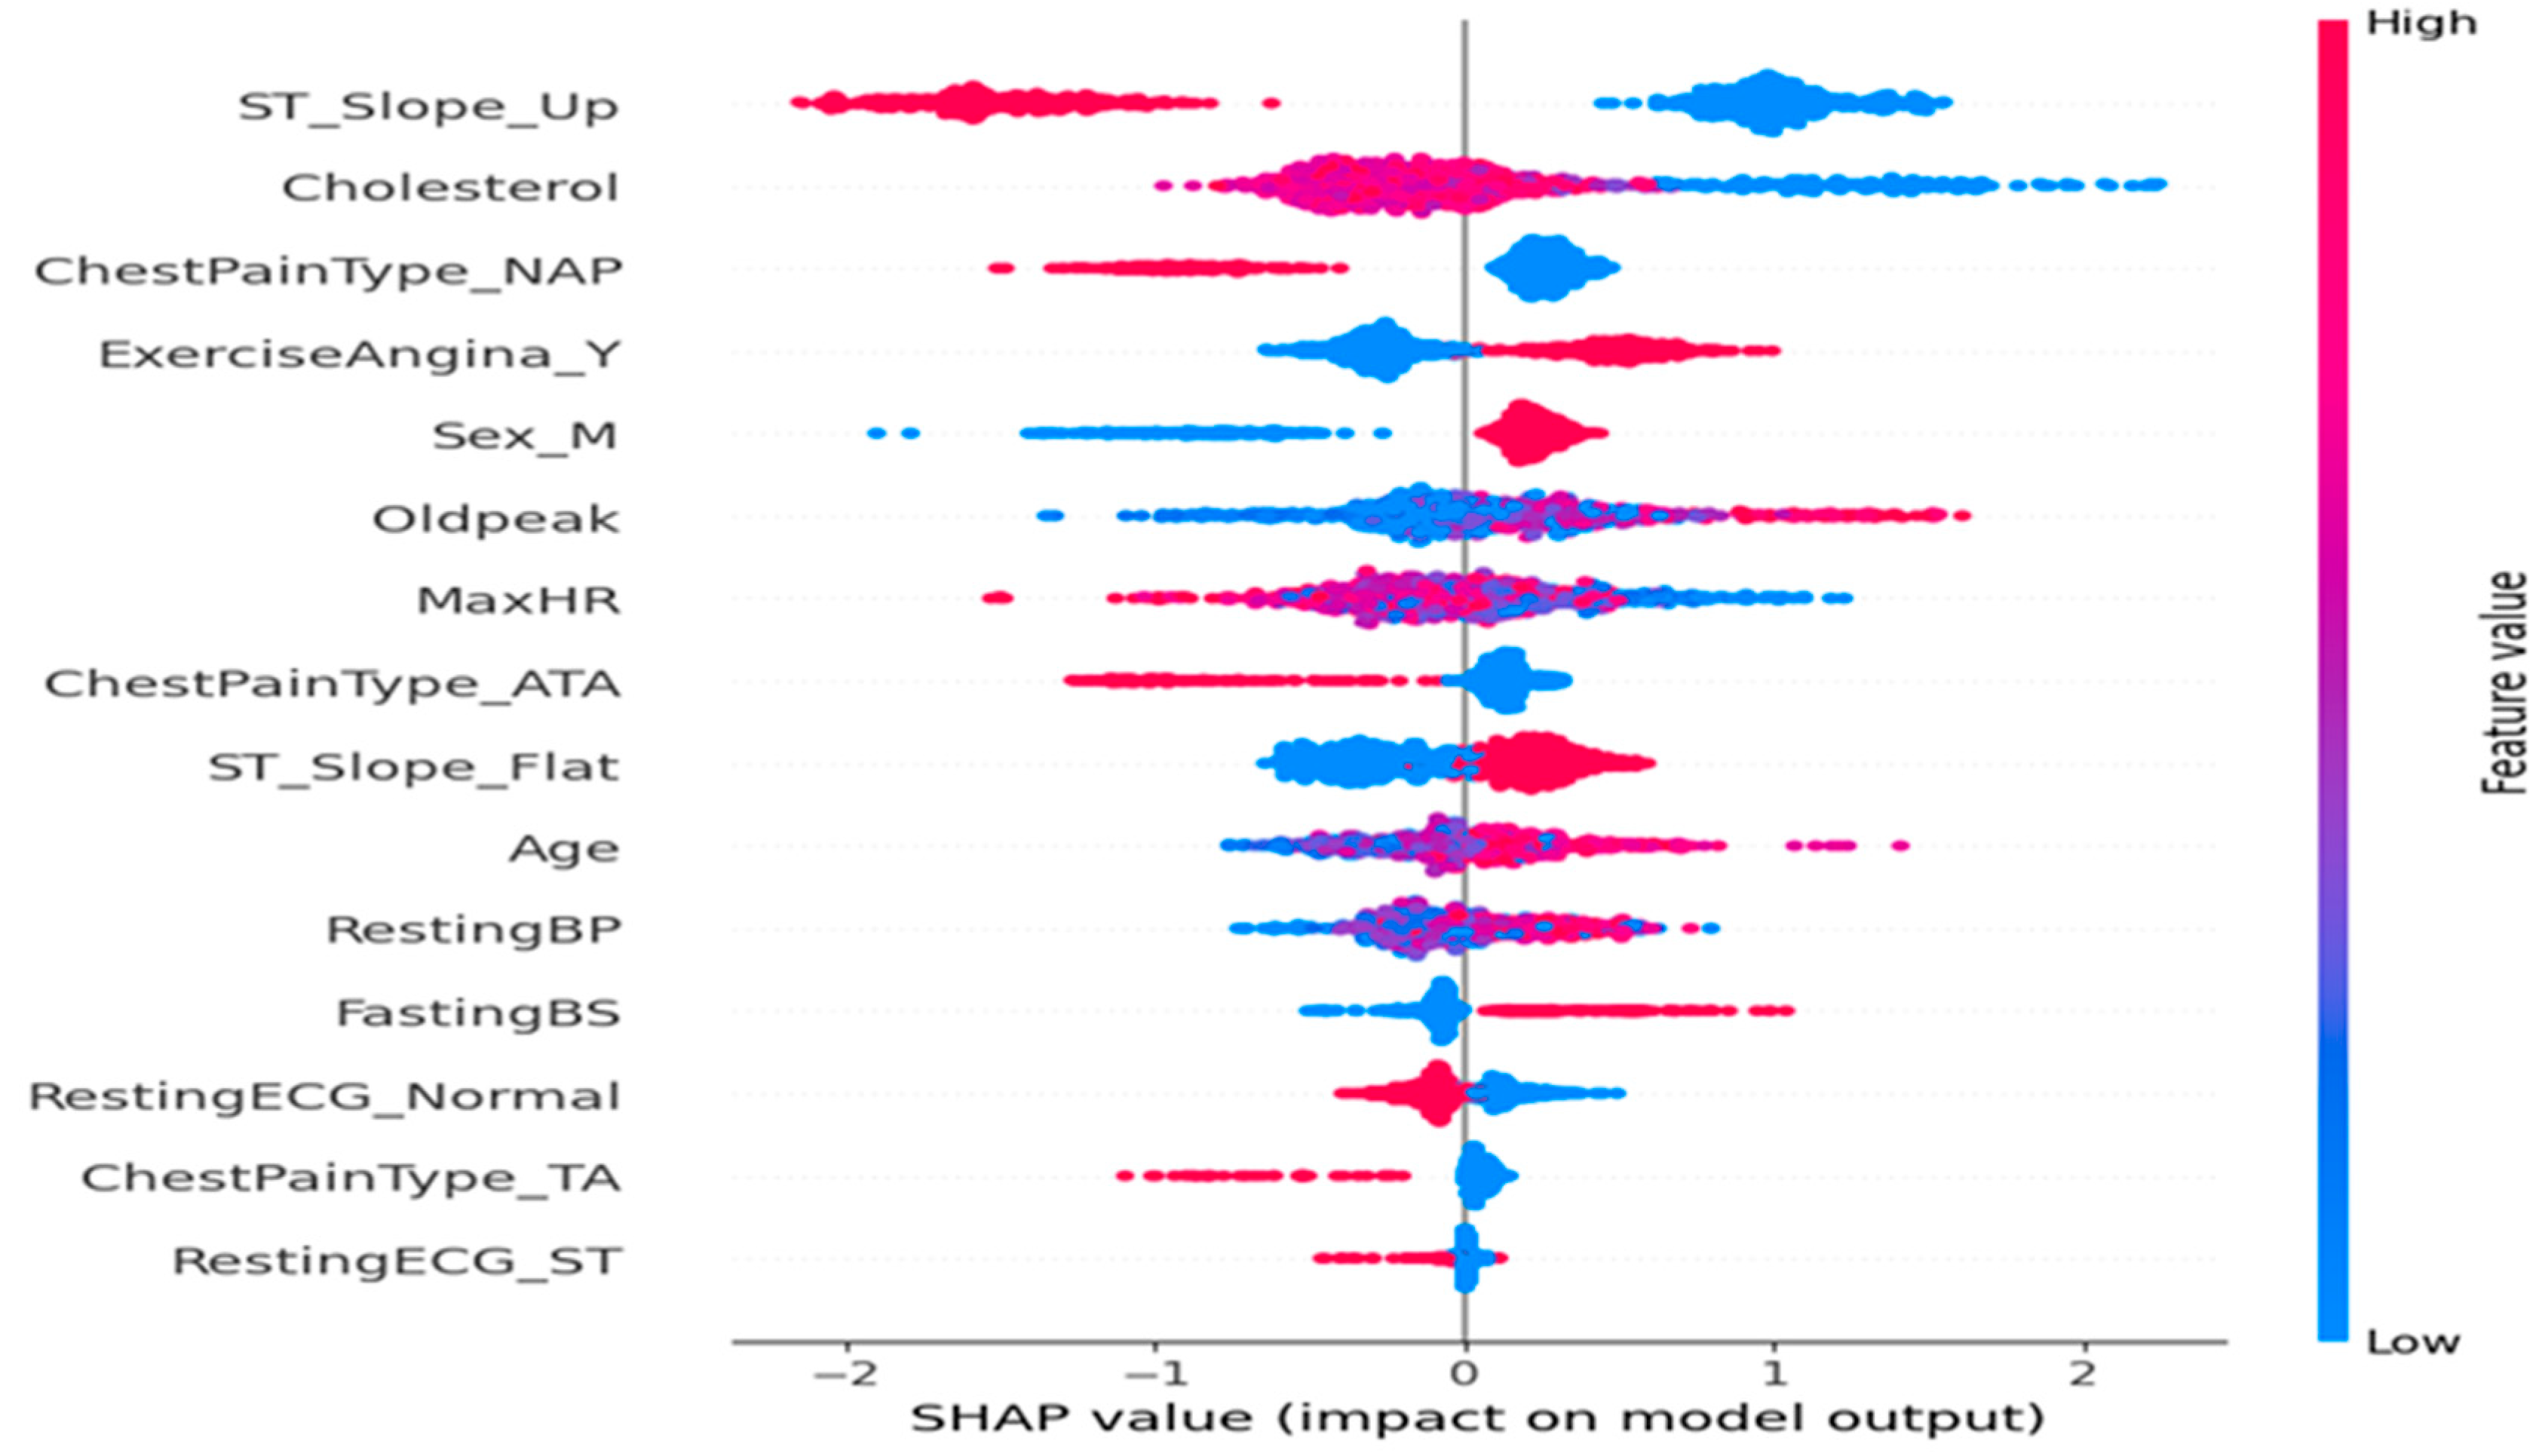
The SHAP summary plot (
Figure 3) illustrates the impact of features on disease prediction. The SHAP summary plot presented in (
Figure 2) illustrates both the relative importance and the directional influence of explanatory variables on the predictions of the cardiovascular disease classification model [
30]. Each variable is represented by a line, ranked in descending order according to its average absolute contribution to the predictions, measured by the average magnitude of the SHAP values.
On the x-axis, the SHAP values reflect the strength and direction of each variable’s impact: The farther the value is from zero, the more significant its influence on the prediction. A positive SHAP value indicates a contribution towards predicting a high risk of cardiovascular disease, whereas a negative value indicates an influence towards a low risk. The color coding associates each point with the actual value of the variable for the corresponding observation, ranging from blue (low values) to red (high values).
A detailed analysis of the key variables reveals the following:
ST_Slope_Up is the most influential variable in the model. Observations with high values of this variable are associated with negative SHAP values, indicating that an upward ST segment slope reduces the predicted probability of cardiovascular disease, consistent with established clinical knowledge.
Cholesterol exhibits the opposite effect: high cholesterol levels correlate with positive SHAP values, thereby increasing the predicted cardiac risk.
Regarding chest pain types, the presence of non-anginal pain (ChestPainType_NAP) tends to decrease the predicted risk, whereas typical angina (ChestPainType_ATA) appears to slightly increase it.
The variables ExerciseAngina_Y (indicating exercise-induced angina) and Oldpeak (ST segment depression measure) are associated with increased risk, as suggested by their positive SHAP values when elevated.
The maximum heart rate achieved (MaxHR) shows an inverse relationship with predicted risk: The high MaxHR values correspond to negative SHAP values, which aligns physiologically with better cardiovascular fitness.
Male sex (Sex_M) appears as a mildly aggravating factor, with higher values associated with a moderate increase in predicted risk, in agreement with epidemiological data.
Finally, other variables such as RestingECG_Normal, FastingBS (fasting blood sugar), and Age exert a more modest but still significant impact on the prediction, reflecting their contributory roles in the model.
This SHAP representation provides a clear and interpretable view of the importance of cardiovascular risk factors within the model, while confirming the clinical relevance of the variables retained.
2.3. Prediction-Based Single Machine Learning: Scenario 1
After applying the various data preprocessing steps, we chose to evaluate the models using 10-fold cross-validation (K-Fold = 10). This approach allows for the full utilization of the dataset by alternating between training and evaluation across all data points. In each iteration, the model is trained on 90% of the data and validated on the remaining 10%. This process is repeated ten times to ensure a robust and unbiased assessment of model performance. Therefore, using 10-fold cross-validation ensures that each observation is used for both training and validation at different stages of the process, thus maximizing data utilization and providing more reliable performance estimates.
Furthermore, we employed stratified sampling within each fold to preserve the original class distribution. This strategy is particularly relevant for classification problems where class imbalance is present, as it ensures that class proportions are maintained across all subsets. By doing so, it prevents models from becoming biased toward the majority class and improves the reliability of performance evaluation.
In this study, we evaluate seven supervised classification models, each representing different algorithmic families:
Logistic Regression: A linear model that estimates the probability of class membership using a sigmoid function. It serves as a baseline for comparing the performance of more complex models.
Random Forest: An ensemble learning method based on multiple Decision Trees, which enhances robustness and generalization by aggregating trees trained on different data subsets.
Support Vector Machine (SVM) with RBF Kernel: A model that maximizes margins to separate classes and, with the RBF kernel, captures nonlinear relationships between variables.
K-Nearest Neighbors (KNN): A similarity-based algorithm that classifies an observation based on the majority class of its closest neighbors.
XGBoost (Extreme Gradient Boosting): A gradient boosting algorithm optimized for speed and performance, widely used in machine learning competitions.
LightGBM (Light Gradient Boosting Machine): A faster and more efficient variant of XGBoost, using a leaf-wise training approach rather than a level-wise one.
CatBoost (Categorical Boosting): A model optimized for datasets containing categorical variables, incorporating advanced techniques to mitigate overfitting.
These models span a wide range of techniques, from linear to tree-based and ensemble learning methods (bagging and boosting). Their diversity enables a comprehensive comparative analysis, facilitating the identification of the most effective model for cardiovascular disease prediction.
2.4. Prediction-Based Cross-Validation Approach: Scenario 2
To explore new approaches for optimizing the performance of the predictive model and enhancing the obtained results [
31], we adopt a cross-validation-based prediction strategy in this section. For classification models, selecting the appropriate complexity parameters is crucial for optimal prediction performance on new data. When data is abundant, a common approach involves: (i) dividing the dataset into training, validation, and test sets, (ii) training models, and (iii) selecting the best-performing model based on validation results. However, limited data increases the risk of generalization errors. To mitigate this, cross-validation, particularly S-fold cross-validation, is employed to reduce overfitting. The S-fold method partitions the dataset into S subsets, using S-1 for training and the remaining group for testing. This process is repeated, and the performance scores are averaged to ensure robust model evaluation. We retain the same classification algorithms as previously used—Logistic Regression, Random Forest, Support Vector Machine (SVM), K-Nearest Neighbors (KNN), XGBoost, LightGBM, and CatBoost. However, we extend our analysis by exploring different values of K, specifically K = 5 and K = 15, to evaluate the impact of the number of folds on the stability and generalization ability of the models. The performance of each model is assessed using four key metrics: accuracy, recall, F1-score, and precision.
This approach enables an in-depth analysis of how the number of folds in cross-validation influences the stability of model performance and helps identify the most effective configuration for cardiovascular disease prediction.
2.5. Prediction-Based Stacking Model: Scenario 3
The methodology employed in this third scenario focuses on a stacking-based prediction model, which integrates multiple classifiers to enhance predictive accuracy and robustness [
32]. Stacking is an ensemble learning technique that combines several base models to improve performance by training multiple models on the same dataset and using a meta-model to learn from their predictions. The final prediction is determined by the output of the meta-model, leading to improved accuracy. Initially, three base models are selected: Random Forest (RF), Support Vector Machine (SVM), and CatBoost, which are the top three models based on high accuracy. Each model is initialized with predefined hyperparameters.
In Scenario 3-1, the base models are then combined with a Logistic Regression meta-model, which learns the relationships between the base models’ predictions. The stacking model is constructed using a K-fold cross-validation procedure (K = 10) to ensure reliable performance evaluation. To optimize the model, GridSearchCV is used to fine-tune the hyperparameters of the base models, including the number of trees and depth for Random Forest, the regularization parameter (C) for SVM, and the number of iterations for CatBoost.
In Scenario 3-2, a second methodology was investigated by implementing a modified version of the stacking model (Algorithm 1). This variant involved testing different configurations of both the meta-model and the base models. Specifically, the meta-model was replaced with an MLPClassifier (Multilayer Perceptron) instead of the Logistic Regression previously used in Scenario 3.1, and the probability output option was activated for the Support Vector Machine (SVM) to enable probabilistic stacking.
| Algorithm 1: Stacking Model: Scenario 3-2 |
| Require: Dataset D with features X and target y |
| Ensure: Optimized stacked model and performance metrics |
| 1: Data Preprocessing: |
| 2: Impute missing values in RestingBP, Cholesterol, Oldpeak with the median |
| 3: Encode categorical variables using OneHotEncoder |
| 4: Normalize numerical variables using StandardScaler |
| 5: Data Separation: X ← D \ y, y ←D [HeartDisease] |
| 6: Data Transformation: |
| 7: Apply preprocessing pipeline to X |
| 8: Class Balancing: |
| 9: Apply SMOTE on (X; y) to obtain (X’; y’) |
| 10: Define Base Models: |
| 11: M1 ← Random Forest (300 trees, max depth = 12) |
| 12: M2 ←SVM (RBF kernel, C = 1:0) |
| 13: M3 ← CatBoost (300 iterations, depth = 6) |
| 14: Define Meta-Model: |
| 15: Mf ← MLPClassifier (2 hidden layers: 50 and 25 neurons) |
| 16: Create Stacking Model: |
| S ← StackingClassifier ([M1;M2;M3]; final_estimator = Mf) |
| 17: Hyperparameter Optimization: |
| 18: Define hyperparameter grid G to test |
In this enhanced stacking configuration, the base learners consisted of a Random Forest classifier (300 trees, maximum depth of 12), a Support Vector Machine with an RBF kernel (with probability estimates enabled), and a CatBoost classifier (300 iterations, depth 6, learning rate 0.05) (line 11–13). The meta-learner was replaced with a more expressive model, an MLPClassifier with two hidden layers (50 and 25 neurons) (line 15), to allow the ensemble to better capture nonlinear interactions between the outputs of the base models.
Furthermore, Hyperparameter tuning was conducted using a grid search strategy (GridSearchCV), in combination with a 10-fold Stratified Cross-Validation procedure, to identify the most effective parameter configurations (line 18–20).
This exploration aimed to further improve the overall model performance and to assess the added value of integrating neural networks within the stacking framework. Following the optimization phase, the stacking models from both scenarios were evaluated on a hold-out test set using the same key performance metrics (Accuracy, Recall, F1-score, and Precision) (line 22–25), with the results presented in the subsequent section.
2.6. Evaluation Metrics
In machine learning, model performance is commonly assessed using true positives (TP), true negatives (TN), false positives (FP), and false negatives (FN) [
33]. Key evaluation metrics such as Accuracy, Precision, Recall, and F1 Score are derived from these values. The corresponding formulas for these calculations are presented in Equations (1)–(4). To evaluate the performance of ML algorithms, we have used these metrics.
3. Results and Discussion
The programming language used in this research is Python 3.11.5, chosen for its simplicity, flexibility, and extensive ecosystem of libraries tailored for machine learning. Python’s clear and concise syntax enhances code readability and ease of implementation, making it a preferred choice among researchers and practitioners. Additionally, its vast collection of libraries, such as NumPy and Pandas, facilitates efficient data manipulation and analysis. Another key advantage of Python in machine learning is its robust data visualization capabilities. Libraries like Matplotlib 3.8.4, one of the most widely used visualization tools, enable the generation of histograms, plots, and charts, providing insightful representations of data and aiding in model interpretation.
The SHAP analysis performed on the model highlights that all included variables contribute significantly, albeit to varying degrees, to the prediction of cardiovascular disease risk. No feature exhibits a null or near-null impact on the predictions, thereby justifying the retention of all variables in the final model. Indeed, each variable displays a distribution of SHAP values influencing the model, both in increasing and decreasing the predicted probability, and even those with a lower impact, such as age or fasting blood sugar (FastingBS), contribute to the fine-tuning of predictions by providing complementary information.
Moreover, in ensemble models, variables often interact with one another. In fact, a variable with an apparently marginal isolated impact may, in combination with others, enhance the overall predictive capacity. Thus, excluding a variable, even one with a weak contribution, could potentially reduce the model’s performance and robustness. Furthermore, all retained variables are clinically relevant and supported by strong pathophysiological or epidemiological justification, and their inclusion ensures that the model incorporates the full range of known and potentially useful factors, thereby increasing confidence in its predictions. Caution is also warranted when reducing variables, as this process can sometimes lead to significant information loss or oversimplification, particularly in a medical context where precision is critical. The SHAP method applied here guarantees that all variables provide useful explanatory value, rendering any pruning unnecessary. Consequently, the absence of variable exclusion reflects an optimal balance between complexity and performance, ensuring a model that is both effective, interpretable, and clinically pertinent.
The results of the test of Scenario 1, presented in
Table 3, indicate that CatBoost is the best-performing model, achieving an accuracy of 86.64% and an F1-score of 88.18%, providing a good balance between precision and recall. SVM and Random Forest exhibit similar performance, both with an accuracy of 85.96%, although SVM achieves the highest recall (90.14%), making it well-suited for detecting positive cases. The boosting models (LightGBM, XGBoost) perform slightly lower, with respective accuracies of 85.41% and 85.28%. Logistic Regression demonstrates comparable performance (85.27%) but with slightly higher precision (86.29%). KNN is the least effective model, with an accuracy of 83.92%, which may be attributed to the nature of the data and its sensitivity to local variations.
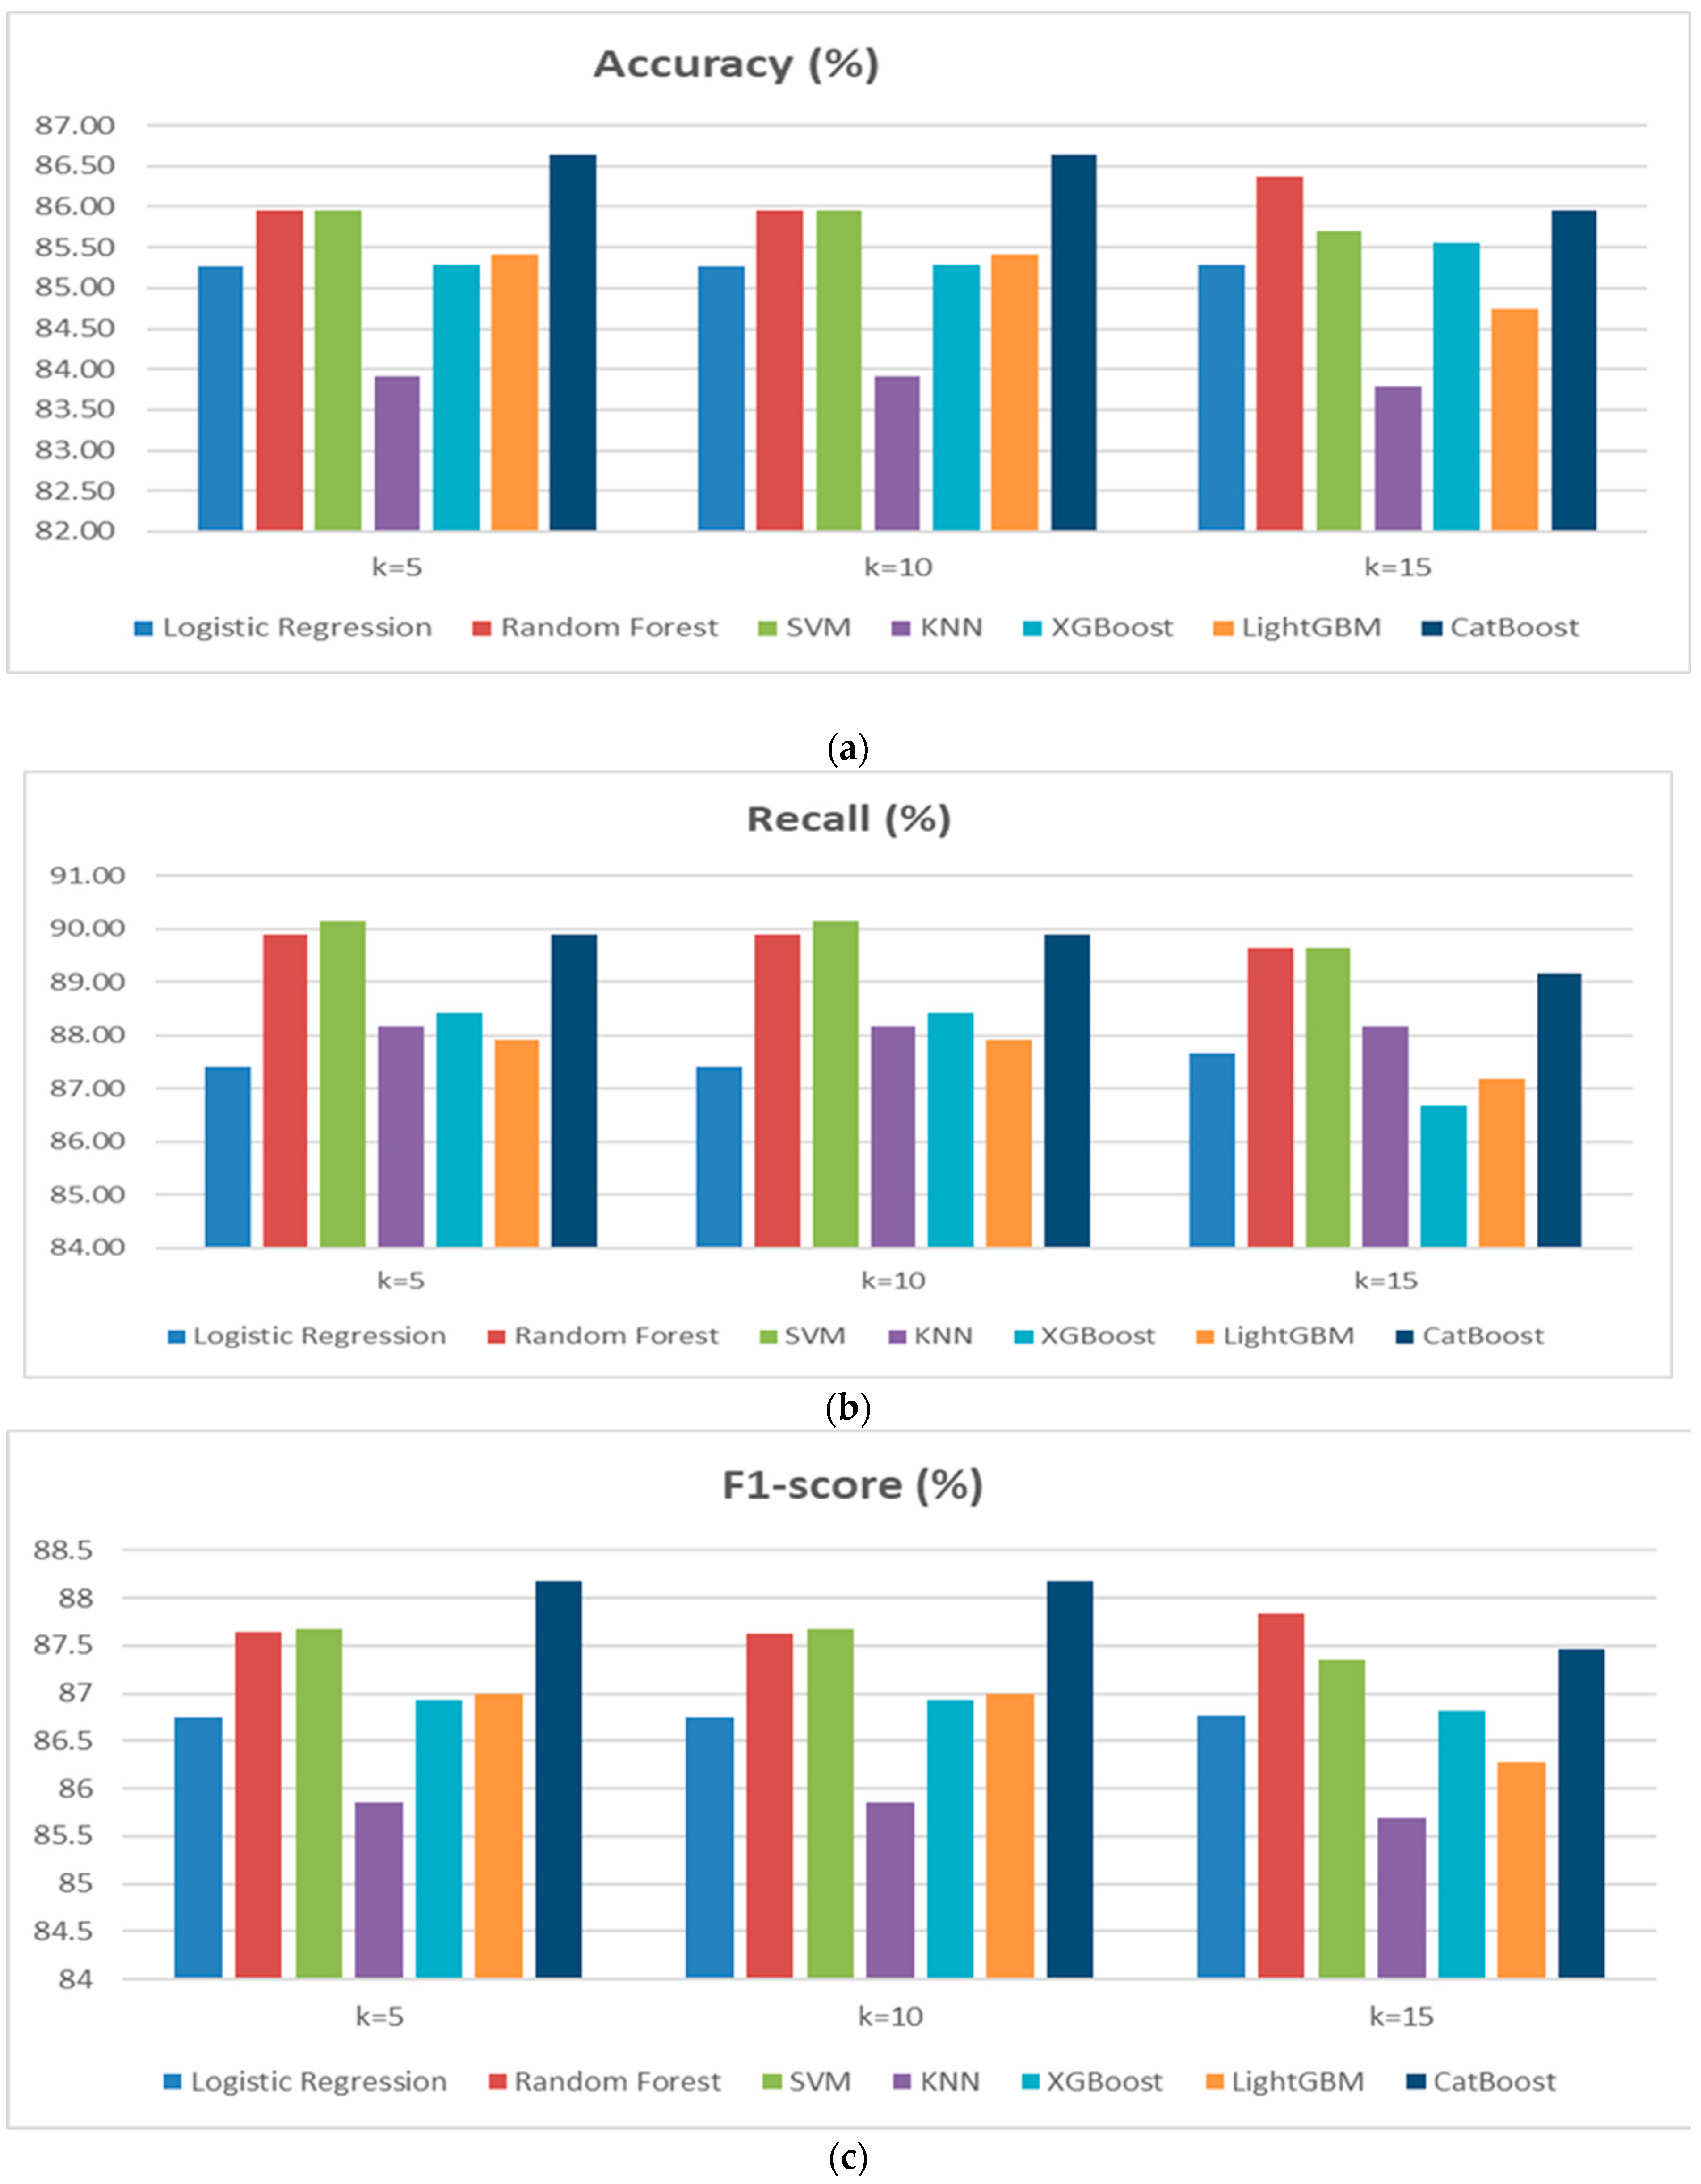
In Scenario 2, a cross-validation approach with K = 5 and K = 15 was applied to assess the performance of the classification models used in Scenario 1. The aim is to analyze the impact of varying the number of folds on cardiovascular disease prediction. Based on the results obtained for both scenarios, it is observed that model performance remains relatively stable, although some variations occur depending on the number of folds (
Figure 4a–d). Random Forest performed particularly well, with a high F1-score (87.83% for K = 15) and stable Recall, making it one of the top-performing models. SVM demonstrated good stability with strong scores in Accuracy and F1-score, although a slight decrease in Accuracy was observed for K = 15. CatBoost was also effective, but a slight decrease in Accuracy was noted for K = 10. The impact of increasing the number of folds (from K = 10 to K = 15) showed that Random Forest and SVM benefit from greater stability, while some models, such as KNN and LightGBM, displayed slightly less consistent performance. Overall, cross-validation with K = 10 or K = 15 enhances model robustness, particularly for Random Forest and SVM, reducing the risk of overfitting and ensuring better generalization.
Scenario 3 explores two approaches to improve cardiovascular disease prediction using a stacking ensemble learning technique. Both methods use a base model composed of Random Forest (RF), Support Vector Machine (SVM), and CatBoost, which were the top performers in Scenarios 1 and 2. The first approach employs a Logistic Regression (LR) meta-model, while the second utilizes a Multilayer Perceptron (MLP) meta-model. The results (
Figure 5) indicate that the stacking model with MLPClassifier significantly outperforms the LR model. The MLP model achieved an accuracy of 97.06%, higher than the 91.18% of the LR model, demonstrating superior overall predictive performance. The MLP model also achieved a higher recall (96.08% vs. 90.20%) and precision (98% vs. 92%), and a better F1-score of 97.03%, compared to 91.09% for LR. These results emphasize the advantages of using MLPClassifier as a meta-model in a stacking framework, surpassing Logistic Regression across all critical metrics. The findings highlight the effectiveness of neural networks in enhancing prediction accuracy for complex tasks, such as forecasting cardiovascular disease.
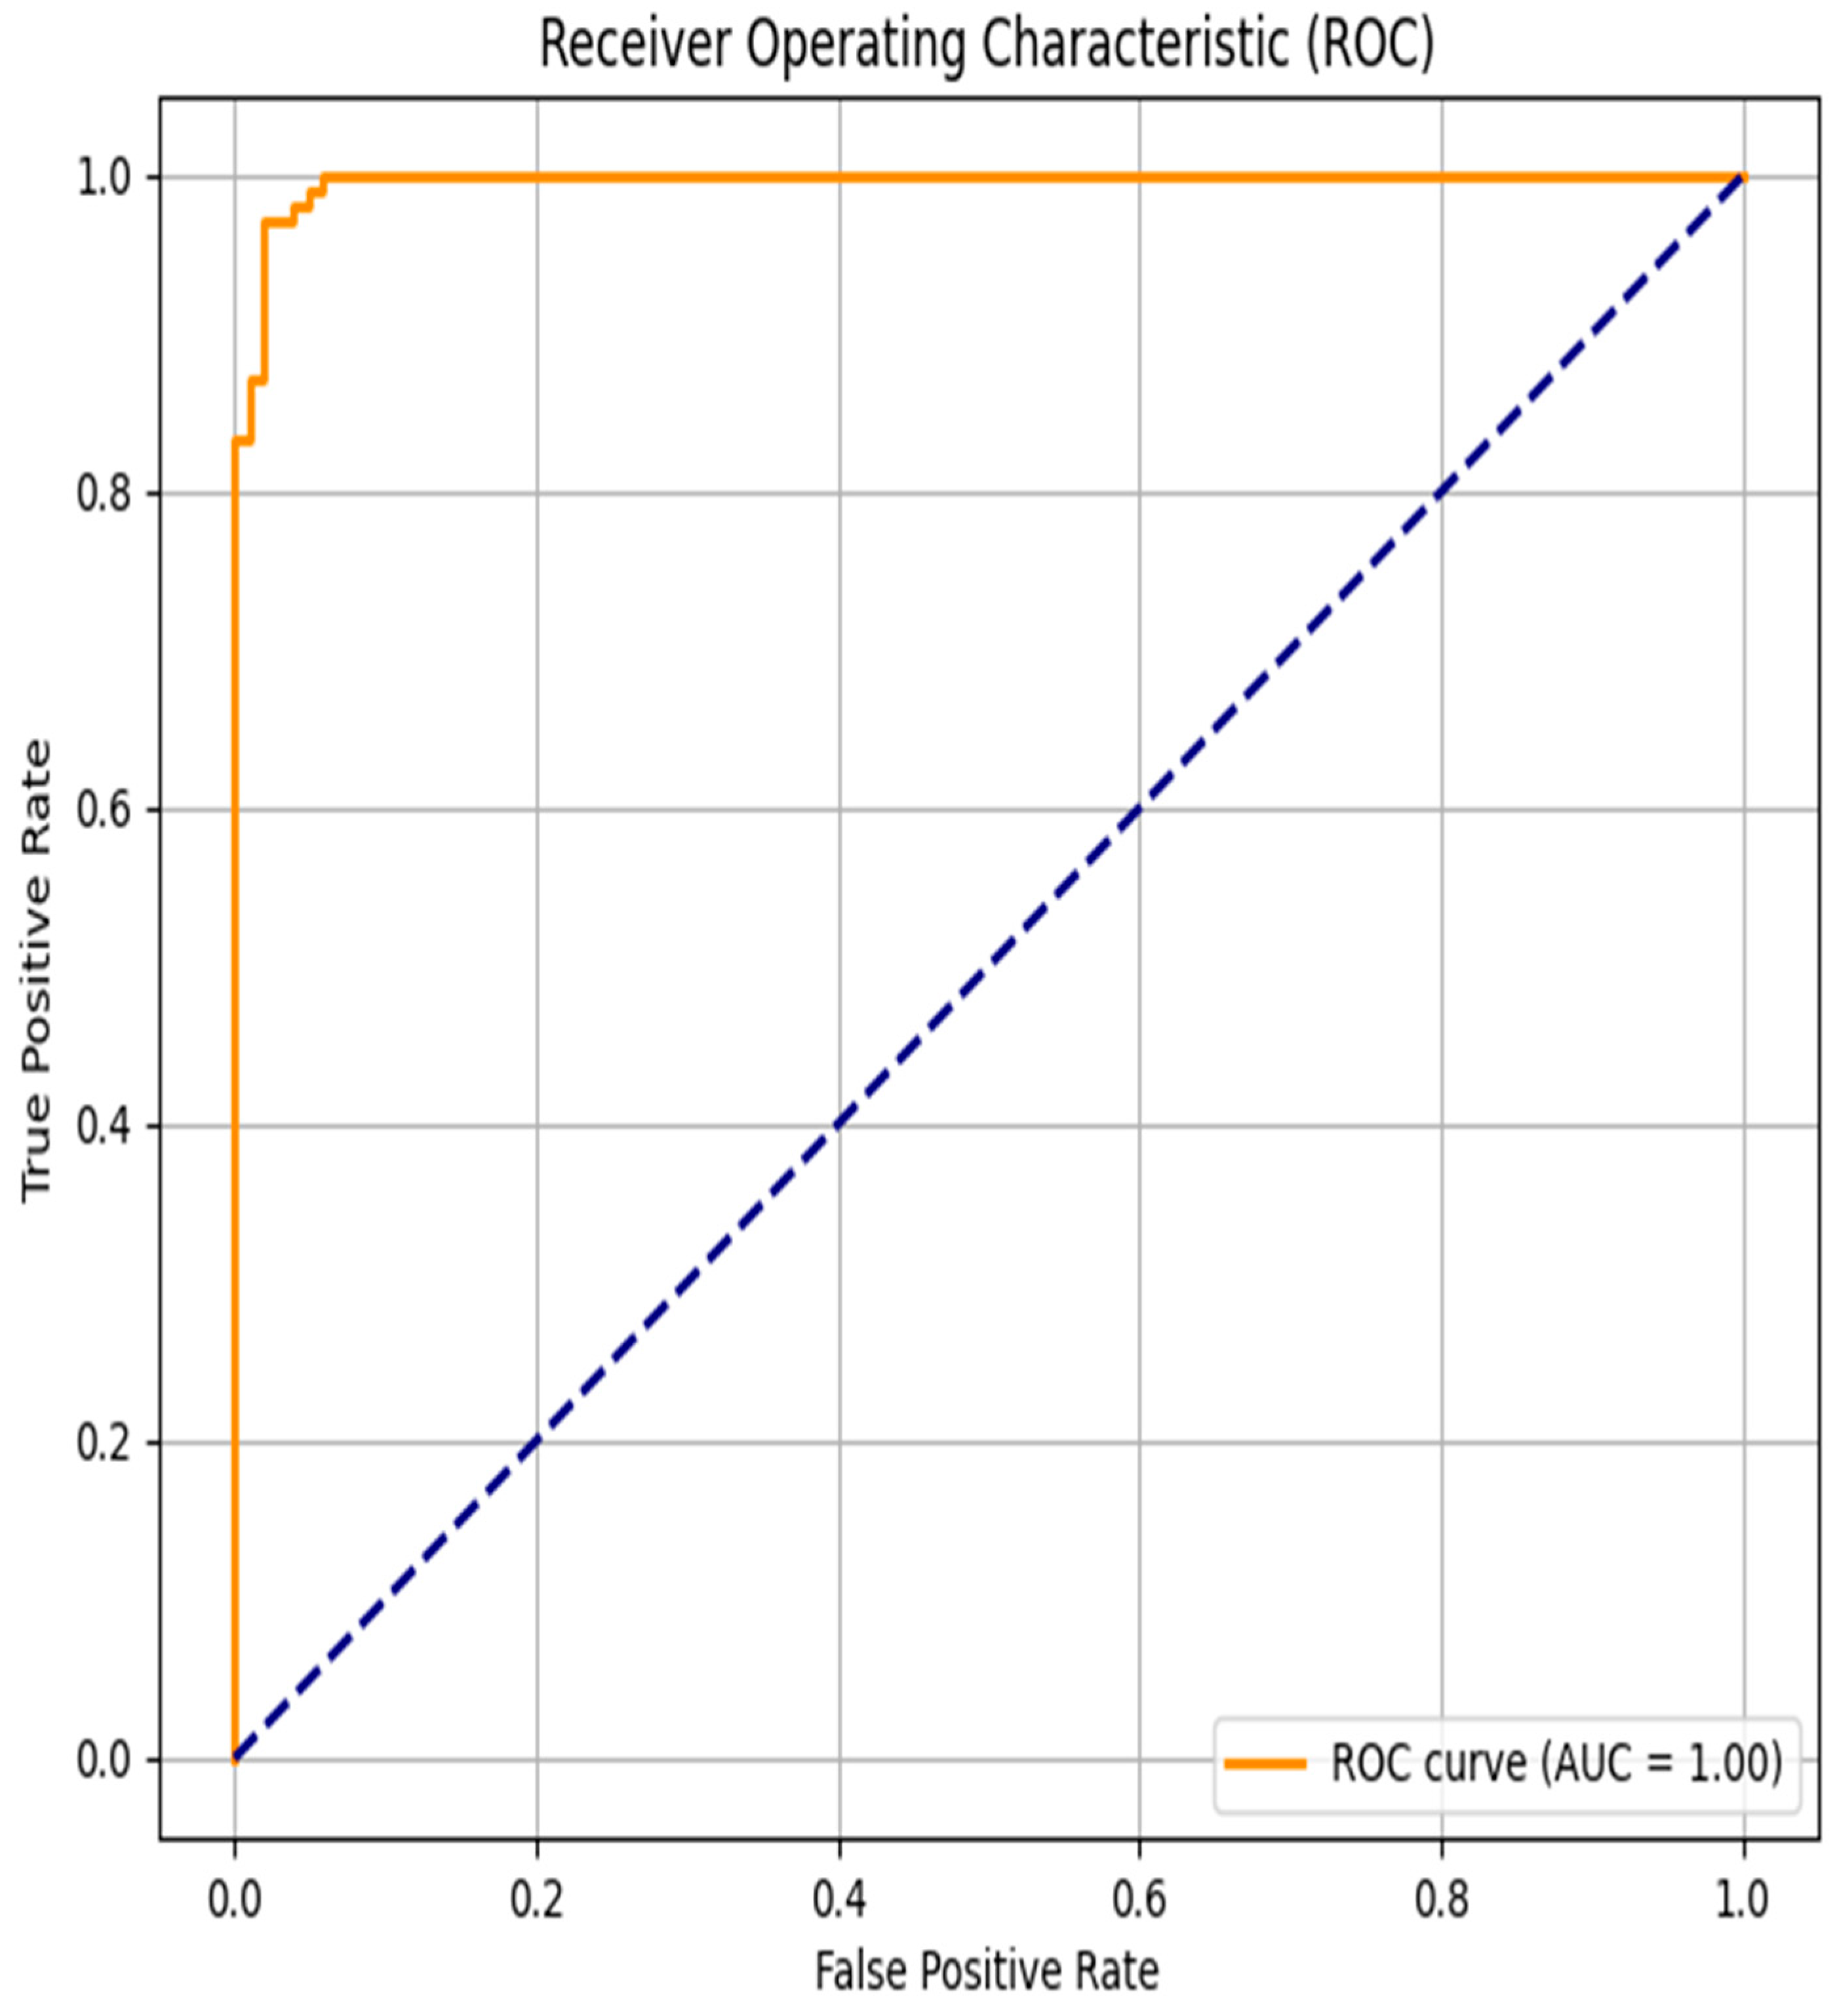
The evaluation of the discriminative performance of the proposed model was conducted using the Receiver Operating Characteristic (ROC) curve, a standard method for visualizing the trade-off between sensitivity (true positive rate) and specificity (1—false positive rate). As shown in
Figure 6, the ROC curve follows an almost ideal trajectory, approaching the upper-left corner of the graph, which indicates a high detection rate of positive cases with a very low false alarm rate across a wide range of classification thresholds. The area under the ROC curve (AUC) reaches a perfect score of 1.00, reflecting the model’s exceptional discriminative power—accurately identifying both positive and negative cases without error.
Such a result suggests that the classifier is particularly effective in distinguishing patients with cardiovascular disease from those without. However, it is important to note that obtaining an AUC of 1.00, while theoretically optimal, may also indicate a risk of overfitting, especially if the test data lacks sufficient complexity or variability.
From a clinical perspective, achieving high sensitivity while minimizing false positives is critical, as it helps reduce the risk of missing high-risk patients while avoiding unnecessary interventions in healthy individuals. Therefore, the ROC analysis confirms the model’s strong potential for reliably and accurately predicting cardiovascular risk in medical monitoring applications.
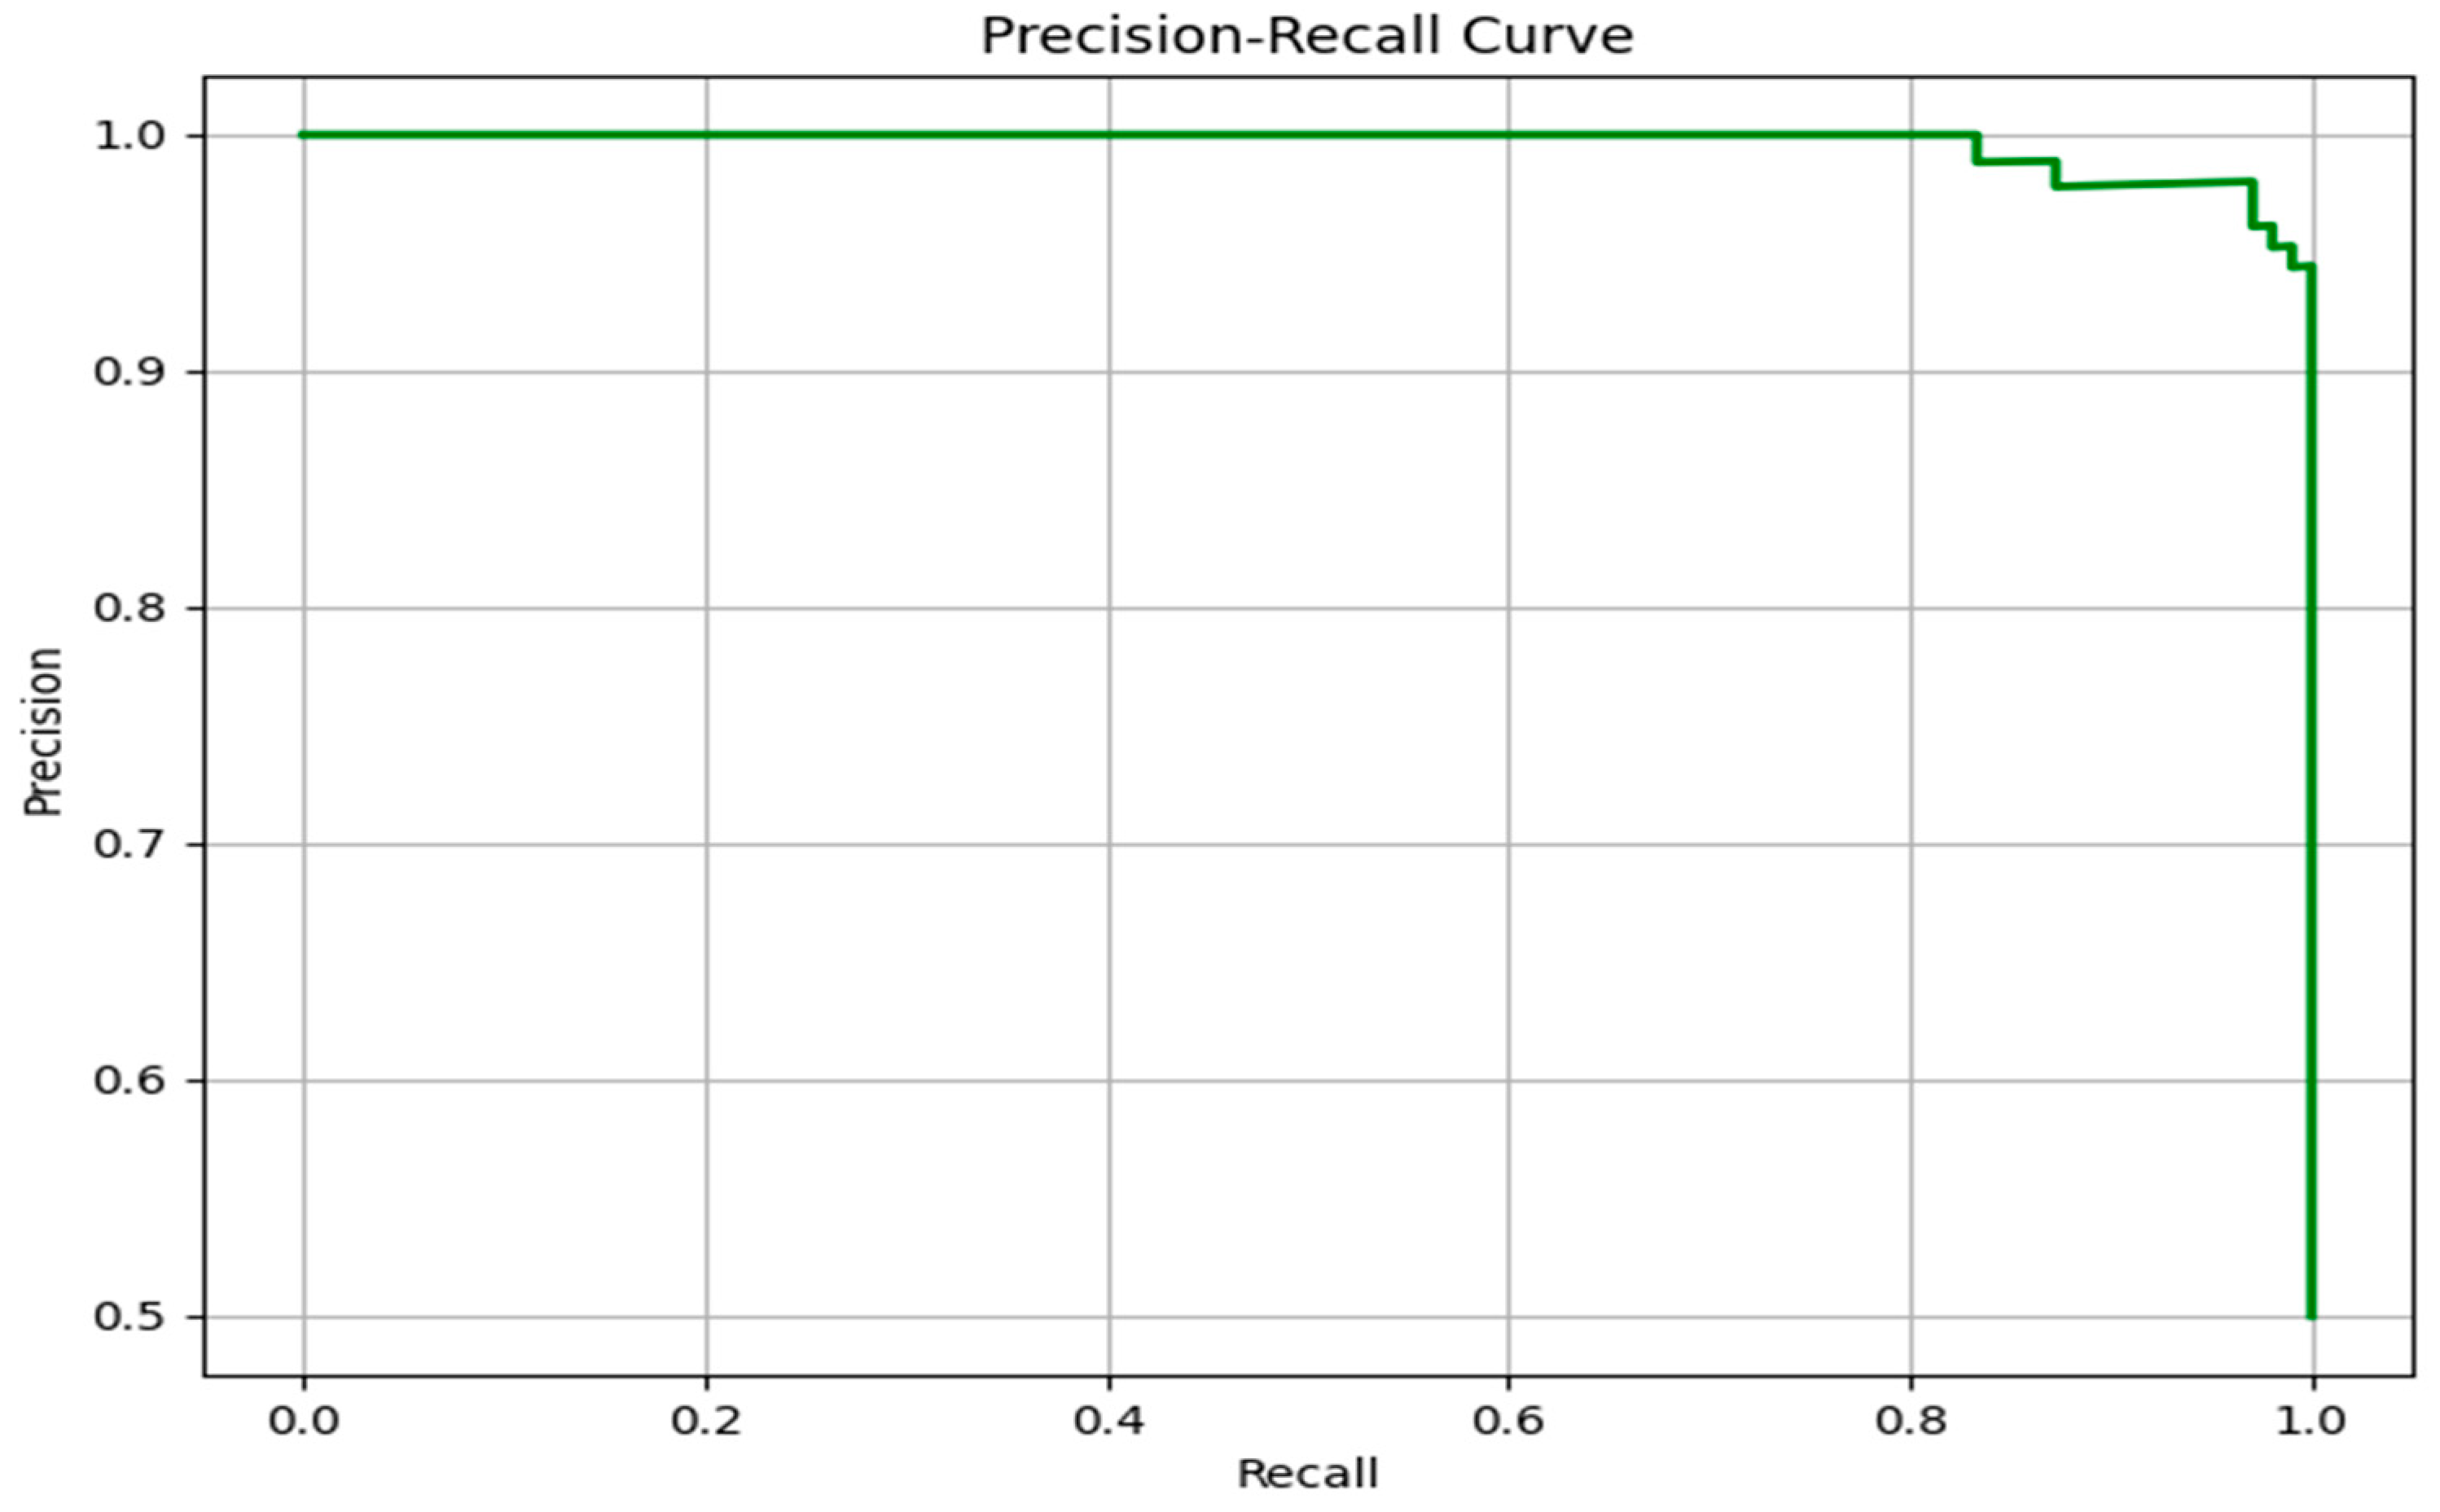
To further evaluate the predictive performance of the proposed model, particularly in the context of class imbalance that often characterizes clinical datasets, the Precision–Recall (PR) curve was analyzed. As illustrated in
Figure 7, the PR curve demonstrates an almost flat trajectory near the top of the plot, maintaining a precision close to 1.0 over a wide range of recall values. This indicates that the model is capable of retrieving the majority of true positive cases (high recall) while maintaining a very low rate of false positives (high precision).
Unlike the ROC curve, which can sometimes provide overly optimistic assessments in imbalanced datasets, the PR curve focuses specifically on the minority (positive) class. The near-perfect behavior of the PR curve confirms the model’s strong capability to prioritize relevant instances, making it especially suitable for real-world clinical applications where the cost of misclassification (e.g., false negatives) can be critical.
The sharp drop in precision only occurs when recall approaches its maximum, suggesting that the model remains reliable even when attempting to identify nearly all true positive cases. This performance highlights the robustness of the classifier, both in terms of sensitivity and in avoiding unnecessary false alerts. Overall, the PR curve complements the ROC analysis by providing a more nuanced understanding of the model’s discriminative capacity in imbalanced settings such as cardiovascular disease prediction.
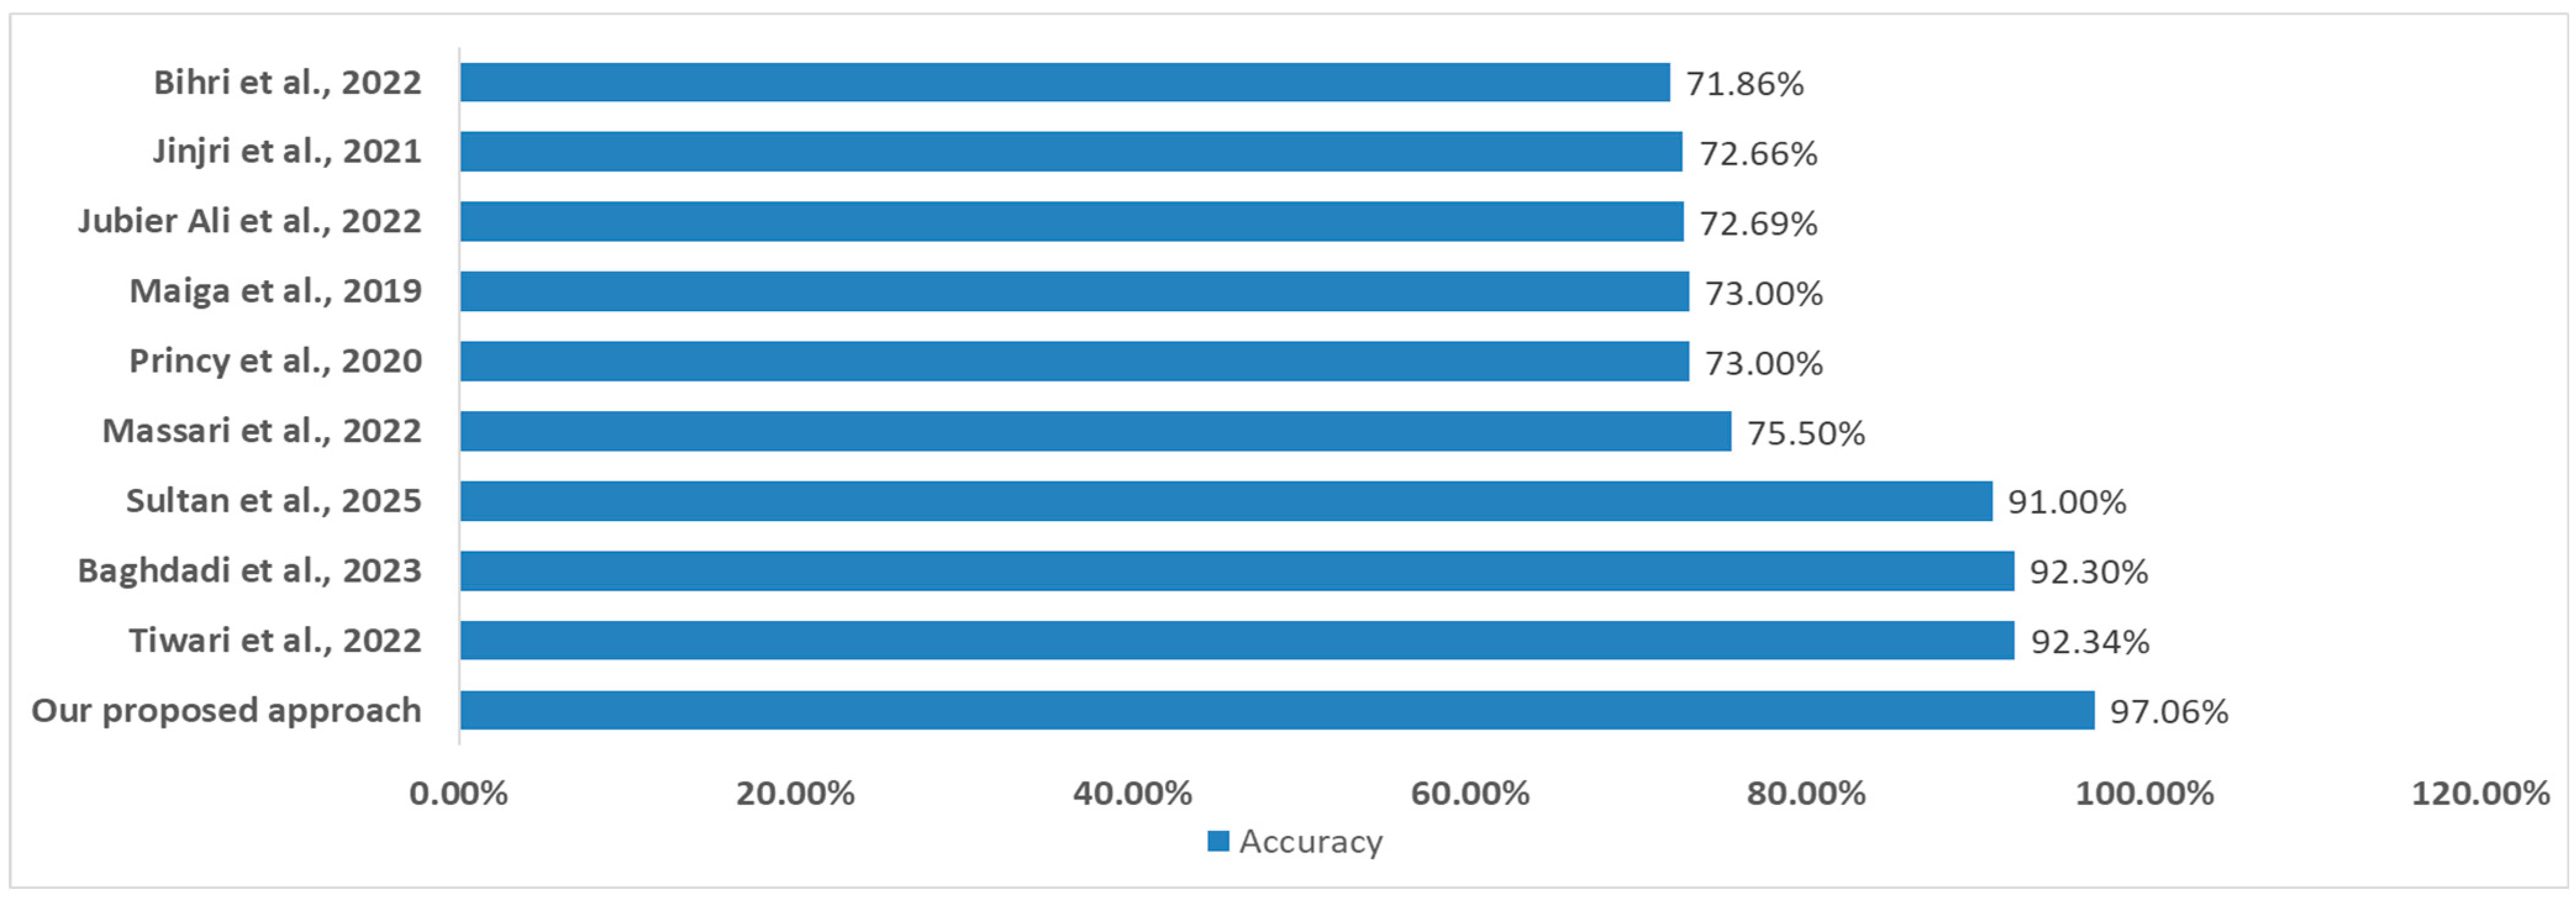
Finally, our proposed model achieves 97.06% accuracy, outperforming all existing approaches (
Figure 8) in cardiovascular disease prediction cited in the state of the art. Compared to Tiwari et al. (92.34%), Baghdadi et al. (92.30%), and Sultan et al. (91.00%), our model improves classification accuracy by 4–6%. Other studies show significantly lower performance (71.86–75.50%). These findings highlight the effectiveness of our optimized machine learning approach.
4. Conclusions
This study introduces a robust and high-performing machine learning framework for the prediction of cardiovascular diseases, achieving an accuracy of 97.06%, thereby surpassing several state-of-the-art models reported in the recent literature. Our results demonstrate a clear improvement over previously published works, many of which reported accuracies ranging from 85% to 93% using traditional classifiers or shallow ensemble methods. This significant performance gain highlights the originality of our approach, particularly in its architectural design and methodological rigor.
The novelty of our framework lies in the strategic use of ensemble learning through a customized stacking model that integrates Random Forest, Support Vector Machine, and CatBoost as base learners, with a Multilayer Perceptron serving as a meta-learner. This combination leverages both tree-based interpretability and deep learning’s representational power, enabling the model to capture complex, nonlinear interactions within high-dimensional clinical datasets—an aspect often overlooked in earlier studies. Furthermore, the inclusion of an advanced preprocessing pipeline and robust feature selection based on SHAP values ensures both predictive stability and interpretability.
In comparison to existing models in the literature, our framework exhibits superior generalization performance while maintaining computational efficiency. While many prior works relied on single-model approaches or limited ensemble techniques, our method demonstrates that hybrid stacking strategies incorporating deep learning layers can offer a substantial edge in both accuracy and clinical relevance.
These findings underscore the strong potential of ensemble-based architectures, particularly those enhanced by deep learning components, to significantly improve the early detection of cardiovascular diseases and support clinicians in making timely and informed decisions. However, transitioning from theoretical validation to real-world deployment remains a critical challenge. Future research should focus on real-time applicability in clinical settings, integration of heterogeneous data sources (e.g., electronic health records, wearable devices, imaging, and genomics), and comprehensive validation across larger and more diverse patient populations. These steps are essential to ensure the scalability, reproducibility, and generalizability of the proposed framework, ultimately contributing to the development of reliable AI-driven tools in precision cardiology.


