

A Fused Multi-Channel Prediction Model of Pressure Injury for Adult Hospitalized Patients—The “EADB” Model


Abstract
1. Introduction
2. Literature Review
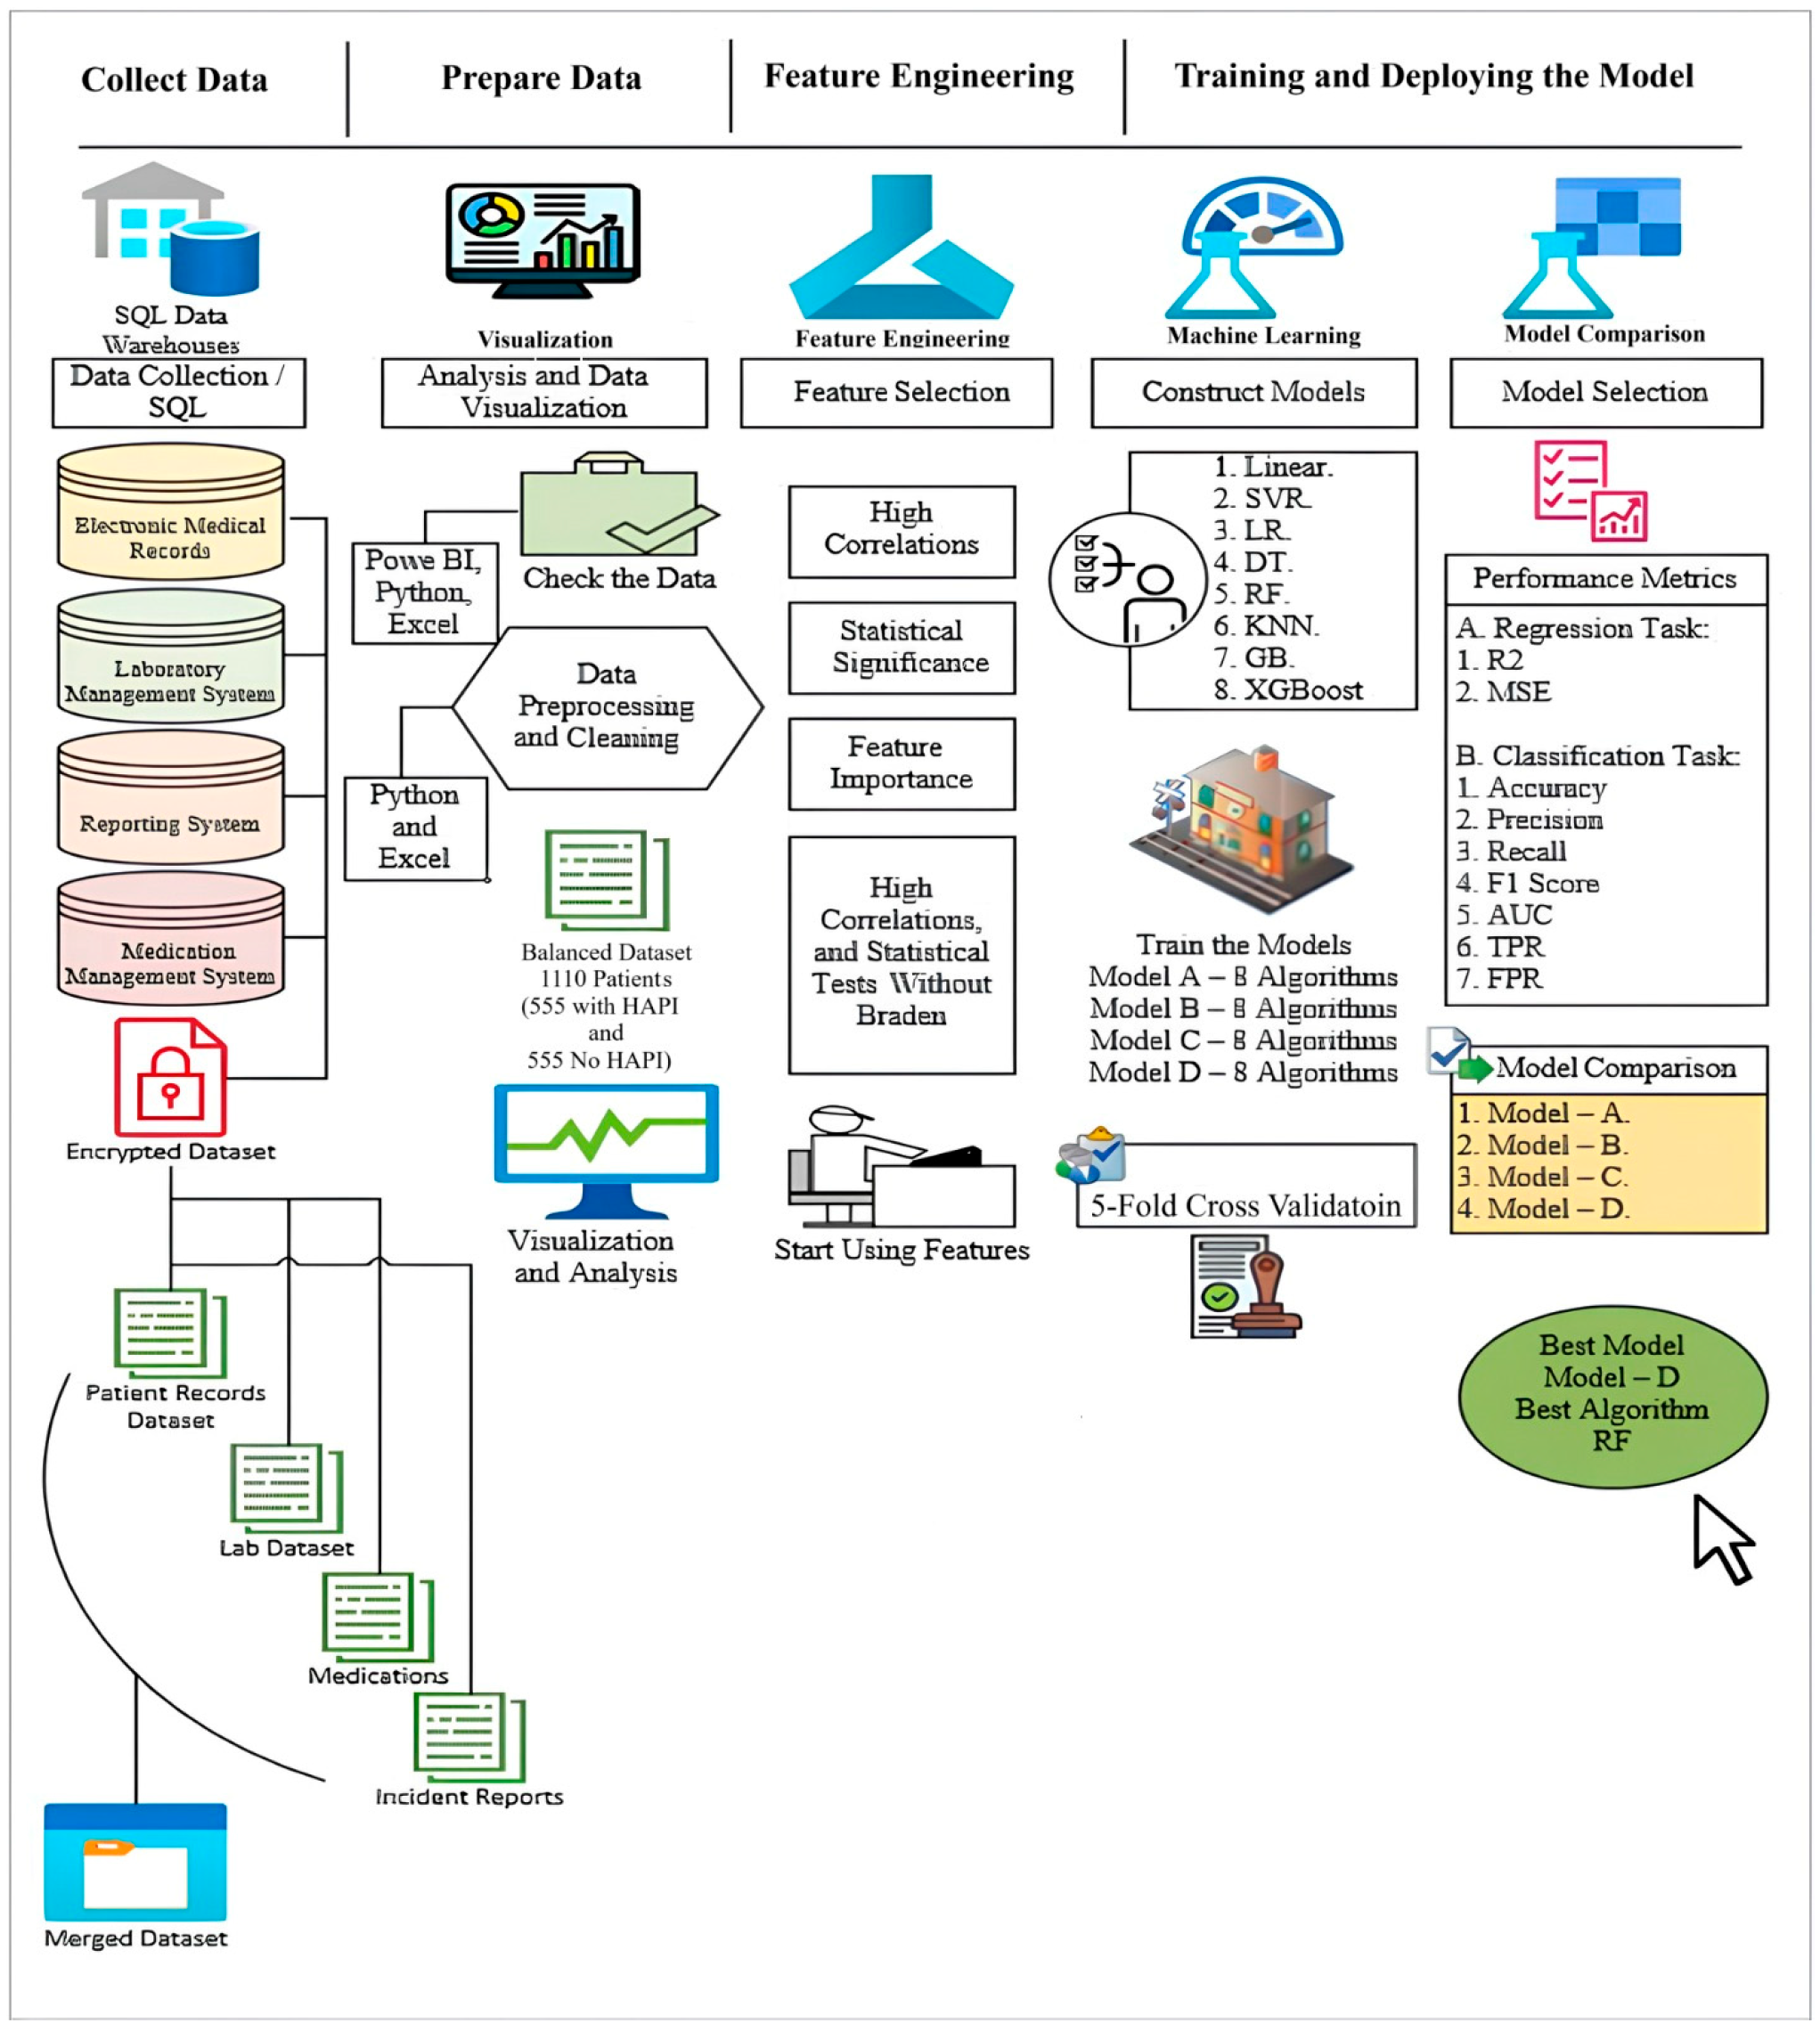
3. Materials and Methods
3.1. Data Collection
3.2. Data Processing
3.3. Exploratory Data Analysis
3.3.1. Risk Factors
3.3.2. Medications
3.3.3. Biomarkers (Laboratory Tests)
3.3.4. Pressure Injury
3.4. Feature Engineering
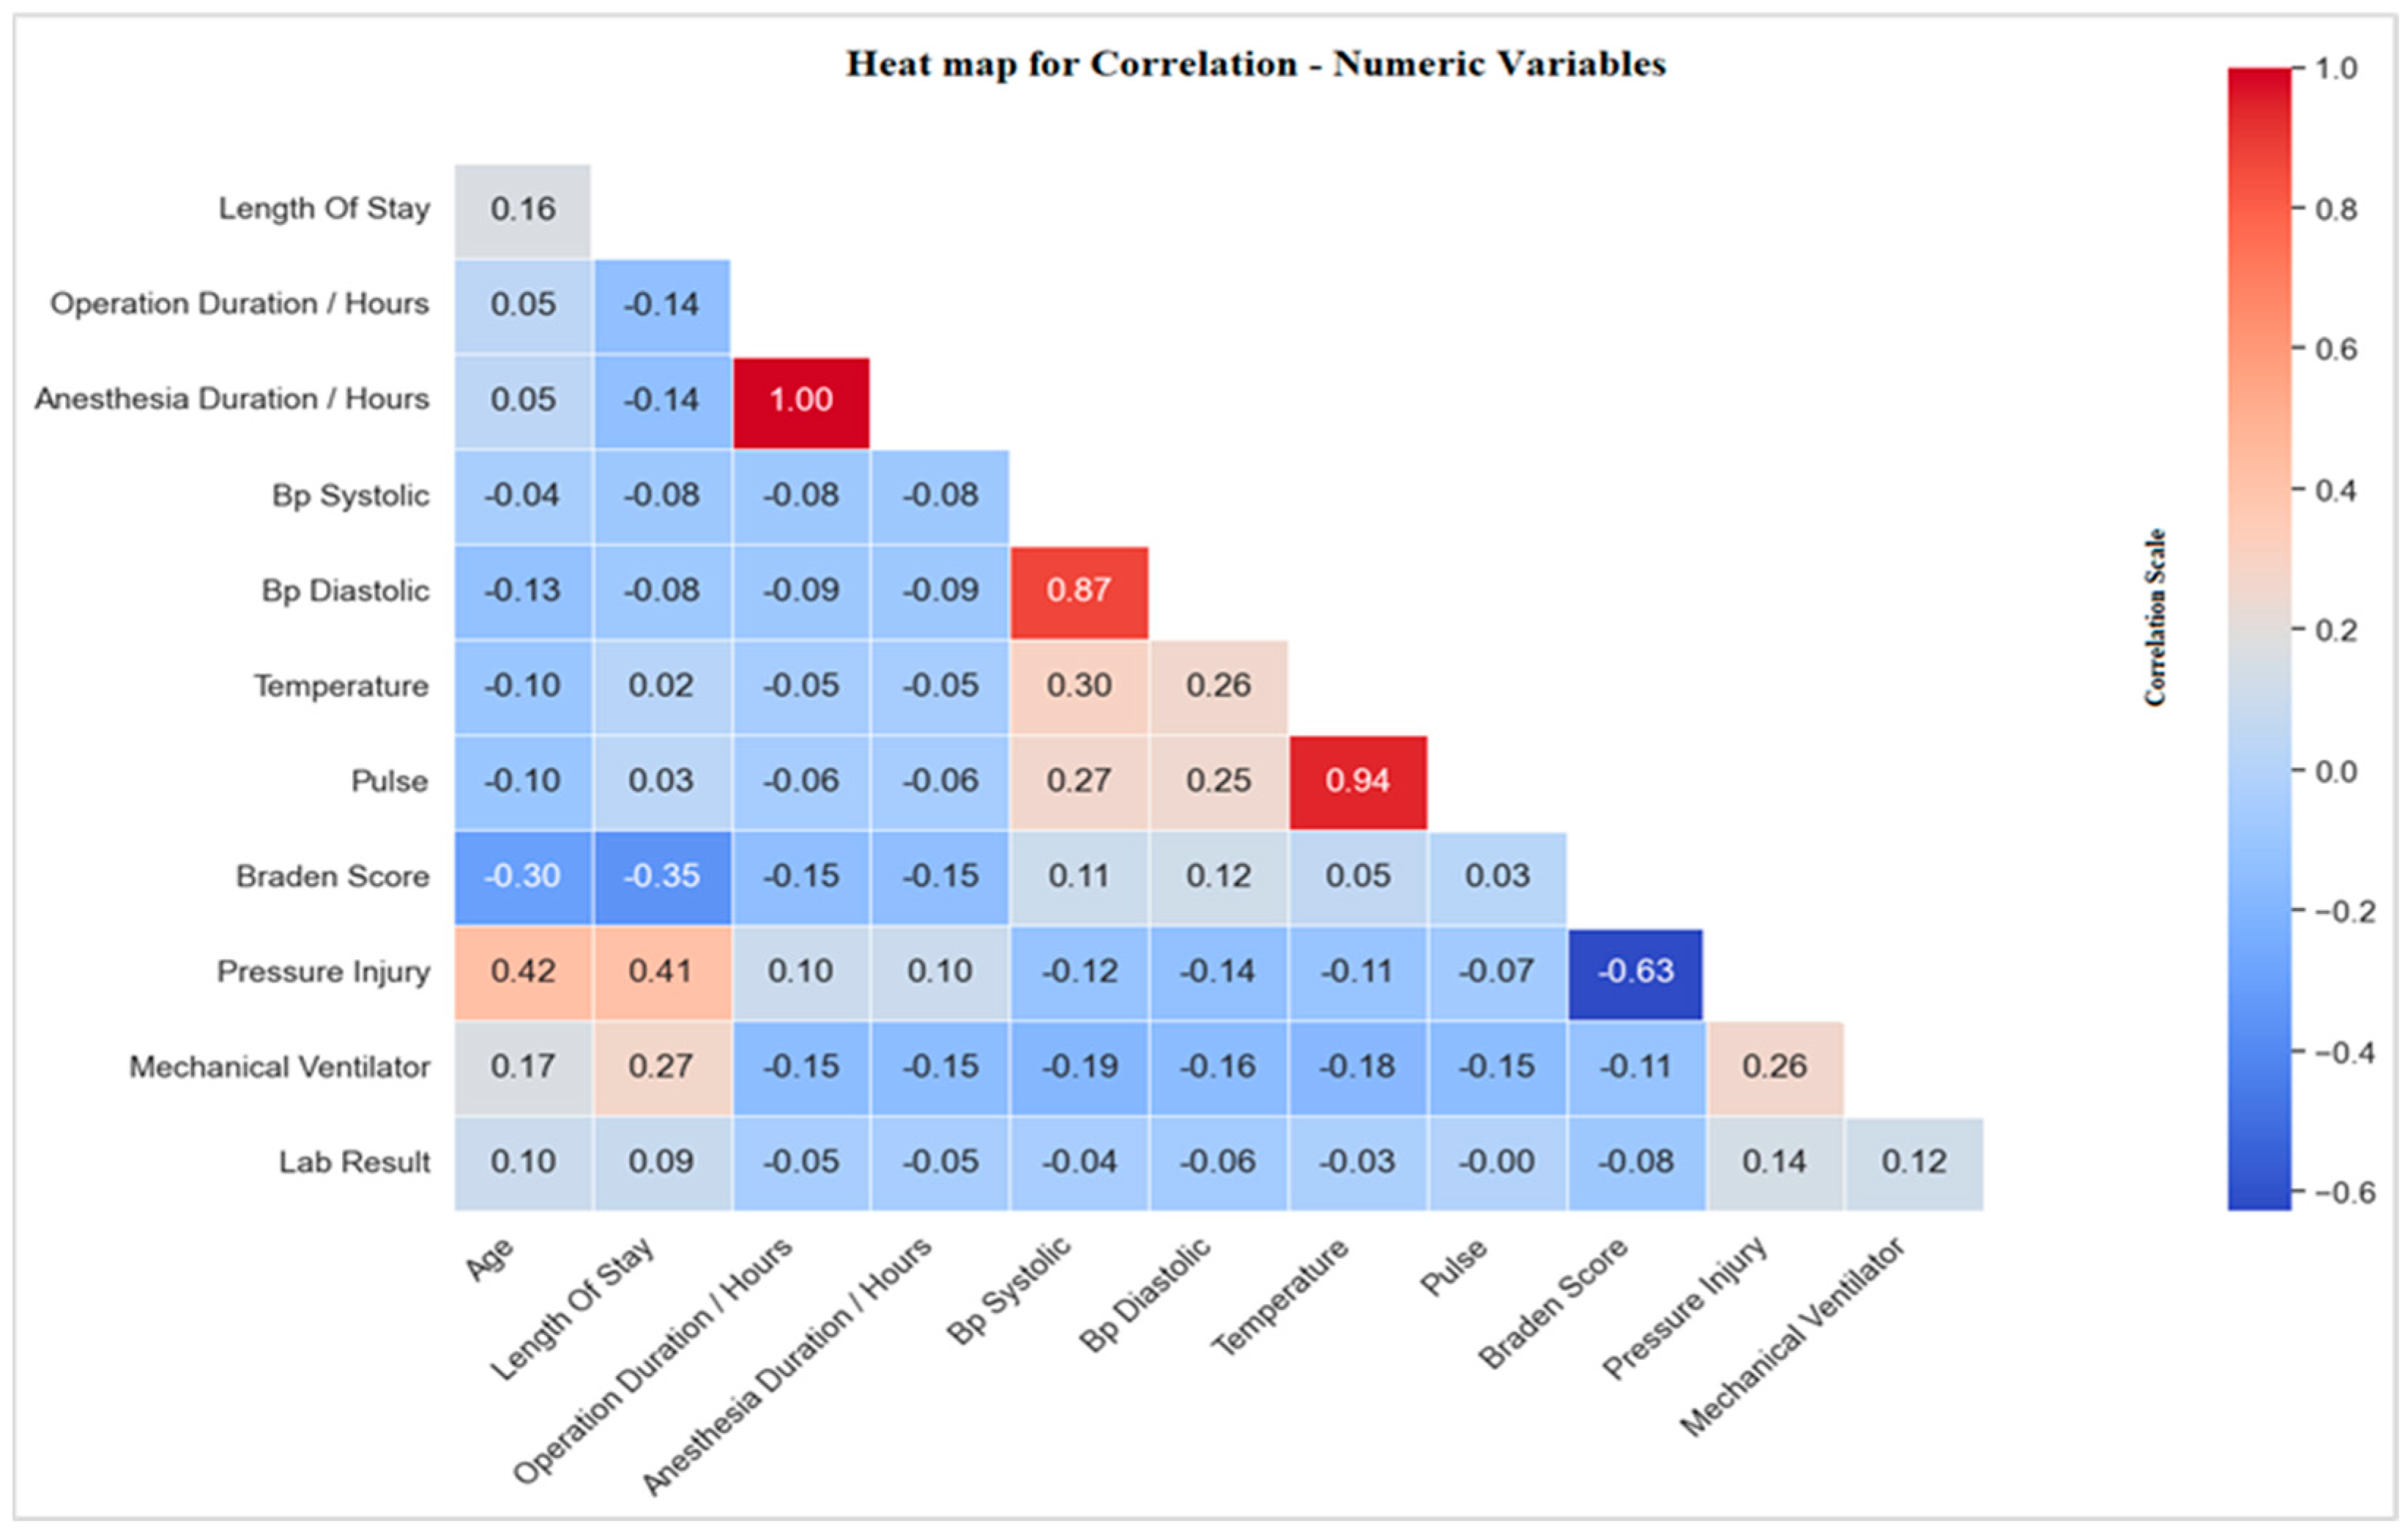
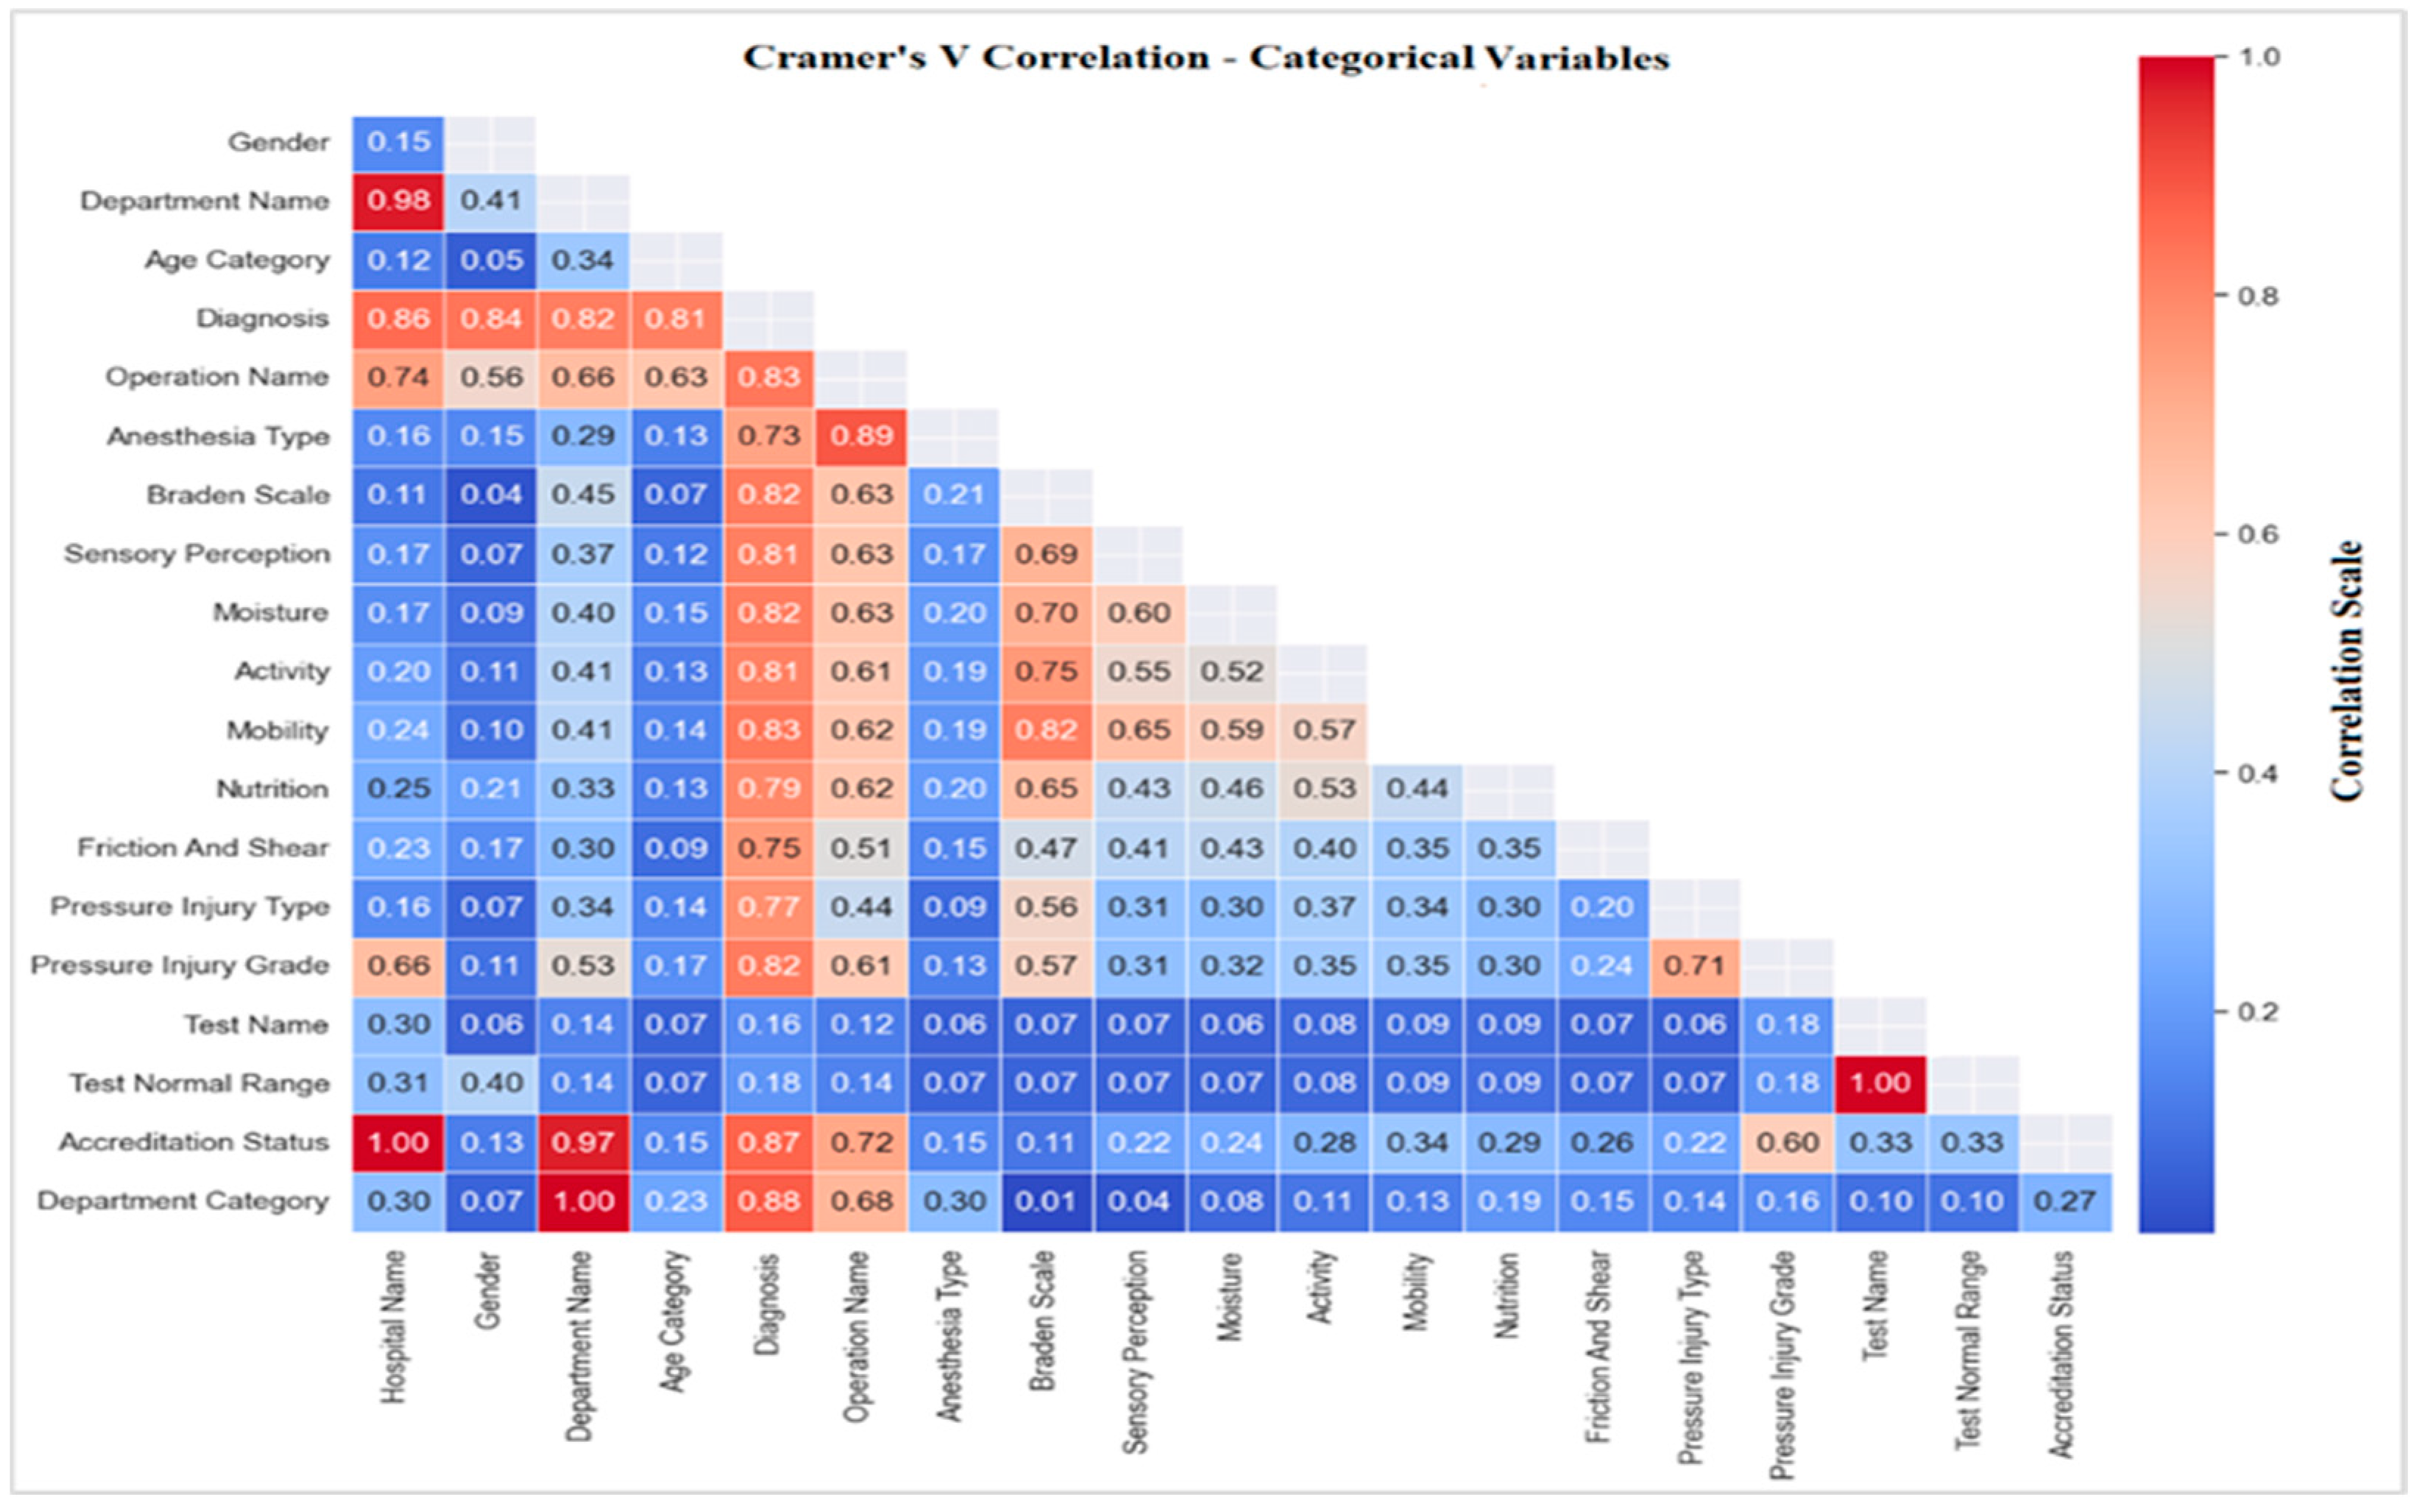
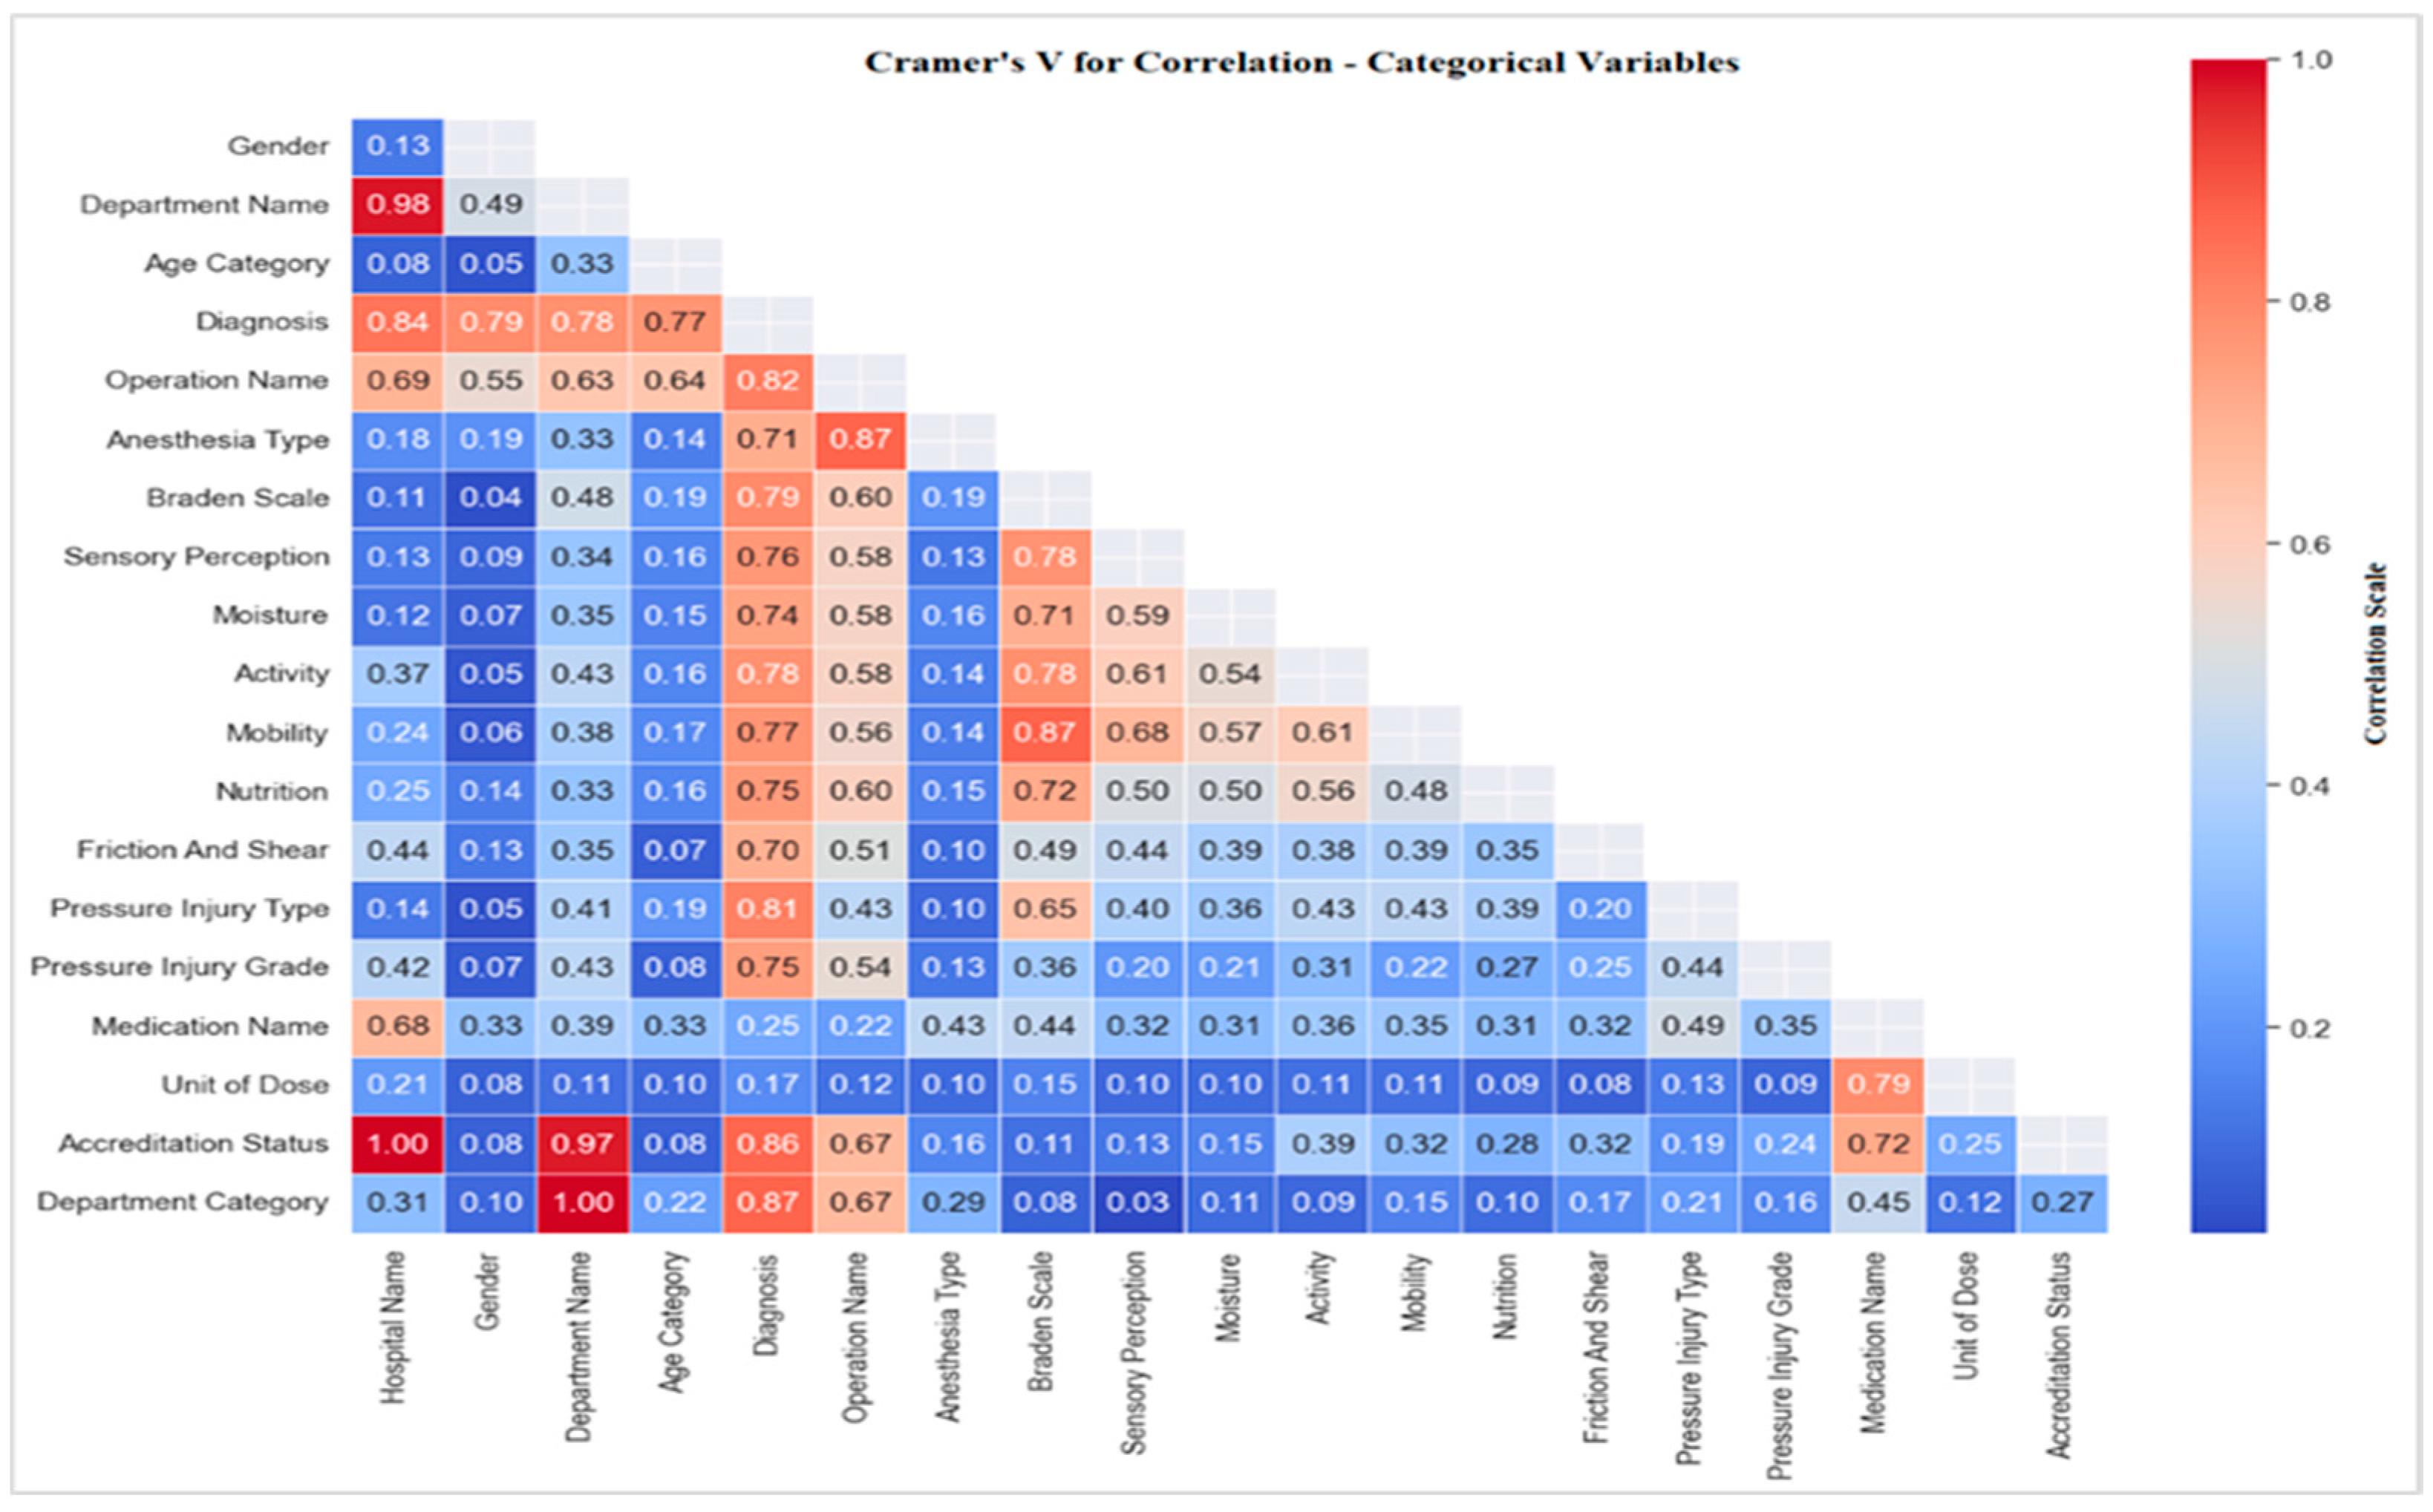
3.4.1. Correlations with Pressure Injury
Correlation of Pressure Injury with Risk Factors
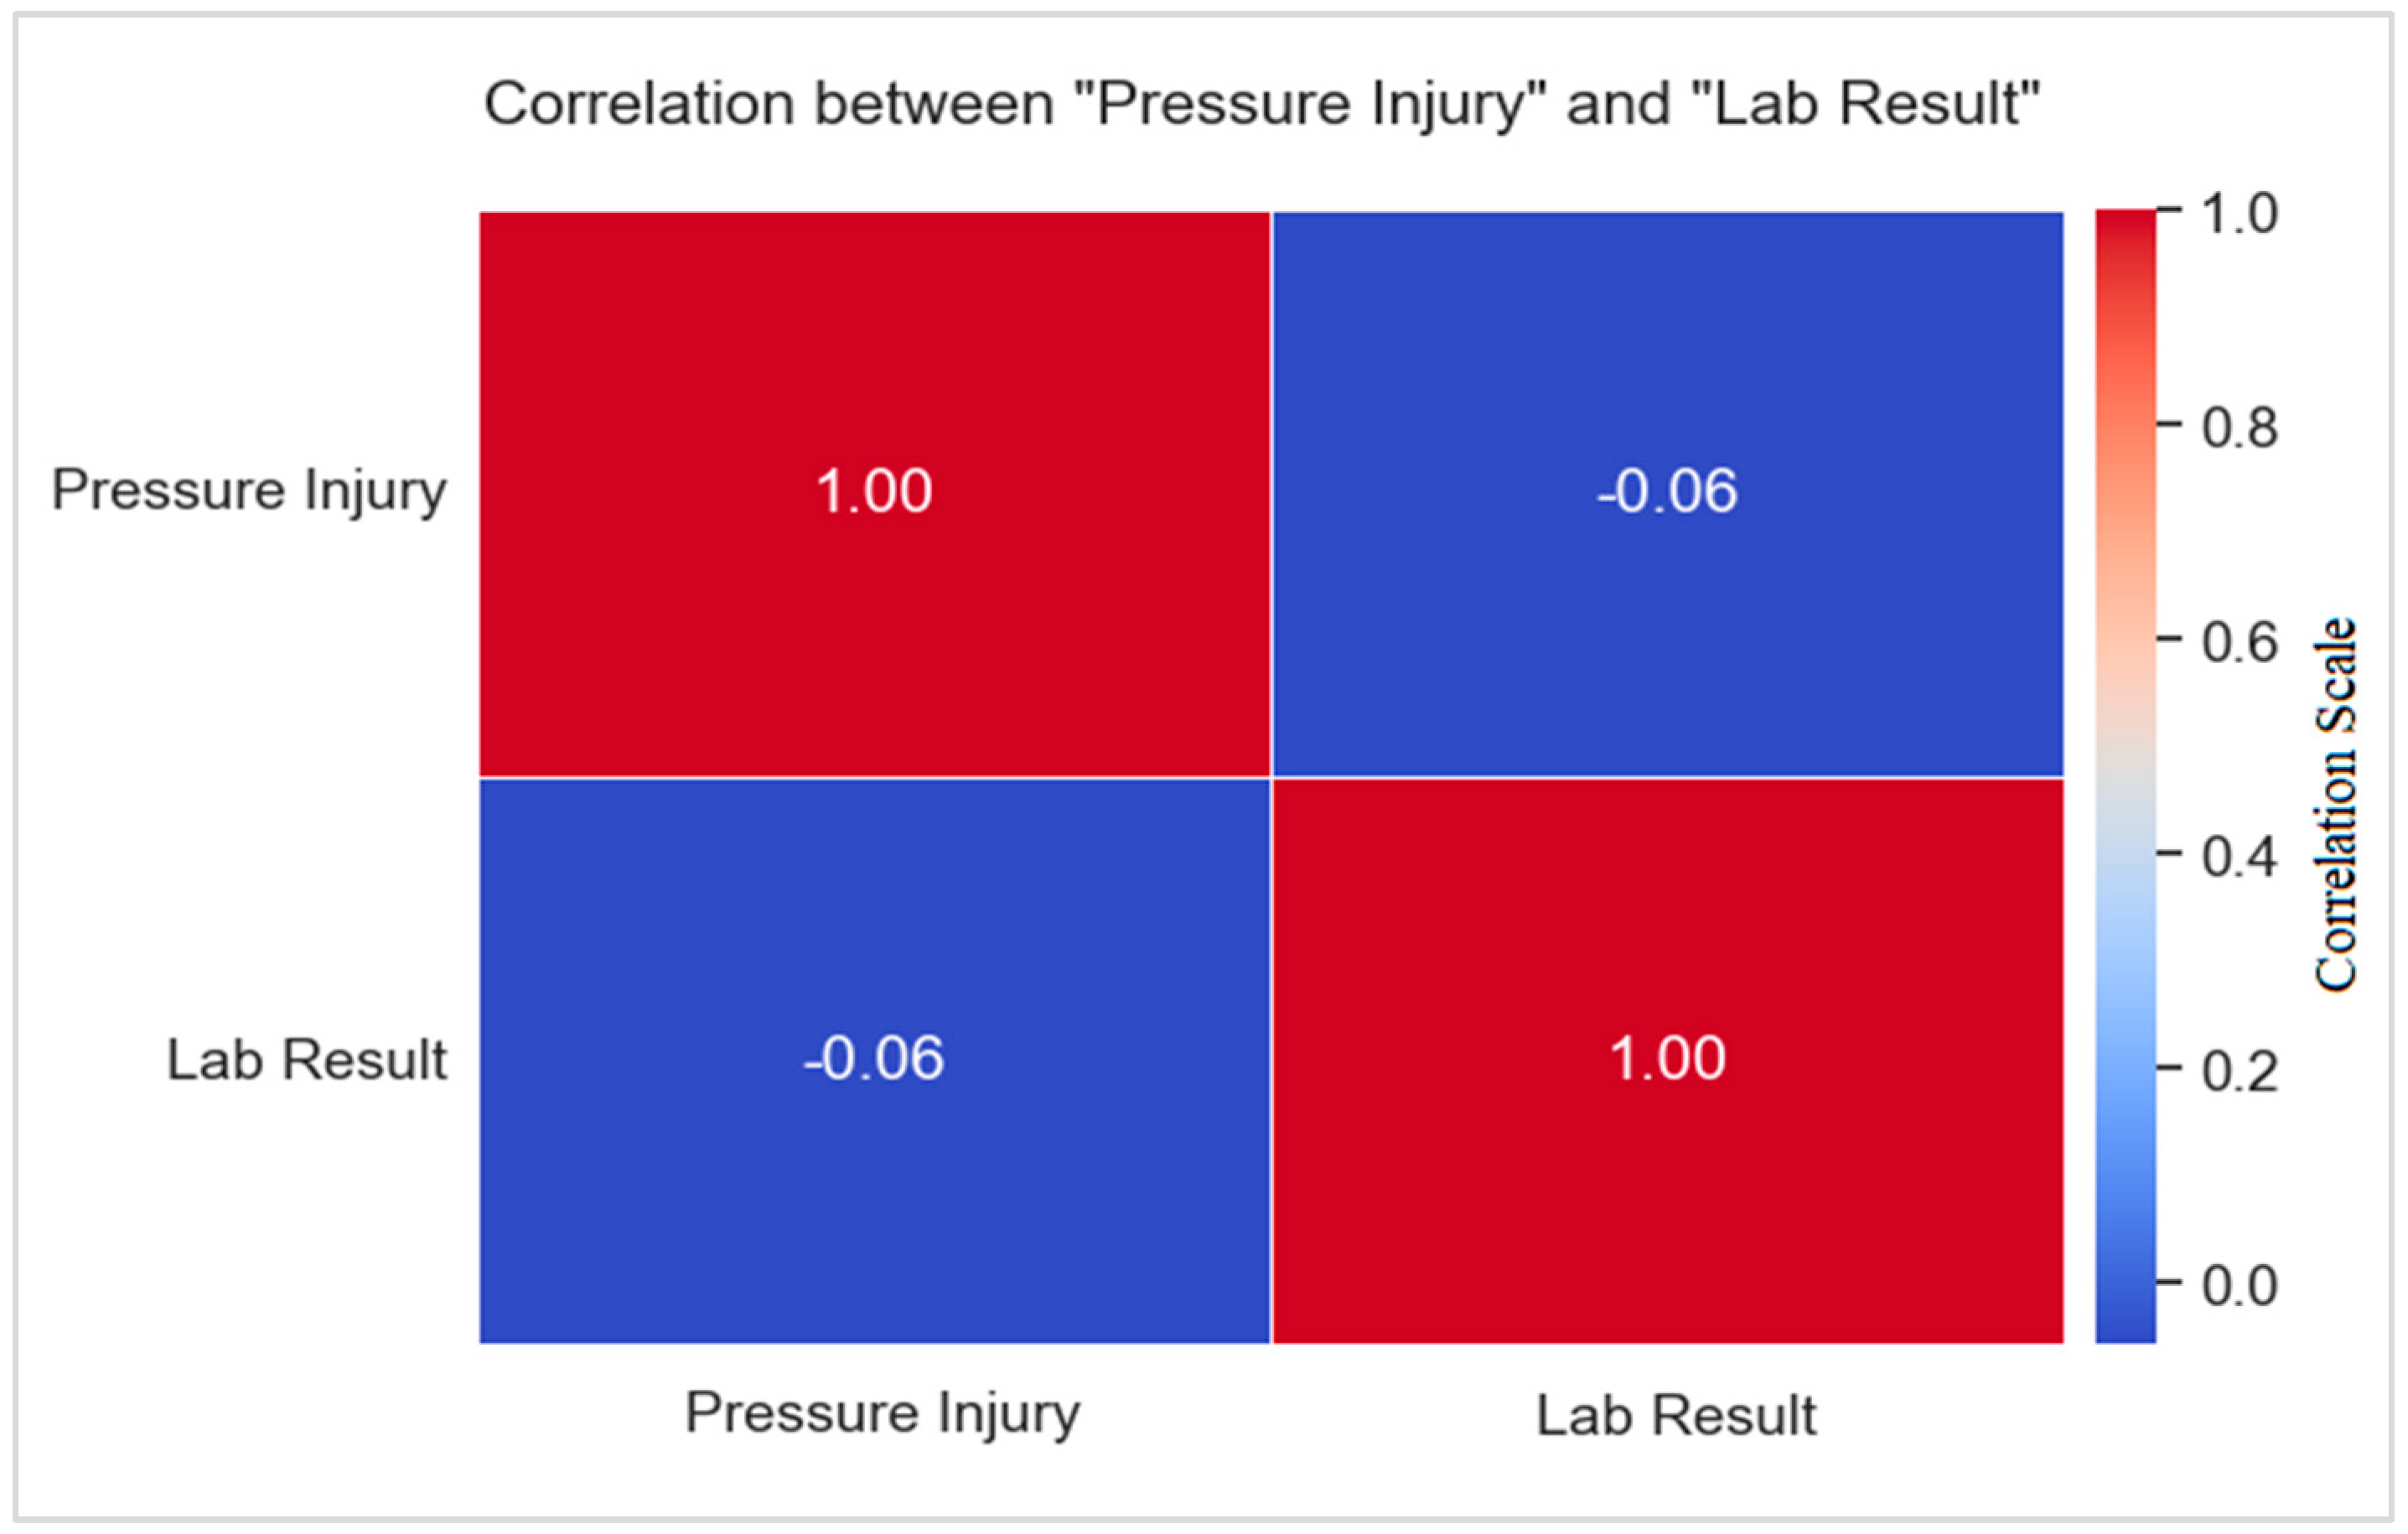
Correlation of Pressure Injury with Biomarkers (Laboratory Tests)
3.4.2. Statistical Tests
Statistical Test of Pressure Injury with Biomarkers (Laboratory Tests)
Statistical Test of Pressure Injury with Risk Factors
3.5. Constructing Models by Using Machine Learning Algorithms
- Linear regression was used to predict the dependent (y) from the independent (X) variables, and this prediction assumes that the two variables have an association such as a linear association [59].
- SVR was identified as part of the regression techniques and was considered a supervised learning algorithm. SVR can be predicted from training and test datasets, and its aim is to identify a function that is as flat as possible while also matching all the training data. It works to find the fit line and decrease the error or gap between the predicted and actual value [60].
- LR was utilized, which compares the data to a logistic function; it makes predictions about the chance that an incidence will occur, and the results fall between 0 and 1 [58].
- DT is a flowchart-like tree; each branch in the tree is considered a rule, and each leaf is considered an outcome for each rule. This algorithm works by selecting the best feature or attribute from all available features and considering the results of maximum information. This algorithm did not rely on a straightforward formula, and each path from the root to the leaf represents a DT. The paths classify the new entry or instance determined previously and based on the feature values in the original tree until the leaf node is built [61].
- RF was one of the classification algorithms and can be used for regression tasks. This algorithm works similarly to the DT algorithm and generates many trees in the training phase and testing phase, which results in stable results; for this reason, RF was also used in cross-validation. No equation was used in regression [61]. Its purpose is to construct a model that uses basic decision rules deduced from data attributes to forecast the value of a target variable. It divides the data according to specified criteria; there is no set formula for this, but instead, metrics, such as information gain [62].
- KNN is a basic instance-based learning method. A new instance is categorized using similarity metrics (such as distance functions). A query point is allocated to the data class with the greatest number of representatives among its nearest neighbors, and classification is determined by a simple majority vote of each point nearest neighbors [63].
- GB is an ensemble technique where new models are created, which predict the residuals or errors of prior models, and then added together in a stage-wise fashion. It combines the weak learners and creates a strong predictive model and is used to minimize errors for the new model; “boosting” means that each model corrects the errors of the previous model, the key idea is to set the target outcomes for this new model to minimize the loss function [64].
- XGBoost is an efficient implementation of a gradient-boosting framework. This algorithm uses a GB framework at the core but is optimized for speed and performance. Like GB, it involves creating new models that predict the residuals of prior models. It has unique features like handling missing data, regularization to avoid overfitting, and tree pruning [65].
3.6. Perfromance Evaluation
4. Results
4.1. Risk Factors Training and Testing Distribution
4.2. Prediction Models of Pressure Injury
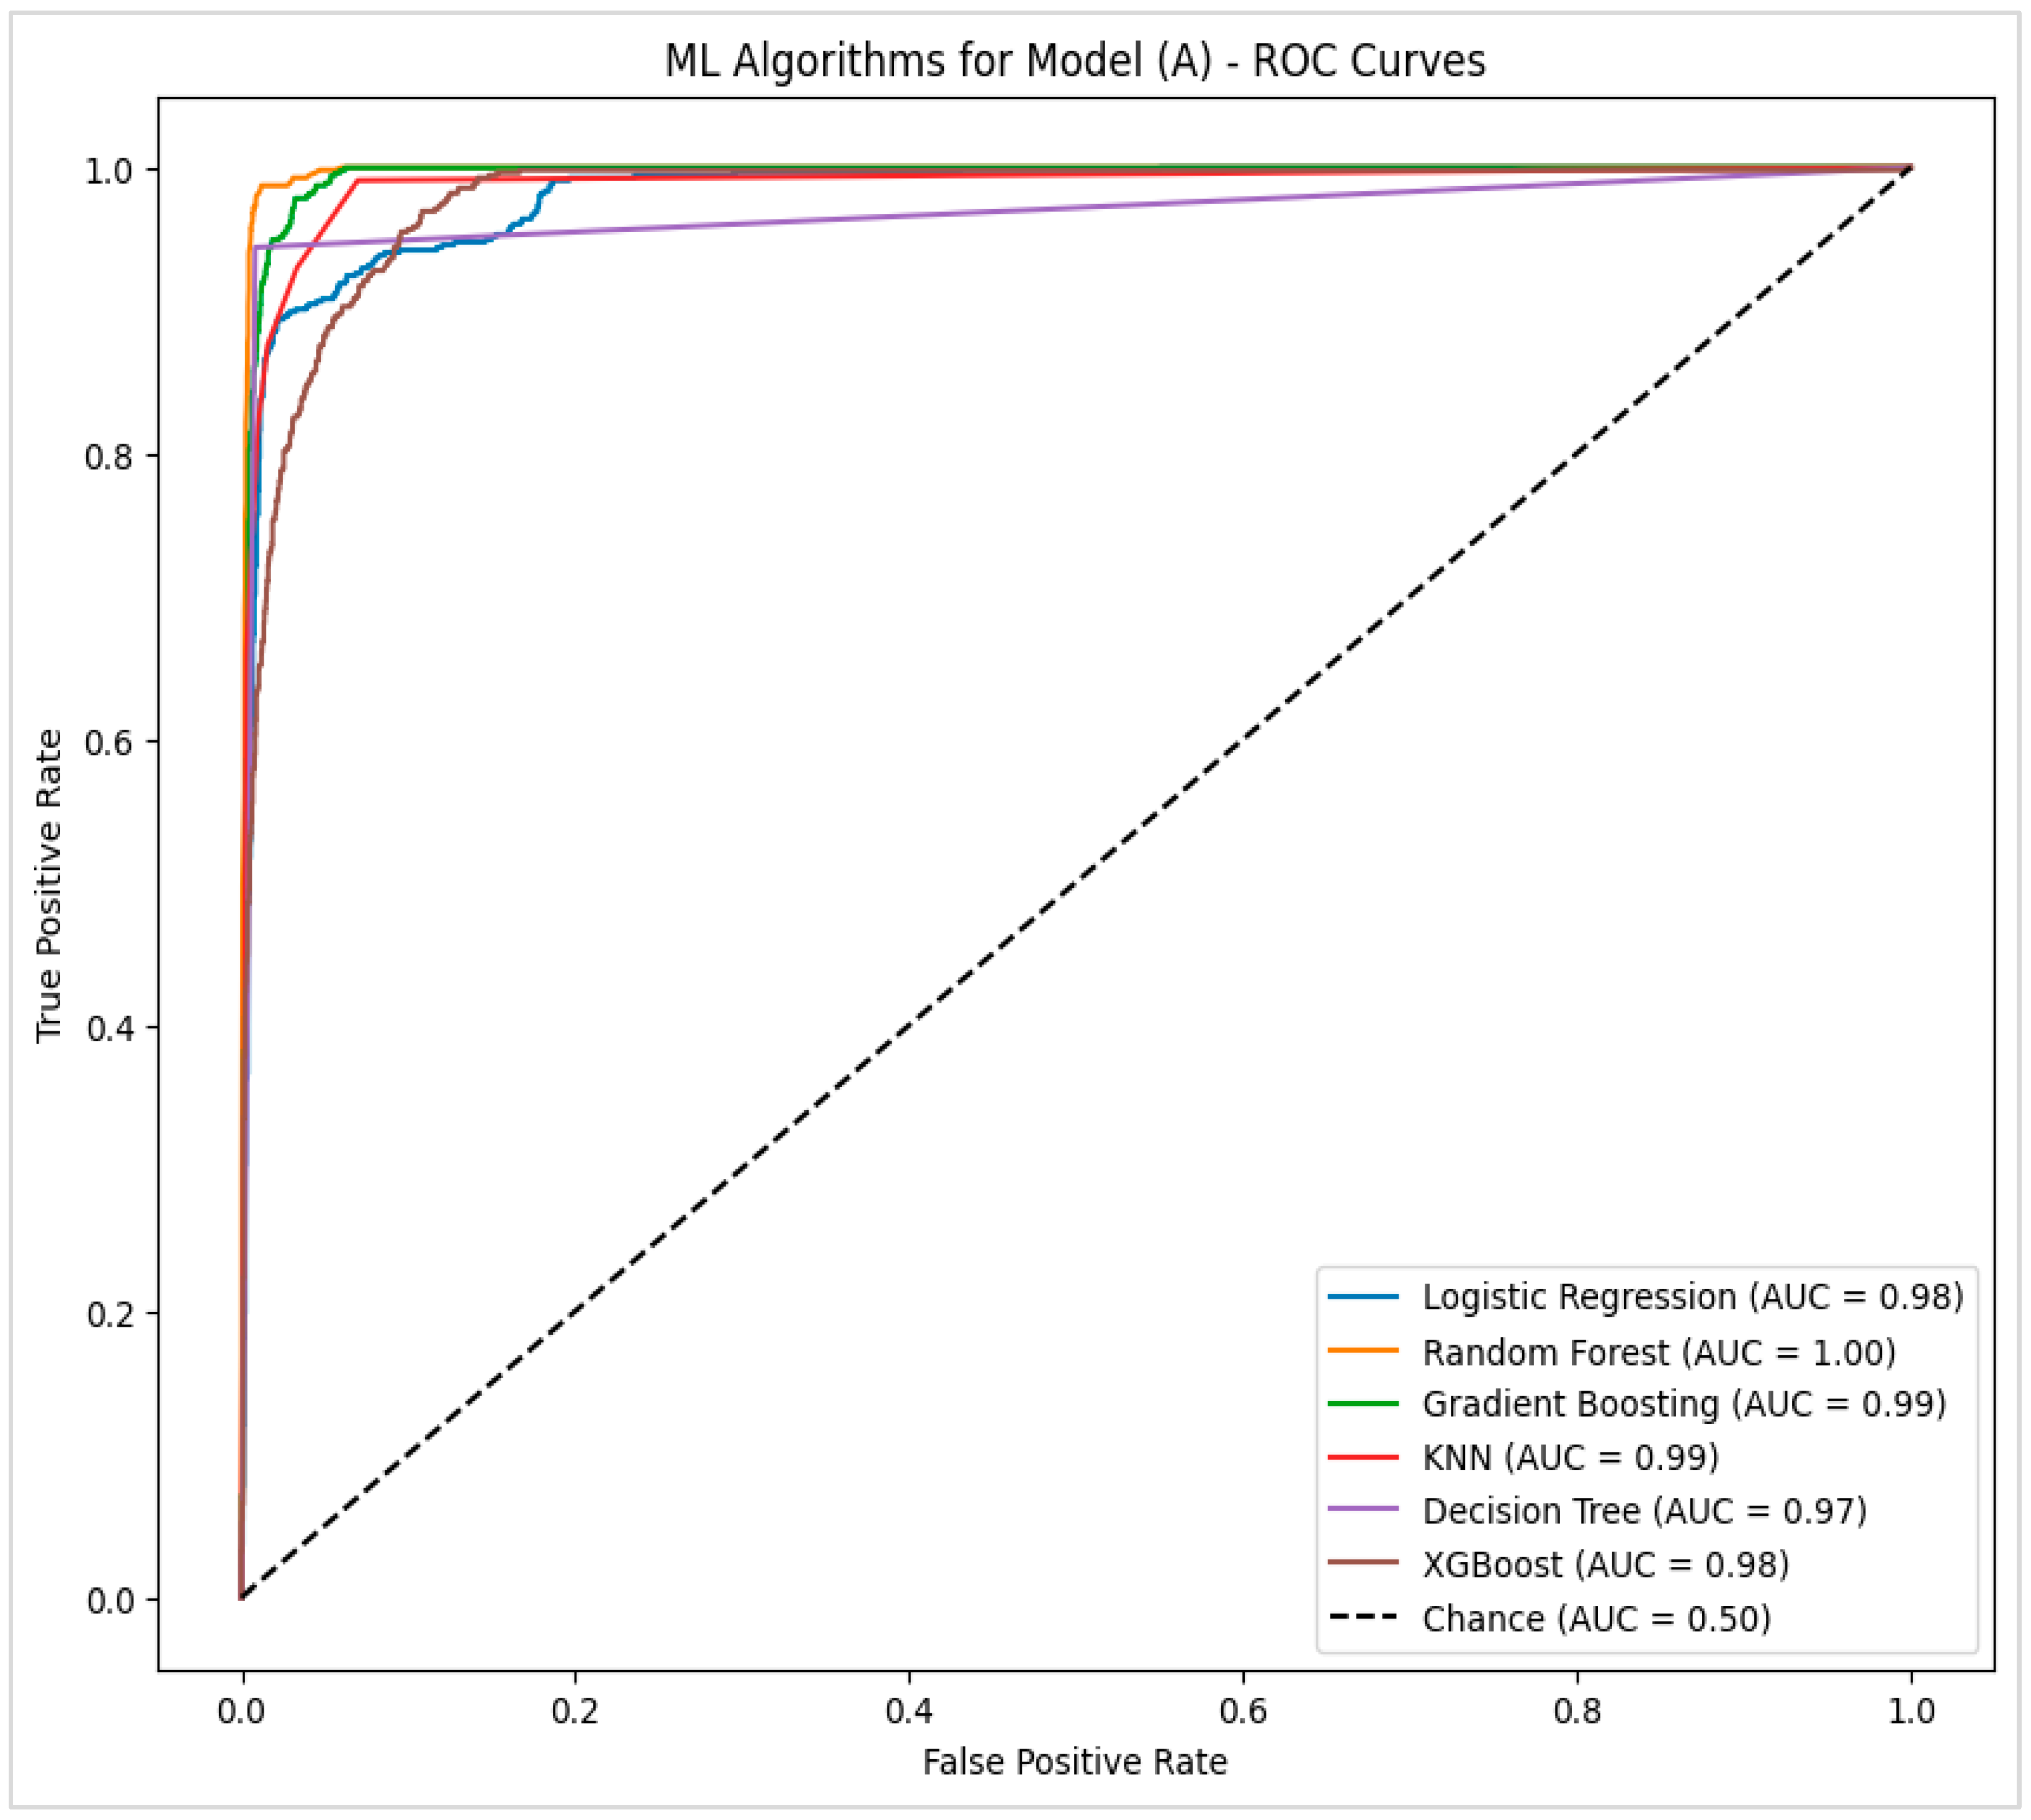
4.2.1. Model (A)—Potential Factors That Had a High Correlation with Pressure Injury
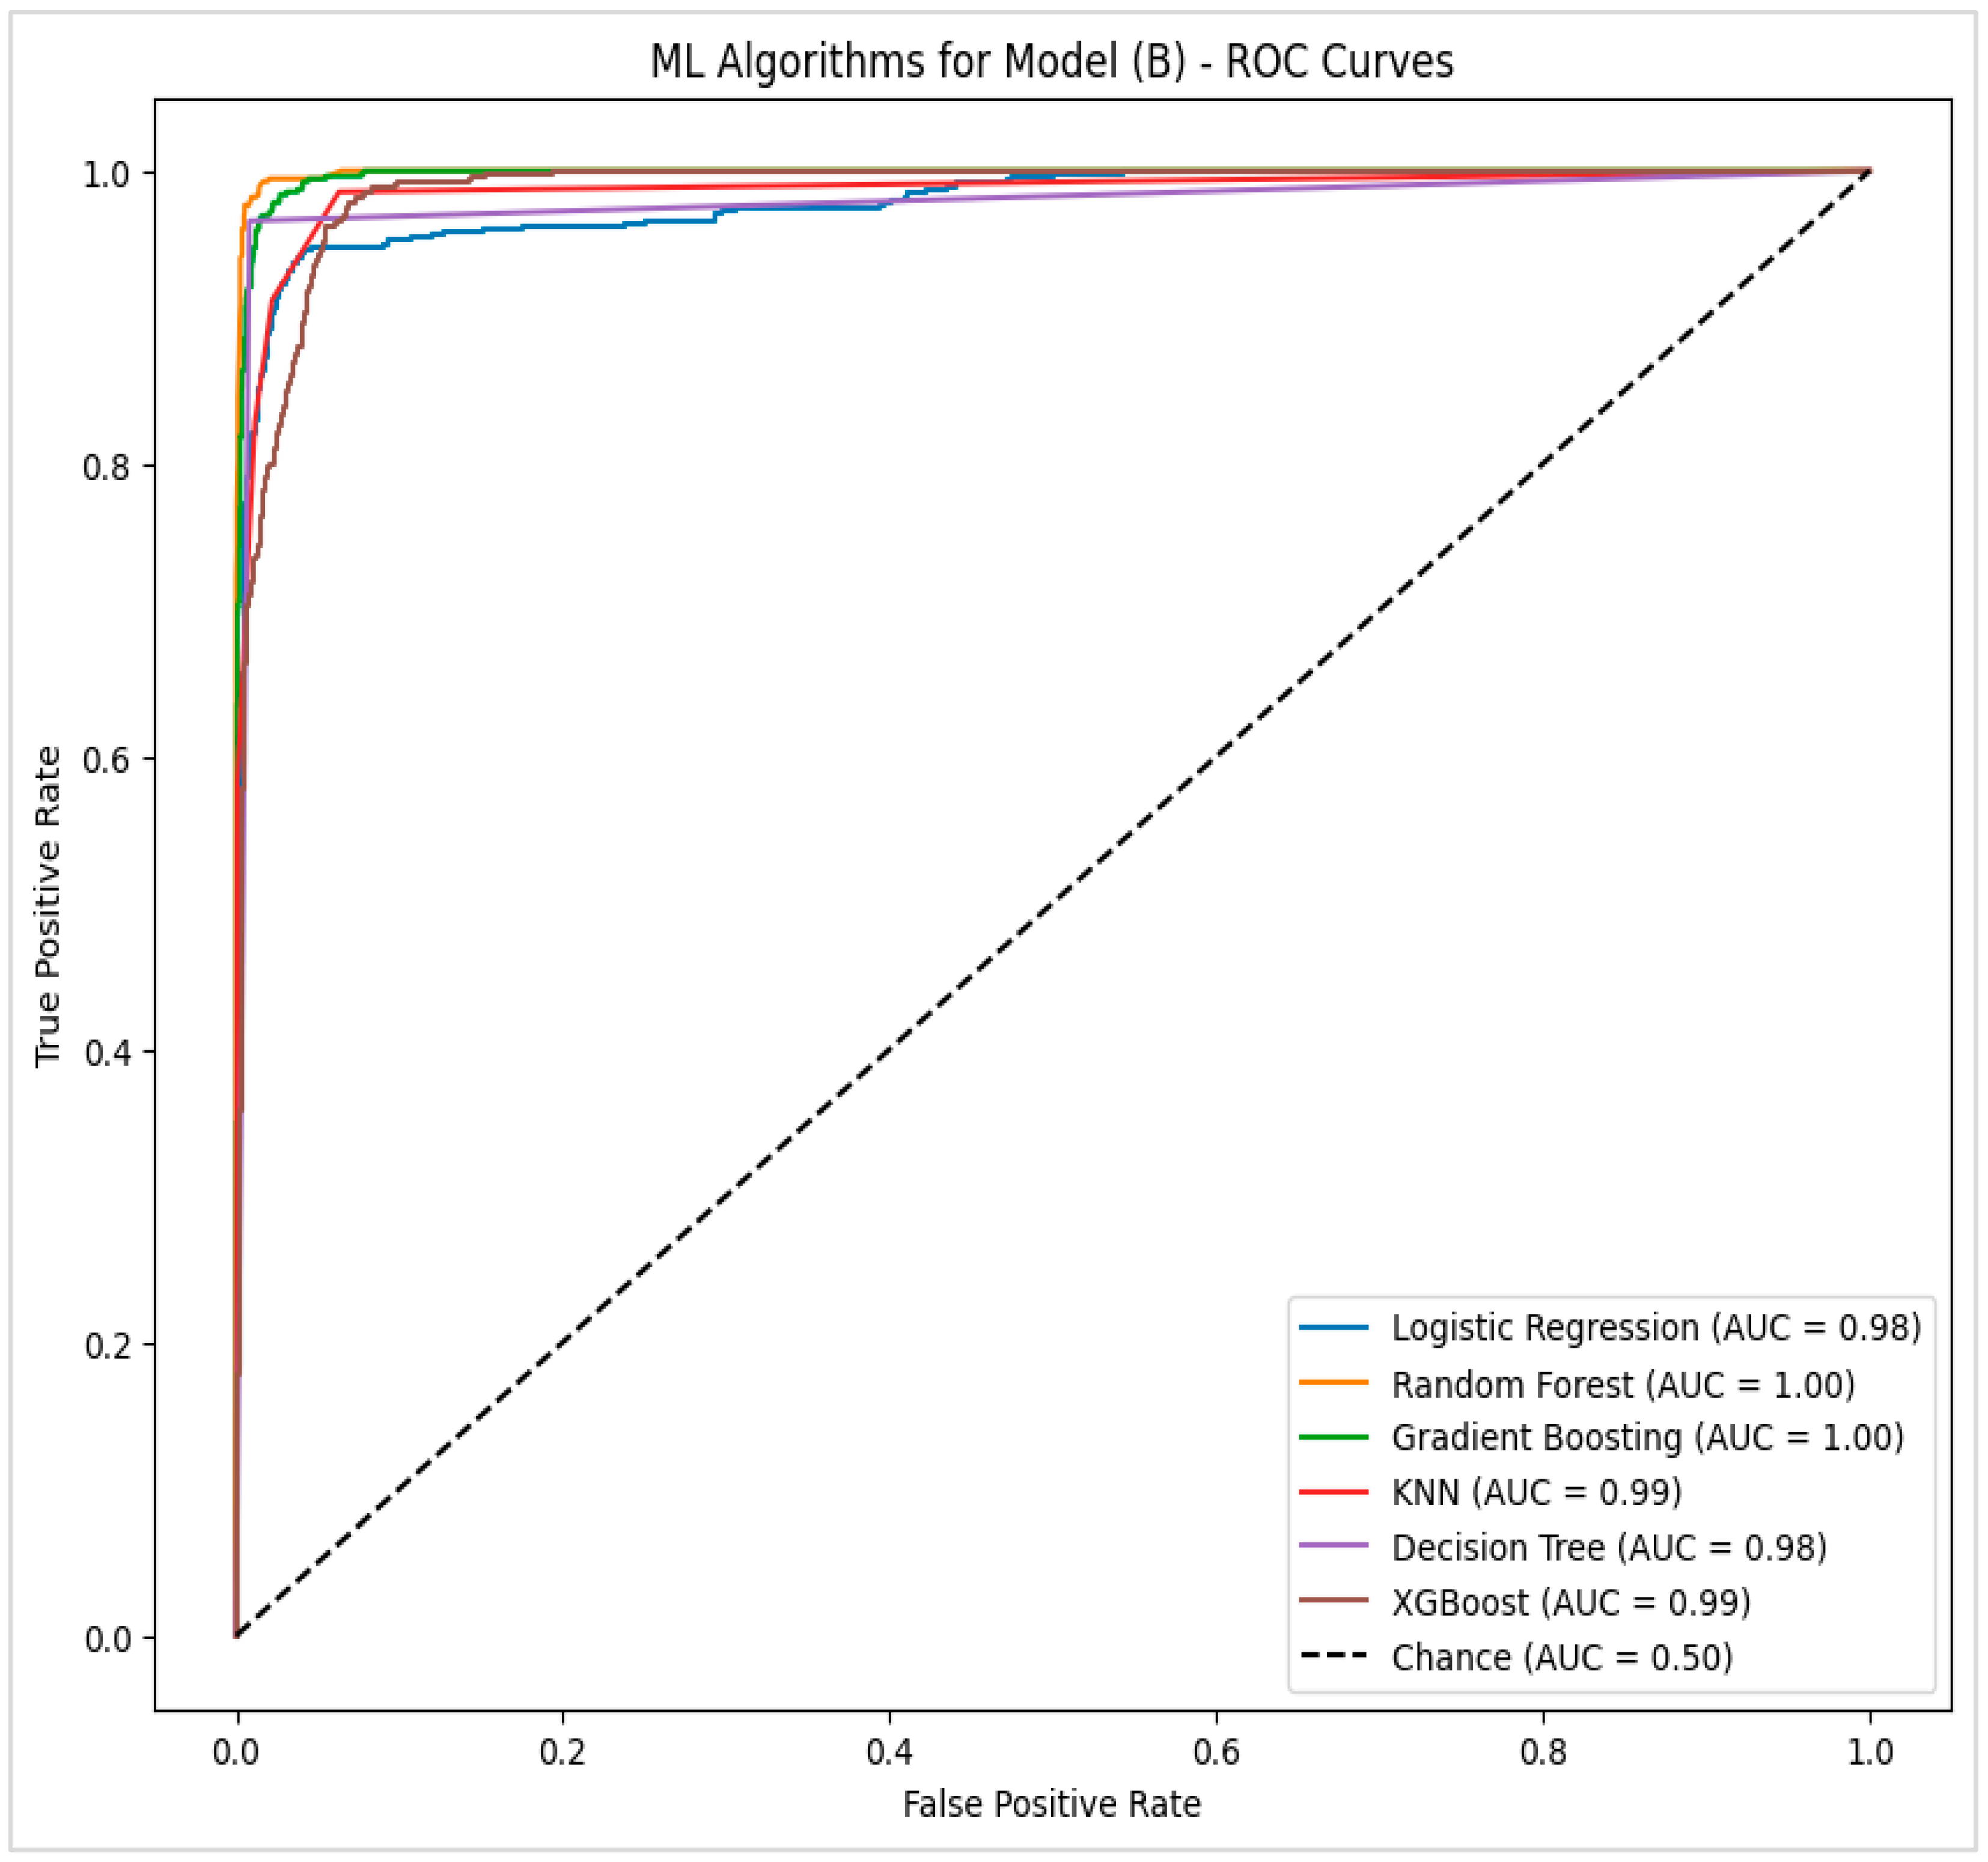
4.2.2. Model (B)—Potential Factors with Significant Statistical Tests for Pressure Injury
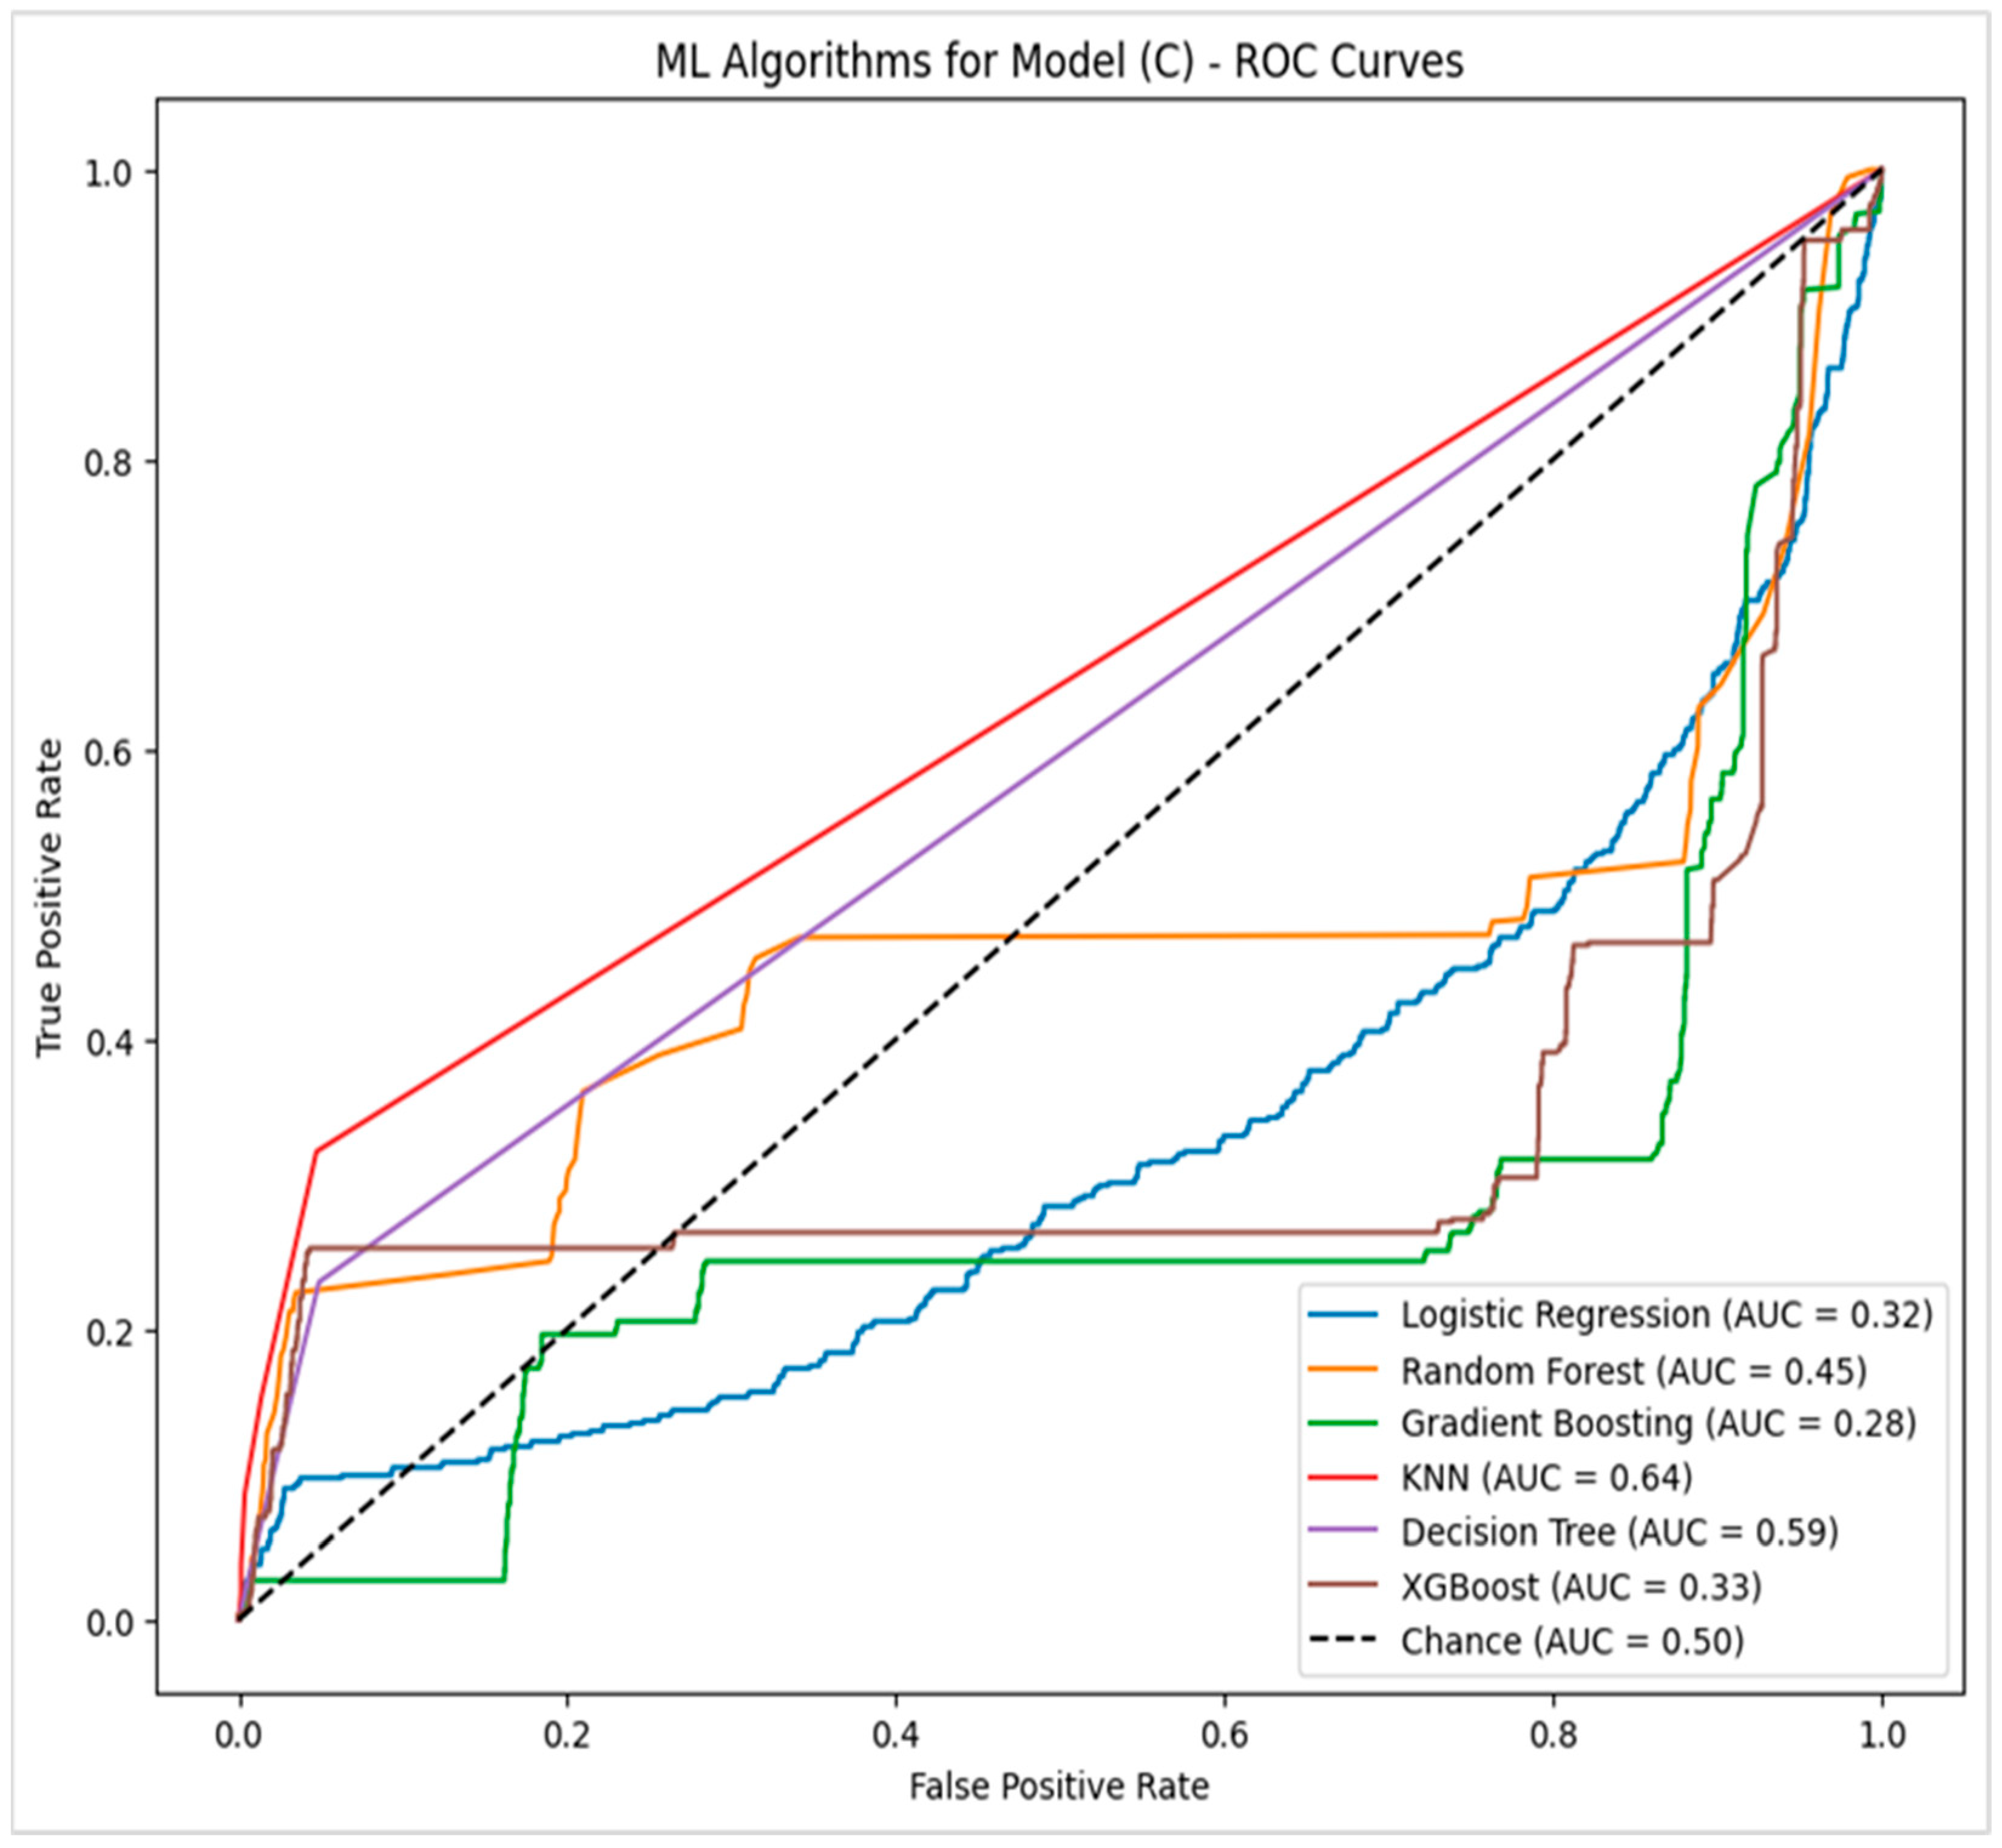
4.2.3. Model (C)—Potential Factors with Feature Importance Related to Pressure Injury
4.2.4. Model (D)—Potential Factors with a High Correlation Without Braden Scale Level
4.2.5. Statistical Comparison of Algorithms
4.2.6. Results of Cross-Validation
5. Discussion
6. Conclusions
7. Limitations of the Study
Author Contributions
Funding
Institutional Review Board Statement
Informed Consent Statement
Data Availability Statement
Acknowledgments
Conflicts of Interest
References
- Siotos, C.; Bonett, A.M.; Damoulakis, G.; Becerra, A.Z.; Kokosis, G.; Hood, K.; Dorafshar, A.H.; Shenaq, D.S. Burden of Pressure Injuries: Findings from the Global Burden of Disease Study. Eplasty 2022, 22, e19. [Google Scholar] [PubMed]
- Park, S.K.; Park, H. Factors affecting the time to occurrence of hospital-acquired pressure ulcers using EHR data. In MEDINFO 2017: Precision Healthcare Through Informatics; IOS Press: Amsterdam, The Netherlands, 2017; pp. 1113–1117. [Google Scholar]
- Roth, G.A.; Abate, D.; Abate, K.H.; Abay, S.M.; Abbafati, C.; Abbasi, N.; Abbastabar, H.; Abd-Allah, F.; Abdela, J.; Abdelalim, A. Global, regional, and national age-sex-specific mortality for 282 causes of death in 195 countries and territories, 1980–2017: A systematic analysis for the Global Burden of Disease Study 2017. Lancet 2018, 392, 1736–1788. [Google Scholar]
- Pittman, J.; Beeson, T.; Dillon, J.; Yang, Z.; Mravec, M.; Malloy, C.; Cuddigan, J. Hospital-acquired pressure injuries and acute skin failure in critical care: A case-control study. J. Wound Ostomy Cont. Nurs. 2021, 48, 20–30. [Google Scholar] [CrossRef] [PubMed]
- Han, Y.; Jin, Y.; Jin, T.; Lee, S.-M.; Lee, J.-Y. Impact of pressure injuries on patient outcomes in a Korean hospital: A case-control study. J. Wound Ostomy Cont. Nurs. 2019, 46, 194–200. [Google Scholar] [CrossRef] [PubMed]
- Mervis, J.S.; Phillips, T.J. Pressure ulcers: Pathophysiology, epidemiology, risk factors, and presentation. J. Am. Acad. Dermatol. 2019, 81, 881–890. [Google Scholar] [CrossRef]
- Bain, M.; Hara, J.; Carter, M.J. The Pathophysiology of Skin Failure vs. Pressure Injury: Conditions That Cause Integument Destruction and Their Associated Implications. Wounds A Compend. Clin. Res. Pract. 2020, 32, 319–327. [Google Scholar]
- Tschannen, D.; Anderson, C. The pressure injury predictive model: A framework for hospital-acquired pressure injuries. J. Clin. Nurs. 2020, 29, 1398–1421. [Google Scholar] [CrossRef] [PubMed]
- Popow, A.; Szewczyk, M.T.; Cierzniakowska, K.; Kozłowska, E.; Mościcka, P.; Cwajda-Białasik, J. Risk factors for bedsore development among hospitalised patients. Pielęgniarstwo Chir. I Angiol./Surg. Vasc. Nurs. 2019, 12, 152–158. [Google Scholar]
- Alderden, J.; Pepper, G.A.; Wilson, A.; Whitney, J.D.; Richardson, S.; Butcher, R.; Jo, Y.; Cummins, M.R. Predicting pressure injury in critical care patients: A machine-learning model. Am. J. Crit. Care 2018, 27, 461–468. [Google Scholar] [CrossRef] [PubMed]
- Chung, M.-L.; Widdel, M.; Kirchhoff, J.; Sellin, J.; Jelali, M.; Geiser, F.; Mücke, M.; Conrad, R. Risk Factors for Pressure Injuries in Adult Patients: A Narrative Synthesis. Int. J. Environ. Res. Public Health 2022, 19, 761. [Google Scholar] [CrossRef]
- Galetto, S.G.d.S.; do Nascimento, E.R.P.; Hermida, P.M.V.; Busanello, J.; de Malfussi, L.B.H.; Lazzari, D.D. Medical device-related pressure injuries in critical patients: Prevalence and associated factors. Rev. Esc. Enferm. USP 2021, 55, e20200397. [Google Scholar] [CrossRef]
- Aghazadeh, A.; Lotfi, M.; Asgarpour, H.; Khajehgoodari, M.; Nobakht, A. Frequency and risk factors of pressure injuries in clinical settings of affiliated to Tabriz University of Medical Sciences. Nurs. Open 2021, 8, 808–814. [Google Scholar] [CrossRef]
- Ahmad, B.; Rubio-Sefati, M.; Yacob, M.M. Incidence and risk factors for pressure injuries in patients who have undergone vascular operations: A scoping review. Eur. J. Med. Res. 2023, 28, 77. [Google Scholar] [CrossRef] [PubMed]
- Kim, J.; Lee, J.Y.; Lee, E. Risk factors for newly acquired pressure ulcer and the impact of nurse staffing on pressure ulcer incidence. J. Nurs. Manag. 2022, 30, O1–O9. [Google Scholar] [CrossRef]
- Ateeq, I.; Baby, T.; Amer, I.; Chehab, F.; Salim, N.A. Associated Risk Factors and Barriers of Pressure Injury Wound Healing Process: A Retrospective Study of Single-Center Experience. Dubai Med. J. 2022, 5, 163–170. [Google Scholar] [CrossRef]
- Wang, N.; Lv, L.; Yan, F.; Ma, Y.; Miao, L.; Chung, L.Y.F.; Han, L. Biomarkers for the early detection of pressure injury: A systematic review and meta-analysis. J. Tissue Viabil. 2022, 31, 259–267. [Google Scholar] [CrossRef] [PubMed]
- McEvoy, N.; Patton, D.; Curley, G.; Boland, F.; Kearney, C.; Hogan, G.; Keogh, A.; Clarke, J.; Moore, Z. Biomarkers for the early detection of pressure ulcers in the intensive care setting: A comparison between sub-epidermal moisture measurements and interleukin-1α. Int. Wound J. 2022, 20, 831–844. [Google Scholar] [CrossRef] [PubMed]
- Bader, D.; Oomens, C. The potential of biomarkers in the early detection of pressure ulcers. In Science and Practice of Pressure Ulcer Management; Springer: Berlin/Heidelberg, Germany, 2018; pp. 1–15. [Google Scholar]
- Ladios-Martin, M.; Fernández-de-Maya, J.; Ballesta-López, F.-J.; Belso-Garzas, A.; Mas-Asencio, M.; Cabañero-Martínez, M.J. Predictive modeling of pressure injury risk in patients admitted to an intensive care unit. Am. J. Crit. Care 2020, 29, e70–e80. [Google Scholar] [CrossRef] [PubMed]
- Nakagami, G.; Yokota, S.; Kitamura, A.; Takahashi, T.; Morita, K.; Noguchi, H.; Ohe, K.; Sanada, H. Supervised machine learning-based prediction for in-hospital pressure injury development using electronic health records: A retrospective observational cohort study in a university hospital in Japan. Int. J. Nurs. Stud. 2021, 119, 103932. [Google Scholar] [CrossRef] [PubMed]
- James, A. Machine Learning Risk Assessment Model for Hospital Acquired Pressure Injuries. Master’s Thesis, University of North Carolina, Chapel Hill, NC, USA, 2021. [Google Scholar]
- Bhardwaj, A. Promise and Provisos of Artificial Intelligence and Machine Learning in Healthcare. J. Healthc. Leadersh. 2022, 14, 113–118. [Google Scholar] [CrossRef]
- Negro-Calduch, E.; Azzopardi-Muscat, N.; Krishnamurthy, R.S.; Novillo-Ortiz, D. Technological progress in electronic health record system optimization: Systematic review of systematic literature reviews. Int. J. Med. Inform. 2021, 152, 104507. [Google Scholar] [CrossRef]
- Gamage, T.; Dabarera, W.; Nethmini, K.; Uwanthika, G.; Kalansooriya, L.; Wijay, B. A Systematic Review and Comparative Study of Electronic Medical Record (EMR) Systems to Support Healthcare. In Proceedings of the 13th International Research Conference, Rathmalana, Sri Lanka, 15–16 October 2020. [Google Scholar]
- Habehh, H.; Gohel, S. Machine learning in healthcare. Curr. Genom. 2021, 22, 291–300. [Google Scholar] [CrossRef]
- Sharma, M.; Savage, C.; Nair, M.; Larsson, I.; Svedberg, P.; Nygren, J.M. Artificial Intelligence Applications in Health Care Practice: Scoping Review. J. Med. Internet Res. 2022, 24, e40238. [Google Scholar] [CrossRef]
- Weissler, E.H.; Naumann, T.; Andersson, T.; Ranganath, R.; Elemento, O.; Luo, Y.; Freitag, D.F.; Benoit, J.; Hughes, M.C.; Khan, F. The role of machine learning in clinical research: Transforming the future of evidence generation. Trials 2021, 22, 537. [Google Scholar] [CrossRef]
- McKinney, S.M.; Sieniek, M.; Godbole, V.; Godwin, J.; Antropova, N.; Ashrafian, H.; Back, T.; Chesus, M.; Corrado, G.S.; Darzi, A. Addendum: International evaluation of an AI system for breast cancer screening. Nature 2020, 586, E19. [Google Scholar] [CrossRef] [PubMed]
- Assadi, A.; Laussen, P.C.; Goodwin, A.J.; Goodfellow, S.; Dixon, W.; Greer, R.W.; Jegatheeswaran, A.; Singh, D.; McCradden, M.; Gallant, S.N. An integration engineering framework for machine learning in healthcare. Front. Digit. Health 2022, 4, 932411. [Google Scholar] [CrossRef] [PubMed]
- Parashar, G.; Chaudhary, A.; Rana, A. Systematic Mapping Study of AI/Machine Learning in Healthcare and Future Directions. SN Comput. Sci. 2021, 2, 461. [Google Scholar] [CrossRef]
- Toffaha, K.M.; Simsekler, M.C.E.; Omar, M.A. Leveraging artificial intelligence and decision support systems in hospital-acquired pressure injuries prediction: A comprehensive review. Artif. Intell. Med. 2023, 141, 102560. [Google Scholar] [CrossRef]
- Lao, Y.; Jia, B.; Yan, P.; Pan, M.; Hui, X.; Li, J.; Luo, W.; Li, X.; Han, J.; Yan, P. Diagnostic accuracy of machine-learning-assisted detection for anterior cruciate ligament injury based on magnetic resonance imaging: Protocol for a systematic review and meta-analysis. Medicine 2019, 98, e18324. [Google Scholar] [CrossRef] [PubMed]
- Gefen, A. The sub-epidermal moisture scanner: The principles of pressure injury prevention using novel early detection technology. Wounds Int. 2018, 9, 30–35. [Google Scholar]
- Tamata, A.T.; Mohammadnezhad, M. A systematic review study on the factors affecting shortage of nursing workforce in the hospitals. Nurs. Open 2023, 10, 1247–1257. [Google Scholar] [CrossRef] [PubMed]
- Jiang, M.; Ma, Y.; Guo, S.; Jin, L.; Lv, L.; Han, L.; An, N. Using machine learning technologies in pressure injury management: Systematic review. JMIR Med. Inform. 2021, 9, e25704. [Google Scholar] [CrossRef]
- Do, Q.; Lipatov, K.; Ramar, K.; Rasmusson, J.; Pickering, B.W.; Herasevich, V. Pressure injury prediction model using advanced analytics for at-risk hospitalized patients. J. Patient Saf. 2022, 18, e1083–e1089. [Google Scholar] [CrossRef] [PubMed]
- Walther, F.; Heinrich, L.; Schmitt, J.; Eberlein-Gonska, M.; Roessler, M. Prediction of inpatient pressure ulcers based on routine healthcare data using machine learning methodology. Sci. Rep. 2022, 12, 5044. [Google Scholar] [CrossRef]
- Song, W.; Kang, M.-J.; Zhang, L.; Jung, W.; Song, J.; Bates, D.W.; Dykes, P.C. Predicting pressure injury using nursing assessment phenotypes and machine learning methods. J. Am. Med. Inform. Assoc. 2021, 28, 759–765. [Google Scholar] [CrossRef]
- Wei, L.; Lv, H.; Yue, C.; Yao, Y.; Gao, N.; Chai, Q.; Lu, M. A machine learning algorithm-based predictive model for pressure injury risk in emergency patients: A prospective cohort study. Int. Emerg. Nurs. 2024, 74, 101419. [Google Scholar] [CrossRef] [PubMed]
- Xu, H.; Wang, Y.; Takashi, E.; Kamijo, A.; Miura, D.; Karasawa, K.; Kitayama, A.; Lu, J.; Zhang, L. Predicting the different progressions of early pressure injury by ultraviolet photography in rat models. Int. Wound J. 2022, 19, 834–844. [Google Scholar] [CrossRef]
- Shui, A.M.; Kim, P.; Aribindi, V.; Huang, C.-Y.; Kim, M.-O.; Rangarajan, S.; Schorger, K.; Aldrich, J.M.; Lee, H. Dynamic risk prediction for hospital-acquired pressure injury in adult critical care patients. Crit. Care Explor. 2021, 3, e0580. [Google Scholar] [CrossRef] [PubMed]
- Cramer, E.M.; Seneviratne, M.G.; Sharifi, H.; Ozturk, A.; Hernandez-Boussard, T. Predicting the incidence of pressure ulcers in the intensive care unit using machine learning. eGEMs 2019, 7, 49. [Google Scholar] [CrossRef] [PubMed]
- Tang, Z.; Li, N.; Xu, J. Construction of a Risk Prediction Model for Intraoperative Pressure Injuries: A Prospective, Observational Study. J. PeriAnesth. Nurs. 2021, 36, 473–479. [Google Scholar] [CrossRef]
- Choi, B.K.; Kim, M.S.; Kim, S.H. Risk prediction models for the development of oral-mucosal pressure injuries in intubated patients in intensive care units: A prospective observational study. J. Tissue Viabil. 2020, 29, 252–257. [Google Scholar] [CrossRef] [PubMed]
- Anderson, C.; Bekele, Z.; Qiu, Y.; Tschannen, D.; Dinov, I.D. Modeling and prediction of pressure injury in hospitalized patients using artificial intelligence. BMC Med. Inform. Decis. Mak. 2021, 21, 253. [Google Scholar] [CrossRef]
- Sun, Z.-W.; Guo, M.-R.; Yang, L.-Z.; Chen, Z.-J.; Zhang, Z.-Q. Risk Factor Analysis and Risk Prediction Model Construction of Pressure Injury in Critically Ill Patients with Cancer: A Retrospective Cohort Study in China. Med. Sci. Monit. Int. Med. J. Exp. Clin. Res. 2020, 26, e926669-1–e926669-8. [Google Scholar] [CrossRef]
- Deschepper, M.; Labeau, S.O.; Waegeman, W.; Blot, S.I.; DecubICUs Study Team. Heterogeneity hampers the identification of general pressure injury risk factors in intensive care populations: A predictive modelling analysis. Intensive Crit. Care Nurs. 2022, 68, 103117. [Google Scholar] [CrossRef] [PubMed]
- Cheng, H.; Sun, X.; Ji, X.; Zhang, J.; Lv, J.; Li, T.; Ding, L. Risk factors and the potential of nomogram for predicting hospital-acquired pressure injuries. Int. Wound J. 2020, 17, 974–986. [Google Scholar] [CrossRef]
- Hu, Y.-H.; Lee, Y.-L.; Kang, M.-F.; Lee, P.-J. Constructing inpatient pressure injury prediction models using machine learning techniques. CIN Comput. Inform. Nurs. 2020, 38, 415–423. [Google Scholar] [CrossRef] [PubMed]
- Hyun, S.; Moffatt-Bruce, S.; Cooper, C.; Hixon, B.; Kaewprag, P. Prediction model for hospital-acquired pressure ulcer development: New paradigm in intensive care units. J. Med. Internet Res. 2019, 21, e13785. [Google Scholar]
- Cai, J.-Y.; Zha, M.-L.; Song, Y.-P.; Chen, H.L. Predicting the development of surgery-related pressure injury using a machine learning algorithm model. J. Nurs. Res. 2021, 29, e135. [Google Scholar] [CrossRef]
- Šín, P.; Hokynková, A.; Marie, N.; Andrea, P.; Krč, R.; Podroužek, J. Machine Learning-Based Pressure Ulcer Prediction in Modular Critical Care Data. Diagnostics 2022, 12, 850. [Google Scholar] [CrossRef]
- Yang, K.-L.; Chen, L.; Kang, Y.-Y.; Xing, L.-N.; Li, H.-L.; Cheng, P.; Song, Z.-H. Identification of risk factors of developing pressure injuries among immobile patient, and a risk prediction model establishment: A protocol for systematic review. Medicine 2020, 99, e23640. [Google Scholar] [CrossRef] [PubMed]
- Dweekat, O.Y.; Lam, S.S.; McGrath, L. Machine learning techniques, applications, and potential future opportunities in pressure injuries (bedsores) management: A systematic review. Int. J. Environ. Res. Public Health 2023, 20, 796. [Google Scholar] [CrossRef]
- Barghouthi, E.; Imam, A. Patient Satisfaction: Comparative Study between Joint Commission International Accredited and Non-accredited Palestinian Hospitals. Health Sci. J. 2018, 12, 547. [Google Scholar] [CrossRef]
- Barghouthi, E.D. Patient Satisfaction: Comparative Study Between Pre-Hospital Accreditation and Post-Hospital Accreditation. Int. J. Ind. Eng. 2024, 35, 1–17. [Google Scholar]
- Brownlee, J. Machine Learning Algorithms from Scratch with Python; Machine Learning Mastery: San Juan, PR, USA, 2016. [Google Scholar]
- Maulud, D.; Abdulazeez, A.M. A review on linear regression comprehensive in machine learning. J. Appl. Sci. Technol. Trends 2020, 1, 140–147. [Google Scholar] [CrossRef]
- Parveen, N.; Zaidi, S.; Danish, M. Support vector regression model for predicting the sorption capacity of lead (II). Perspect. Sci. 2016, 8, 629–631. [Google Scholar] [CrossRef]
- Misra, S.; Li, H.; He, J. Noninvasive fracture characterization based on the classification of sonic wave travel times. Mach. Learn. Subsurf. Charact. 2020, 4, 243–287. [Google Scholar]
- Charbuty, B.; Abdulazeez, A. Classification based on decision tree algorithm for machine learning. J. Appl. Sci. Technol. Trends 2021, 2, 20–28. [Google Scholar] [CrossRef]
- Syriopoulos, P.K.; Kotsiantis, S.B.; Vrahatis, M.N. (Eds.) Survey on KNN Methods in Data Science; Springer: Berlin/Heidelberg, Germany, 2022; pp. 379–393. [Google Scholar]
- Zhang, Z.; Zhao, Y.; Canes, A.; Steinberg, D.; Lyashevska, O. Predictive analytics with gradient boosting in clinical medicine. Ann. Transl. Med. 2019, 7, 152. [Google Scholar] [CrossRef]
- Alshboul, O.; Shehadeh, A.; Almasabha, G.; Almuflih, A.S. Extreme gradient boosting-based machine learning approach for green building cost prediction. Sustainability 2022, 14, 6651. [Google Scholar] [CrossRef]
- Miao, J.; Zhu, W. Precision–recall curve (PRC) classification trees. Evol. Intell. 2022, 15, 1545–1569. [Google Scholar] [CrossRef]
- Hamsagayathri, P.; Sampath, P. Performance analysis of breast cancer classification using decision tree classifiers. Int. J. Curr. Pharm. Res. 2017, 9, 19–25. [Google Scholar] [CrossRef]
- Chicco, D.; Warrens, M.J.; Jurman, G. The coefficient of determination R-squared is more informative than SMAPE, MAE, MAPE, MSE and RMSE in regression analysis evaluation. Peerj Comput. Sci. 2021, 7, e623. [Google Scholar] [CrossRef]
- Qu, C.; Luo, W.; Zeng, Z.; Lin, X.; Gong, X.; Wang, X.; Zhang, Y.; Li, Y. The predictive effect of different machine learning algorithms for pressure injuries in hospitalized patients: A network meta-analyses. Heliyon 2022, 8, e11361. [Google Scholar] [CrossRef] [PubMed]
- Barghouthi, E.a.D.; Owda, A.Y.; Asia, M.; Owda, M. Systematic Review for Risks of Pressure Injury and Prediction Models Using Machine Learning Algorithms. Diagnostics 2023, 13, 2739. [Google Scholar] [CrossRef]
- Aloweni, F.; Ang, S.Y.; Fook-Chong, S.; Agus, N.; Yong, P.; Goh, M.M.; Tucker-Kellogg, L.; Soh, R.C. A prediction tool for hospital-acquired pressure ulcers among surgical patients: Surgical pressure ulcer risk score. Int. Wound J. 2019, 16, 164–175. [Google Scholar] [CrossRef]


| Risk Factor | Sub-Risk Factor | Frequency and Percentages | Total | |
|---|---|---|---|---|
| Non-HAPI | HAPI | |||
| Hospital | RX | 262 (55.2)% | 213 (44.8)% | 475 |
| JX | 108 (22.7)% | 145 (30.5)% | 253 | |
| NX | 185 (38.9)% | 197 (41.5)% | 382 | |
| Gender | Female | 237 (49.9)% | 230 (48.4)% | 467 |
| Male | 318 (66.9)% | 325 (68.4)% | 643 | |
| Age | Adults (25–64 years) | 366 (77.1)% | 218 (45.9)% | 584 |
| Elderly (65 years and over) | 128 (26.9)% | 306 (64.4)% | 434 | |
| Young Adult (18–24 years) | 61 (12.8)% | 31 (6.5)% | 92 | |
| Accreditation Status | Accredited | 262 (55.2)% | 213 (44.8)% | 475 |
| Non-Accredited | 293 (61.7)% | 342 (72)% | 635 | |
| Department Type | Intensive Units | 154 (32.4)% | 302 (63.6)% | 456 |
| Open Units | 401 (84.4)% | 253 (53.3)% | 654 | |
| Anesthesia | General | 169 (35.6)% | 176 (37.1)% | 345 |
| Local Anesthesia | 109 (22.9)% | 54 (11.4)% | 163 | |
| Spinal | 15 (3.2)% | 3 (0.6)% | 18 | |
| Sedation | 3 (0.6)% | 10 (2.1)% | 13 | |
| Combined Spinal Epidural | 0 (0)% | 1 (0.2)% | 1 | |
| Epidural | 1 (0.2)% | 0 (0)% | 1 | |
| Performed Operation | No | 258 (54.3)% | 311 (65.5)% | 569 |
| Yes | 297 (62.5)% | 244 (51.4)% | 541 | |
| Braden Scale Level | High Risk | 31 (6.5)% | 441 (92.8)% | 472 |
| Low Risk | 524 (110.3)% | 114 (24)% | 638 | |
| Pressure Injury Grade | Grade 1 | 0 (0)% | 179 (37.7)% | 179 |
| Grade 2 | 2 (0.4)% | 279 (58.7)% | 281 | |
| Grade 3 | 0 (0)% | 97 (20.4)% | 97 | |
| Mechanical Ventilators | No | 536 (112.8)% | 442 (93.1)% | 978 |
| Yes | 19 (4)% | 113 (23.8)% | 132 | |
| Risk Factor | Hospital | Mean | Average | |
|---|---|---|---|---|
| Non-HAPI | HAPI | |||
| LOS (days) | RX | 3.2 | 13.6 | 7.8 |
| JX | 3.3 | 14.9 | 9.9 | |
| NX | 1.6 | 15.9 | 8.9 | |
| Operation Duration (hours) | RX | 1.2 | 2.2 | 1.6 |
| JX | 1.3 | 2.4 | 1.9 | |
| NX | 0.4 | 1.1 | 0.8 | |
| Systolic BP (millimeters of mercury) | RX | 123 | 118 | 120 |
| JX | 123 | 123 | 123 | |
| NX | 119 | 120 | 120 | |
| Diastolic BP (millimeters of mercury) | RX | 71 | 67 | 69 |
| JX | 73 | 72 | 72 | |
| NX | 70 | 67 | 69 | |
| Temperature (centigrade) | RX | 36.5 | 36.5 | 36.5 |
| JX | 36.4 | 36.5 | 36.5 | |
| NX | 36.5 | 36.5 | 36.5 | |
| Pulse (beats per minute) | RX | 73 | 76 | 74 |
| JX | 68 | 71 | 70 | |
| NX | 73 | 70 | 72 | |
| Tests Name | Average Result | Normal Range | Interpretation |
|---|---|---|---|
| Albumin (Alb) | 2.98 | 3.5–5.2 | Below Normal |
| Bilirubin (D) | 1.56 | 0–0.2 | Above Normal |
| Bilirubin (T) | 2.33 | 0.2–1.2 | Above Normal |
| Blood Urea Nitrogen (Bun) | 31.13 | 6–20 | Above Normal |
| Creatinine | 1.59 | 0.7–1.2 | Above Normal |
| C-Reactive Protein (CRP) | 89.17 | <5 | Above Normal |
| Hb | 10.30 | 12.0–14.0 | Below Normal |
| Hemoglobin A1c (Hb A1c) | 7.25 | <5.7 | Above Normal |
| Protein | 5.91 | 6.4–8.3 | Below Normal |
| Aspartate Aminotransferase (AST) | 111.51 | 0–40 | Above Normal |
| Uric Acid | 5.85 | 3.4–7 | Normal |
| White Blood Cells (WBC) | 11.13 | 4–11 | Above Normal |
| Albumin | 2.98 | 3.5–5.2 | Below Normal |
| Biomarkers | Condition | Mean | t | df | p Value | 95% CI |
|---|---|---|---|---|---|---|
| Creatinine | Yes (HAPI) | 1.68 | 8.96 | 3989 | <0.001 | [0.26, 0.41] |
| No (HAPI) | 1.34 | |||||
| CRP | Yes (HAPI) | 94.77 | 8.42 | 2150 | <0.001 | [17.18, 28.33] |
| No (HAPI) | 71.11 | |||||
| WBC | Yes (HAPI) | 11.59 | 14.85 | 6666 | <0.001 | [1.43, 1.86] |
| No (HAPI) | 9.94 | |||||
| Hb | Yes (HAPI) | 9.92 | −26.58 | 4647 | <0.001 | [−1.41, −1.21] |
| No (HAPI) | 11.23 | |||||
| BUN | Yes (HAPI) | 35.61 | 18.79 | 4385 | <0.001 | [10.89, 13.53] |
| No (HAPI) | 22.74 | |||||
| AST | Yes (HAPI) | 118.30 | −0.48 | 1231 | <0.001 | [−83.94, 25.57] |
| No (HAPI) | 132.53 | |||||
| Alb | Yes (HAPI) | 2.86 | −17.26 | 1639 | <0.001 | [−0.47, −0.37] |
| No (HAPI) | 3.28 | |||||
| Bilirubin (T) | Yes (HAPI) | 2.11 | −2.47 | 1022 | <0.001 | [−1.18, −0.13] |
| No (HAPI) | 2.77 | |||||
| Bilirubin (D) | Yes (HAPI) | 1.36 | −2.88 | 931 | <0.001 | [−1.01, −0.19] |
| No (HAPI) | 1.96 | |||||
| Uric Acid | Yes (HAPI) | 6.37 | 2.91 | 226 | 0.20 | [0.35, 1.85] |
| No (HAPI) | 5.27 | |||||
| Hb A1c | Yes (HAPI) | 7.28 | 0.28 | 348 | 0.78 | [−0.38, 0.51] |
| No (HAPI) | 7.22 | |||||
| Protein | Yes (HAPI) | 5.81 | −1.14 | 291 | <0.001 | [−0.83, 0.22] |
| No (HAPI) | 6.14 | |||||
| Metrics Name | Equations |
|---|---|
| True Positive Rate/Recall (TPR) | TPR = TP/(TP + FN) |
| False Positive Rate (FPR) | FPR = FP/(TN + FP) |
| Precision | Precision = TP/(TP + FP) |
| F-measure (F1 score) | F1 score = 2/(Recall−1 + Precision−1) |
| Area Under the Curve (AUC) | AUC = ½. ∑in = 1 (fi + 1 − fi). (ti + 1 + ti) |
| Accuracy | Accuracy = TP + TN/(TP + TN + FP + FN) |
| Mean Square Error (MSE) | MSE = 1/n ∑ (y − y)2 Best Value = 0, Worst Value = +∞ |
| R-Squared | R2 = 1 − (SSE/SSyy) Where SSE = ∑ (y − y∧)2 SSyy = ∑ (y − y−)2 Best Value = +1, Worst Value = −∞ |
| Predicted—Positive | Predicted—Negative | |
|---|---|---|
| Actual—Positive | True Positive (TP) | False Negative (FN) |
| Actual—Negative | False Positive (FP) | True Negative (TN) |
| Factors/Features | Sub-Factors/Features | Training Dataset | Testing Dataset |
|---|---|---|---|
| Accreditation Status | Accredited | 359 patients (75.6%) | 116 patients (24.4%) |
| Not Accredited | 499 patients (78.6%) | 136 patients (21.4%) | |
| Department Category | Open Units | 516 patients (87.9%) | 138 patients (21.1%) |
| Intensive Units | 342 patients (73.5%) | 114 patients (26.5%) | |
| Gender | Male | 501 patients (77.9%) | 142 patients (22.1%) |
| Female | 357 patients (76.4%) | 110 patients (23.4%) | |
| Age Category | Elderly (65 years and over) | 330 patients (76.0%) | 104 patients (24.0%) |
| Adults (25–64 years) | 459 patients (78.6%) | 125 patients (21.4%) | |
| Young Adult (18–24 years) | 69 patients (75.0%) | 23 patients (25.0%) | |
| Performed Operation | Yes | 415 patients (76.7%) | 126 patients (23.4%) |
| No | 443 patients (77.9%) | 126 patients (22.1%) | |
| Anesthesia Type | General | 256 patients (74.2%) | 89 patients (25.8%) |
| Local Anesthesia | 134 patients (82.2%) | 29 patients (17.8%) | |
| Spinal | 13 patients (0.50%) | 5 patients (0.77%) | |
| Sedation | 11 patients (0.42%) | 2 patients (0.31%) | |
| Epidural | 1 patient (0.04%) | 0 patients (0.00%) | |
| CSE | 0 patients (0.00%) | 1 patient (0.15%) | |
| Mechanical Ventilator | No | 762 patients (29.42%) | 216 patients (33.33%) |
| Yes | 96 patients (3.71%) | 36 patients (5.56%) | |
| Braden Scale Level | Low Risk | 500 patients (19.31%) | 138 patients (21.30%) |
| High Risk | 358 patients (13.82%) | 114 patients (17.59%) | |
| Subscale/Moisture | Rarely Moist | 393 patients (15.17%) | 117 patients (18.06%) |
| Occasionally Moist | 348 patients (13.44%) | 102 patients (15.74%) | |
| Constantly Moist | 54 patients (2.08%) | 12 patients (1.85%) | |
| Very Moist | 63 patients (2.43%) | 21 patients (3.24%) | |
| Subscale/Activity | Walks Frequently | 371 patients (14.32%) | 116 patients (17.90%) |
| Bed Fast | 158 patients (6.10%) | 41 patients (6.33%) | |
| Walks Occasionally | 291 patients (11.24%) | 83 patients (12.81%) | |
| Chair Fast | 38 patients (1.47%) | 12 patients (1.85%) | |
| Sensory Perception | No Impairment | 462 patients (17.84%) | 127 patients (19.60%) |
| Completely Limited | 70 patients (2.70%) | 16 patients (2.47%) | |
| Slightly Limited | 284 patients (10.97%) | 98 patients (15.12%) | |
| Very Limited | 42 patients (1.62%) | 11 patients (1.70%) | |
| Mobility | No Limitations | 409 patients (15.79%) | 111 patients (17.13%) |
| Completely Immobile | 74 patients (2.86%) | 15 patients (2.31%) | |
| Slightly Limited | 137 patients (5.29%) | 53 patients (8.18%) | |
| Very Limited | 238 patients (9.19%) | 73 patients (11.27%) | |
| Nutrition Statistics | Excellent | 383 patients (14.79%) | 115 patients (17.75%) |
| Adequate | 347 patients (13.40%) | 108 patients (16.67%) | |
| Probably Inadequate | 78 patients (3.01%) | 22 patients (3.40%) | |
| Very Poor | 36 patients (1.39%) | 4 patients (0.62%) | |
| Inadequate | 14 patients (0.54%) | 3 patients (0.46%) | |
| Friction And Shear | No Potential or Apparent | 686 patients (26.49%) | 199 patients (30.71%) |
| Friction and Shear | 101 patients (3.90%) | 21 patients (3.24%) | |
| Problem | 67 patients (2.59%) | 31 patients (4.78%) | |
| Potential Problem | 2 patients (0.08%) | 0 patients (0.00%) | |
| No Apparent Problem | 2 patients (0.08%) | 1 patient (0.15%) | |
| Pressure Injury Type | No Pressure Injury | 437 patients (16.88%) | 118 patients (18.21%) |
| Hospital-Acquired | 421 patients (16.25%) | 134 patients (20.68%) |
| Classification | Regression | |||||||||
|---|---|---|---|---|---|---|---|---|---|---|
| Algorithm | Model | Accuracy | Precision | Recall | F1 | AUC | FPR | TPR | MSE | R2 |
| LR | A | 0.964 | 0.95 | 0.919 | 0.934 | 0.919 | 0.348 | 0.907 | NA | NA |
| B | 0.956 | 0.958 | 0.886 | 0.917 | 0.886 | 0.277 | 0.92 | NA | NA | |
| C | 0.828 | 0.649 | 0.514 | 0.486 | 0.514 | 0.58 | 0.4 | NA | NA | |
| D | 0.936 | 0.903 | 0.864 | 0.882 | 0.864 | 0.262 | 0.859 | NA | NA | |
| RF | A | 0.988 | 0.98 | 0.978 | 0.979 | 0.978 | 0.028 | 0.88 | NA | NA |
| B | 0.992 | 0.985 | 0.986 | 0.985 | 0.986 | 0.048 | 0.882 | NA | NA | |
| C | 0.838 | 0.718 | 0.584 | 0.601 | 0.584 | 0.318 | 0.317 | NA | NA | |
| D | 0.987 | 0.977 | 0.979 | 0.978 | 0.979 | 0.023 | 0.833 | NA | NA | |
| GB | A | 0.976 | 0.96 | 0.953 | 0.957 | 0.953 | 0.116 | 0.802 | NA | NA |
| B | 0.981 | 0.968 | 0.967 | 0.967 | 0.967 | 0.126 | 0.876 | NA | NA | |
| C | 0.713 | 0.498 | 0.498 | 0.498 | 0.498 | 0.631 | 0.396 | NA | NA | |
| D | 0.967 | 0.939 | 0.946 | 0.942 | 0.946 | 0.048 | 0.742 | NA | NA | |
| KNN | A | 0.966 | 0.947 | 0.93 | 0.938 | 0.93 | 0.162 | 0.753 | NA | NA |
| B | 0.961 | 0.951 | 0.909 | 0.928 | 0.909 | 0.158 | 0.721 | NA | NA | |
| C | 0.84 | 0.834 | 0.541 | 0.534 | 0.541 | 0.153 | 0.231 | NA | NA | |
| D | 0.959 | 0.93 | 0.924 | 0.927 | 0.924 | 0.163 | 0.738 | NA | NA | |
| DT | A | 0.984 | 0.974 | 0.968 | 0.971 | 0.968 | 0.336 | 0.648 | NA | NA |
| B | 0.987 | 0.977 | 0.979 | 0.978 | 0.979 | 0.336 | 0.655 | NA | NA | |
| C | 0.828 | 0.677 | 0.592 | 0.609 | 0.592 | 0.35 | 0.411 | NA | NA | |
| D | 0.985 | 0.977 | 0.969 | 0.973 | 0.969 | 0.254 | 0.728 | NA | NA | |
| XGBoost | A | 0.926 | 0.93 | 0.799 | 0.847 | 0.799 | 0.063 | 0.763 | NA | NA |
| B | 0.939 | 0.946 | 0.833 | 0.877 | 0.833 | 0.044 | 0.787 | NA | NA | |
| C | 0.834 | 0.696 | 0.583 | 0.6 | 0.583 | 0.542 | 0.411 | NA | NA | |
| D | 0.939 | 0.928 | 0.851 | 0.883 | 0.851 | 0.178 | 0.79 | NA | NA | |
| SVR | A | NA | NA | NA | NA | NA | NA | NA | 0.027 | 0.81 |
| B | NA | NA | NA | NA | NA | NA | NA | 0.019 | 0.869 | |
| C | NA | NA | NA | NA | NA | NA | NA | 0.08 | 0.438 | |
| D | NA | NA | NA | NA | NA | NA | NA | 0.031 | 0.782 | |
| Linear | A | NA | NA | NA | NA | NA | NA | NA | 0.036 | 0.748 |
| B | NA | NA | NA | NA | NA | NA | NA | 0.033 | 0.769 | |
| C | NA | NA | NA | NA | NA | NA | NA | 0.191 | −0.34 | |
| D | NA | NA | NA | NA | NA | NA | NA | 0.058 | 0.591 | |
| Model | Algorithm | Accuracy | Standard Deviation | Optimal Hyperparameters |
|---|---|---|---|---|
| Model A | Linear | 0.744 | 0.021 | Default |
| LR | 0.962 | 0.004 | C = 1.0, solver = ‘lbfgs’ | |
| RF | 0.962 | 0.008 | n_estimators = 100, max_depth = 10 | |
| GB | 0.964 | 0.005 | learning_rate = 0.1, n_estimators = 200 | |
| SVR | 0.769 | 0.021 | C = 1.0, kernel = ‘rbf’, gamma = 0.1 | |
| KNN | 0.956 | 0.006 | n_neighbors = 5 | |
| DT | 0.945 | 0.013 | max_depth = 5 | |
| XGBoost | 0.964 | 0.009 | learning_rate = 0.1, n_estimators = 200 | |
| Model B | Linear | 0.759 | 0.009 | Default |
| LR | 0.960 | 0.005 | C = 1.0, solver = ‘lbfgs’ | |
| RF | 0.968 | 0.002 | n_estimators = 100, max_depth = 10 | |
| GB | 0.969 | 0.003 | learning_rate = 0.1, n_estimators = 200 | |
| SVR | 0.757 | 0.026 | C = 1.0, kernel = ‘rbf’, gamma = 0.1 | |
| KNN | 0.954 | 0.006 | n_neighbors = 5 | |
| DT | 0.960 | 0.007 | max_depth = 5 | |
| XGBoost | 0.968 | 0.007 | learning_rate = 0.1, n_estimators = 200 | |
| Model C | Linear | 0.766 | 0.008 | Default |
| LR | 0.960 | 0.003 | C = 1.0, solver = ‘lbfgs’ | |
| RF | 0.971 | 0.005 | n_estimators = 100, max_depth = 10 | |
| GB | 0.969 | 0.004 | learning_rate = 0.1, n_estimators = 200 | |
| SVR | 0.778 | 0.027 | C = 1.0, kernel = ‘rbf’, gamma = 0.1 | |
| KNN | 0.961 | 0.006 | n_neighbors = 5 | |
| DT | 0.962 | 0.007 | max_depth = 5 | |
| XGBoost | 0.968 | 0.003 | learning_rate = 0.1, n_estimators = 200 | |
| Model D | Linear | 0.588 | 0.033 | Default |
| LR | 0.938 | 0.006 | C = 1.0, solver = ‘lbfgs’ | |
| RF | 0.952 | 0.004 | n_estimators = 100, max_depth = 10 | |
| GB | 0.953 | 0.006 | learning_rate = 0.1, n_estimators = 200 | |
| SVR | 0.706 | 0.022 | C = 1.0, kernel = ‘rbf’, gamma = 0.1 | |
| KNN | 0.949 | 0.007 | n_neighbors = 5 | |
| DT | 0.943 | 0.006 | max_depth = 5 | |
| XGBoost | 0.950 | 0.007 | learning_rate = 0.1, n_estimators = 200 |
| Model | Accuracy | Precision | Recall | F1 | AUC | FPR | TPR |
|---|---|---|---|---|---|---|---|
| Model A | 0.967 | 0.957 | 0.924 | 0.938 | 0.924 | 0.176 | 0.792 |
| Model B | 0.969 | 0.964 | 0.926 | 0.942 | 0.926 | 0.165 | 0.807 |
| Model C | 0.814 | 0.679 | 0.552 | 0.555 | 0.552 | 0.429 | 0.361 |
| Model D | 0.962 | 0.942 | 0.922 | 0.931 | 0.922 | 0.155 | 0.782 |
Disclaimer/Publisher’s Note: The statements, opinions and data contained in all publications are solely those of the individual author(s) and contributor(s) and not of MDPI and/or the editor(s). MDPI and/or the editor(s) disclaim responsibility for any injury to people or property resulting from any ideas, methods, instructions or products referred to in the content. |
© 2025 by the authors. Licensee MDPI, Basel, Switzerland. This article is an open access article distributed under the terms and conditions of the Creative Commons Attribution (CC BY) license (https://creativecommons.org/licenses/by/4.0/).
Share and Cite
Barghouthi, E.D.; Owda, A.Y.; Owda, M.; Asia, M. A Fused Multi-Channel Prediction Model of Pressure Injury for Adult Hospitalized Patients—The “EADB” Model. AI 2025, 6, 39. https://doi.org/10.3390/ai6020039
Barghouthi ED, Owda AY, Owda M, Asia M. A Fused Multi-Channel Prediction Model of Pressure Injury for Adult Hospitalized Patients—The “EADB” Model. AI. 2025; 6(2):39. https://doi.org/10.3390/ai6020039
Chicago/Turabian StyleBarghouthi, Eba’a Dasan, Amani Yousef Owda, Majdi Owda, and Mohammad Asia. 2025. "A Fused Multi-Channel Prediction Model of Pressure Injury for Adult Hospitalized Patients—The “EADB” Model" AI 6, no. 2: 39. https://doi.org/10.3390/ai6020039
APA StyleBarghouthi, E. D., Owda, A. Y., Owda, M., & Asia, M. (2025). A Fused Multi-Channel Prediction Model of Pressure Injury for Adult Hospitalized Patients—The “EADB” Model. AI, 6(2), 39. https://doi.org/10.3390/ai6020039