
AdaptiveSwin-CNN: Adaptive Swin-CNN Framework with Self-Attention Fusion for Robust Multi-Class Retinal Disease Diagnosis


Abstract
1. Introduction
1.1. Research Contribution
- (1)
- Achieves state-of-the-art performance metrics, with an accuracy of 99.1% and an F1-score of 98.3%, outperforming existing approaches across diverse datasets.
- (2)
- Demonstrates superior cross-dataset performance, addressing variability in image quality and patient demographics.
- (3)
- Optimizes architecture, which ensures reduced training and inference times, making it suitable for real-time applications.
- (4)
- Provides a scalable, interpretable solution that can assist ophthalmologists in early and accurate diagnosis, especially in regions with limited healthcare resources.
1.2. Organization of Paper
2. Literature Review
- The performance of these approaches is heavily influenced by preprocessing steps, such as image enhancement or normalization. Inappropriate or dataset-specific preprocessing can introduce biases and degrade model performance.
- Both CNNs and Swin Transformers primarily extract features in the RGB color space, potentially overlooking critical diagnostic information from alternative color spaces (e.g., CIELAB, HSV) or other domain-specific representations.
- The integration of CNNs and Swin Transformers often results in resource-intensive architectures, which can hinder their applicability in real-time settings or environments with limited computational capabilities.
- Despite advancements in attention mechanisms, the inherent complexity of hybrid models poses challenges in interpretability, which may limit their acceptance and usability in clinical practice.
3. Material and Methods
| Algorithm 1. Implementation of the proposed AdaptiveSwin-CNN model for feature map extraction and disease classification | ||
| Layer | Purpose | Details |
| Input layer | Accepts fundus images as input. | Preprocessed images (e.g., resized to 224 × 224 pixels and normalized). |
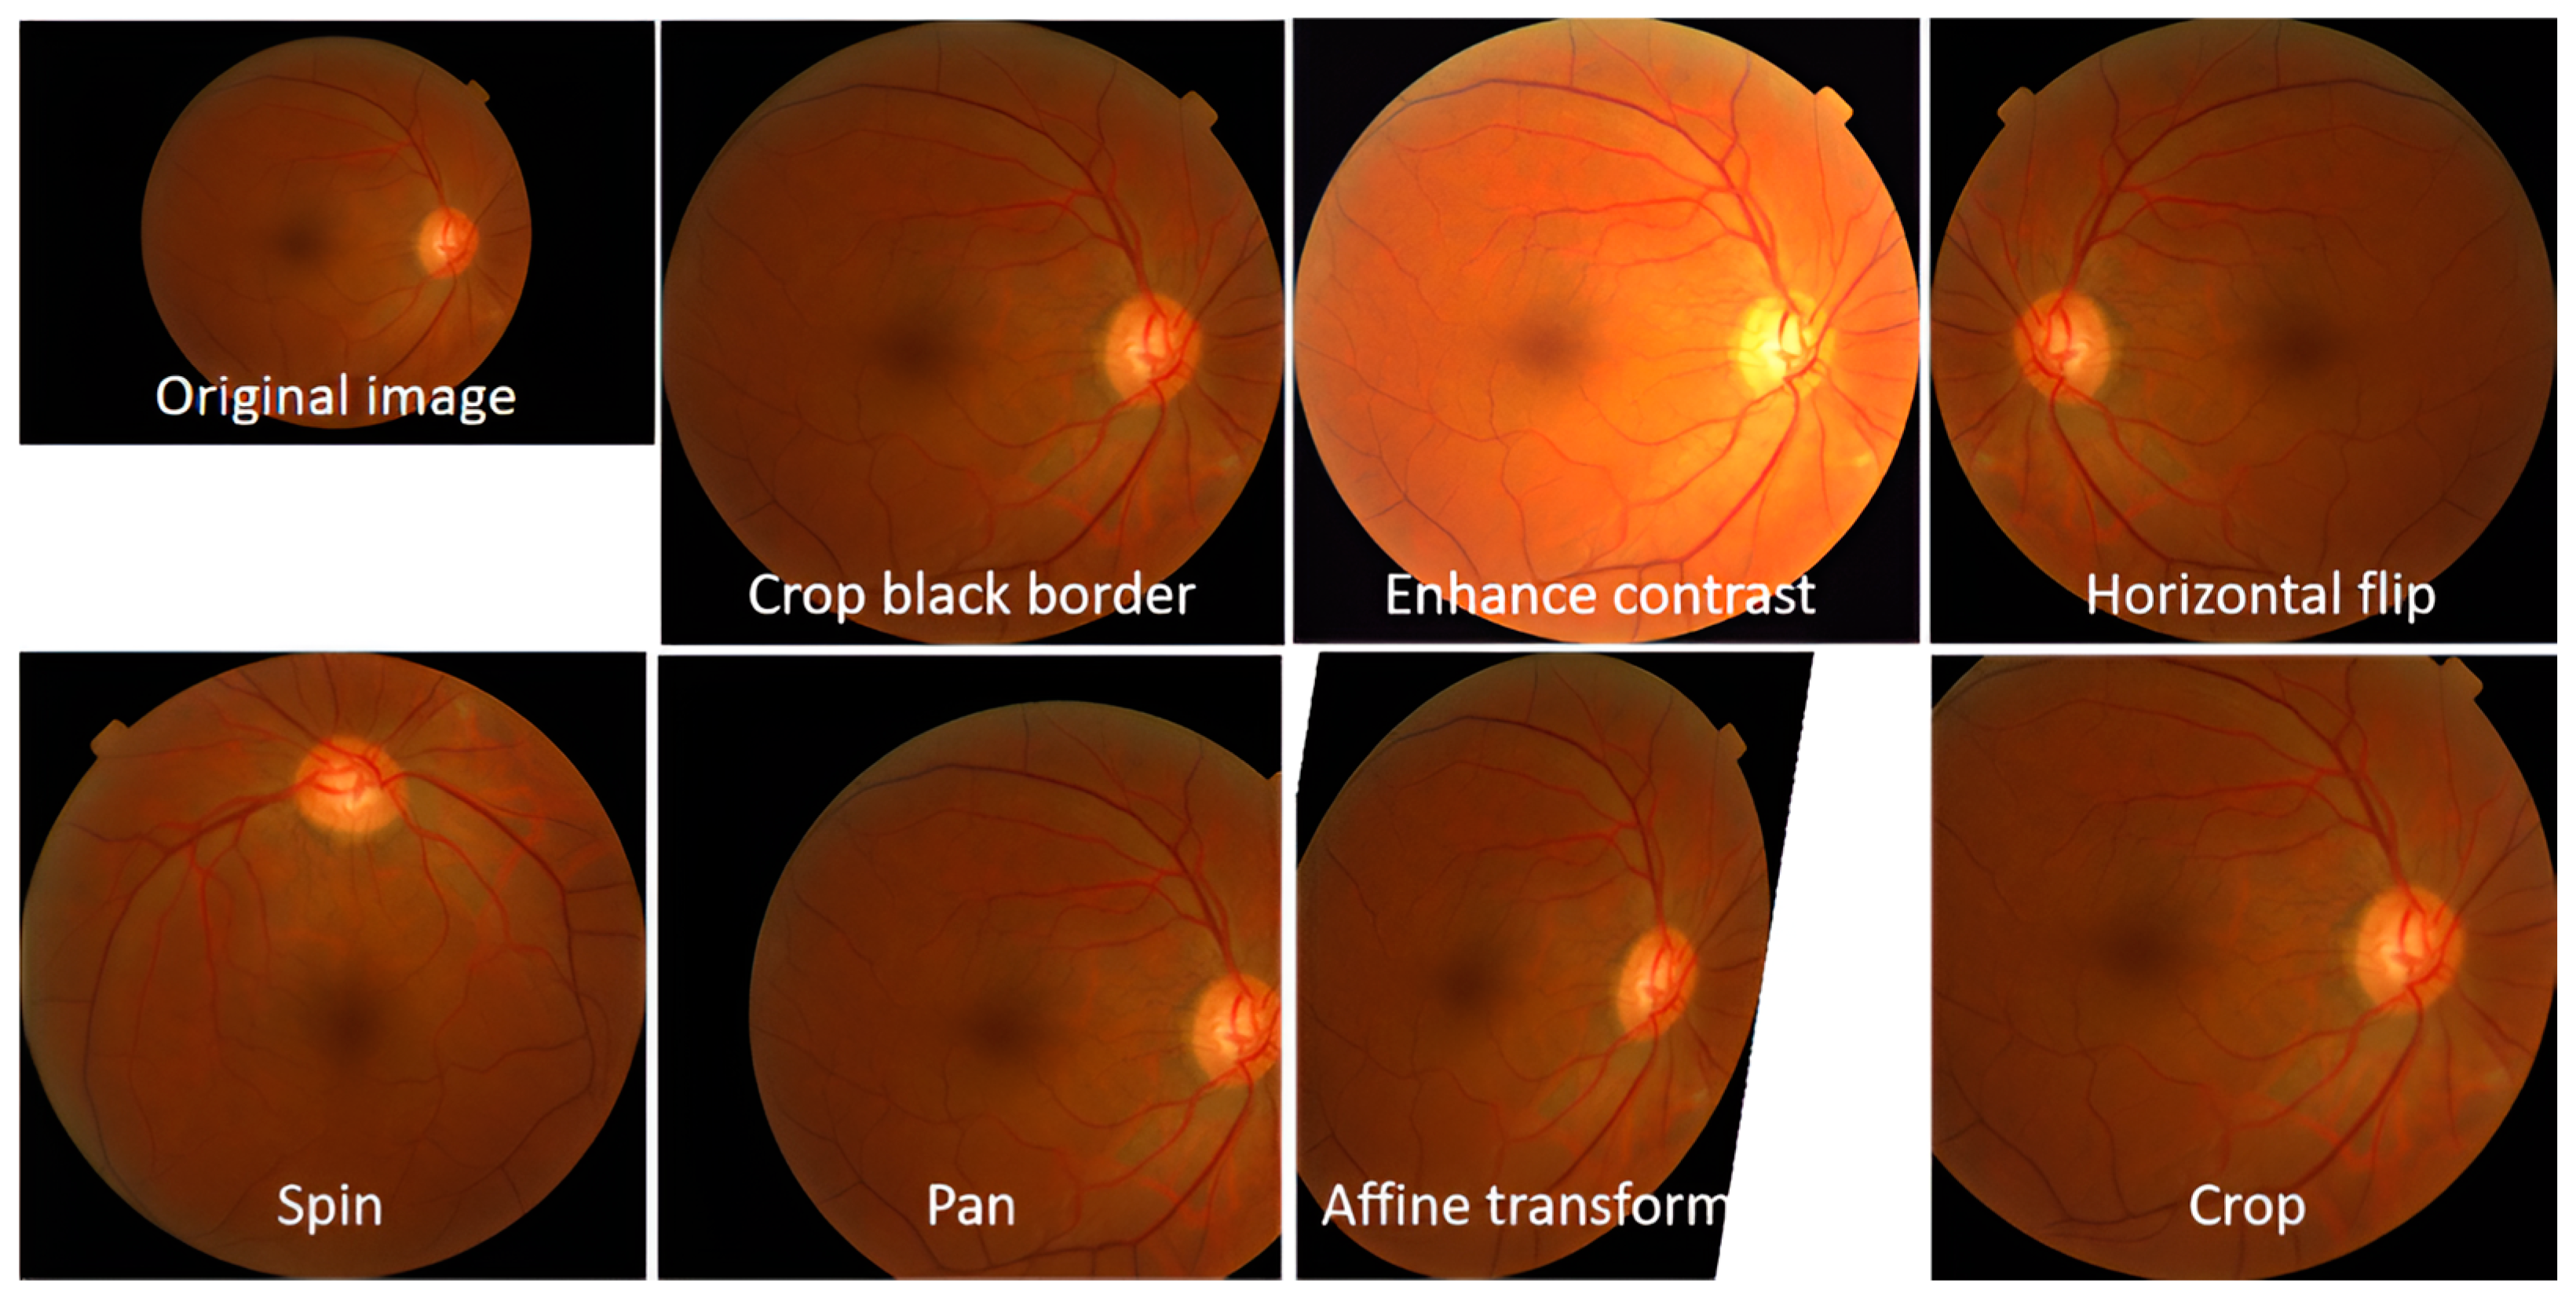
| Preprocessing layer | Standardizes image data for processing. | Resizing, normalization (pixel scaling between 0 and 1), and augmentation techniques like flipping or rotation (optional). |
| Conv1 (Convolutional) | Extract low-level features like edges and textures. | 32 filters, 3 × 3 kernel, ReLU activation, and a stride of 1. |
| Pool1 (Pooling) | Downsample spatial dimensions to reduce computation. | Max pooling with 2 × 2 filter and a stride of 2. |
| Conv2 (Convolutional) | Detect more complex patterns like contours and textures. | 64 filters, 3 × 3 kernel, ReLU activation. |
| Pool2 (Pooling) | Further reduces spatial dimensions for feature abstraction. | Max pooling with 2 × 2 filter and a stride of 2. |
| Conv3 (Convolutional) | Identifies deeper features specific to retinal abnormalities. | 128 filters, 3 × 3 kernel, ReLU activation. |
| Pool3 (Pooling) | Compress spatial dimensions further while retaining essential features. | Max pooling with 2 × 2 filter and a stride of 2. |
| Dense1 (Fully Connected) | Combines extracted CNN features into a high-dimensional feature vector. | 256 neurons, ReLU activation. |
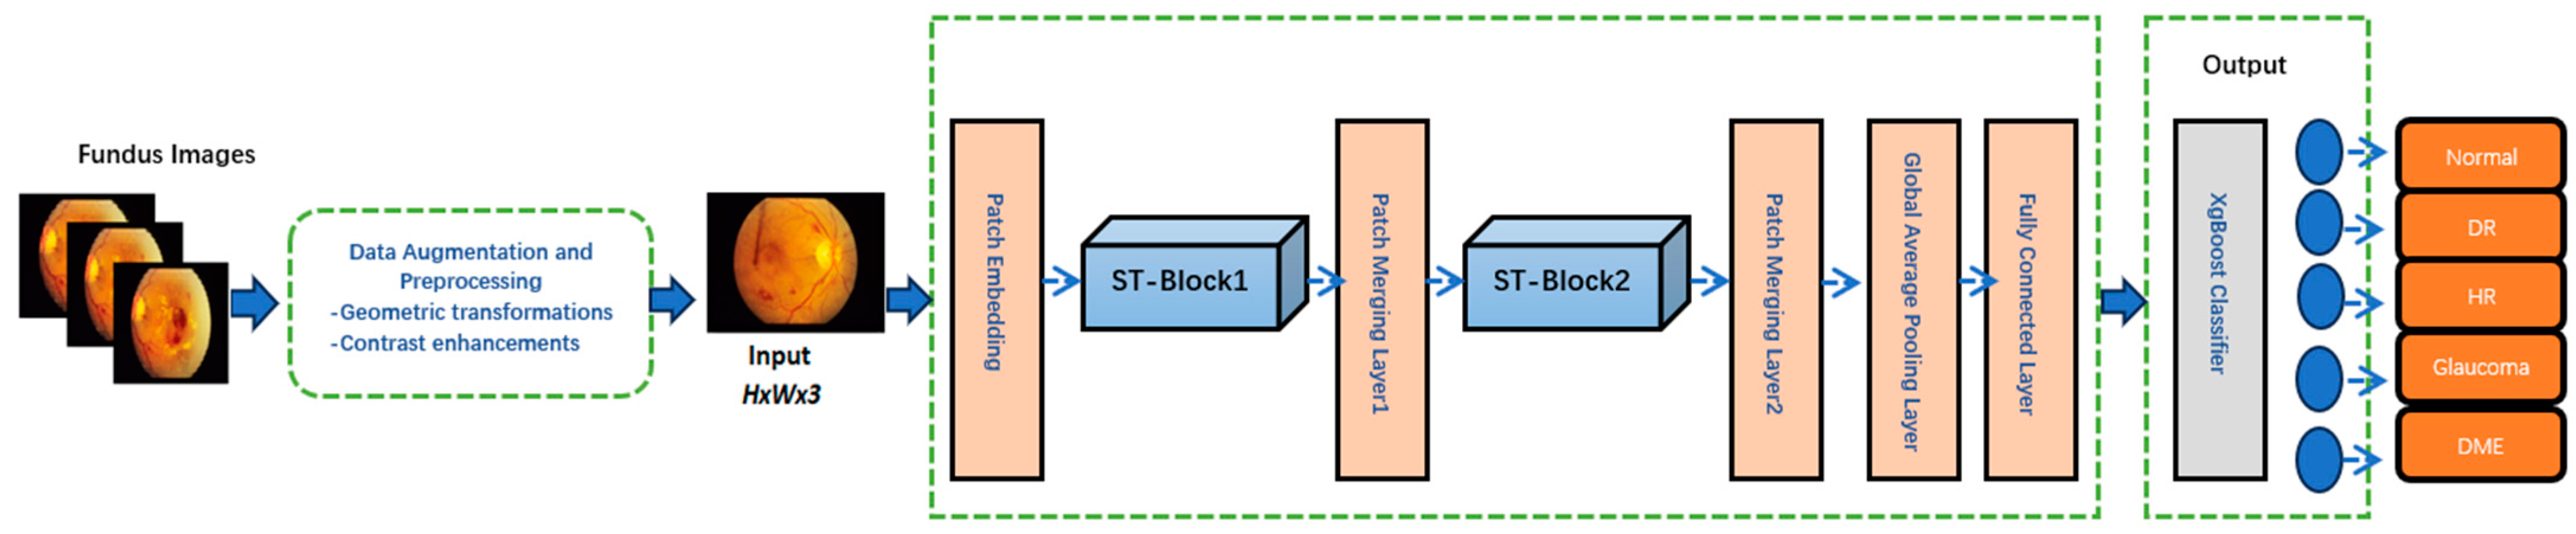
| Patch Embedding Layer | Converts input image patches into embeddings for the Swin Transformer. | Splits input features into fixed-size patches (e.g., 4 × 4 pixels), flattens them, and applies a linear projection to form embeddings. |
| Swin Transformer Block1 | Performs global feature refinement using hierarchical self-attention | Applies multi-head self-attention to model long-range dependencies. |
| Patch Merging Layer1 | Reduces spatial resolution while increasing feature dimensionality. | Combines adjacent patches (e.g., 2 × 2) and outputs higher-level features with reduced spatial size but enriched representation. |
| Swin Transformer Block 2 | Further refines features by capturing global contextual relationships. | Applies another multi-head self-attention mechanism with higher-level features. |
| Patch Merging Layer 2 | Further reduces resolution and enhances high-level feature representations. | Aggregates adjacent patches (e.g., 2 × 2) and outputs a compact feature map. |
| Global Average Pooling Layer | Reduces the spatial dimensions of the feature map to a single vector per channel. | Averages each feature map spatially, producing a global feature vector while retaining the most significant information for each channel. |
| Feature Concatenation | Combines CNN and Swin Transformer outputs into a unified feature vector. | Merges CNN-extracted local features with Transformer-refined global features for comprehensive representation. |
| XgBoost Classifier | Maps the concatenated feature vector to the final classification output. | Gradient-boosting decision tree algorithm predicts probabilities for each class, enabling accurate multi-class disease classification. |
3.1. Data Acquisition
3.2. Dataset Augmentation and Preprocessing
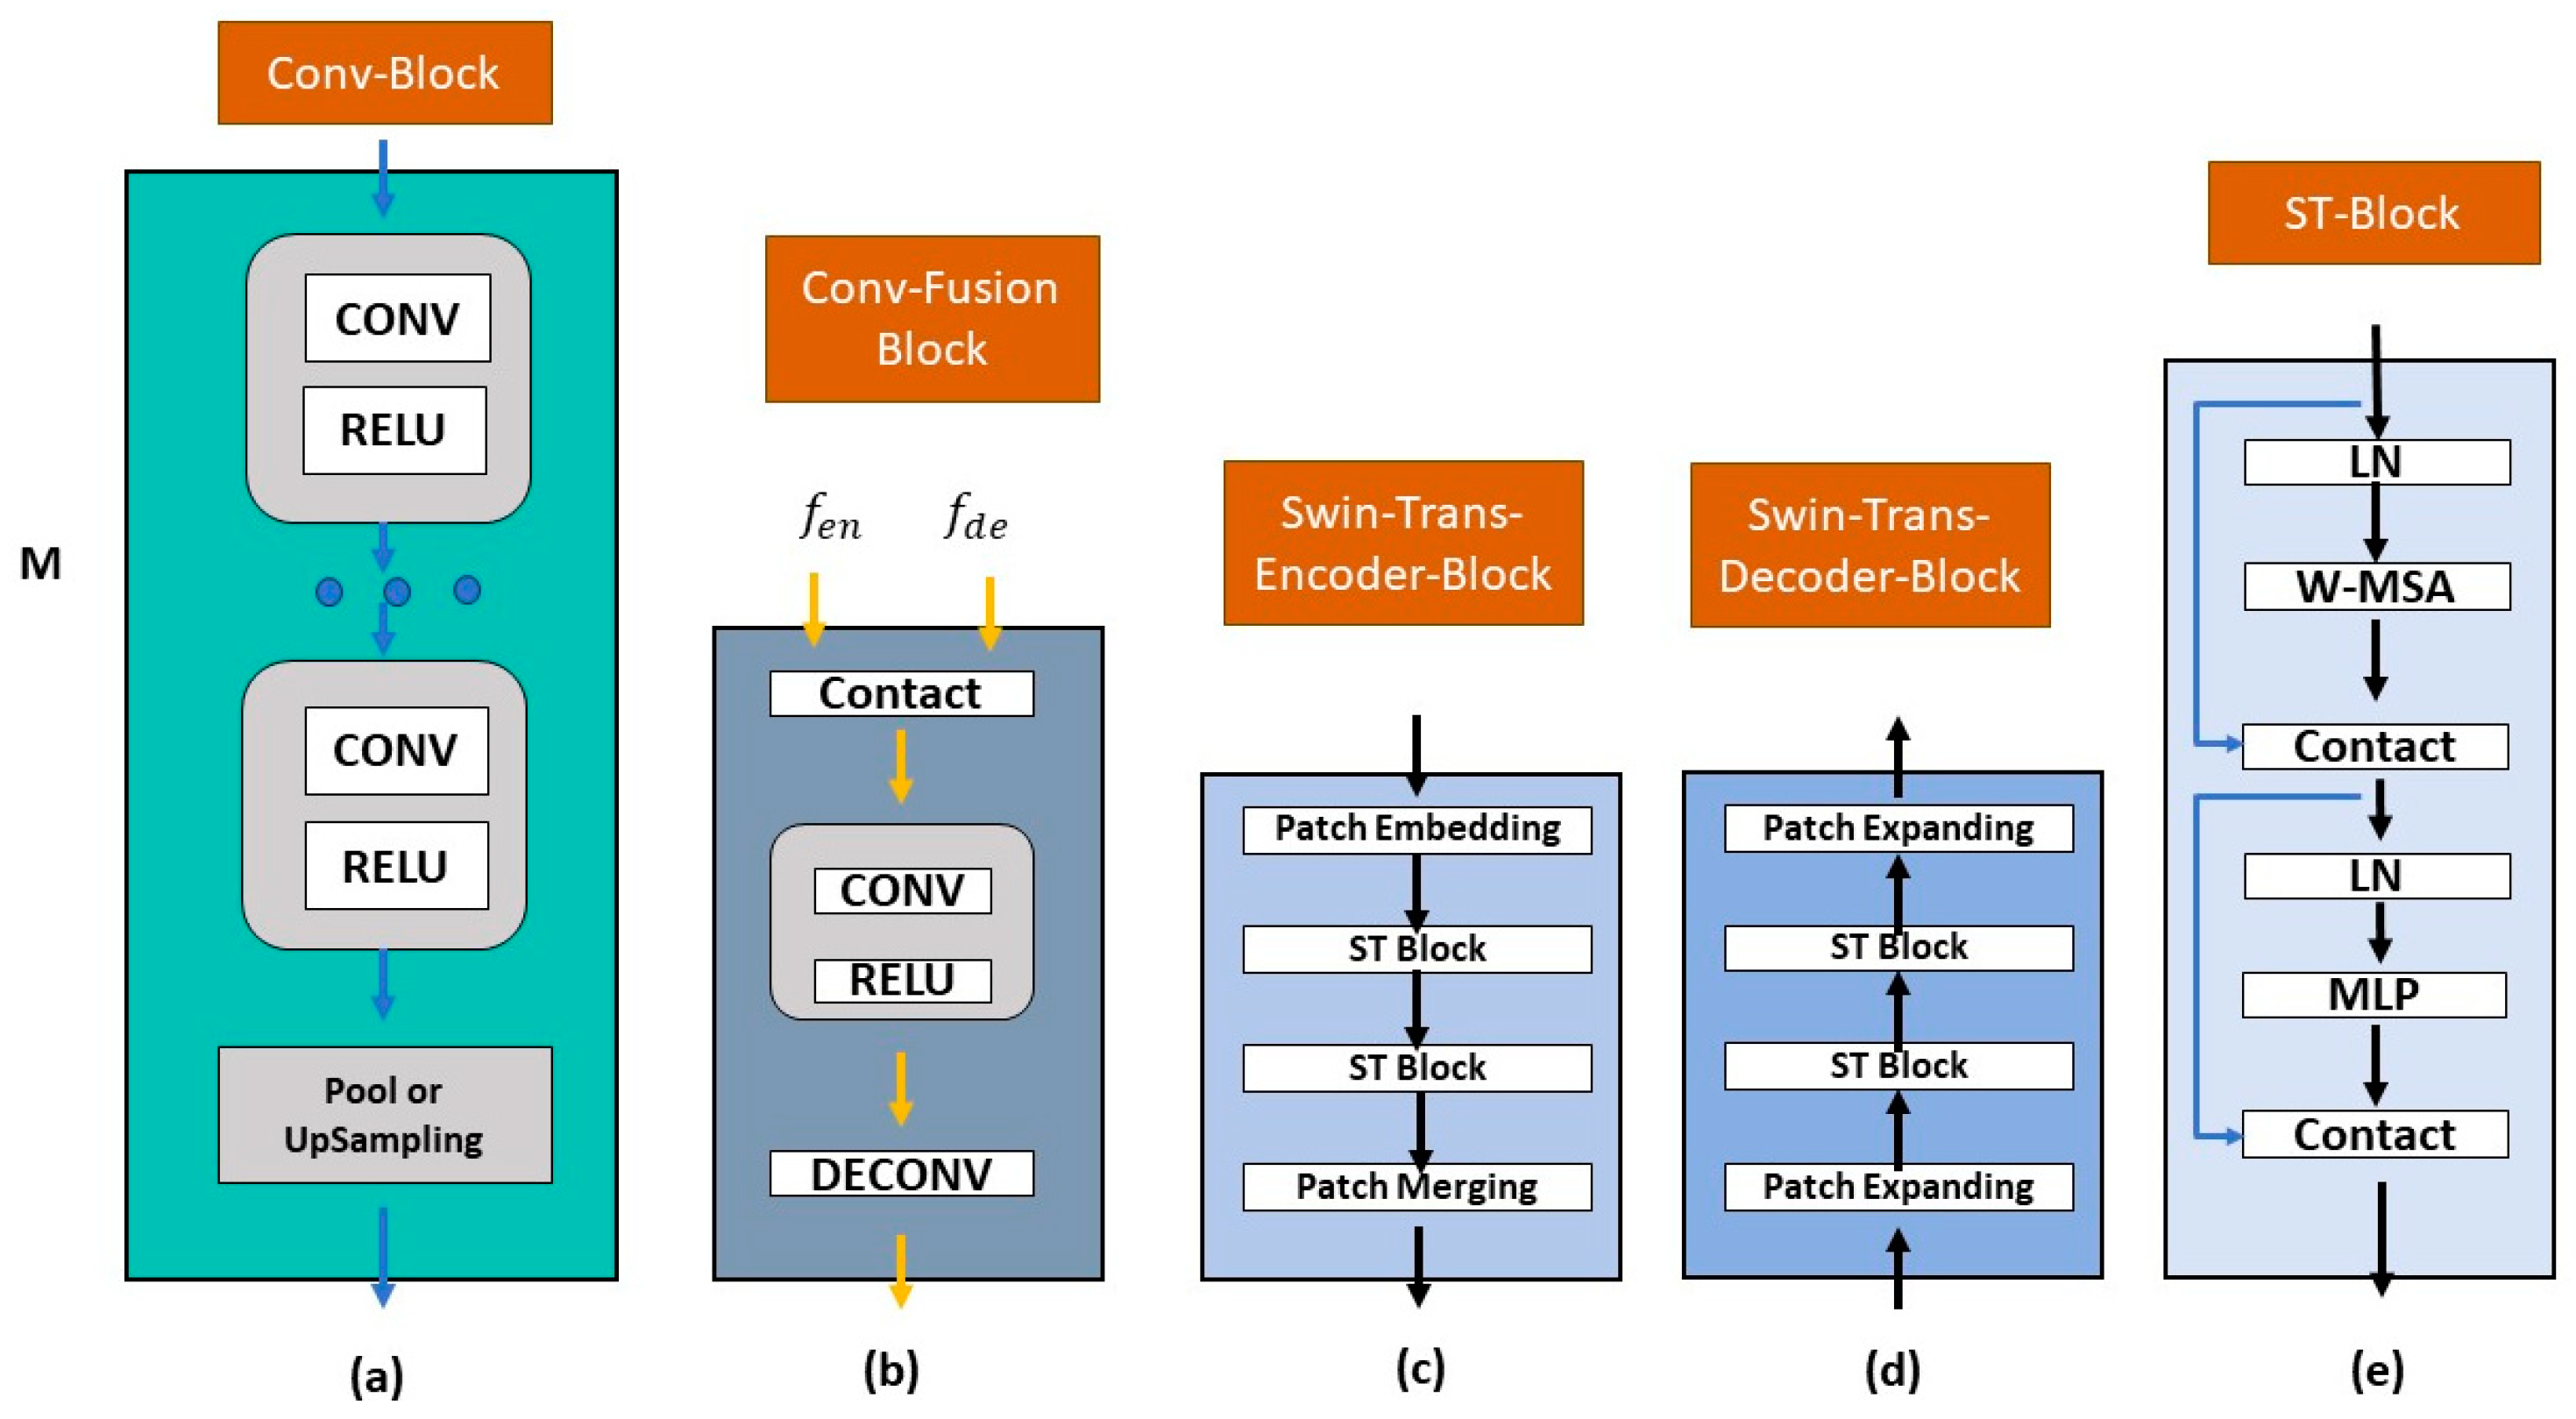
3.3. Proposed AdpativeSwin-CNN Architecture
3.3.1. Problem Definition
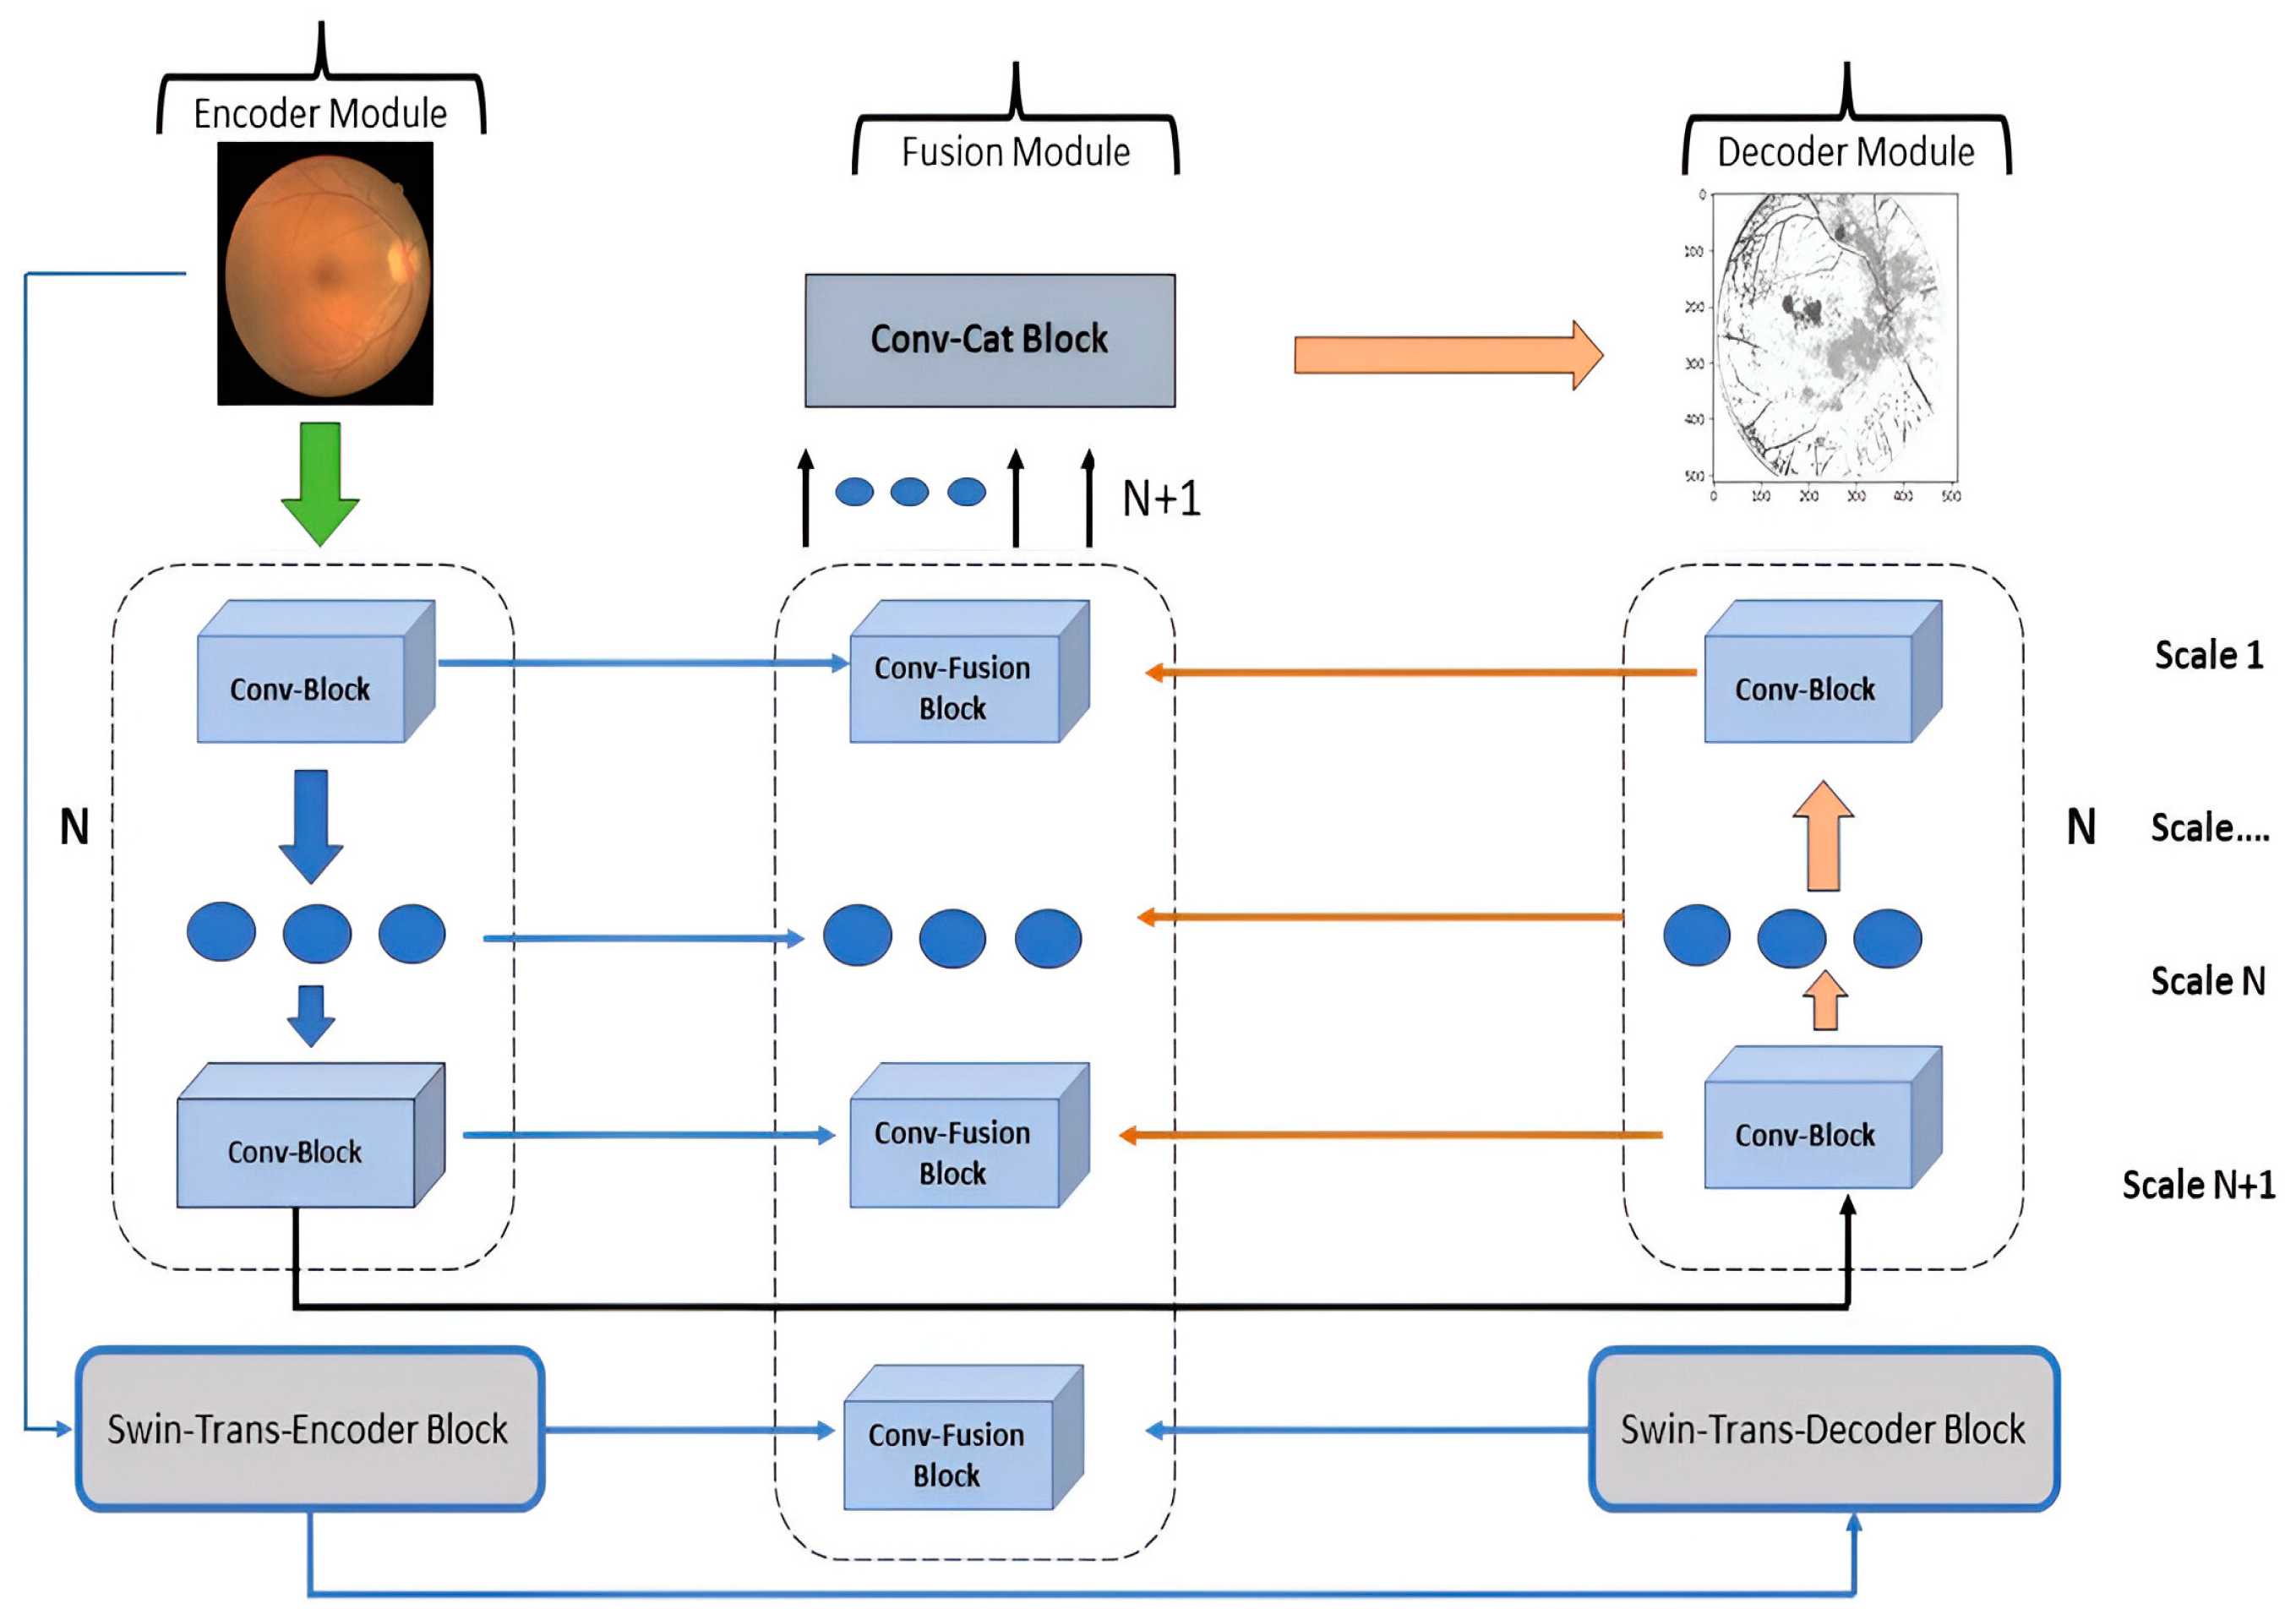
3.3.2. General Organization
3.3.3. Encoder Module (EM)
3.3.4. Decoder Module (DM)
3.3.5. Fusion Module (FM)
3.3.6. Loss Function
3.4. XGBoost Classifier
| Algorithm 2. XGBoost algorithm |
| Input: Consider feature data, i.e., x = [x1, x2, x3, …, xn] with labels and test samples |
| Output: Classes as normal, DR, HR, glaucoma and DME |
| Step 1: Initialize tree as a constant = for determination of normalization and parameters for a classifier. |
| Step 2: Apply Equation (11), where XGBoost classifier is constructed with minimize loss function. The classifier training is completed by using input feature data. |
| Step 3: Iterate through Step 2 until the model meets the stop condition. |
| Step4: The class label is applied to test samples by utilizing Equation (11)’s decision function. |
4. Experiments and Results
4.1. Experimental Setup
4.2. Performance Metrics
4.3. Experiment 1
4.4. Experiment 2
4.5. Experiment 3
4.6. Experiment 4
4.7. Experiment 5
4.8. Ablation Study
4.9. Computational Cost
5. Discussion
5.1. Potential Drawbacks of the AdaptiveSwin-CNN
5.2. Possible Future Directions
6. Conclusions
Funding
Institutional Review Board Statement
Informed Consent Statement
Data Availability Statement
Conflicts of Interest
References
- Joshi, R.C.; Sharma, A.K.; Dutta, M.K. VisionDeep-AI: Deep learning-based retinal blood vessels segmentation and multi-class classification framework for eye diagnosis. Biomed. Signal Process. Control 2024, 94, 106273. [Google Scholar] [CrossRef]
- Zhao, Z.; Chen, H.; Wang, Y.-P.; Meng, D.; Xie, Q.; Yu, Q.; Wang, L. Retinal disease diagnosis with unsupervised Grad-CAM guided contrastive learning. Neurocomputing 2024, 593, 127816. [Google Scholar] [CrossRef]
- Qureshi, I.; Yan, J.; Abbas, Q.; Shaheed, K.; Bin Riaz, A.; Wahid, A.; Khan, M.W.J.; Szczuko, P. Medical image segmentation using deep semantic-based methods: A review of techniques, applications and emerging trends. Inf. Fusion 2023, 90, 316–352. [Google Scholar] [CrossRef]
- Qureshi, I.; Ma, J.; Abbas, Q. Diabetic retinopathy detection and stage classification in eye fundus images using active deep learning. Multimed. Tools Appl. 2021, 80, 11691–11721. [Google Scholar] [CrossRef]
- Lecun, Y.; Bottou, L.; Bengio, Y.; Haffner, P. Gradient-based learning applied to document recognition. Proc. IEEE 1998, 86, 2278–2324. [Google Scholar] [CrossRef]
- Krizhevsky, A.; Sutskever, I.; Hinton, G.E. ImageNet Classification with Deep Convolutional Neural Networks. Commun. ACM 2017, 60, 84–90. [Google Scholar] [CrossRef]
- Simonyan, K.; Zisserman, A. Very deep convolutional networks for large-scale image recognition. arXiv 2014, arXiv:1409.1556. [Google Scholar] [CrossRef]
- Szegedy, C.; Liu, W.; Jia, Y.Q.; Sermanet, P.; Reed, S.; Anguelov, D.; Erhan, D.; Vanhoucke, V.; Rabinovich, A. Going Deeper with Convolutions. In Proceedings of the IEEE Conference on Computer Vision and Pattern Recognition (CVPR), Boston, MA, USA, 7–12 June 2015; pp. 1–9. [Google Scholar]
- He, K.; Zhang, X.; Ren, S.; Sun, J. Deep residual learning for image recognition. In Proceedings of the IEEE Conference on Computer Vision and Pattern Recognition, Las Vegas, NV, USA, 27–30 June 2016; pp. 770–778. [Google Scholar]
- Huang, G.; Liu, Z.; van der Maaten, L.; Weinberger, K.Q. Densely Connected Convolutional Networks. In Proceedings of the 30th IEEE/CVF Conference on Computer Vision and Pattern Recognition (CVPR), Honolulu, HI, USA, 21–26 July 2017; pp. 2261–2269. [Google Scholar]
- Howard, A.G.; Zhu, M.; Chen, B.; Kalenichenko, D.; Wang, W.; Weyand, T.; Andreetto, M.; Adam, H. Mobilenets: Efficient convolutional neural networks for mobile vision applications. arXiv 2017, arXiv:1704.04861. [Google Scholar] [CrossRef]
- Tan, M.X.; Le, Q.V. EfficientNet: Rethinking Model Scaling for Convolutional Neural Networks. In Proceedings of the 36th International Conference on Machine Learning (ICML), Long Beach, CA, USA, 9–15 June 2019. [Google Scholar]
- Vaswani, A.; Shazeer, N.; Parmar, N.; Uszkoreit, J.; Jones, L.; Gomez, A.N.; Kaiser, L.; Polosukhin, I. Attention Is All You Need. In Proceedings of the 31st Annual Conference on Neural Information Processing Systems (NIPS), Long Beach, CA, USA, 4–9 December 2017. [Google Scholar]
- Sharma, V.; Tripathi, A.K.; Mittal, H.; Nkenyereye, L. SoyaTrans: A novel transformer model for fine-grained visual classification of soybean leaf disease diagnosis. Expert Syst. Appl. 2025, 260, 125385. [Google Scholar] [CrossRef]
- Dosovitskiy, A.; Beyer, L.; Kolesnikov, A.; Weissenborn, D.; Zhai, X.; Unterthiner, T.; Dehghani, M.; Minderer, M.; Heigold, G.; Gelly, S.; et al. An Image is Worth 16x16 Words: Transformers for Image Recognition at Scale. arXiv 2021, arXiv:2010.11929. [Google Scholar]
- Tayal, A.; Gupta, J.; Solanki, A.; Bisht, K.; Nayyar, A.; Masud, M. DL-CNN-based approach with image processing techniques for diagnosis of retinal diseases. Multimed. Syst. 2022, 28, 1417–1438. [Google Scholar] [CrossRef]
- Meng, X.; Xi, X.; Yang, L.; Zhang, G.; Yin, Y.; Chen, X. Fast and effective optic disk localization based on convolutional neural network. Neurocomputing 2018, 312, 285–295. [Google Scholar] [CrossRef]
- Lin, C.-L.; Wu, K.-C. Development of revised ResNet-50 for diabetic retinopathy detection. BMC Bioinform. 2023, 24, 157. [Google Scholar] [CrossRef]
- Abbas, Q.; Daadaa, Y.; Rashid, U.; Sajid, M.Z.; Ibrahim, M.E.A. HDR-EfficientNet: A classification of hypertensive and diabetic retinopathy using optimize efficientnet architecture. Diagnostics 2023, 13, 3236. [Google Scholar] [CrossRef]
- Abbas, Q.; Qureshi, I.; Ibrahim, M.E.A. An automatic detection and classification system of five stages for hypertensive retinopathy using semantic and instance segmentation in DenseNet architecture. Sensors 2021, 21, 6936. [Google Scholar] [CrossRef] [PubMed]
- Sajid, M.Z.; Qureshi, I.; Youssef, A.; Khan, N.A. FAS-Incept-HR: A fully automated system based on optimized inception model for hypertensive retinopathy classification. Multimed. Tools Appl. 2024, 83, 14281–14303. [Google Scholar] [CrossRef]
- Reddy, V.P.C.; Gurrala, K.K. Joint DR-DME classification using deep learning-CNN based modified grey-wolf optimizer with variable weights. Biomed. Signal Process. Control 2022, 73, 103439. [Google Scholar] [CrossRef]
- Veena, H.; Muruganandham, A.; Kumaran, T.S. A novel optic disc and optic cup segmentation technique to diagnose glaucoma using deep learning convolutional neural network over retinal fundus images. J. King Saud Univ.-Comput. Inf. Sci. 2022, 34, 6187–6198. [Google Scholar] [CrossRef]
- Li, F.; Wang, Y.; Xu, T.; Dong, L.; Yan, L.; Jiang, M.; Zhang, X.; Jiang, H.; Wu, Z.; Zou, H. Deep learning-based automated detection for diabetic retinopathy and diabetic macular oedema in retinal fundus photographs. Eye 2022, 36, 1433–1441. [Google Scholar] [CrossRef] [PubMed]
- Huang, C.; Jiang, Y.; Yang, X.; Wei, C.; Chen, H.; Xiong, W.; Lin, H.; Wang, X.; Tian, T.; Tan, H. Enhancing Retinal Fundus Image Quality Assessment With Swin-Transformer–Based Learning Across Multiple Color-Spaces. Transl. Vis. Sci. Technol. 2024, 13, 8. [Google Scholar] [CrossRef]
- Yao, Z.; Yuan, Y.; Shi, Z.; Mao, W.; Zhu, G.; Zhang, G.; Wang, Z. FunSwin: A deep learning method to analysis diabetic retinopathy grade and macular edema risk based on fundus images. Front. Physiol. 2022, 13, 961386. [Google Scholar] [CrossRef]
- He, J.; Wang, J.; Han, Z.; Ma, J.; Wang, C.; Qi, M. An interpretable transformer network for the retinal disease classification using optical coherence tomography. Sci. Rep. 2023, 13, 3637. [Google Scholar] [CrossRef]
- Mok, D.; Bum, J.; Tai, L.D.; Choo, H. Cross Feature Fusion of Fundus Image and Generated Lesion Map for Referable Diabetic Retinopathy Classification. In Proceedings of the Asian Conference on Computer Vision, Hanoi, Vietnam, 8–12 December 2024; pp. 1350–1365. [Google Scholar]
- Li, Z.; Han, Y.; Yang, X. Multi-Fundus Diseases Classification Using Retinal Optical Coherence Tomography Images with Swin Transformer V2. J. Imaging 2023, 9, 203. [Google Scholar] [CrossRef]
- Tang, H.; Chen, Y.; Wang, T.; Zhou, Y.; Zhao, L.; Gao, Q.; Du, M.; Tan, T.; Zhang, X.; Tong, T. HTC-Net: A hybrid CNN-transformer framework for medical image segmentation. Biomed. Signal Process. Control 2024, 88, 105605. [Google Scholar] [CrossRef]
- Wang, J.; Mao, Y.-A.; Ma, X.; Guo, S.; Shao, Y.; Lv, X.; Han, W.; Christopher, M.; Zangwill, L.M.; Bi, Y.; et al. ODFormer: Semantic fundus image segmentation using transformer for optic nerve head detection. Inf. Fusion 2024, 112, 102533. [Google Scholar] [CrossRef]
- Shyamalee, T.; Meedeniya, D.; Lim, G.; Karunarathne, M. Automated tool support for glaucoma identification with explainability using fundus images. IEEE Access 2024, 12, 17290–17307. [Google Scholar] [CrossRef]
- Pachade, S.; Porwal, P.; Thulkar, D.; Kokare, M.; Deshmukh, G.; Sahasrabuddhe, V.; Giancardo, L.; Quellec, G.; Mériaudeau, F. Retinal fundus multi-disease image dataset (RFMiD): A dataset for multi-disease detection research. Data 2021, 6, 14. [Google Scholar] [CrossRef]
- Guergueb, T.; Akhloufi, M.A. Ocular diseases detection using recent deep learning techniques. In Proceedings of the 2021 43rd Annual International Conference of the IEEE Engineering in Medicine & Biology Society (EMBC), Virtual, 1–5 November 2021; pp. 3336–3339. [Google Scholar] [CrossRef]
- Liu, Z.; Lin, Y.; Cao, Y.; Hu, H.; Wei, Y.; Zhang, Z.; Lin, S.; Guo, B. Swin transformer: Hierarchical vision transformer using shifted windows. In Proceedings of the IEEE/CVF International Conference on Computer Vision, Montreal, BC, Canada, 11–17 October 2021; pp. 10012–10022. [Google Scholar]
- Szegedy, C.; Vanhoucke, V.; Ioffe, S.; Shlens, J.; Wojna, Z. Rethinking the inception architecture for computer vision. In Proceedings of the IEEE Conference on Computer Vision and Pattern Recognition, Las Vegas, NV, USA, 27–30 June 2016; pp. 2818–2826. [Google Scholar]
- Chollet, F. Xception: Deep learning with depthwise separable convolutions. In Proceedings of the IEEE Conference on Computer Vision and Pattern Recognition, Honolulu, HI, USA, 21–26 July 2017; pp. 1251–1258. [Google Scholar]
- Puneet, R.K.; Gupta, M. Optical coherence tomography image based eye disease detection using deep convolutional neural network. Health Inf. Sci. Syst. 2022, 10, 13. [Google Scholar] [CrossRef]
- Nazir, T.; Nawaz, M.; Rashid, J.; Mahum, R.; Masood, M.; Mehmood, A.; Ali, F.; Kim, J.; Kwon, H.-Y.; Hussain, A. Detection of diabetic eye disease from retinal images using a deep learning based CenterNet model. Sensors 2021, 21, 5283. [Google Scholar] [CrossRef]
- Hu, W.; Li, K.; Gagnon, J.; Wang, Y.; Raney, T.; Chen, J.; Chen, Y.; Okunuki, Y.; Chen, W.; Zhang, B. FundusNet: A Deep-Learning Approach for Fast Diagnosis of Neurodegenerative and Eye Diseases Using Fundus Images. Bioengineering 2025, 12, 57. [Google Scholar] [CrossRef]
- Qureshi, I.; Abbas, Q.; Yan, J.; Hussain, A.; Shaheed, K.; Baig, A.R. Computer-aided detection of hypertensive retinopathy using depth-wise separable CNN. Appl. Sci. 2022, 12, 12086. [Google Scholar] [CrossRef]

| Image Benchmark | No. of Images | Disease Type | Image Modality | Size |
|---|---|---|---|---|
| RFMiD [33] | 900 | Normal | Color Fundus Image | 4288 × 4288 to 2144 × 2144 pixels |
| 300 | DR | Color Fundus Image | 4288 × 4288 to 2144 × 2144 pixels | |
| 300 | HR | Color Fundus Image | 4288 × 4288 to 2144 × 2144 pixels | |
| 150 | Glaucoma | Color Fundus Image | 4288 × 4288 to 2144 × 2144 pixels | |
| 270 | DME | Color Fundus Image | 4288 × 4288 to 2144 × 2144 pixels | |
| ODIR [34] | 500 | Normal | Color Fundus Image | 700 × 600 pixels |
| 290 | DR | Color Fundus Image | 700 × 600 pixels | |
| 150 | HR | Color Fundus Image | 700 × 600 pixels | |
| 250 | Glaucoma | Color Fundus Image | 700 × 600 pixels | |
| 200 | DME | Color Fundus Image | 700 × 600 pixels | |
| Total Images | 3310 Downsizing: 224 × 224 pixels | |||
| Classes | Total Images | |||
|---|---|---|---|---|
| Before Augmentation | After Augmentation | Training Set | Testing Set | |
| Normal | 1400 | 1500 | 1300 | 200 |
| DR | 590 | 700 | 600 | 100 |
| HR | 450 | 600 | 500 | 100 |
| Glaucoma | 400 | 550 | 450 | 100 |
| DME | 470 | 600 | 500 | 100 |
| Total | 3310 | 3950 | 3350 | 600 |
| Convolution Layers | Parameters |
|---|---|
| Conv-32 | (3 × 3 × 3 + 1) × 32 |
| Conv-32 | (3 × 3 × 32 + 1) × 64 |
| Conv-64 | (3 × 3 × 64) + (1 × 1 × 64 + 1) × 128 |
| Conv-64 | (3 × 3 × 128) + (1 × 1 × 128 + 1) × 128 |
| Conv-128 | (3 × 3 × 128) + (1 × 1 × 128 + 1) × 256 |
| Conv-128 | (3 × 3 × 256) + (1 × 1 × 256 + 1) × 256 |
| Conv-256 | (3 × 3 × 256) + (1 × 1 × 256 + 1) × 728 |
| Conv-256 | (3 × 3 × 728) + (1 × 1 × 728 + 1) × 728 |
| Total | 87,488 |
| Models | Sensitivity % | Specificity % | Accuracy % |
|---|---|---|---|
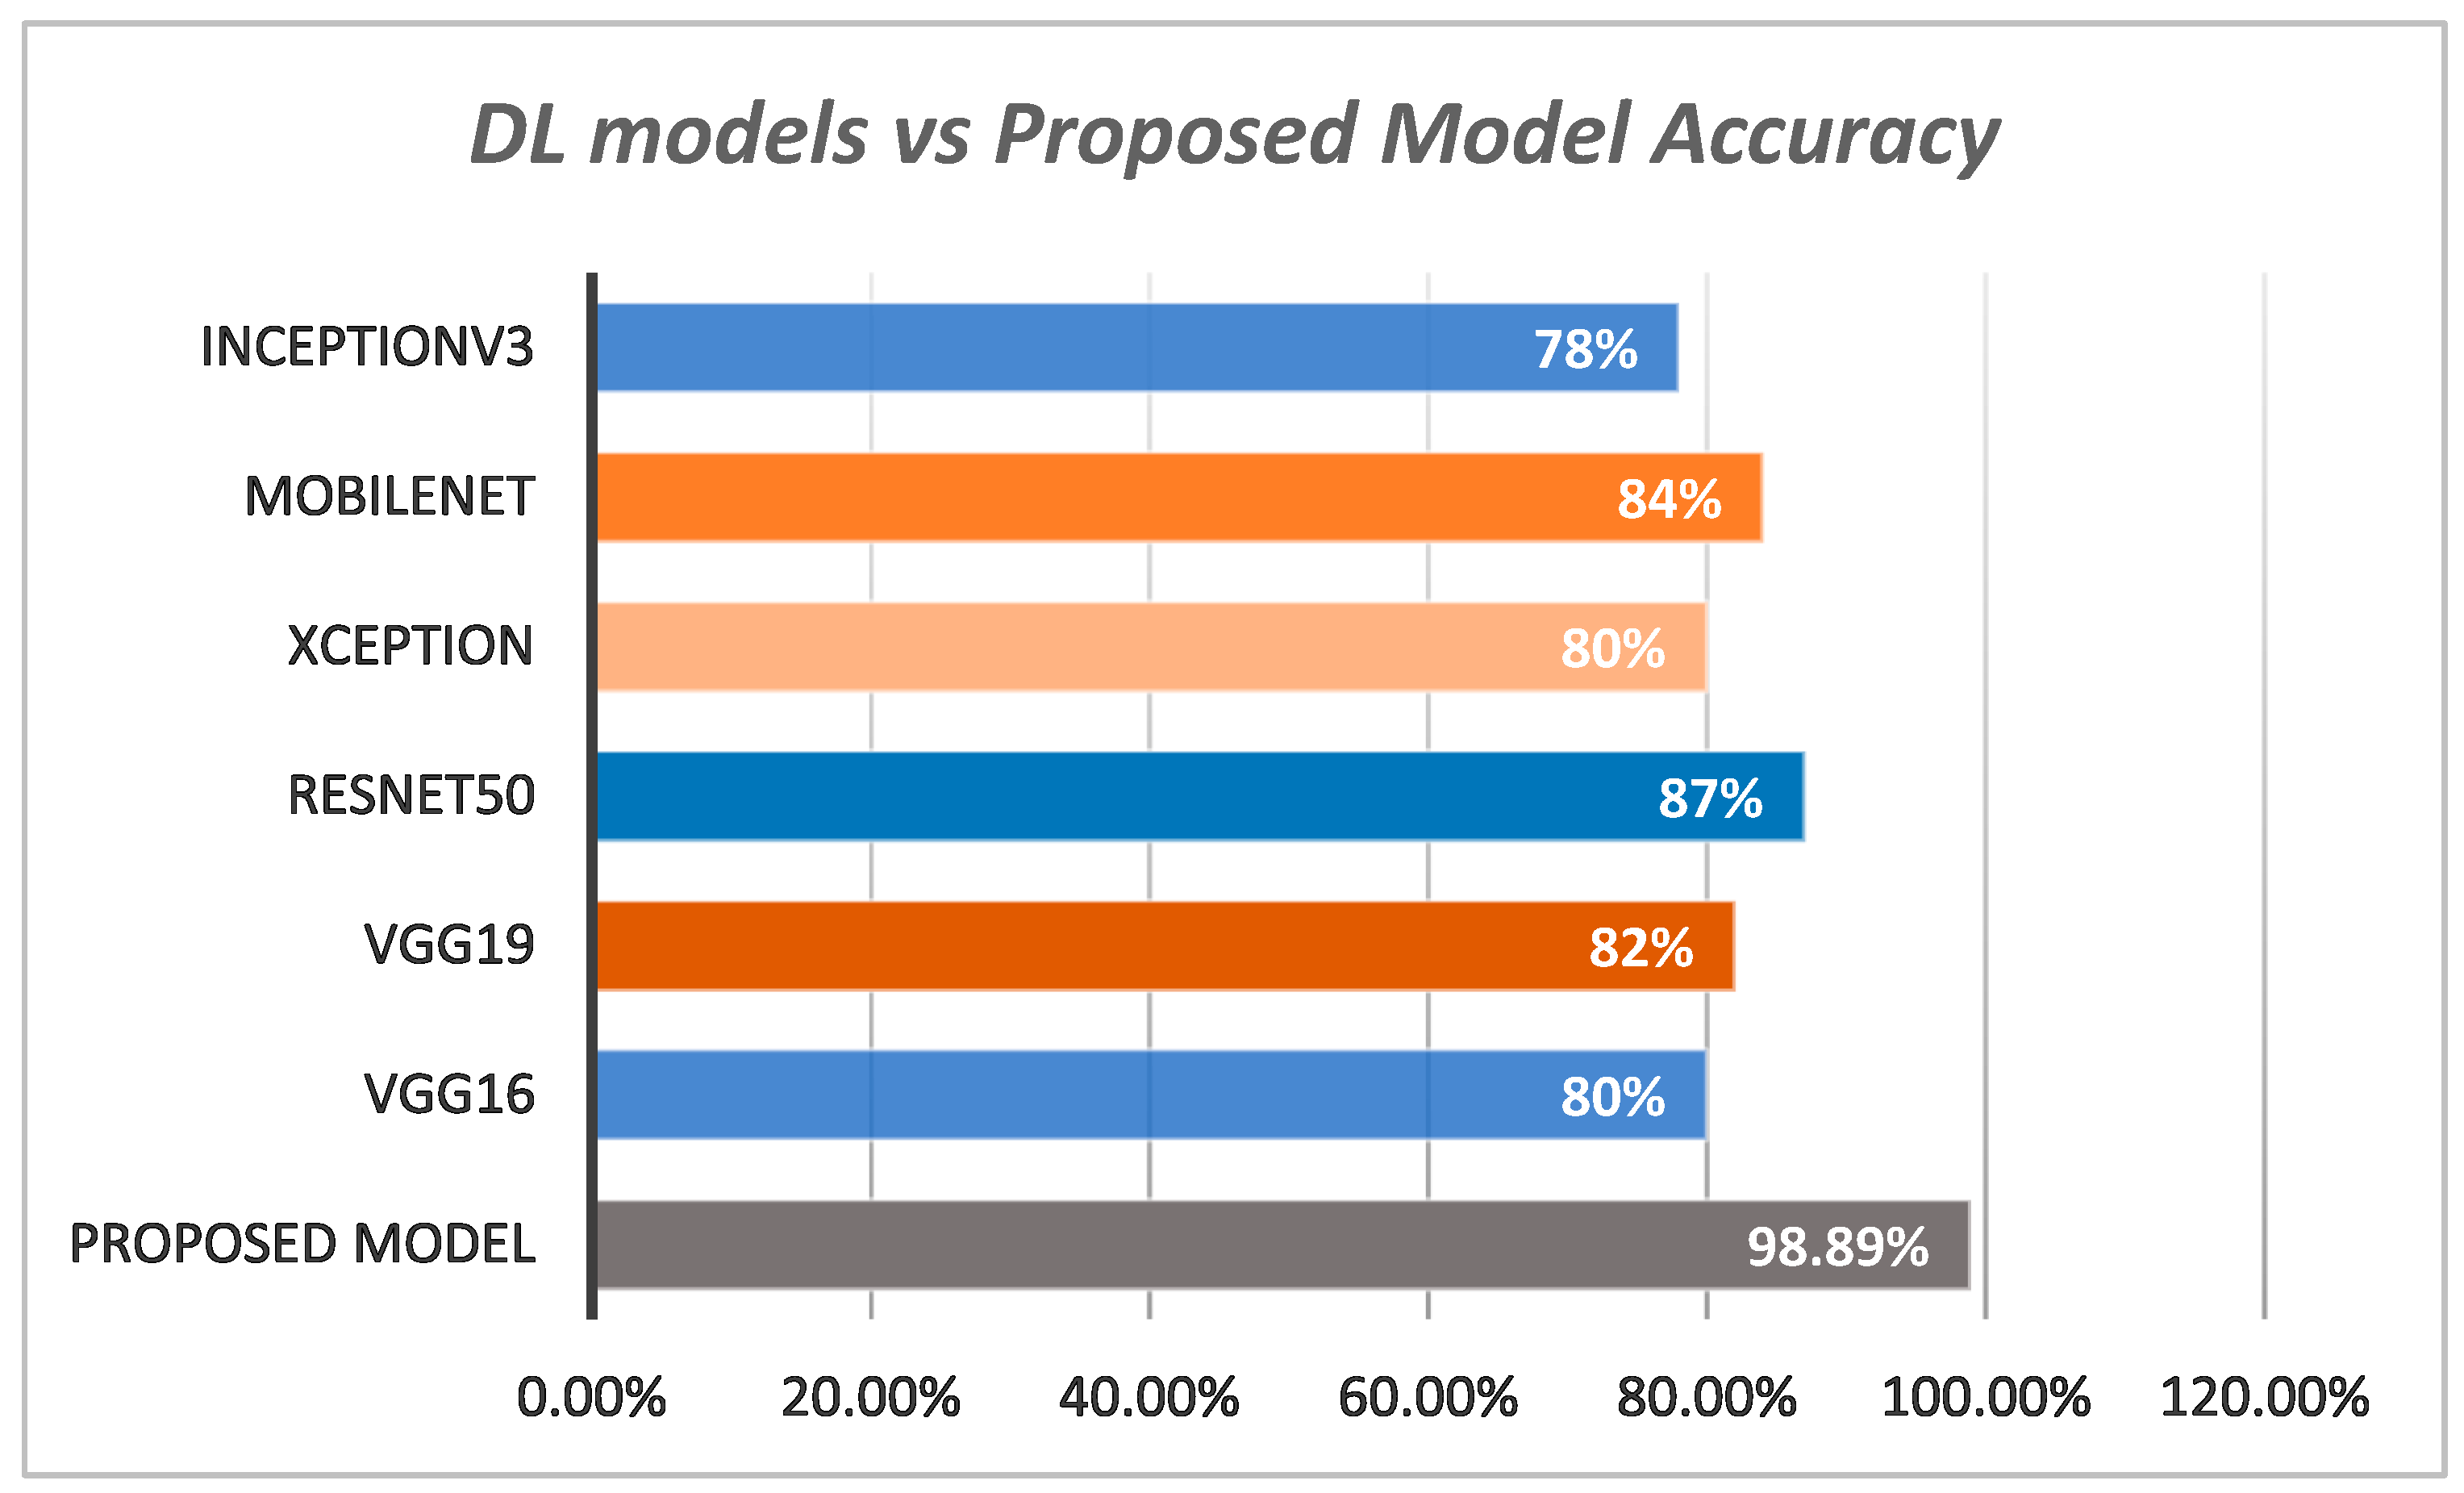
| VGG16 | 78 | 79 | 80 |
| VGG19 | 79 | 81 | 82 |
| InceptionV3 | 75 | 77 | 78 |
| ResNet50 | 85 | 84.9 | 87 |
| Xception | 79.2 | 80.4 | 80 |
| MobileNet | 81.6 | 82.7 | 84 |
| Proposed Model | 95.2 | 96.7 | 98.89 |
| Classes | Sensitivity % | Specificity % | F1-Score % | Accuracy % | E |
|---|---|---|---|---|---|
| Normal | 98.8 | 99.2 | 99.5 | 99.8 | 0.12 |
| DR | 97.7 | 96.5 | 96.2 | 98.7 | 0.45 |
| HR | 97.8 | 96.8 | 96.7 | 98.5 | 0.76 |
| Glaucoma | 98.4 | 97.2 | 96.8 | 98.8 | 0.67 |
| DME | 97.3 | 96.5 | 97.2 | 98.2 | 0.56 |
| Average | 98 | 97.24 | 97.28 | 98.8 | 0.51 |
| Works | Sensitivity % | Specificity % | Accuracy % | F1-Score % |
|---|---|---|---|---|
| FunSwin [26] | 94.8 | 95.2 | 96.6 | 96 |
| SwinTranV2 [29] | 95.1 | 97.1 | 98.50 | 97.2 |
| DCNN [38] | 94.7 | 94.8 | 95.6 | 95 |
| CenterNet [39] | 94.5 | 97.1 | 98.10 and 97.13 | 97 |
| Proposed | 95.2 | 96.7 | 98.89 | 97.28 |
| Works | Sensitivity % | Specificity % | Accuracy % | F1-Score % |
|---|---|---|---|---|
| CNN | 86.2 | 85.6 | 86.1 | 85.8 |
| CNN + ST | 87.2 | 86.8 | 86.2 | 86.6 |
| CNN + XgBoost | 86.3 | 85.8 | 86.3 | 86.1 |
| ST | 86.3 | 85.9 | 86.4 | 86.1 |
| AdpativeSwin-CNN | 95.2 | 96.7 | 98.89 | 97.28 |
| Drawback | Illustrations |
|---|---|
| Narrow generalization | The proposed system’s performance might be compromised using the datasets collected from various centers. Usually, such benchmarks consist of variations between image quality and patient attributes. |
| Accessibility of data | The proposed system’s success is highly dependent on the accessibility and variety of well-annotated retinal fundus pictures for training. The effectiveness of the system may be hindered due to a lack of sufficient data. |
| Restricted to fundus modality | The proposed technique can only be used for the diagnosis of eye problems using images of the retina, namely the colored fundus image. Other image modalities should investigate to identify in-depth image features. |
| Computational resources | In general, training DL models requires a substantial amount of computer resources, which can restrict the accessibility of the system in contexts with limited resources. |
Disclaimer/Publisher’s Note: The statements, opinions and data contained in all publications are solely those of the individual author(s) and contributor(s) and not of MDPI and/or the editor(s). MDPI and/or the editor(s) disclaim responsibility for any injury to people or property resulting from any ideas, methods, instructions or products referred to in the content. |
© 2025 by the author. Licensee MDPI, Basel, Switzerland. This article is an open access article distributed under the terms and conditions of the Creative Commons Attribution (CC BY) license (https://creativecommons.org/licenses/by/4.0/).
Share and Cite
Qureshi, I. AdaptiveSwin-CNN: Adaptive Swin-CNN Framework with Self-Attention Fusion for Robust Multi-Class Retinal Disease Diagnosis. AI 2025, 6, 28. https://doi.org/10.3390/ai6020028
Qureshi I. AdaptiveSwin-CNN: Adaptive Swin-CNN Framework with Self-Attention Fusion for Robust Multi-Class Retinal Disease Diagnosis. AI. 2025; 6(2):28. https://doi.org/10.3390/ai6020028
Chicago/Turabian StyleQureshi, Imran. 2025. "AdaptiveSwin-CNN: Adaptive Swin-CNN Framework with Self-Attention Fusion for Robust Multi-Class Retinal Disease Diagnosis" AI 6, no. 2: 28. https://doi.org/10.3390/ai6020028
APA StyleQureshi, I. (2025). AdaptiveSwin-CNN: Adaptive Swin-CNN Framework with Self-Attention Fusion for Robust Multi-Class Retinal Disease Diagnosis. AI, 6(2), 28. https://doi.org/10.3390/ai6020028