Grad-CAM-Assisted Deep Learning for Mode Hop Localization in Shearographic Tire Inspection
Abstract
1. Introduction
2. State of the Art
2.1. Shearography
2.2. Mode Hop as a Disturbance in Shearographic Inspection
2.3. Deep Learning in Non-Destructive Testing
3. Methodology
3.1. Measuring Setup and Testing Machines
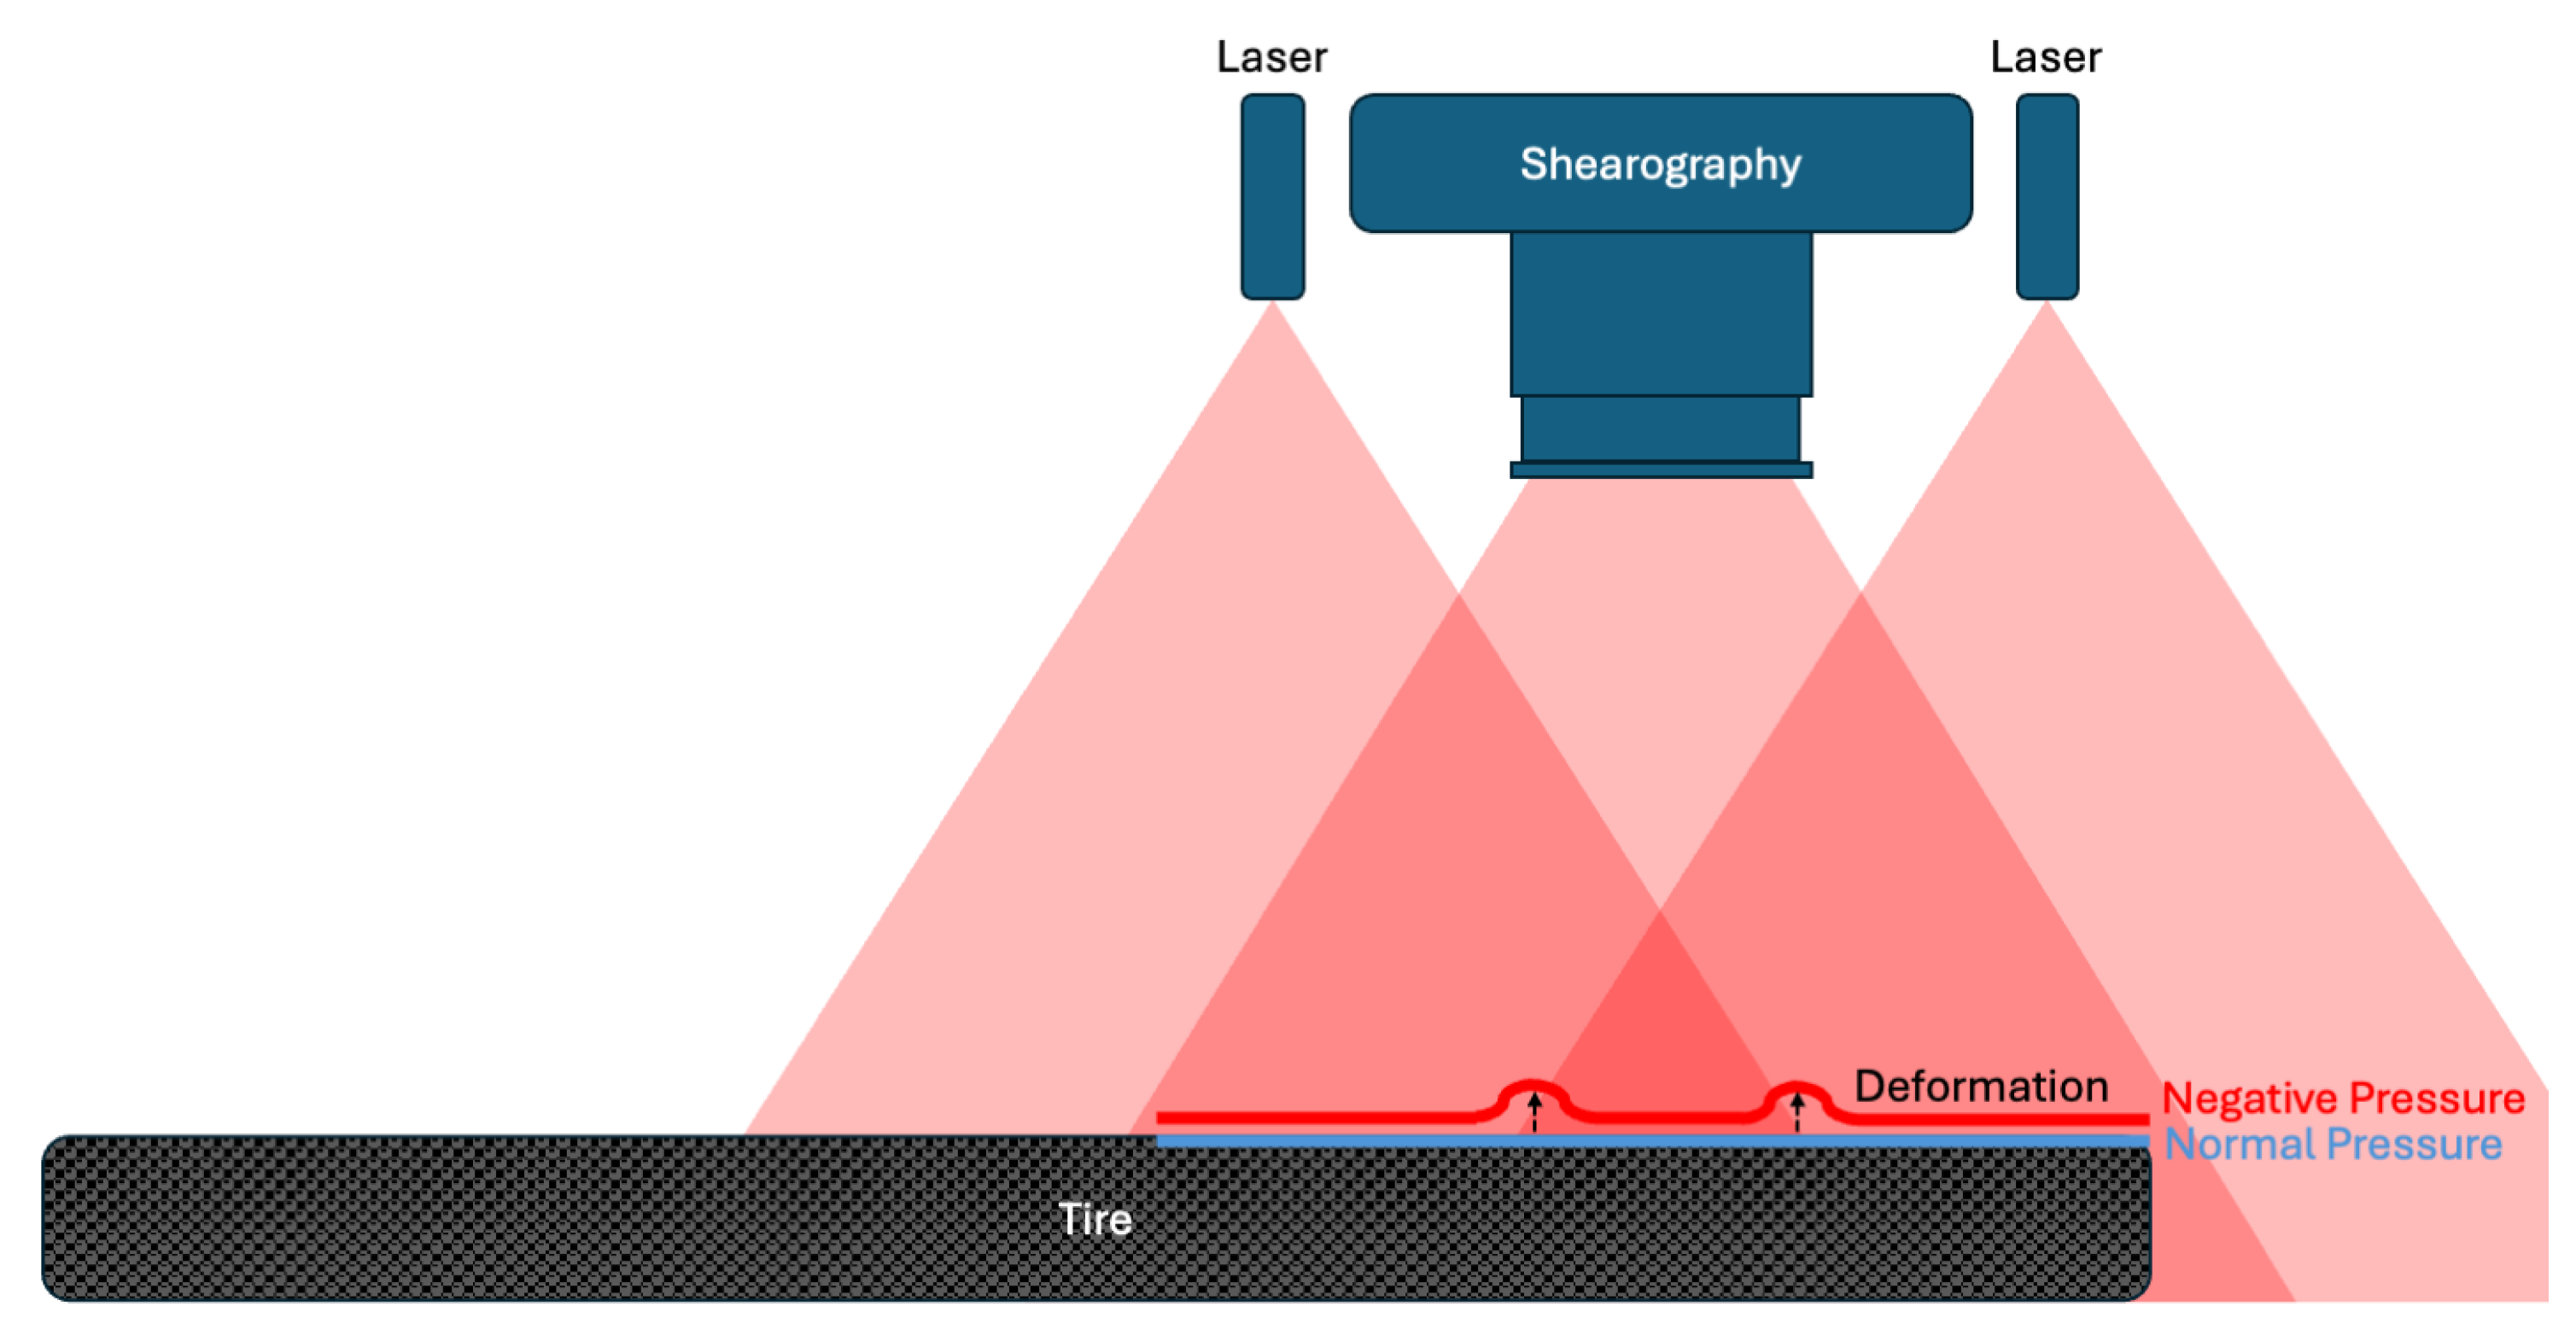
- Age-related system characteristics: Progressive soiling of camera lenses and diodes, age-related factors, and machine mechanics.
- Machine environmental influences: Temperature fluctuations, vibrations or shocks, and dust and dirt particles that can affect image quality.
- Tire artifacts: Fluid residues, dirt, stickers, deposits of ice or snow, and stress markers due to mechanical stress.
- Tire findings: Blisters, separations, wear marks, repair patches, and other damage.
3.2. Dataset Description
3.3. Model Architecture: ResNet-50 CNN Implemented in PyTorch
3.4. Rationale for Backbone Selection
3.5. Training Strategy and Hyperparameter Optimization
4. Experiments and Results
4.1. Experiment 1: Initial Training and Mode Hop Identification
4.1.1. Training Dataset Overview
4.1.2. Training Setup
4.1.3. Test Dataset and Results
4.2. Experiment 2: Data Expansion and Model Robustness
4.2.1. Objective and Strategy
4.2.2. Training and Test Dataset Overview
4.2.3. Hyperparameter Settings
4.2.4. Training and Results
4.3. Experiment 3: Explainability and Localization Using Grad-CAM
4.3.1. Objective and Setup
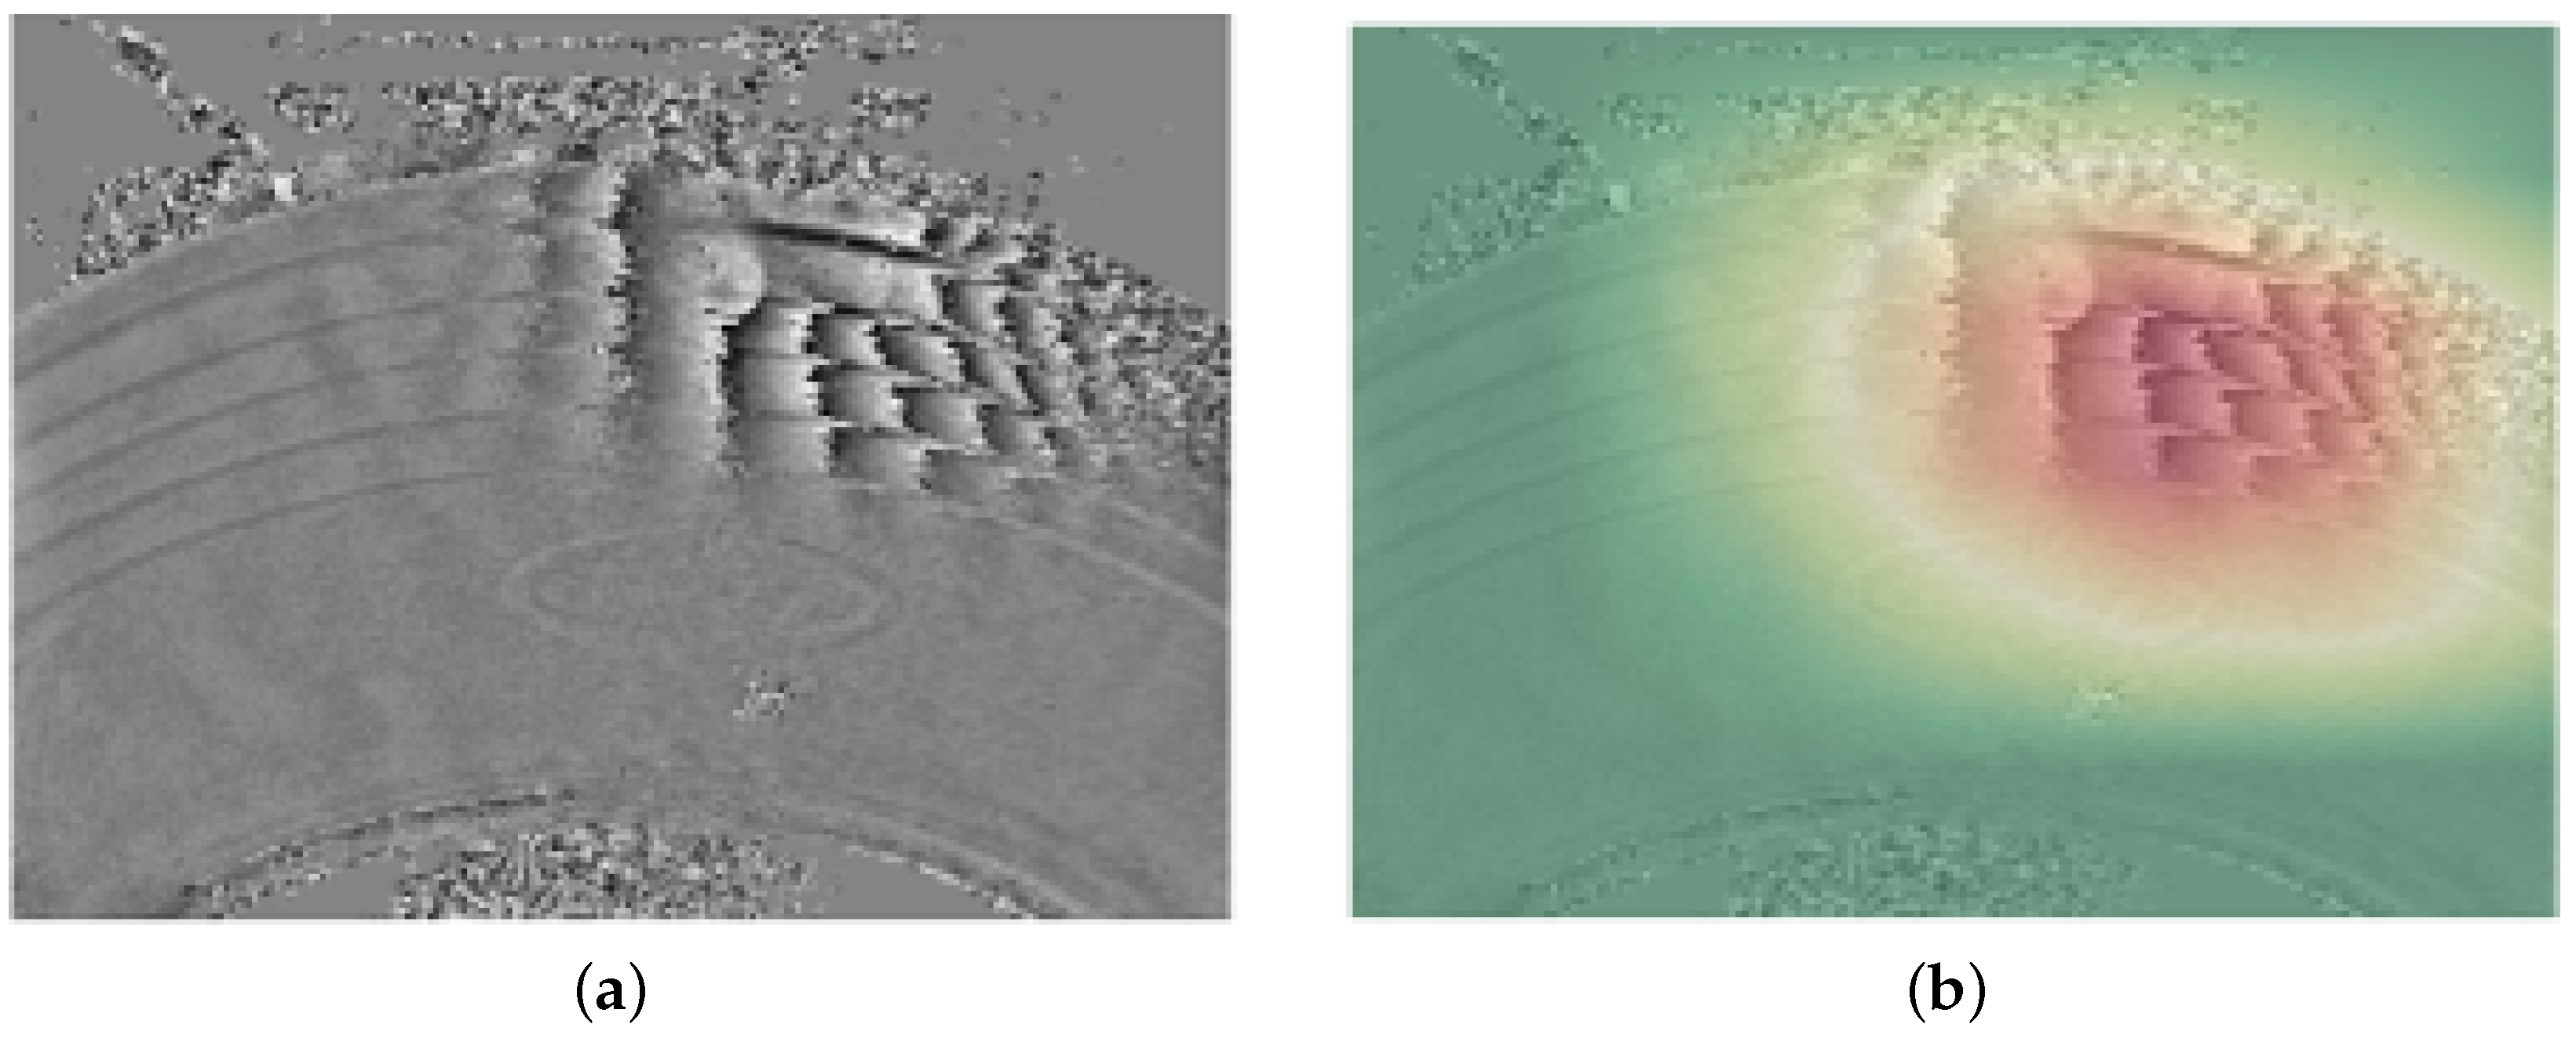
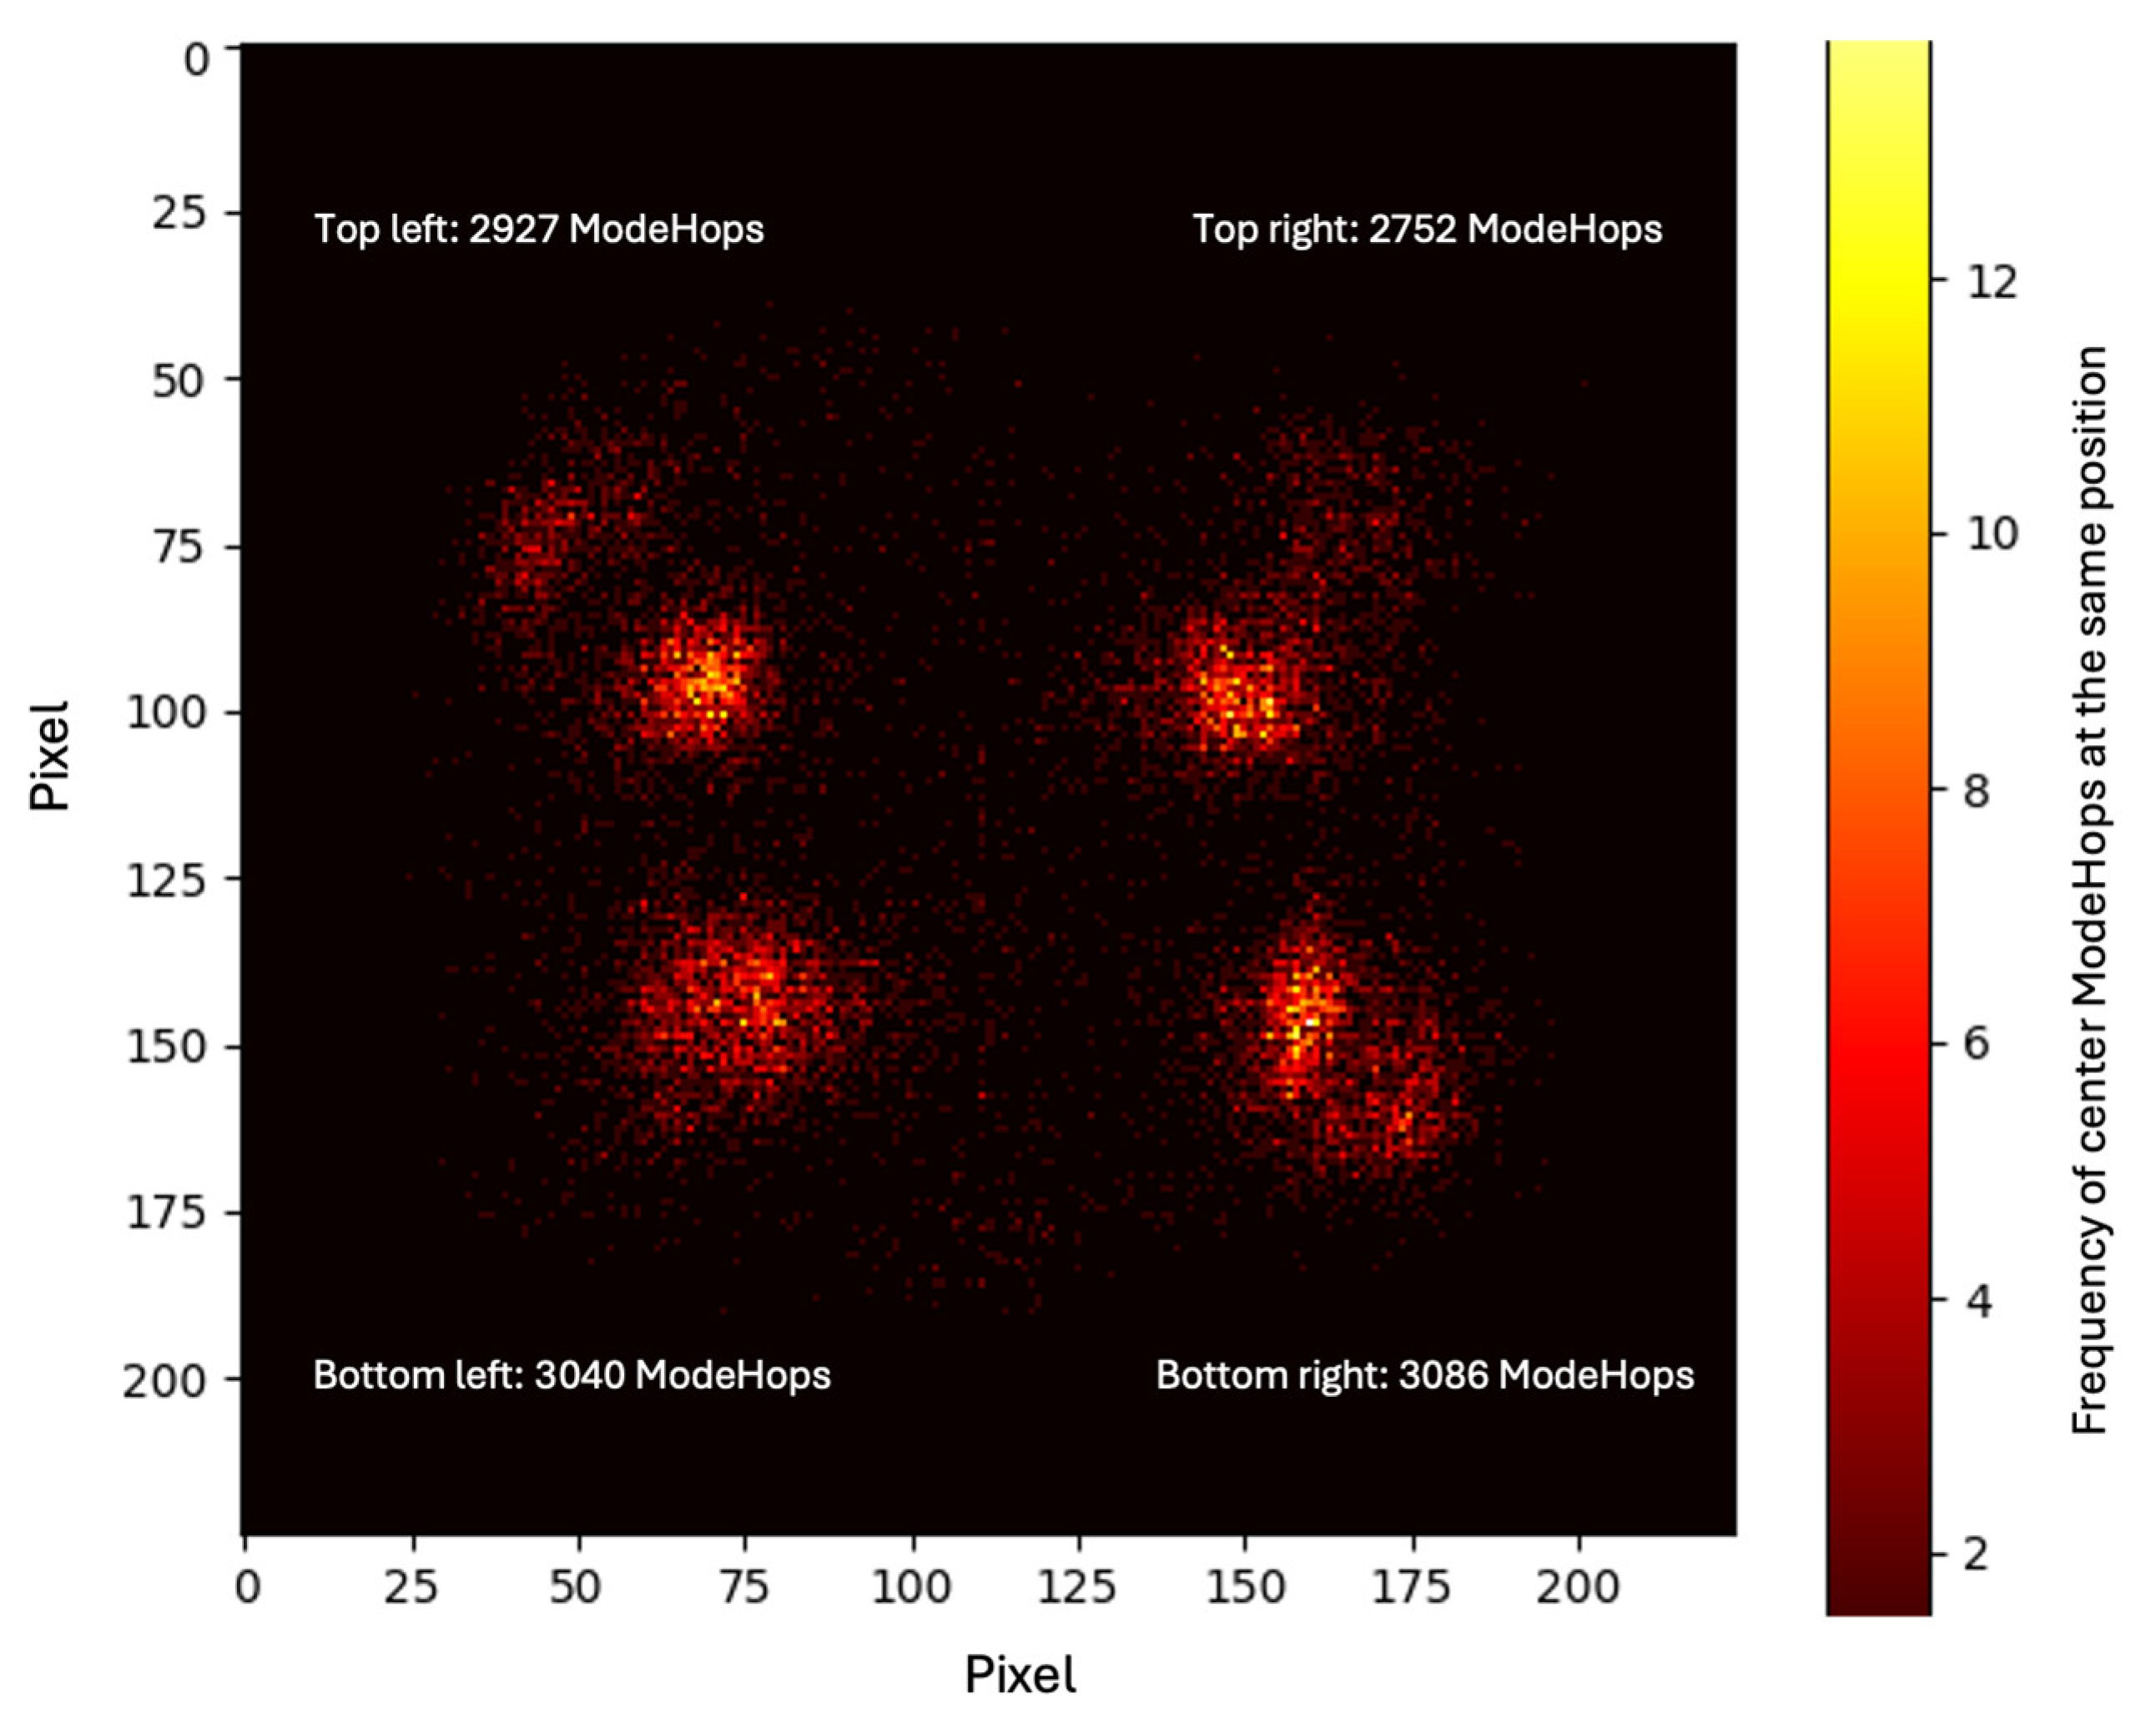
4.3.2. Results and Interpretation
4.4. Experiment 4: Statistical Validation of False Positives
4.4.1. Objective and Methodology
- Initial detection: The AI model flags a Mode Hop in a given image quadrant during the first inspection run.
- Targeted re-inspection: The same tire sector is immediately re-inspected under identical conditions.
- Probability check: The second detection is compared with the first; only if the Mode Hop is present in the same quadrant is it confirmed as a true positive.
- Decision:
- Confirmed → classification as a valid Mode Hop.
- Not confirmed → classification as false-positive, discard.
- : Probability of occurrence of a Mode Hop in the first test.
- : Probability of a true Mode Hop occurring again in the same quadrant.
- : Probability that both events occur consistently.
- : Decision threshold.
- : Number of recordings with Mode Hops.
- : Total number of recordings (with and without Mode Hops).
- Crown:
- Sidewall:
- Total:
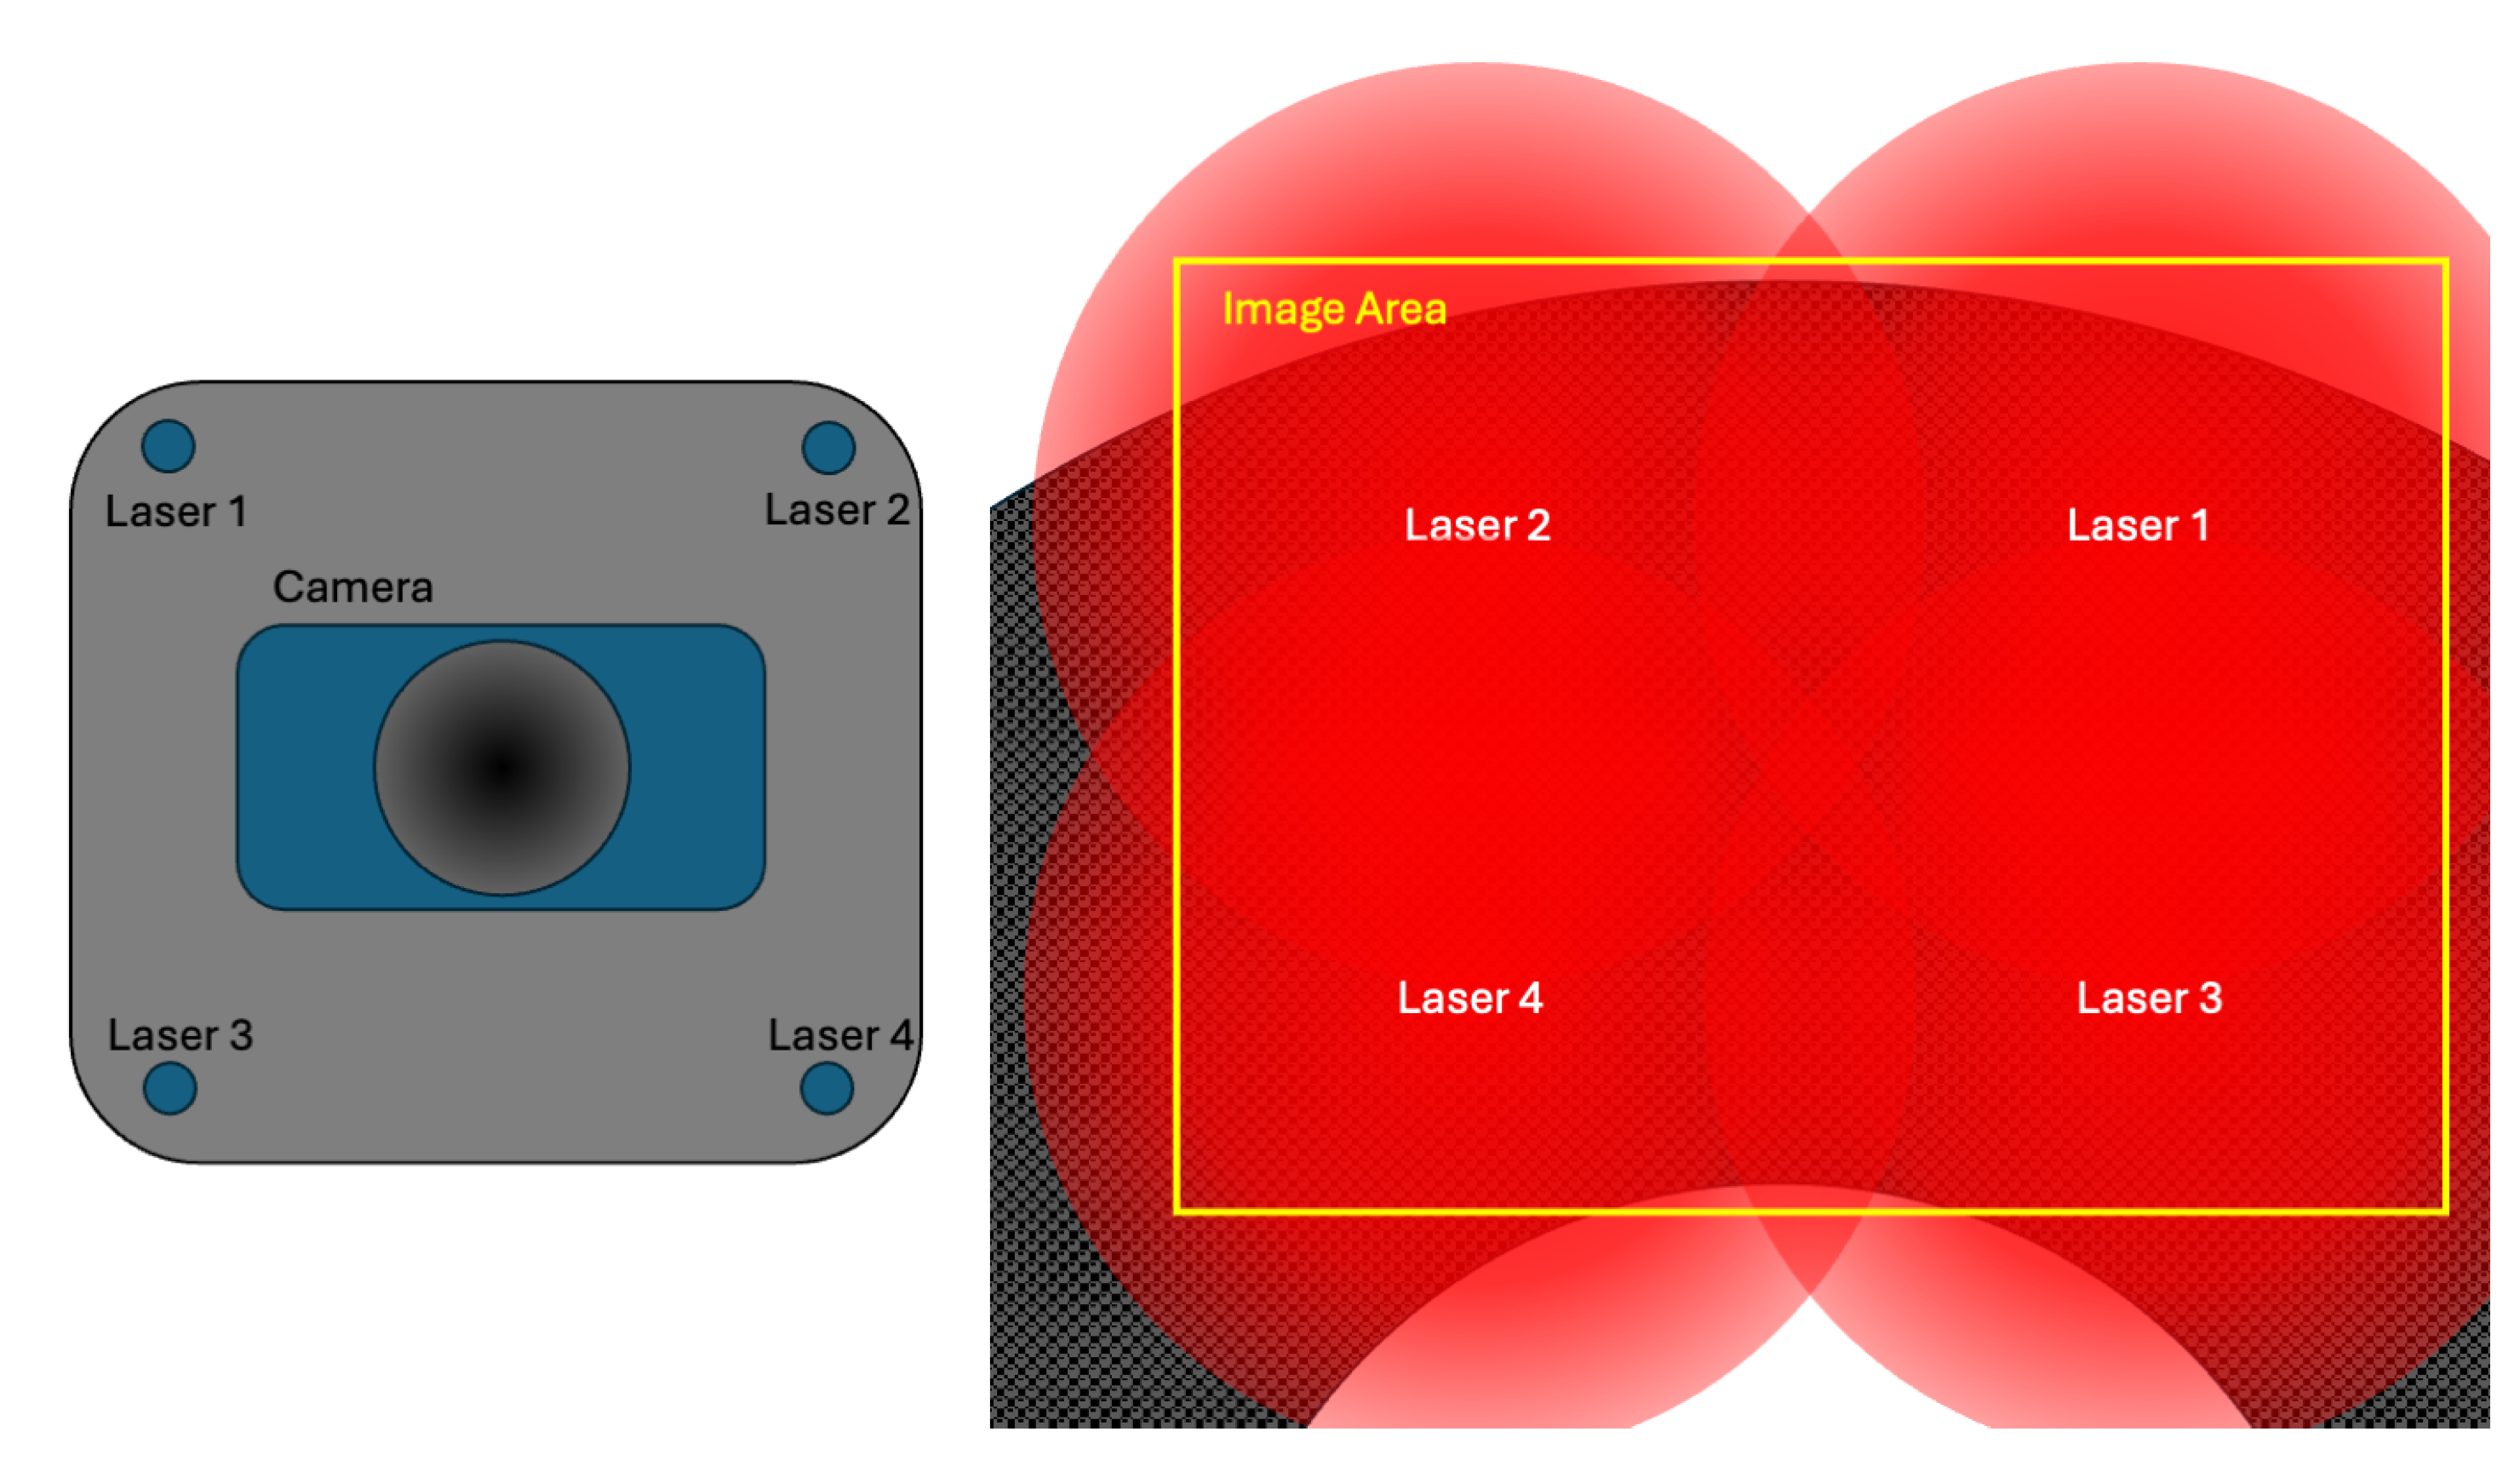
- : Conditional probability of a Mode Hop occurring in a specific quadrant , assuming uniform distribution.
- : Total probability of a Mode Hop occurring in a single shearography image.
- : Probability that two Mode Hops occur independently in two consecutive shearography images.
- : Probability that two Mode Hops occur consecutively in the same quadrant , assuming statistical independence and uniform distribution.
- : Expected number of cases until this event occurs once (mathematical expectation).
4.4.2. Probability Calculations and Result
4.4.3. Uncertainty Estimation of the Repeat Probability
5. Discussion
- The Mode Hop labeling was performed by several experienced shearography experts, who sequentially inspected the dataset. Their annotations were subsequently compared and consolidated. However, a formal inter-rater reliability study, in which multiple experts independently label the same dataset for statistical agreement analysis, was not conducted. This may introduce subjectivity and remains an open issue for future work.
- The validation was restricted to two shearography systems. While two independent machines were included, no third-party external dataset was available. We, therefore, added a leave-one-machine-out validation to mimic an external shift; nevertheless, a true external validation on different hardware and environments remains for future work.
- The applied data augmentation was limited to mirroring and small rotations. While this preserved realistic shearographic patterns and was sufficient for the present proof of concept, it did not extend beyond the naturally occurring variations already present in the dataset, such as intensity- or contrast-related changes due to laser drift, contamination, reflections, or operational vibrations. Because only two machines were used, these effects are represented but not in the full range of possible industrial conditions.
- While Grad-CAM provided plausible quadrant-level localization of Mode Hops, no quantitative pixel-level metric such as IoU was applied, as this is not directly applicable in our setup. The method focuses on quadrant determination rather than precise segmentation, and detailed annotation masks are not available in the dataset. The absence of such annotations remains a limitation for future work.
- The probabilistic validation in Experiment 4 assumed independence and did not include an explicit uncertainty interval. Although the variance is negligible in large datasets, this remains a limitation for smaller datasets.
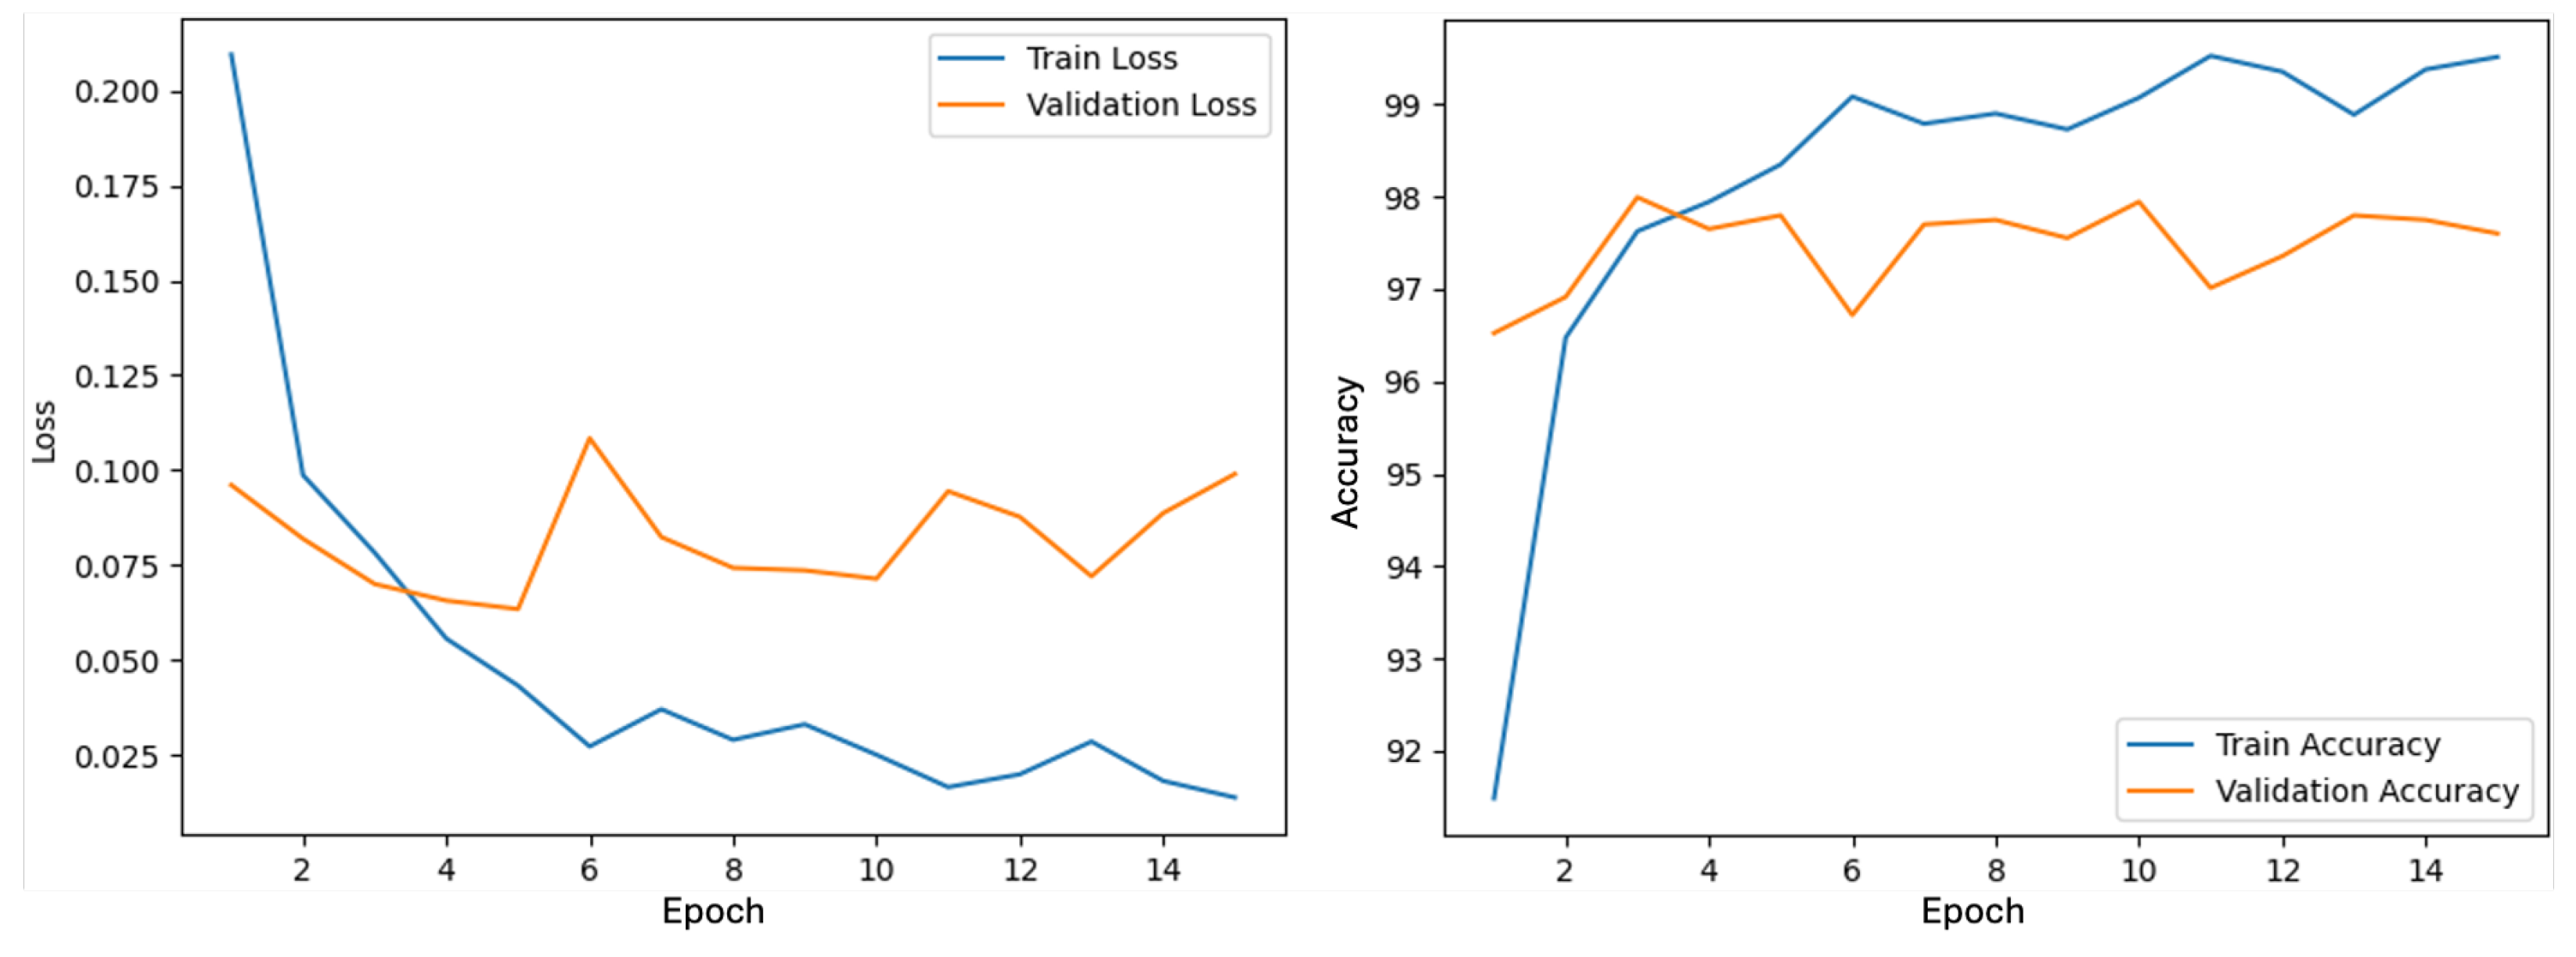
- Indications of overfitting were observed in Experiment 2 after epoch 6, likely due to the small validation set size. While test results confirmed high generalization, the limited validation data constrain interpretability.
- Finally, aspects of industrial implementation such as long-term machine stability, certification requirements, and operator acceptance were not addressed in this work. These factors are critical for practical deployment and should be investigated in future research.
- To what extent can an online learning process adaptively adjust the model to new machine environments?
- What requirements must an explainable AI system meet in order to be recognized as a certifiable system in non-destructive testing?
6. Summary and Outlook
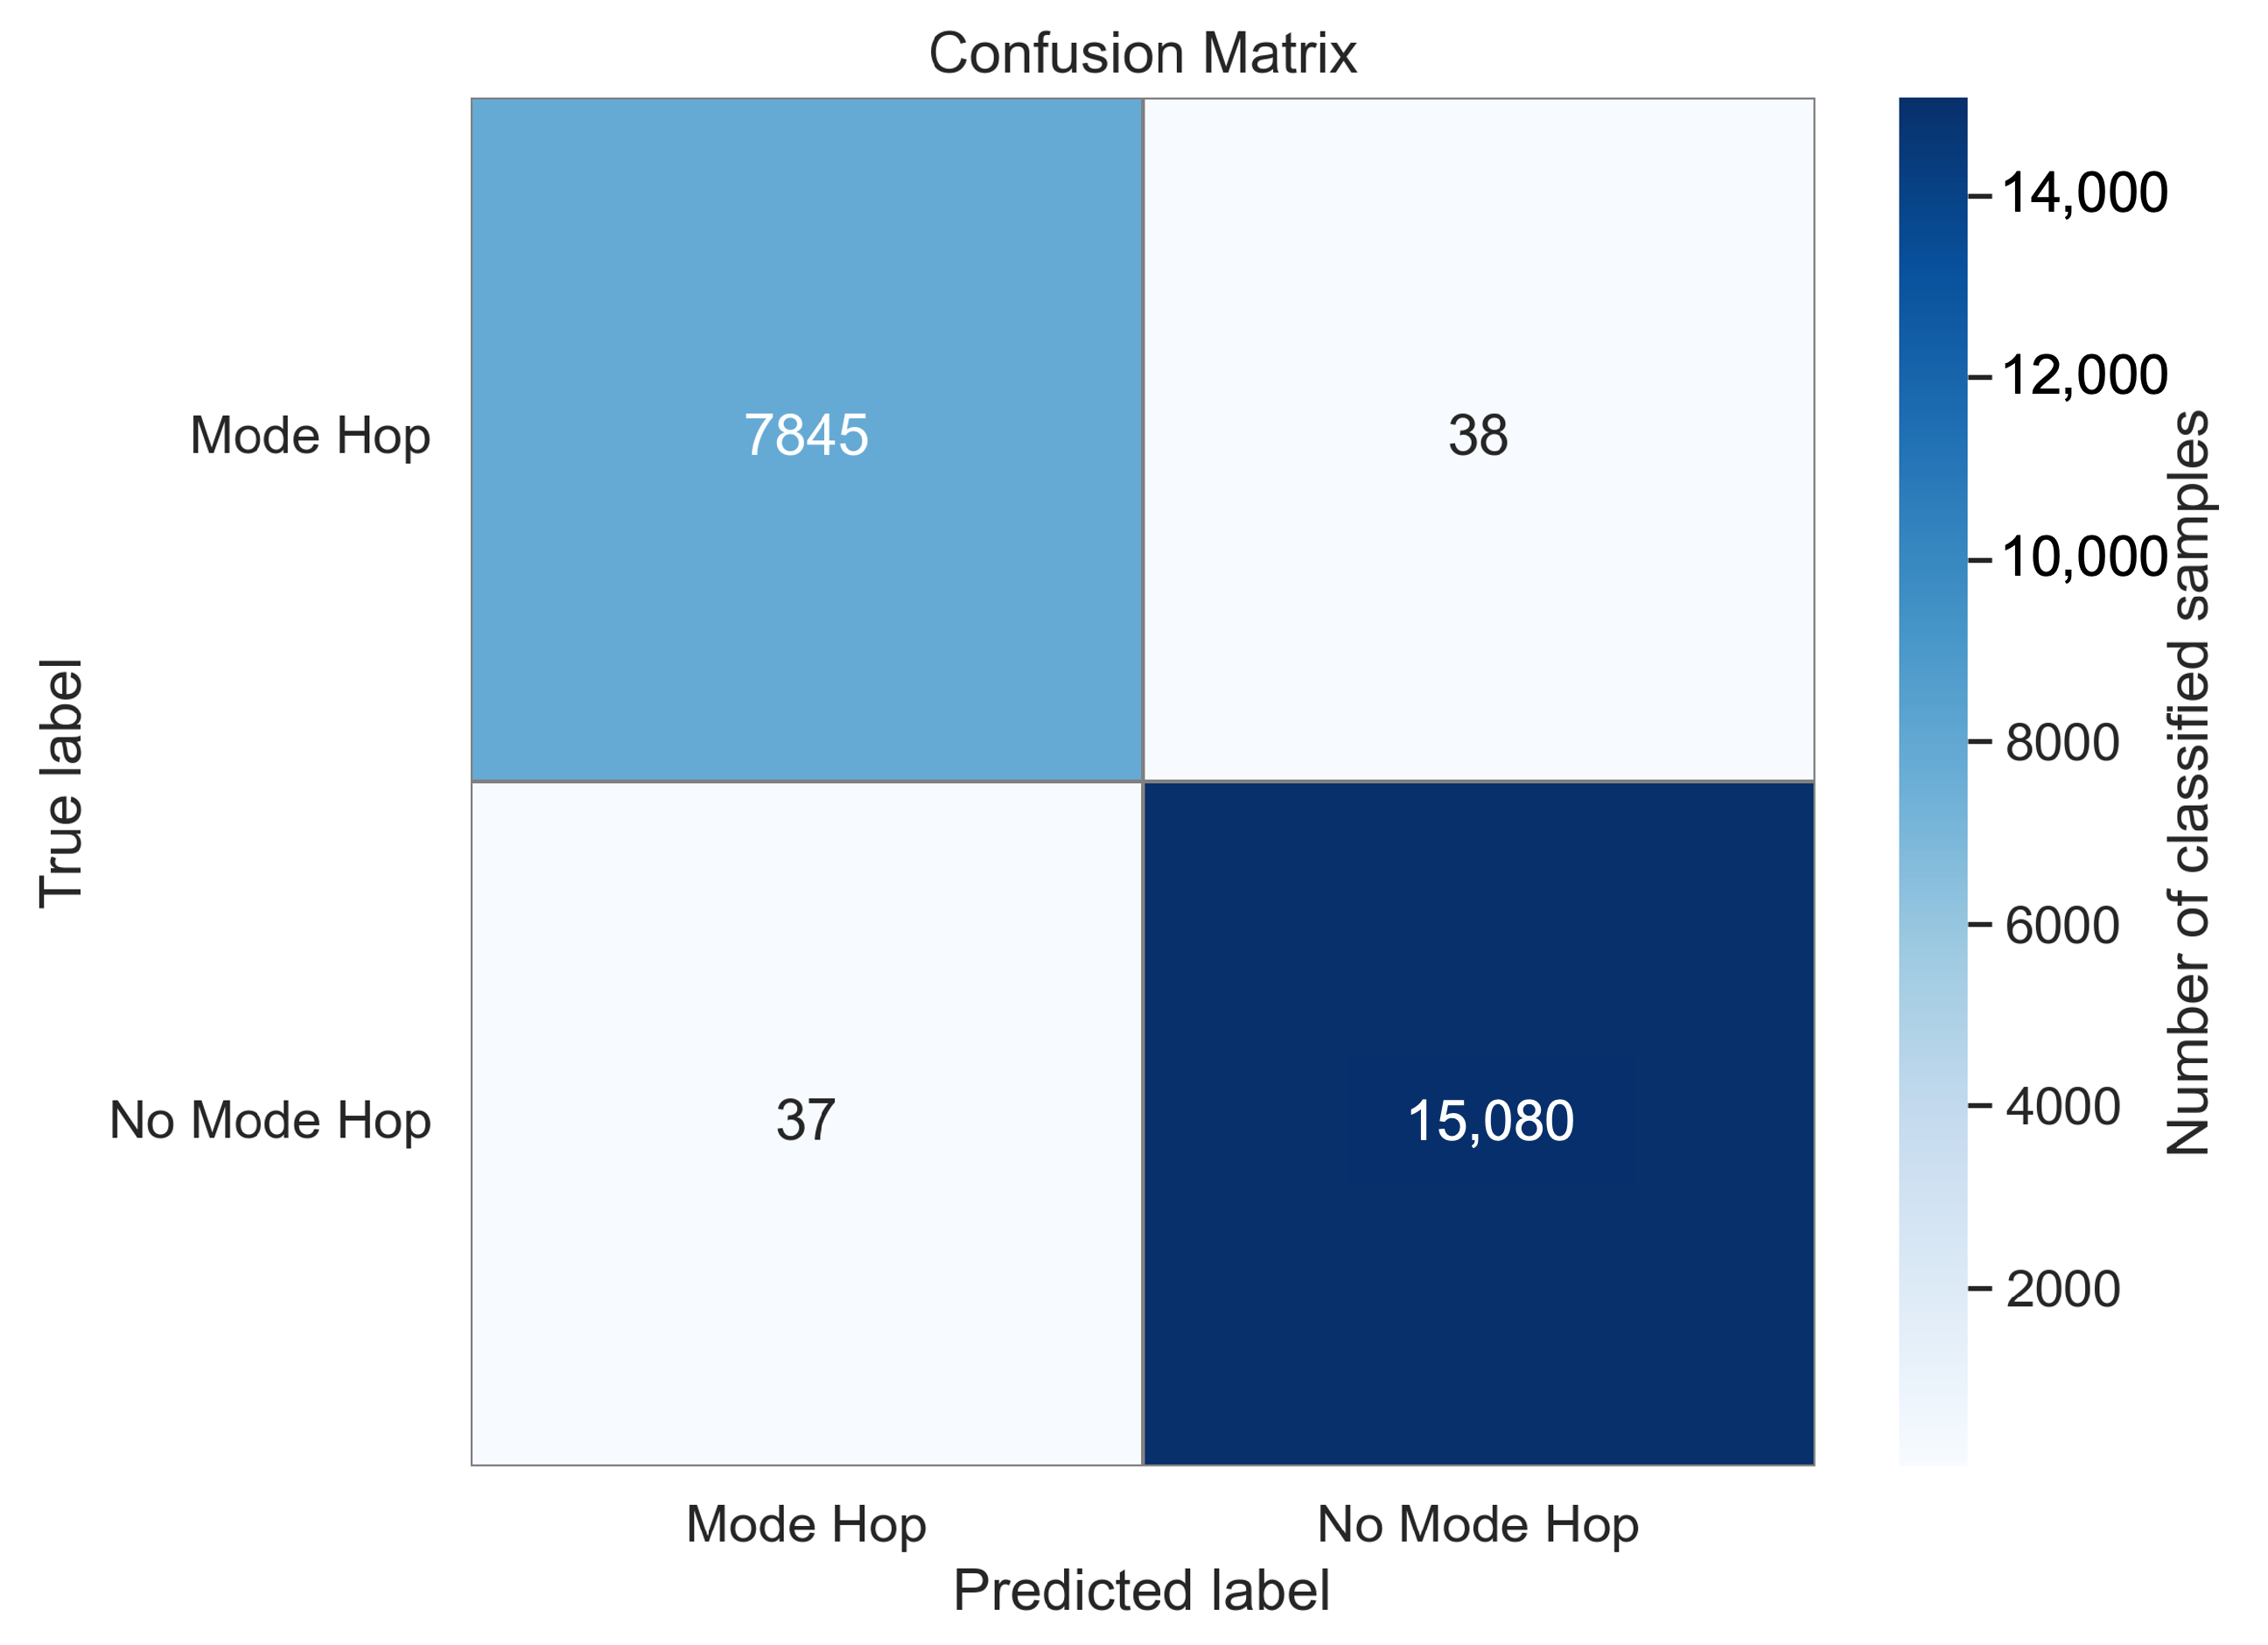
- Development of a robust classification model for Mode Hops with 99.67% accuracy.
- Visual verification using Grad-CAM for explainable decisions.
- Introduction of a statistically validated method for the verification and elimination of false-positive findings.
- Establishment of one of the most comprehensive datasets in shearography-based tire inspection to date.
Author Contributions
Funding
Institutional Review Board Statement
Informed Consent Statement
Data Availability Statement
Conflicts of Interest
References
- Gong, Q.; Yan, S.; Yang, G.; Wang, Y. Mode-hopping suppression of external cavity diode laser by mode matching. Appl. Opt. 2014, 53, 7878–7882. [Google Scholar] [CrossRef] [PubMed]
- Saleh, A.; Al-Tashi, Q.; Mirjalili, S.; Alhussian, H.; Ibrahim, A.; Omar, M.; Abdulkadir, S. Explainable Artificial Intelligence-Powered Foreign Object Defect Detection with Xception Networks and Grad-CAM Interpretation. Appl. Sci. 2024, 14, 4267. [Google Scholar] [CrossRef]
- Zhao, Q.; Dan, X.; Sun, F.; Wang, Y.; Wu, S.; Yang, L. Digital Shearography for NDT: Phase Measurement Technique and Recent Developments. Appl. Sci. 2018, 8, 2662. [Google Scholar] [CrossRef]
- Wang, R.; Guo, Q.; Lu, S.; Zhang, C. Tire defect detection using fully convolutional network. IEEE Access 2019, 7, 43502–43510. [Google Scholar] [CrossRef]
- Chang, C.-Y.; Srinivasan, K.; Wang, W.-C.; Ganapathy, G.P.; Vincent, D.R.; Deepa, N. Quality assessment of tire shearography images via ensemble hybrid faster region-based ConvNets. Electronics 2020, 9, 45. [Google Scholar] [CrossRef]
- Li, W.; Wang, D.; Wu, S. Simulation Dataset Preparation and Hybrid Training for Deep Learning in Defect Detection Using Digital Shearography. Appl. Sci. 2022, 12, 6931. [Google Scholar] [CrossRef]
- Rojas-Vargas, F.; Pascual-Francisco, J.B.; Hernández-Cortés, T. Applications of shearography for non-destructive testing and strain measurement. Int. J. Comb. Optim. Probl. Inform. 2020, 11, 21–36. [Google Scholar] [CrossRef]
- Ma, M.; Hu, Z.; Xu, P.; Wang, W.; Hu, Y. Detecting mode hopping in single-longitudinal-mode fiber ring lasers based on an unbalanced fiber Michelson interferometer. Appl. Opt. 2012, 51, 7420–7425. [Google Scholar] [CrossRef] [PubMed]
- Winkler, L.; Nölleke, C. Artificial neural networks for laser frequency stabilization. Opt. Express 2023, 31, 32188–32199. [Google Scholar] [CrossRef] [PubMed]
- Sun, C.; Kaiser, E.; Brunton, S.L.; Kutz, J.N. Deep reinforcement learning for optical systems: A case study of mode-locked lasers. arXiv 2020, arXiv:2006.05579. [Google Scholar] [CrossRef]
- Yan, Q.; Tian, Y.; Zhang, T.; Lv, C.; Meng, F.; Jia, Z.; Qin, W.; Qin, G. Machine learning based automatic mode-locking of a dual-wavelength soliton fiber laser. Photonics 2024, 11, 47. [Google Scholar] [CrossRef]
- Fu, X.; Brunton, S.L.; Kutz, J.N. Classification of birefringence in mode-locked fiber lasers using machine learning and sparse representation. Opt. Express 2014, 22, 8585–8597. [Google Scholar] [CrossRef]
- Tricot, F.; Phung, D.H.; Lours, M.; Guerandel, S.; de Clercq, E. Power stabilization of a diode laser with an acousto-optic modulator. arXiv 2018. [Google Scholar] [CrossRef]
- Wu, R.; Wei, H.; Lu, C.; Liu, Y. Automatic and Accurate Determination of Defect Size in Shearography Using U-Net Deep Learning Network. J. Nondestruct. Eval. 2025, 44, 12. [Google Scholar] [CrossRef]
- LeCun, Y.; Bengio, Y.; Hinton, G. Deep learning. Nature 2015, 521, 436–444. [Google Scholar] [CrossRef] [PubMed]
- Selvaraju, R.R.; Cogswell, M.; Das, A.; Vedantam, R.; Parikh, D.; Batra, D. Grad-CAM: Visual explanations from deep networks via gradient-based localization. In Proceedings of the IEEE International Conference on Computer Vision (ICCV), Venice, Italy, 22–29 October 2017; pp. 618–626. [Google Scholar] [CrossRef]
- Paszke, A.; Gross, S.; Massa, F.; Lerer, A.; Bradbury, J.; Chanan, G.; Killeen, T.; Lin, Z.; Gimelshein, N.; Antiga, L.; et al. PyTorch: An imperative style, high-performance deep learning library. In Advances in Neural Information Processing Systems (NeurIPS); Neural Information Processing Systems Foundation, Inc.: South Lake Tahoe, NV, USA, 2019; Volume 32, pp. 8024–8035. [Google Scholar]
- He, K.; Zhang, X.; Ren, S.; Sun, J. Deep residual learning for image recognition. In Proceedings of the IEEE Conference on Computer Vision and Pattern Recognition (CVPR), Las Vegas, NV, USA, 27–30 June 2016; pp. 770–778. [Google Scholar] [CrossRef]
- Deng, J.; Dong, W.; Socher, R.; Li, L.-J.; Li, K.; Li, F.-F. ImageNet: A large-scale hierarchical image database. In Proceedings of the 2009 IEEE Conference on Computer Vision and Pattern Recognition, Miami, FL, USA, 20–25 June 2009; pp. 248–255. [Google Scholar] [CrossRef]
- Zhang, L.; Bian, Y.; Jiang, P.; Zhang, F. A Transfer Residual Neural Network Based on ResNet-50 for Detection of Steel Surface Defects. Appl. Sci. 2023, 13, 5260. [Google Scholar] [CrossRef]
- Xu, W.; Fu, Y.-L.; Zhu, D. ResNet and Its Application to Medical Image Processing: Research Progress and Challenges. Comput. Methods Programs Biomed. 2023, 240, 107660. [Google Scholar] [CrossRef] [PubMed]
- Xu, Z.; Luo, H.; Zeng, X.; Zhang, Y.; Guo, Y.; Huang, J. Brain Tumor Classification from MRI Using Residual Network and Transfer Learning. Diagnostics 2024, 14, 869. Available online: https://www.ncbi.nlm.nih.gov/pmc/articles/PMC11898819/ (accessed on 31 August 2025 ).
- Akiba, T.; Sano, S.; Yanase, T.; Ohta, T.; Koyama, M. Optuna: A next-generation hyperparameter optimization framework. In Proceedings of the 25th ACM SIGKDD International Conference on Knowledge Discovery &Data Mining, Anchorage, AK, USA, 4–8 August 2019; pp. 2623–2631. [Google Scholar] [CrossRef]
- Bergstra, J.; Yamins, D.; Cox, D.D. Making a science of model search: Hyperparameter optimization in hundreds of dimensions for vision architectures. In Proceedings of the 30th International Conference on Machine Learning (ICML), Atlanta, GA, USA, 16–21 June 2013; Volume 28, pp. 115–123. Available online: https://proceedings.mlr.press/v28/bergstra13.html (accessed on 31 August 2025 ).
- Prechelt, L. Early stopping – but when? In Neural Networks: Tricks of the Trade; Orr, G., Müller, K., Eds.; Springer: Berlin/Heidelberg, Germany, 1998; pp. 55–69. [Google Scholar] [CrossRef]
- Ting, K.M. Confusion matrix. In Encyclopedia of Machine Learning; Sammut, C., Webb, G.I., Eds.; Springer: Boston, MA, USA, 2010; p. 209. [Google Scholar] [CrossRef]

| Testing Machine 1 | Testing Machine 2 | |
|---|---|---|
| Recording period | 8 Months | 42 Months |
| Tire tests before cleaning | 30,774 | 239,032 |
| Cleaned shearography images of the crown | 246,143 | 1,926,079 |
| Cleaned shearography images of the sidewall | 492,286 | 3,852,380 |
| Cleaned image data total | 6,516,888 | |
| Dataset T1 | Evaluated Tire Tests | Tire Condition Good | Tire Condition Critical | Tire Condition Bad |
|---|---|---|---|---|
| Testing machine 1 | 30,704 | 23,932 | 1613 | 5159 |
| Percentage | 100% | 77.95% | 5.25% | 16.80% |
| Characteristic | ||
|---|---|---|
| Sharp artifact boundaries: Abrupt transitions or edges in the fringe pattern. The artifact is visible in the upper-left quadrant of the Crown image and the upper-right quadrant of the Sidewall image. |  |  |
| Intensity changes: Linear or wavy brightness variations not related to physical defects. The artifact appears in the upper-right quadrant of both Crown and Sidewall images. |  |  |
| Noise: High-frequency graininess superimposed on the interference fringes. The noise is evident in the upper-left quadrant of both Crown and Sidewall images. | 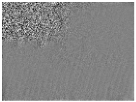 |  |
| Combination of intensity and noise: A mixed manifestation of brightness changes and noise, visible in the upper-left quadrant of the Crown image and the lower-right quadrant of the Sidewall image. |  | 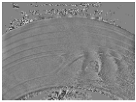 |
| Fragmented interference rings: Broken or incomplete circular fringe structures. In this case, the feature is present only in the upper-left quadrant of the Sidewall image. | 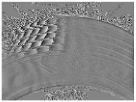 |
| Dataset T1 | Dataset T2 | Dataset Total | |
|---|---|---|---|
| Crown recording without Mode Hops | 245,833 | 3,845,330 | 4,091,163 |
| Crown recording with Mode Hops | 310 | 3845 | 4155 |
| Sidewall recording without Mode Hops | 491,686 | 1,922,234 | 2,413,920 |
| Sidewall recording with Mode Hops | 600 | 7050 | 7650 |
| Total recordings with Mode Hop | 910 | 10,895 | 11,805 |
| Total recordings | 738,429 | 5,778,459 | 6,516,888 |
| Training Dataset V1 | With Mode Hop | Augmented Data | Total Images with Mode Hop | Without Mode Hop |
|---|---|---|---|---|
| Shearography images of the crown | 154 | 462 | 616 | 616 |
| Shearography images of the sidewall | 154 | 462 | 616 | 616 |
| Training and Model Parameters | Value/Setting |
|---|---|
| Model | pre-trained ResNet-50 (ImageNet-1K) |
| Output layer | fc = nn.Linear(2048, 2) |
| Optimizer | Adam |
| Learning rate | 1 × 10⁻⁴ |
| Weight decay | 1 × 10⁻⁴ |
| Loss function | cross-entropy loss |
| Number of epochs | 10 |
| Batch size | 16 |
| Train-/validation-split | 80%/20% |
| Random rotation | ±10° (training only) |
| Normalization | mean = [0.485, 0.485, 0.485] std = [0.229, 0.229, 0.229] |
| Test Dataset V1 | With Mode Hop | Augmented Data | Total Images with Mode Hop | Without Mode Hop |
|---|---|---|---|---|
| Shearography images | 15 | 39 | 54 | 60 |
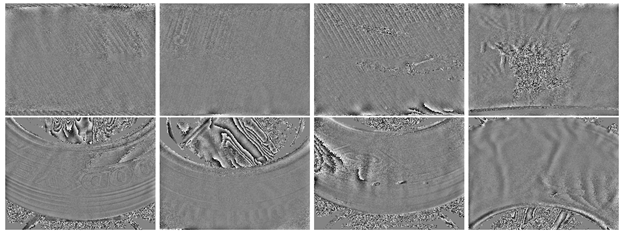
| Similar patterns and combined noise: |
|---|
| Linear structures resulting from tire lettering or surface textures, in combination with high-frequency image noise or only high-frequency image noise, produce artifacts that closely resemble the visual characteristics of true Mode Hops. This resemblance can lead to false-positive classifications by the model. Correct identification as false positives typically requires expert knowledge and, in some cases, careful visual inspection by trained personnel. |
 |
| Training Dataset V2 | With Mode Hop | Augmented Data | Total Images with Mode Hop | Without Mode Hop |
|---|---|---|---|---|
| Shearography images of the crown | 751 | 2253 | 3004 | 2440 |
| Shearography images of the sidewall | 629 | 1887 | 2516 | 2245 |
| Total | 1380 | 4140 | 5520 | 4685 |
| Test Dataset V2 | With Mode Hop | Augmented Data | Total Images with Mode Hop | Without Mode Hop |
|---|---|---|---|---|
| Shearography images of the crown | 1867 | – | 1867 | 4173 |
| Shearography images of the sidewall | 6016 | – | 6016 | 10,944 |
| Total | 7883 | – | 7883 | 15,117 |
| Hyperparameter | Value/Setting |
|---|---|
| Optimizer | SGD |
| Learning rate | 0.00264 |
| Weight decay | 0.00873 |
| Loss function | CrossEntropyLoss |
| Batch size | 32 |
| Momentum | 0.7878 |
Disclaimer/Publisher’s Note: The statements, opinions and data contained in all publications are solely those of the individual author(s) and contributor(s) and not of MDPI and/or the editor(s). MDPI and/or the editor(s) disclaim responsibility for any injury to people or property resulting from any ideas, methods, instructions or products referred to in the content. |
© 2025 by the authors. Licensee MDPI, Basel, Switzerland. This article is an open access article distributed under the terms and conditions of the Creative Commons Attribution (CC BY) license (https://creativecommons.org/licenses/by/4.0/).
Share and Cite
Friebolin, M.; Munz, M.; Schlickenrieder, K. Grad-CAM-Assisted Deep Learning for Mode Hop Localization in Shearographic Tire Inspection. AI 2025, 6, 275. https://doi.org/10.3390/ai6100275
Friebolin M, Munz M, Schlickenrieder K. Grad-CAM-Assisted Deep Learning for Mode Hop Localization in Shearographic Tire Inspection. AI. 2025; 6(10):275. https://doi.org/10.3390/ai6100275
Chicago/Turabian StyleFriebolin, Manuel, Michael Munz, and Klaus Schlickenrieder. 2025. "Grad-CAM-Assisted Deep Learning for Mode Hop Localization in Shearographic Tire Inspection" AI 6, no. 10: 275. https://doi.org/10.3390/ai6100275
APA StyleFriebolin, M., Munz, M., & Schlickenrieder, K. (2025). Grad-CAM-Assisted Deep Learning for Mode Hop Localization in Shearographic Tire Inspection. AI, 6(10), 275. https://doi.org/10.3390/ai6100275


