Article

Seismic Performance Prediction of RC, BRB and SDOF Structures Using Deep Learning and the Intensity Measure INp

1
Department of Mechanical and Mechatronic Engineering (Metal-Mecánica), Tecnológico Nacional de México Campus Culiacán, Culiacan 80220, Mexico
2
Facultad de Ingeniería, Universidad Autónoma de Sinaloa, Culiacan 80013, Mexico
3
Department of Civil Engineering, Universidad Militar Nueva Granada, UMNG, Bogota 110111, Colombia
4
Facultad de Ingeniería, Arquitectura y Diseño (FIAD), Universidad Autónoma de Baja California, Ensenada 22860, Mexico
5
Departamento de Física, Matemáticas e Ingeniería, Universidad de Sonora, Navojoa 85880, Mexico
*
Authors to whom correspondence should be addressed.
AI 2024, 5(3), 1496-1516; https://doi.org/10.3390/ai5030072
Submission received: 28 June 2024 / Revised: 7 August 2024 / Accepted: 22 August 2024 / Published: 26 August 2024

Abstract

:
The motivation for using artificial neural networks in this study stems from their computational efficiency and ability to model complex, high-level abstractions. Deep learning models were utilized to predict the structural responses of reinforced concrete (RC) buildings subjected to earthquakes. For this aim, the dataset for training and evaluation was derived from complex computational dynamic analyses, which involved scaling real ground motion records at different intensity levels (spectral acceleration Sa(T1) and the recently proposed INp). The results, specifically the maximum interstory drifts, were characterized for the output neurons in terms of their corresponding statistical parameters: mean, median, and standard deviation; while two input variables (fundamental period and earthquake intensity) were used in the neural networks to represent buildings and seismic risk. To validate deep learning as a robust tool for seismic predesign and rapid estimation, a prediction model was developed to assess the seismic performance of a complex RC building with buckling restrained braces (RC-BRBs). Additionally, other deep learning models were explored to predict ductility and hysteretic energy in nonlinear single degree of freedom (SDOF) systems. The findings demonstrated that increasing the number of hidden layers generally reduces prediction error, although an excessive number can lead to overfitting.

1. Introduction

Earthquake ground motions are a natural phenomenon that releases enormous amounts of energy; part of this energy is absorbed by bodies attached to the earth’s surface. For this reason, earthquake ground motions put at risk the integrity and functionality of structures [1,2,3,4] as they have to dissipate an important part of the seismic energy. Due to the inherent properties of the construction materials, reinforced concrete buildings dissipate less energy than steel buildings [5,6,7]; thus, it is important to understand and predict the structural response or seismic performance of RC or RC-BRB buildings. Currently, some relevant studies have focused on presenting methods and mathematical expressions that assist in seismic design tasks using a relationship between ductility, μ , and period, T, to estimate important parameters or structural performance indices such as strength reduction factors and inelastic displacement ratios [8]; other studies have been dedicated to quantify the risk seismic based on the structural damage [9,10] by selecting appropriate intensity measures [11,12,13,14].

1.1. Intensity Measures

The spectral acceleration at the first mode of vibration of the structure S a ( T 1 ) , where T1 is the fundamental period, is considered the basic seismic intensity measure and, therefore, it is the most widely used parameter around the world [12]; however, new intensity measures based on the spectral shape parameter named N p have been demonstrated to be useful in mathematical models for predicting important parameters of seismic performance, such as interstory drift and ductility of structures [13,15,16], especially the well-known I N p intensity measure. According to Bojórquez and Iervolino [17], the I N p intensity measure considers the nonlinear effects in the estimation of the structural response, and it has allowed scientists to obtain better results in comparison with most of the intensity measures presented in the literature [18]. The mathematical form of this parameter is I N p = S a ( T 1 ) N p α , where the spectral shape parameter N p is obtained via Equation (1). In this equation, S a a v g ( T 1 T N )   represents the geometric mean of spectral acceleration in a range of periods.
N p = S a a v g ( T 1 , , T N ) S a ( T 1 ) ,
It is important to say that the information given by Equation (1) is that, if we have one or n records with a mean Np value close to one, we can expect the average spectrum to be about flat in the period range between T 1 and T N . For a mean N p lower than one, an average spectrum with a negative slope is expected. Notice that the normalization of S a ( T 1 ) lets N p be independent of the scaling level of the records based on S a ( T 1 ) , but, most importantly, it helps to improve the knowledge of the path of the spectrum from period T 1 to T N , which is related to the nonlinear structural response. On the other hand, α is a value determined from regression analysis. Several analyses of buildings under earthquakes developed by experts recommend a value for α of close to 0.4 [18] to predict peak interstory drift demands. The interstory drift is a relative displacement calculated by the difference between two consecutive floors, and it is the main parameter suggested by the seismic codes around the world to guarantee good structural performance. Moreover, the maximum interstory drift is a parameter of the structural response that allows for the determination of the seismic performance of a building [19]. Therefore, some experts have proposed methods to estimate this important indicator [13,20,21]; nevertheless, most of them are aimed to compute and predict interstory drifts based on traditional methods, and, currently, new techniques inspired by artificial intelligence approaches are in progress and represent the future for several engineering applications [22,23,24,25,26,27,28]. These efforts are focused on the prediction of the seismic performance of buildings by using novel ground motion intensity measures. In the present work, the computational tool of deep learning neural networks is used to predict the maximum interstory drift of reinforced concrete buildings under earthquakes. Moreover, the seismic performance of a complex building and several SDOF structures is tested via the neural network model and the advanced ground motion intensity measure I N p .

1.2. Advances in Artificial Neural Networks

The computational advances at the end of the 20th century allowed for some mathematical models, proposed several years ago, to be a useful tool in resolving the basic problems of optimization, classification and prediction of response parameters [29,30,31]. The artificial neural networks are one of these models, which became known or classified as computational models. Nevertheless, they were limited in their ability to process data with a nature complex [32,33,34]. In the last decade, a type of neural network known as a deep learning network has dramatically improved prediction and classification results without human intervention to order and structure the data for the learning process [35,36,37].

1.3. Neural Networks in Civil Engineering

In the civil engineering field, several studies have utilized artificial neural networks to solve structural problems under dynamic loads of winds or earthquakes [38,39,40,41,42]; nevertheless, nowadays, there are not enough studies using deep learning networks to resolve problems with a high level of abstraction, as is the case of structural behavior. The computational models based on neural networks have greater potential for fitting data than traditional methods based on mathematical expressions. This is because, to a certain number of terms, a regression equation is impractical, while an artificial neural network does not become impractical as quickly due to an increased number of neurons or hidden layers. In addition, thanks to the continuous advancement of computer technology, computational models based on neural networks have shown that it is possible to obtain a high accuracy rate with relatively few data. For this reason, the first aim of this paper is to generate a computational model for the prediction of the seismic demand in terms of the maximum interstory drift of mid-rise RC structures under earthquake ground motions using deep learning networks and based on the two ground motion intensity measures Sa(T1) and INp. As a second objective, the neural network is tested by using a complex RC-BRB building. The third objective of the present study is to calibrate deep learning neural network models by means of several nonlinear SDOF systems with elastoplastic behavior subjected to the ground motion records but incorporating the ductility and normalized hysteretic energy as seismic performance parameters. Finally, Taylor diagrams are computed to illustrate the effectiveness of the prediction models in terms of statistical parameters.

2. Theoretical Framework

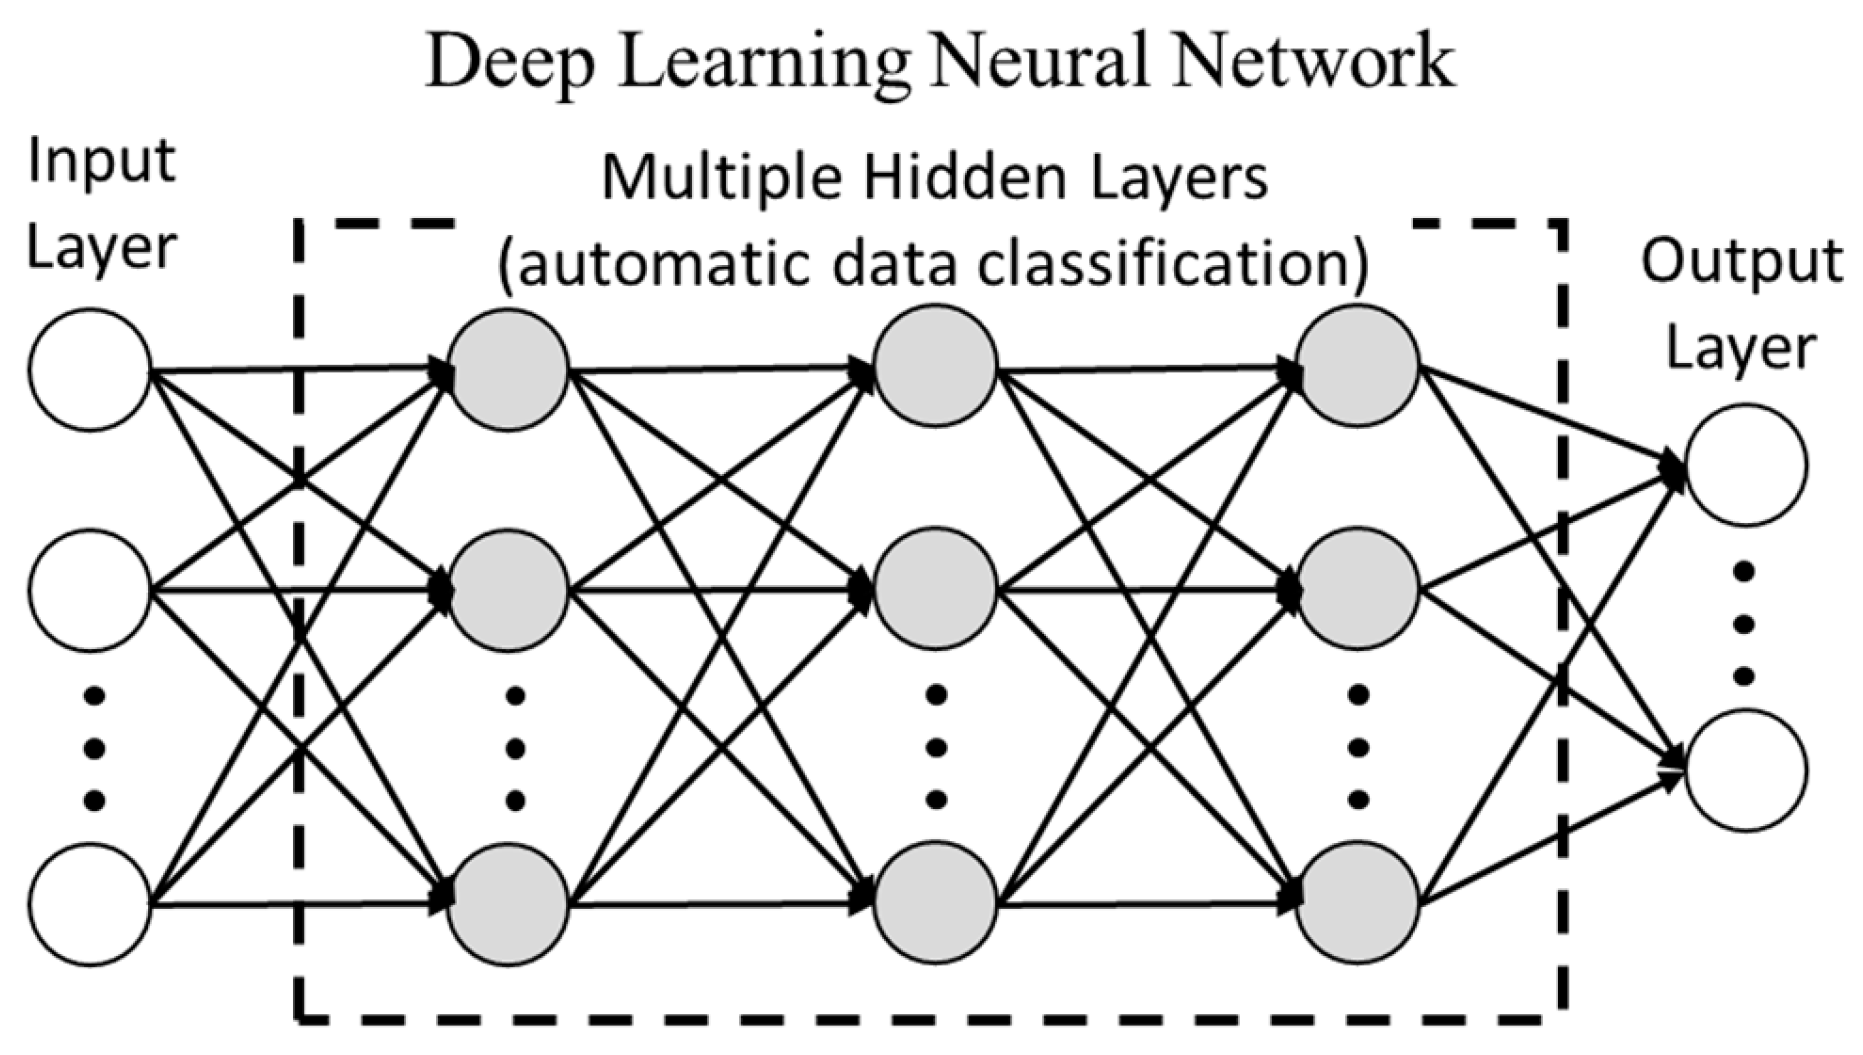
An artificial neural network (ANN) consists of a set of basic processing units called artificial neurons (Figure 1a) [43]. For an ANN, the connection of multiple neurons allows it to solve complex problems, which can be defined as linearly non-separable or nonlinear problems [44]. An arrangement of neurons in a reduced number of layers enables the solution of many problems only if the input data are properly categorized (Figure 1b), conversely, a drastic increase in the number of hidden layers helps to automatically resolve the classification of the data (Figure 2) [45]. This last type of ANN has proven to model high-level abstractions by applying multiple non-linear transformations.
The output of an artificial neuron is given by a function f known as the activation function which depends on the sum of the inputs n i w i in the following way:
s u m = 1 w 0 + n 1 w 1 + n 2 w 2 + + n i w i ,
where n i is the output of another neuron and w i is a value known as synaptic weight (Figure 1a). The value of the synaptic weight w i determines the influence of the information that travels through the connection i. The sigmoid function allows to generate good approximations with normalized data between 0 to 1. The sigmoid function is mathematically expressed as follows:
f s u m = n = 1 1 + e s u m ,
where its derivate can be expressed by a simple form in terms of the same sigmoid function:
f s u m = d = n ( 1 n ) .
The training process, also known as the learning process, of an ANN consists of defining, through iterations, the values of the synaptic weights, such as the prediction error decreases. The evaluation of the error at each iteration allows for the application of optimization techniques that update the values of the synaptic weights to obtain better performance. The Mean Square Error ( M S E ) function is a mathematical tool to quantify the error as follows:
E = M S E = 1 N i = 1 N t i y i 2 ,
where N is the number of data points assigned to the training process, t i is the target value for the prediction, and y i is the output value of the ANN corresponding to the input i -th. The error can be described as a function that depends on the values assigned to the synaptic weights. In this way, the derivative of the error with respect to the synaptic weights describes the trend of the error in order to find a minimum. The quantification of the error trend is known as the gradient G and its mathematical expression is the following:
G = E ( w ) w ,
where w is a vector that contains the values of the synaptic weights. The descending gradient method is an optimization approach that takes advantage of the information provided by the derivative of the error to adjust and update the values of the weights. The update of the weights to minimize the error would be given as follows:
w + w = w α G ,
where w represents the update vector and α is a parameter, typically between 0 and 1, known as the learning rate, which determines the contribution of each iteration and controls how quickly the algorithm converges to a solution.

3. Methodology

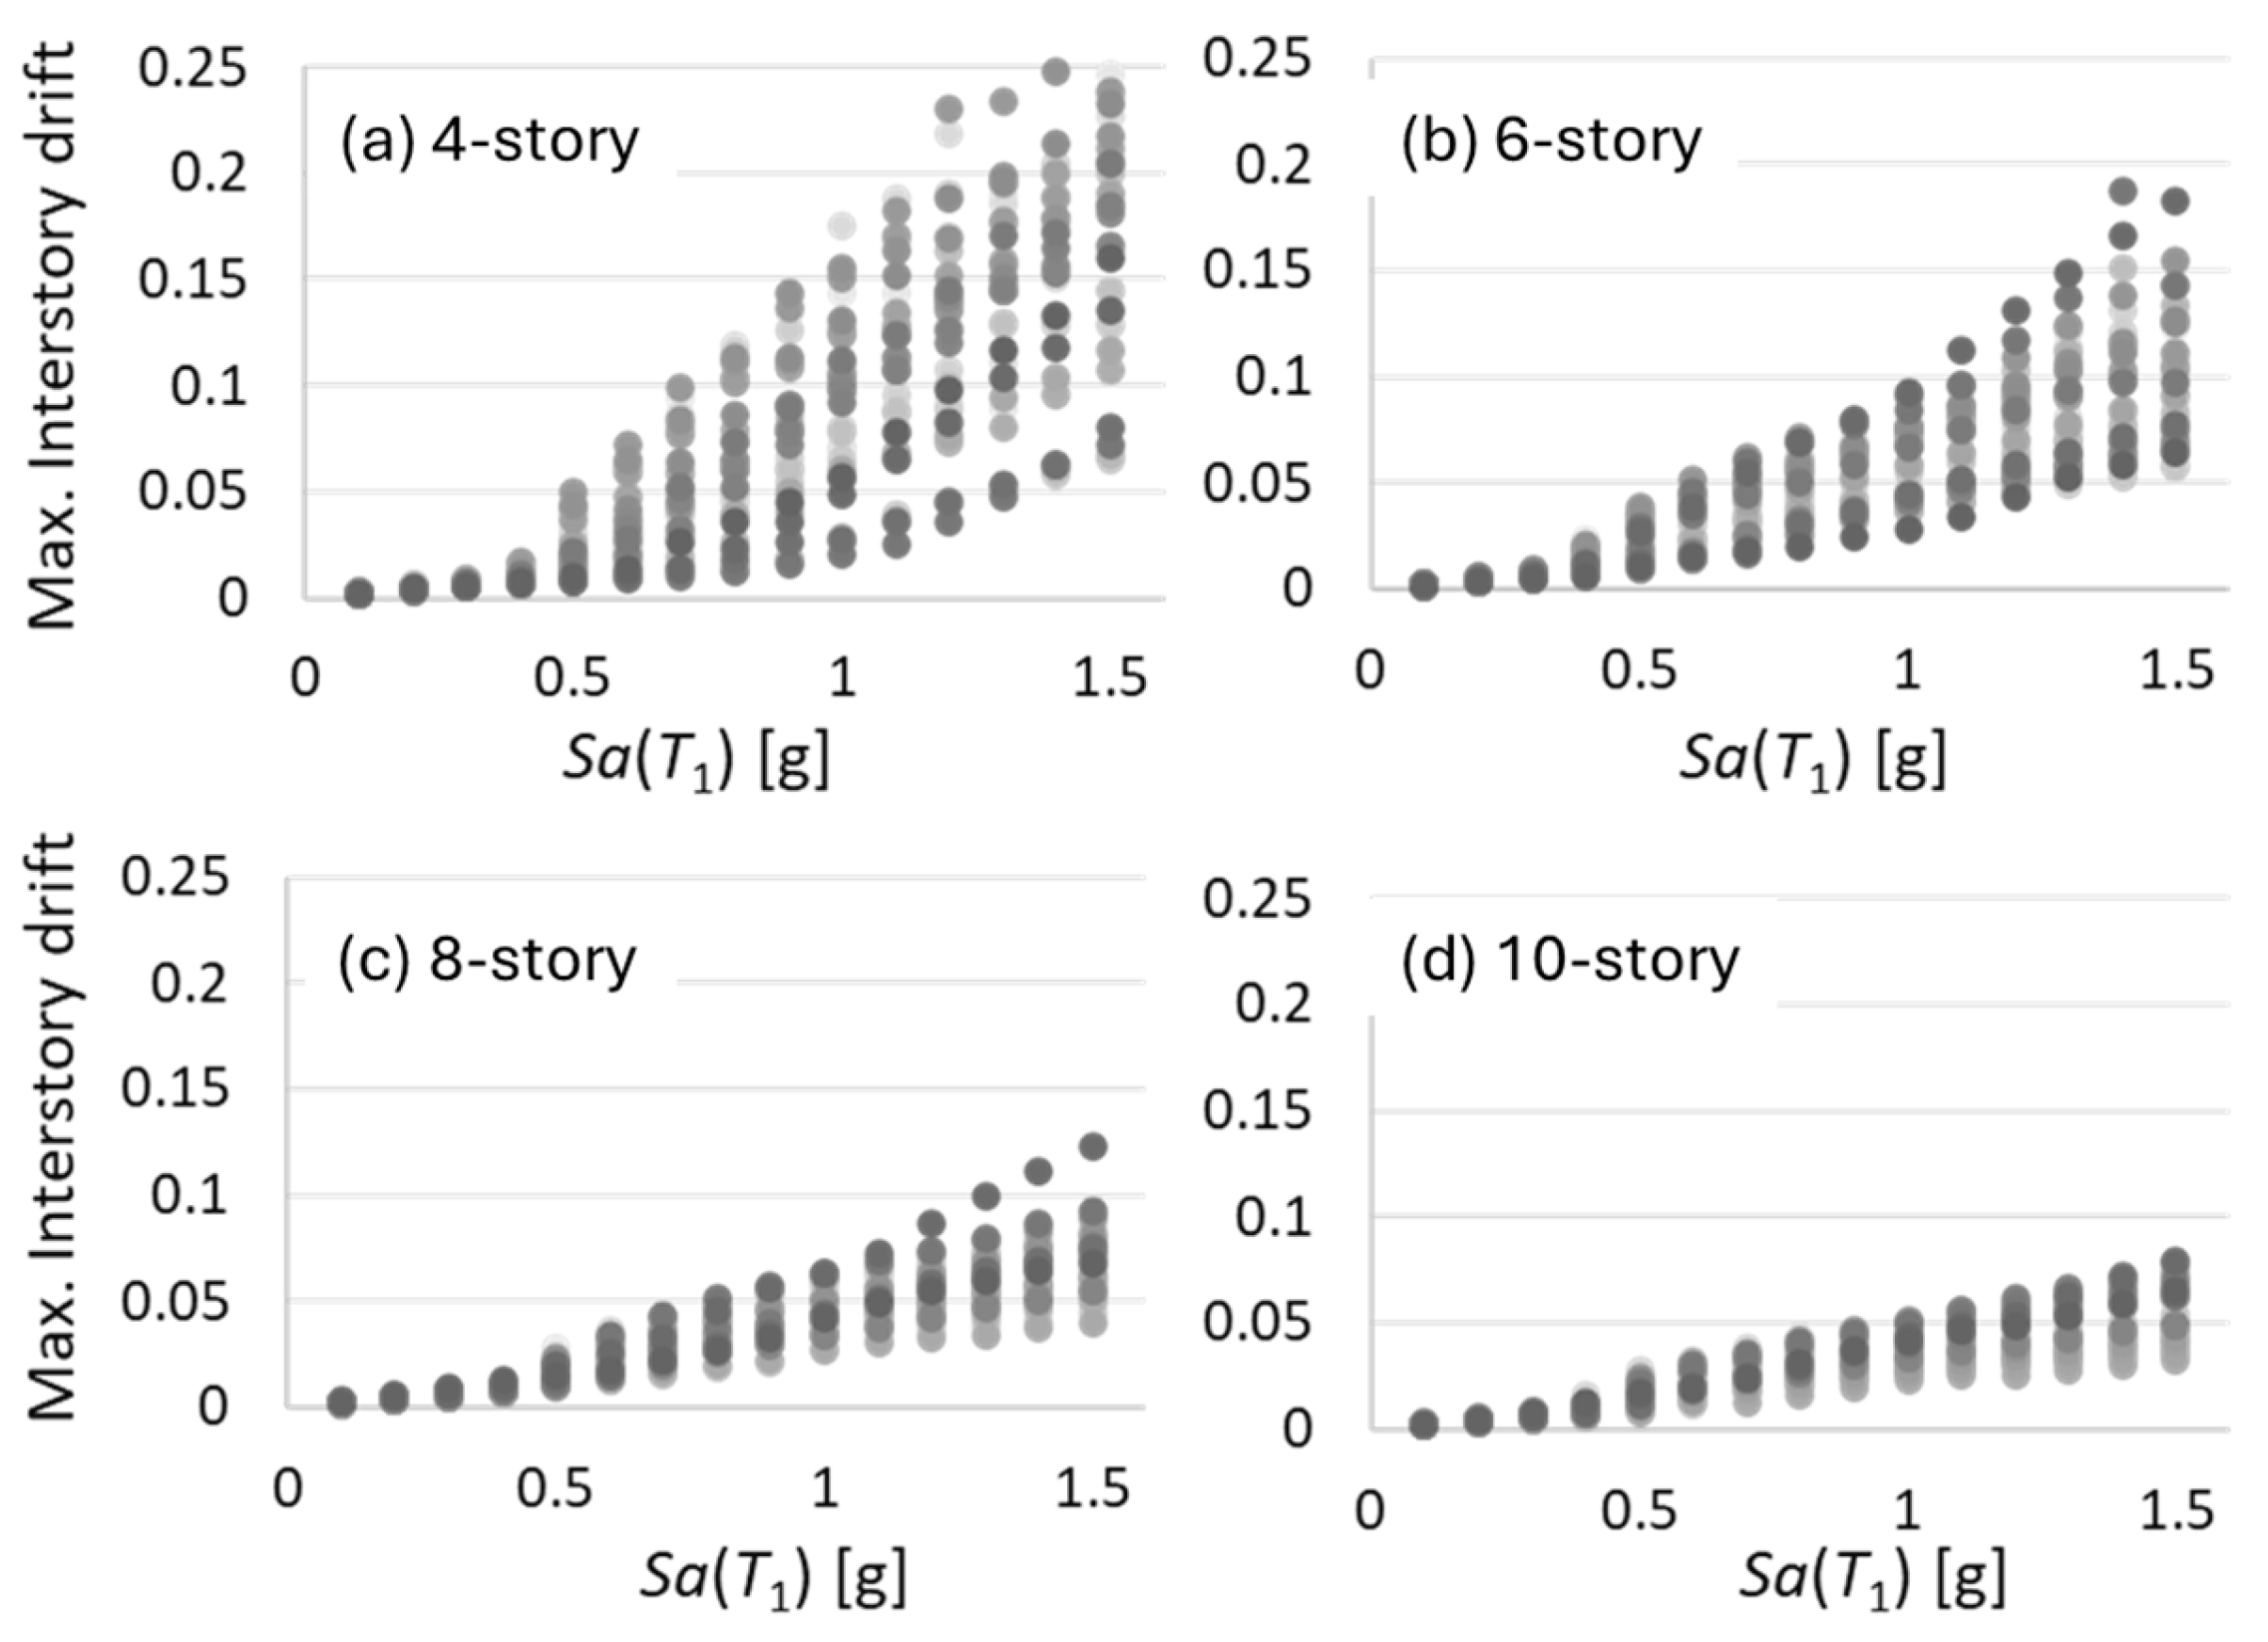
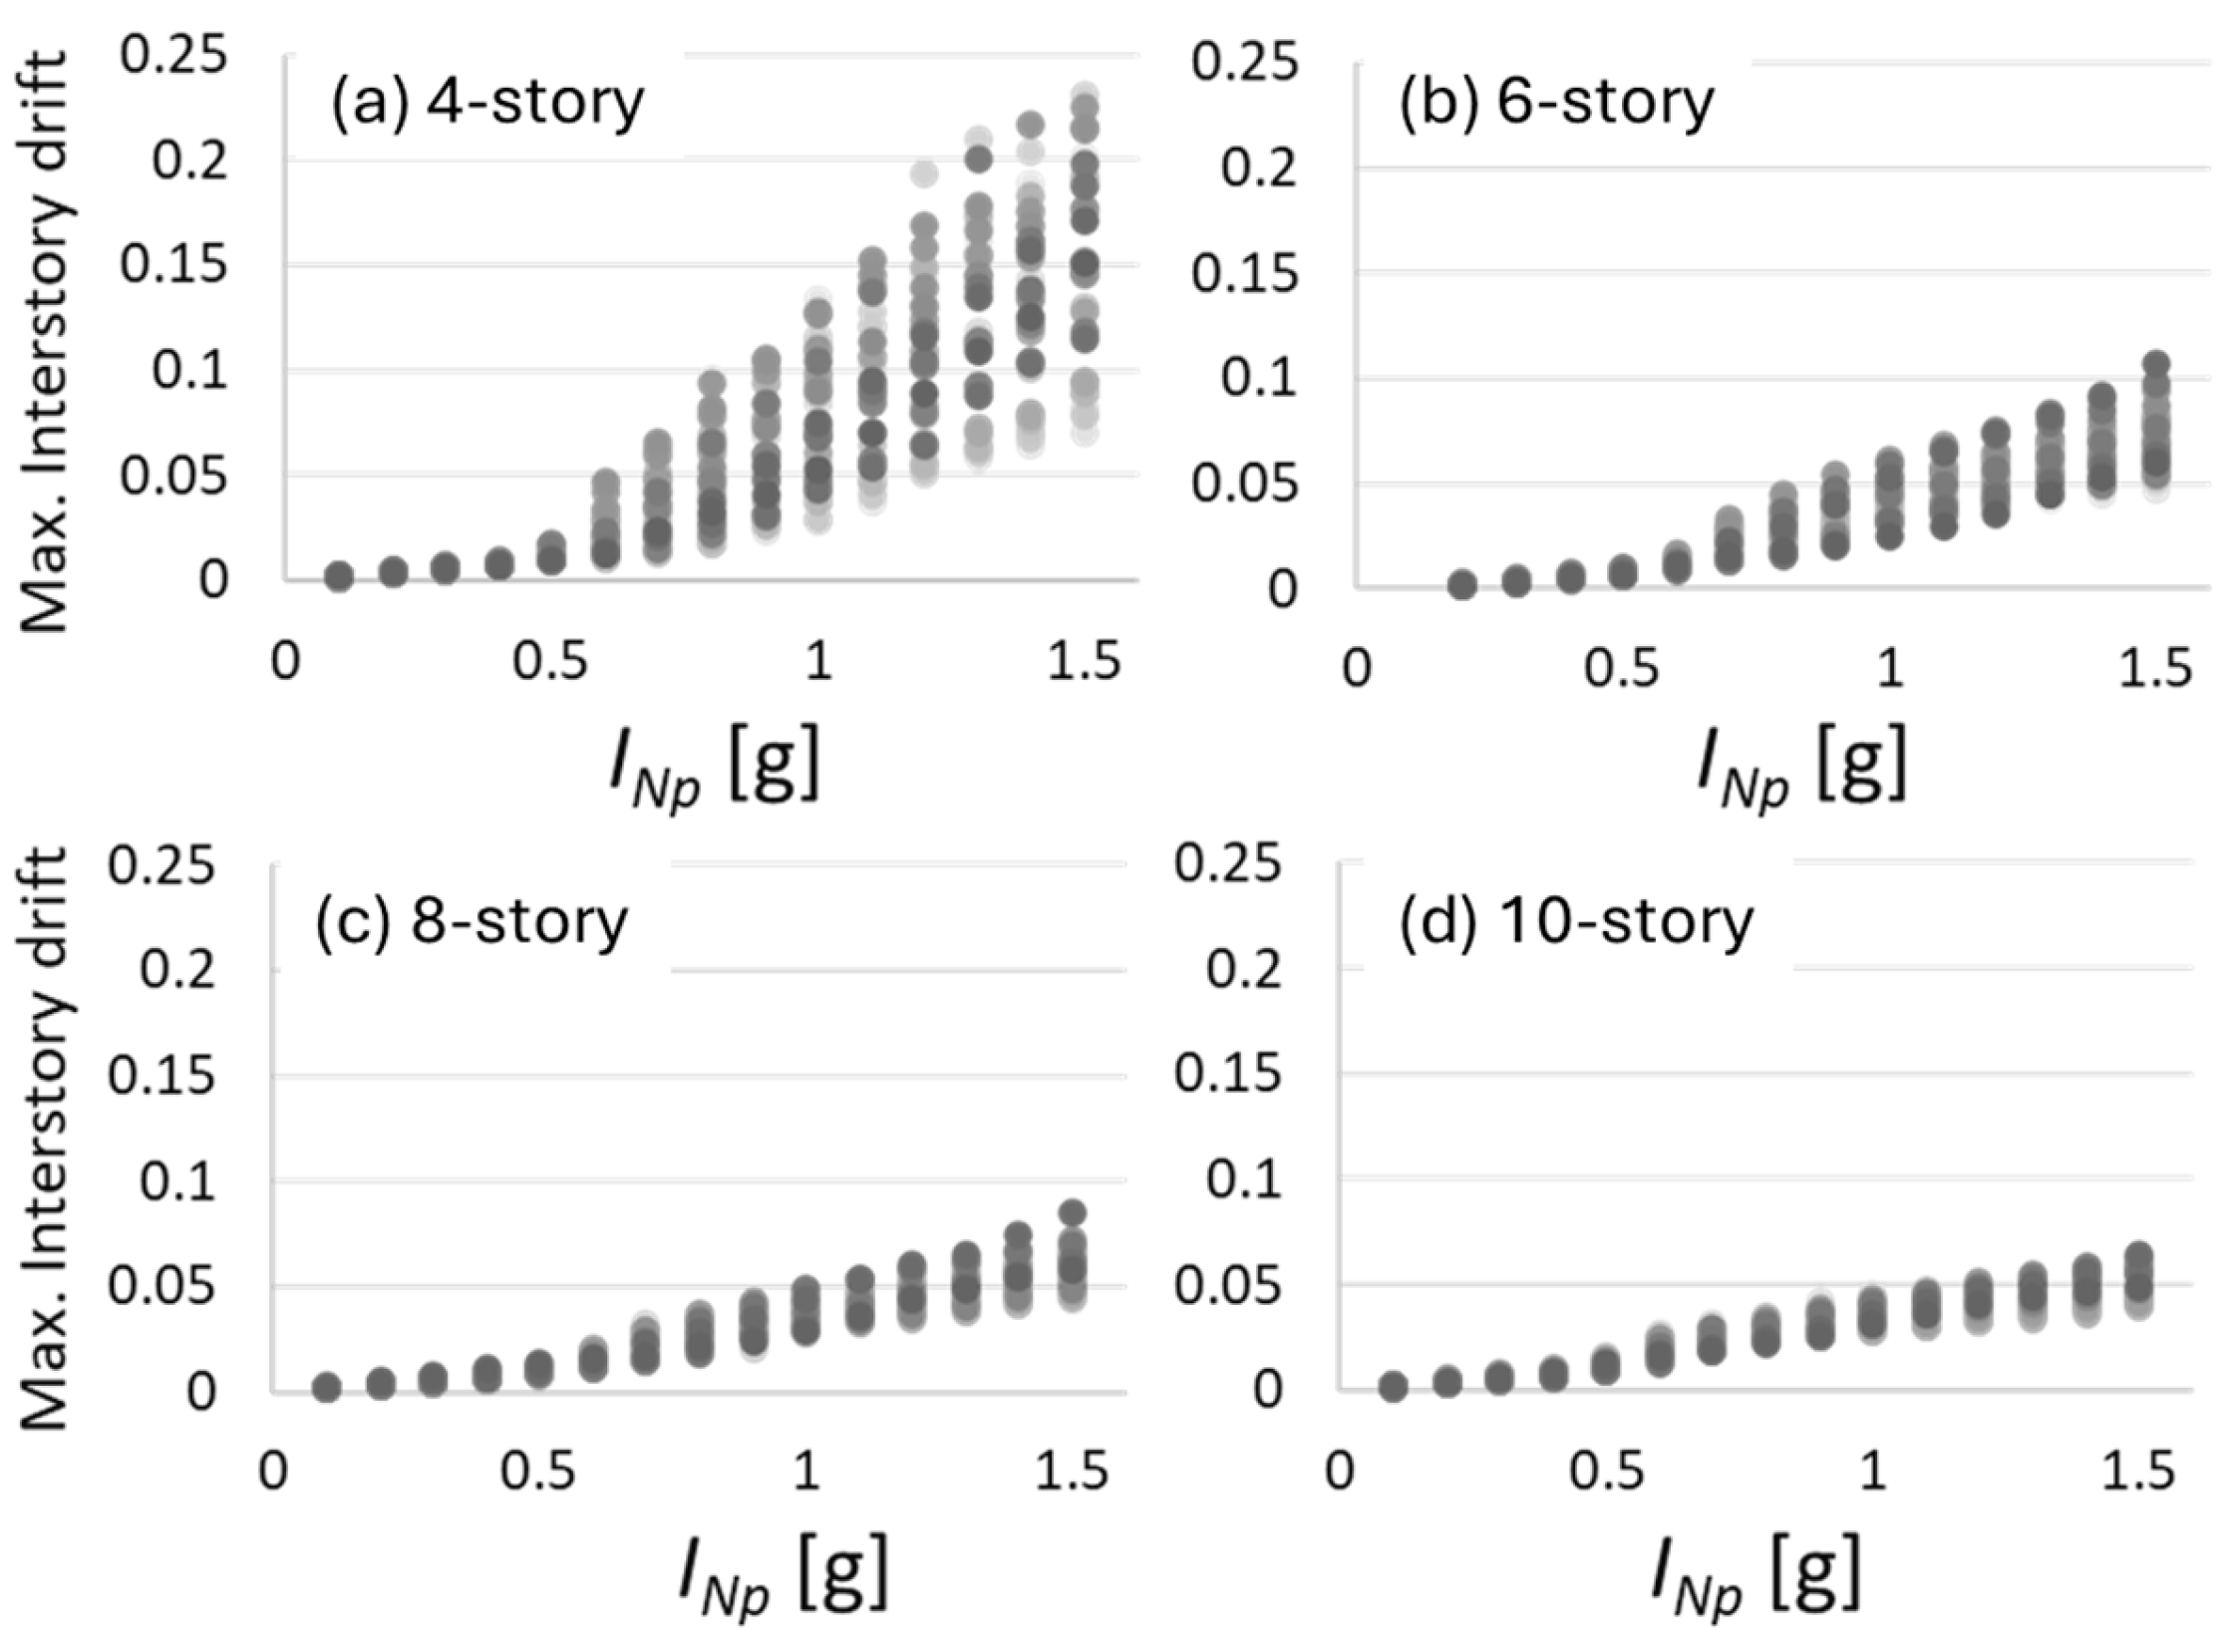
To generate an acceptable prediction model, it is necessary to have a considerable amount of data that allows for an accurate description of the behavior of the variable of interest. For this work, the data necessary to describe the behavior of the maximum interstory drift of RC mid-rise frames under earthquake ground motions are shown in Figure 3 and Figure 4. These data were obtained by incremental dynamic analysis [46] using registered records of earthquake ground motions which are scaled at different spectral acceleration Sa(T1) and INp values. Notice that a total of 2400 nonlinear seismic analyses of RC structures have been performed. The ground motion records correspond to seismic events with magnitudes close to seven or higher, and an epicenter located at 300 km or more from Mexico City. The most important structural damage by seismic events in Mexico has occurred in the area selected for the extraction of records. This area is known as the Lake Zone, which has been characterized by soil periods between 2 and 3 s; therefore, the peak ground acceleration PGA and velocity PGV can produce high levels of shaking in buildings. More information about the characteristics of the seismic records and of the buildings is presented in Table 1 and Table 2, respectively, while Figure 5 illustrates the structural configuration of the RC frames. In addition, several details about the structural elements (beams and columns) used in the study buildings are shown in Figure 6 and Table 3. In Figure 6, the cross-section and the configuration of the reinforcing steel area are described. It is important to say that all the structural buildings used for the present study have been designed according to the Mexico City Building Code.
Table 3 defines the most important characteristics, such as height (H), width (B), superior steel area (As_sup), inferior steel area (As_inf), spacing of stirrups in the extremes (spacing_ext), and spacing of stirrups in the center (spacing_cen). Notice that the units of Table 3 are provided in centimeters (cm) or square centimeters (cm2).
For ANN-based computational models, it is considered good practice to normalize the data using different scales and ranges. Although the model could converge without the normalization of the characteristics, the resulting model will be dependent on the choice of the units used in the input. To normalize the values in the range [0, 1], the following mathematical expression was used:
x ¯ i = x i x m i n x m a x x m i n ,
where x ¯ i is the normalized value, x i is the value to normalize, x m i n is the minimum value, and x m a x is the maximum value. Following the guidelines of good practice for the generation of models based on neural networks, the next stage is to partition the data. The separation of the data is carried out randomly under the following criteria: 70% for training and 30% for validating. The validation data are used to improve the evaluation of the model fit during the training process while the optimizer is running. The optimizer applied was the ADAM algorithm with MSE of loss function and a learning rate of 0.001 [47]. A small learning rate slows down the learning process but converges smoothly, while a large learning rate speeds up the learning but may not converge. Generally, a small learning rate is preferred. This optimizer method is based on the gradient descent approach, and, according to Kingma and Ba, the method is computationally efficient and is well suited for problems that are large in terms of data or parameters [47]. Furthermore, the MSE function is one of the most frequent loss functions used due to its continuity characteristic, which is very important when optimizers based on the descending gradient approach are used. This practice allows us to analyze the performance of the ANN due to unknown data which are not used for processing the network learning. In addition, the problem known as over-fitting can be determined with the help of an error behavior study. This problem appears when the neural network architecture is very complex for the purpose of simple tasks or when the interactive process of learning is too long [48].

4. Numerical Results

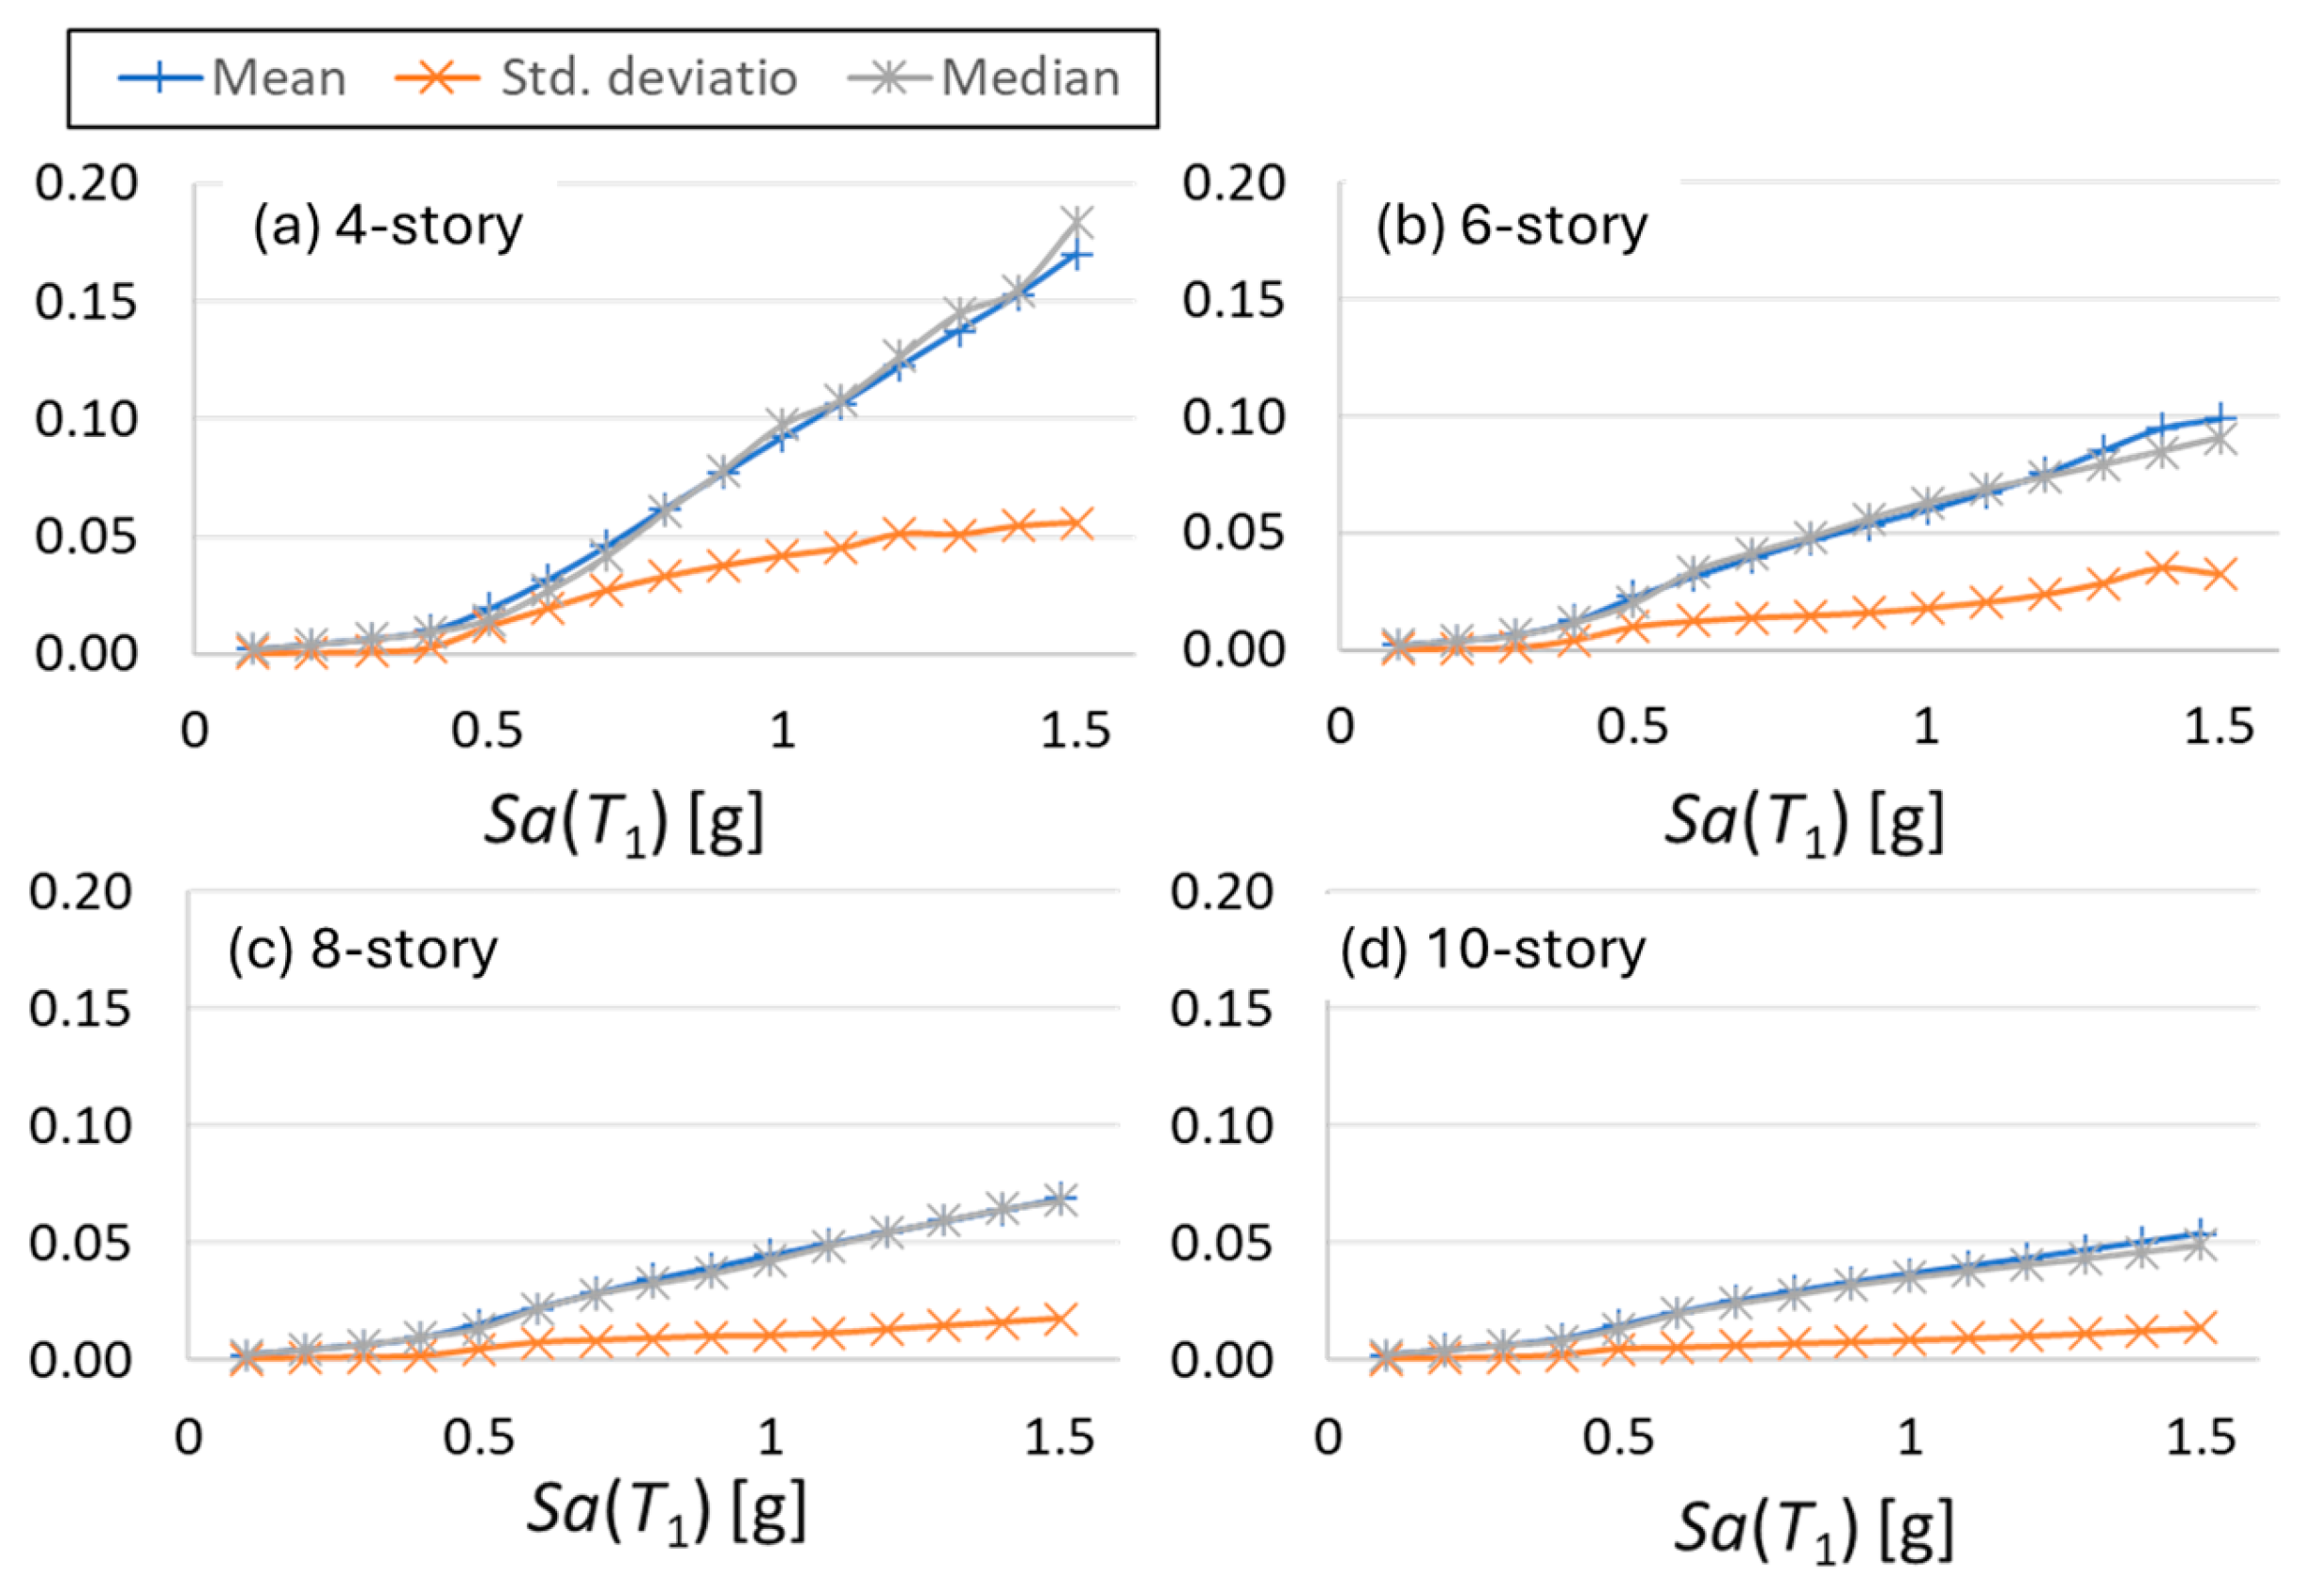
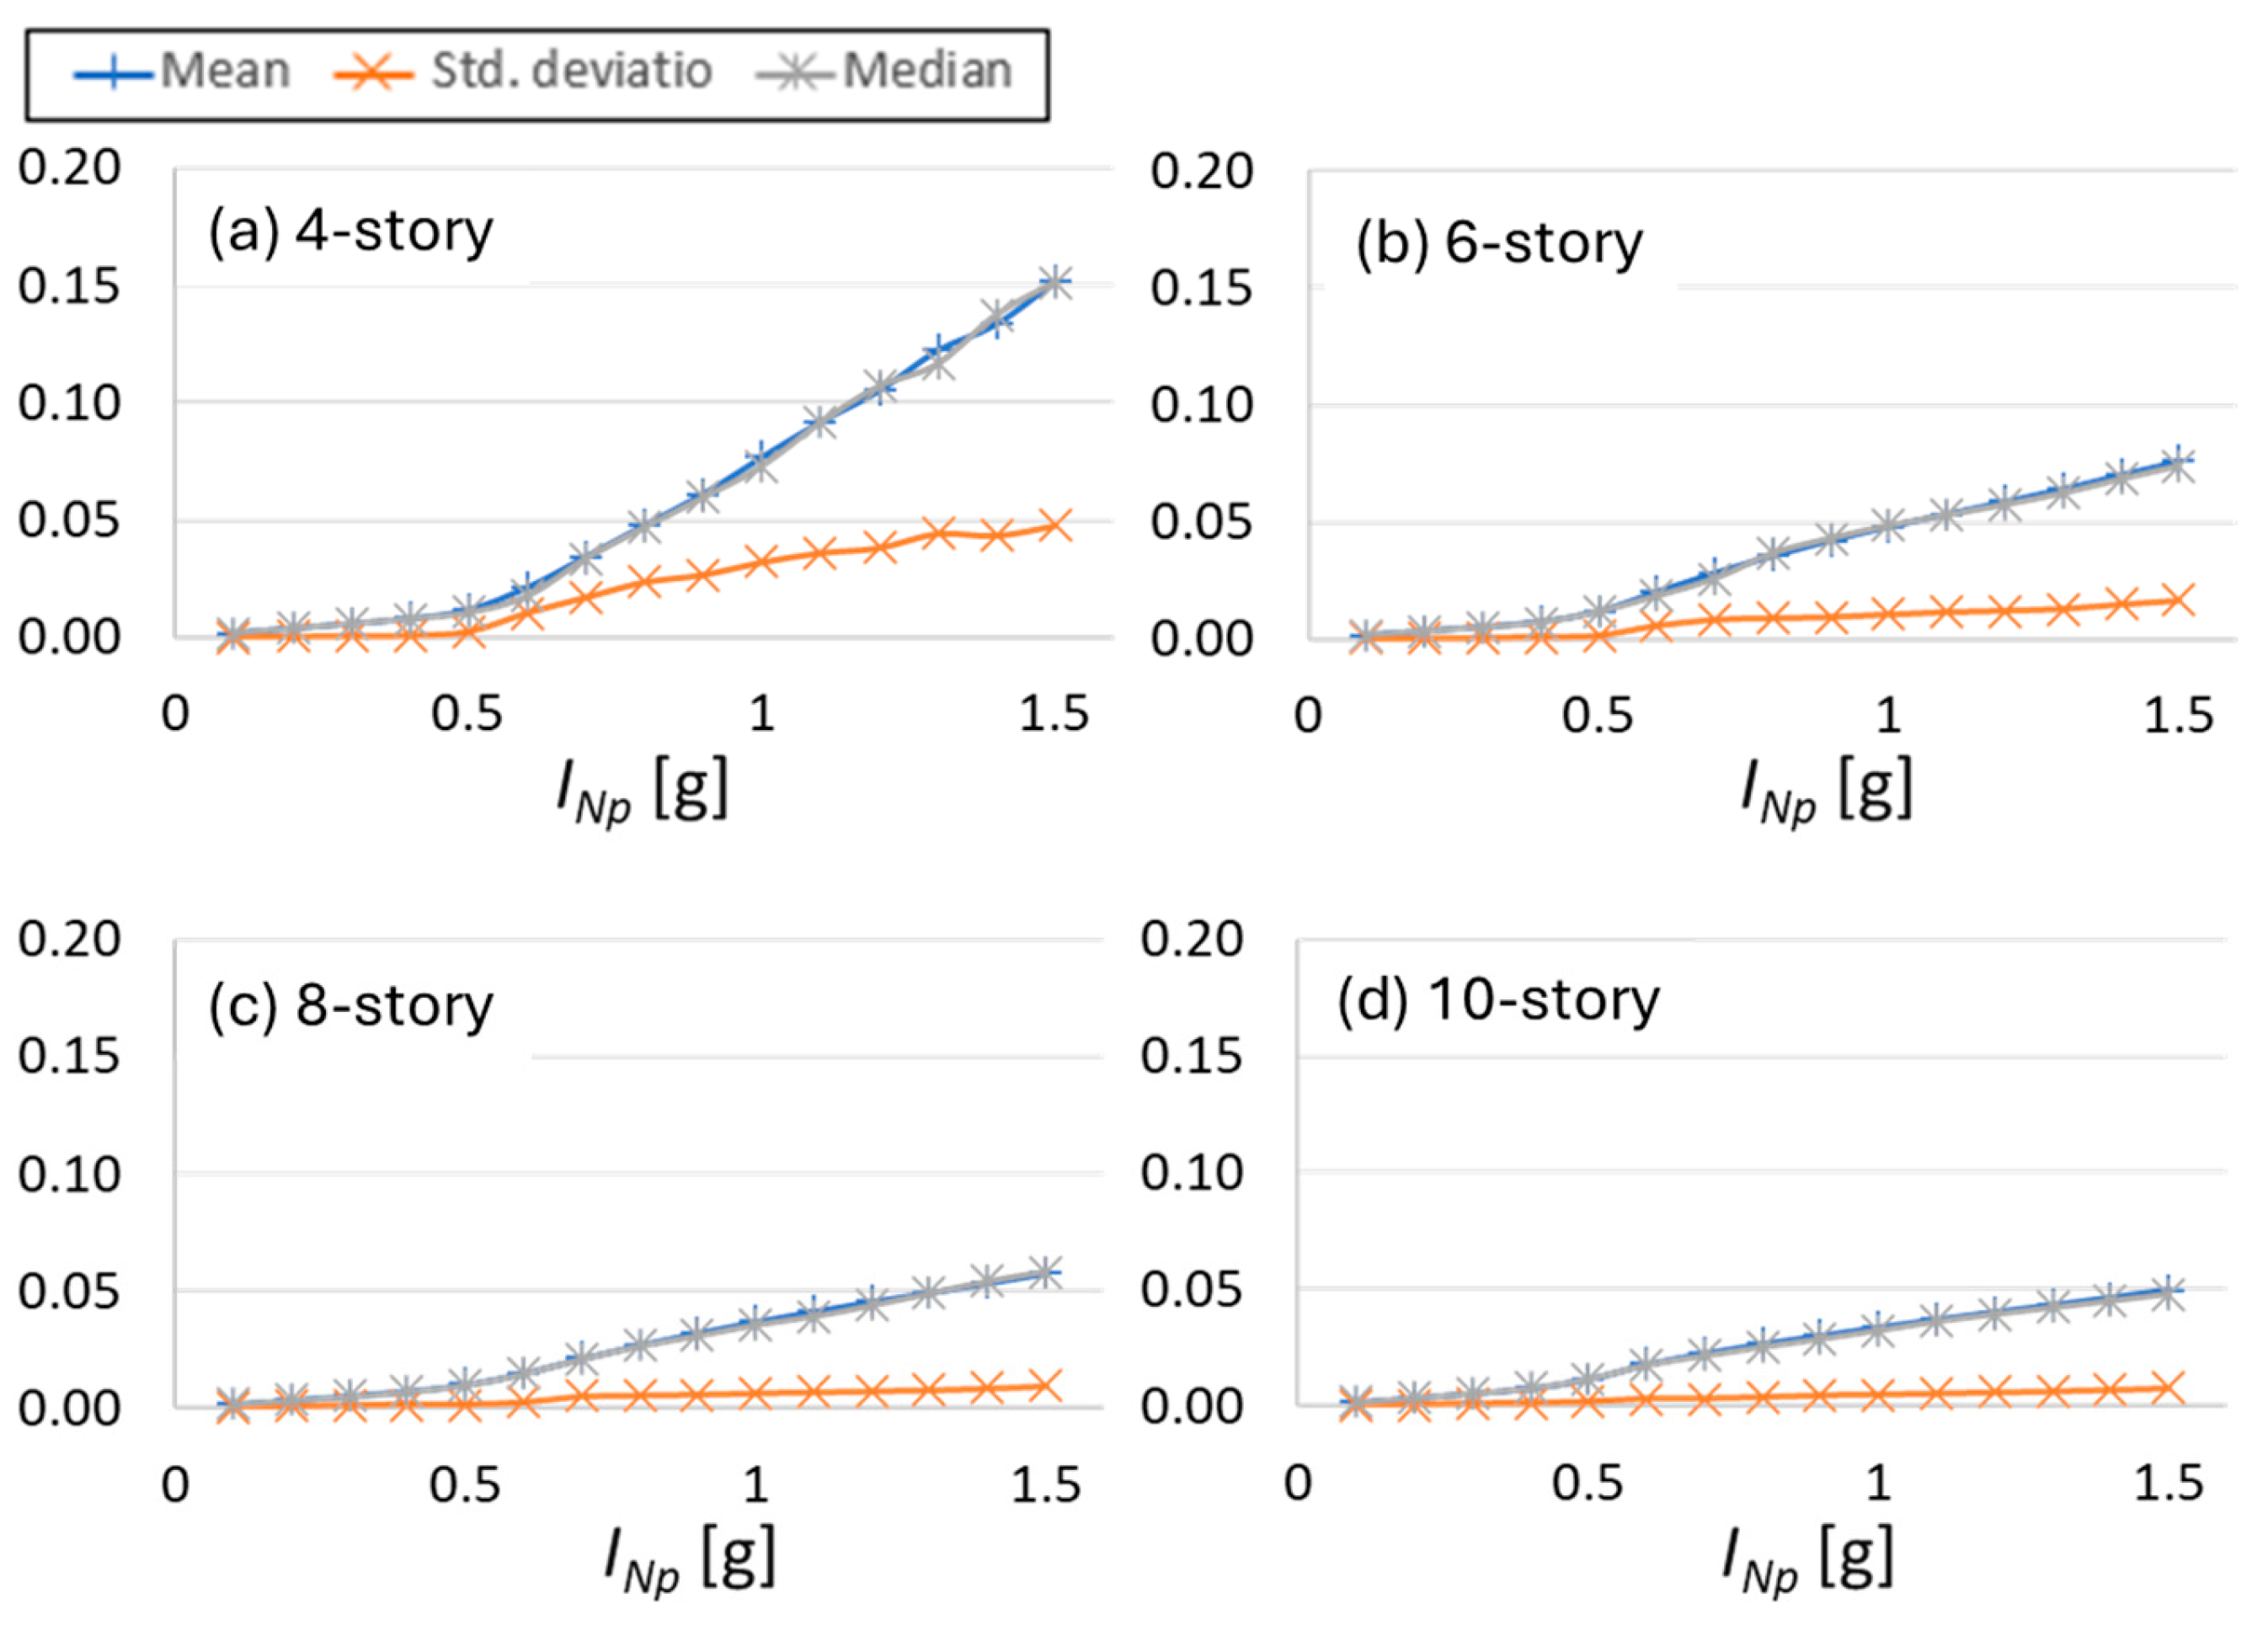
For the design of the architecture and the training process of the neural networks, the fundamental period and the ground motion intensity measure are the input variables, while the mean, median, and standard deviation of the maximum interstory drift are the output variables. Figure 7 shows the generic neural network architecture with multi-hidden layers, two neuron inputs, and tree neuron output. The input variables describe, in very general terms, the characteristics of the problems, because the fundamental period is one of the most important structural characteristics, and the seismic intensity measure describes the earthquake hazard using a simple value. Other seismic and structural features could be used as inputs to simplify the learning process; however, the deep neural network approach suggests modeling complex data using few inputs from multiple hidden layers between the input and output layers, hence the name “deep” networks. The output variables correspond to statistical parameters, which characterize, in general terms, the behavior of the maximum interstory response of RC mid-rise buildings under earthquake ground motions (Figure 8 and Figure 9). The mean and median are two statistical measures of central tendency that can be used to identify potential skewness in the distribution of data; that is, if the difference between the mean and median is high, it means that the data tend towards higher or lower values. The dataset of Figure 9 is in Appendix A.
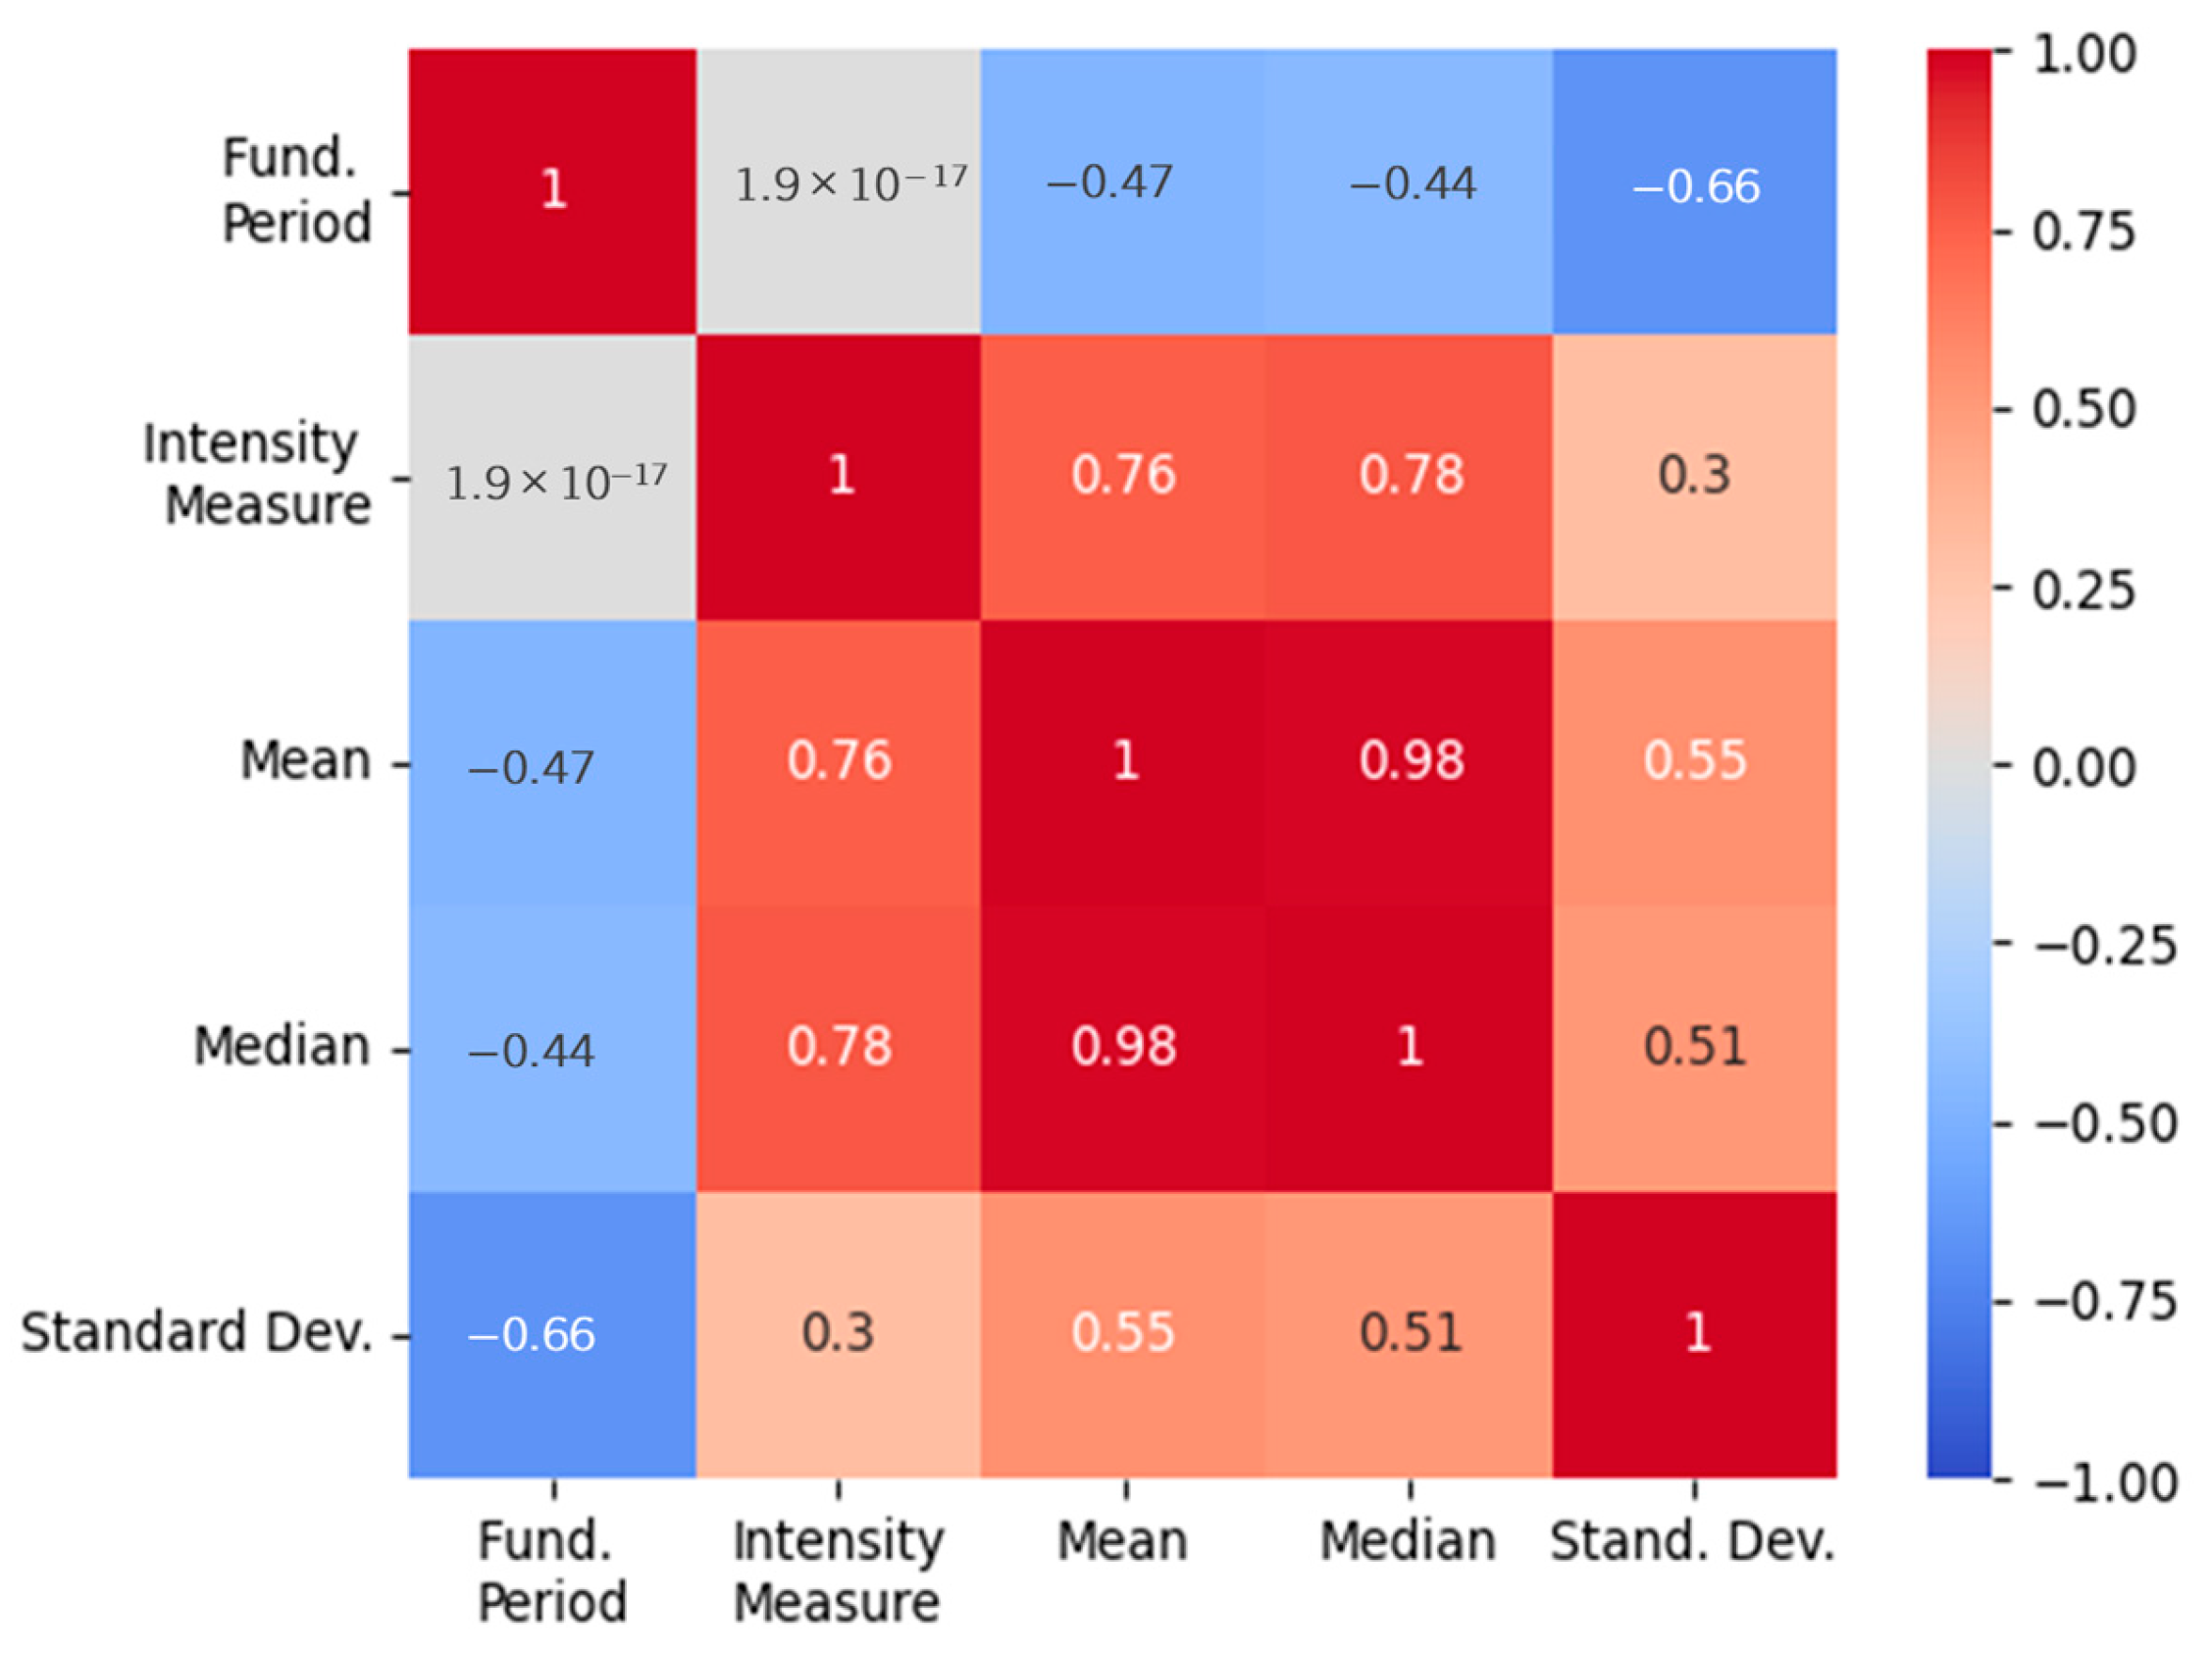
A correlation analysis between the input and output variables is presented in Figure 10. The mean, median, and standard deviation (outputs) have a moderate to significant or strong relationship with respect to the fundamental period and the intensity measure (inputs). Notice that, in Figure 10, no relationship between the input variables is observed, therefore, they were used as input neurons for the ANN model.
The number of neurons in the input layer and the output layer are directly defined by the problem to solve, while the selection of the optimal number of hidden layers and their neurons is not directly determined. For this reason, it is necessary to study different configurations of hidden layers. Thanks to the multiple hidden layers, a deep neural network can solve complex regression or non-linear classification problems, however, with many hidden neurons it is possible to reach overlearning more quickly [49]. Therefore, a pyramid-shaped architecture is adopted to mitigate this common problem pertinent to deep network models. Table 4 summarizes the neural network configurations and their performance in the task of prediction. The configuration [2, 3, 3] indicates an array with 2 input neurons, 3 neurons in a hidden layer, and 3 output neurons, while the configuration [2, 10, 7, 3] represents a neural architecture with 2 input neurons, 10 neurons in the first hidden layer, 7 neurons in the second hidden layer, and 3 output neurons. Numerically, Table 4 shows the decrease in the error when the number of hidden layers increases.
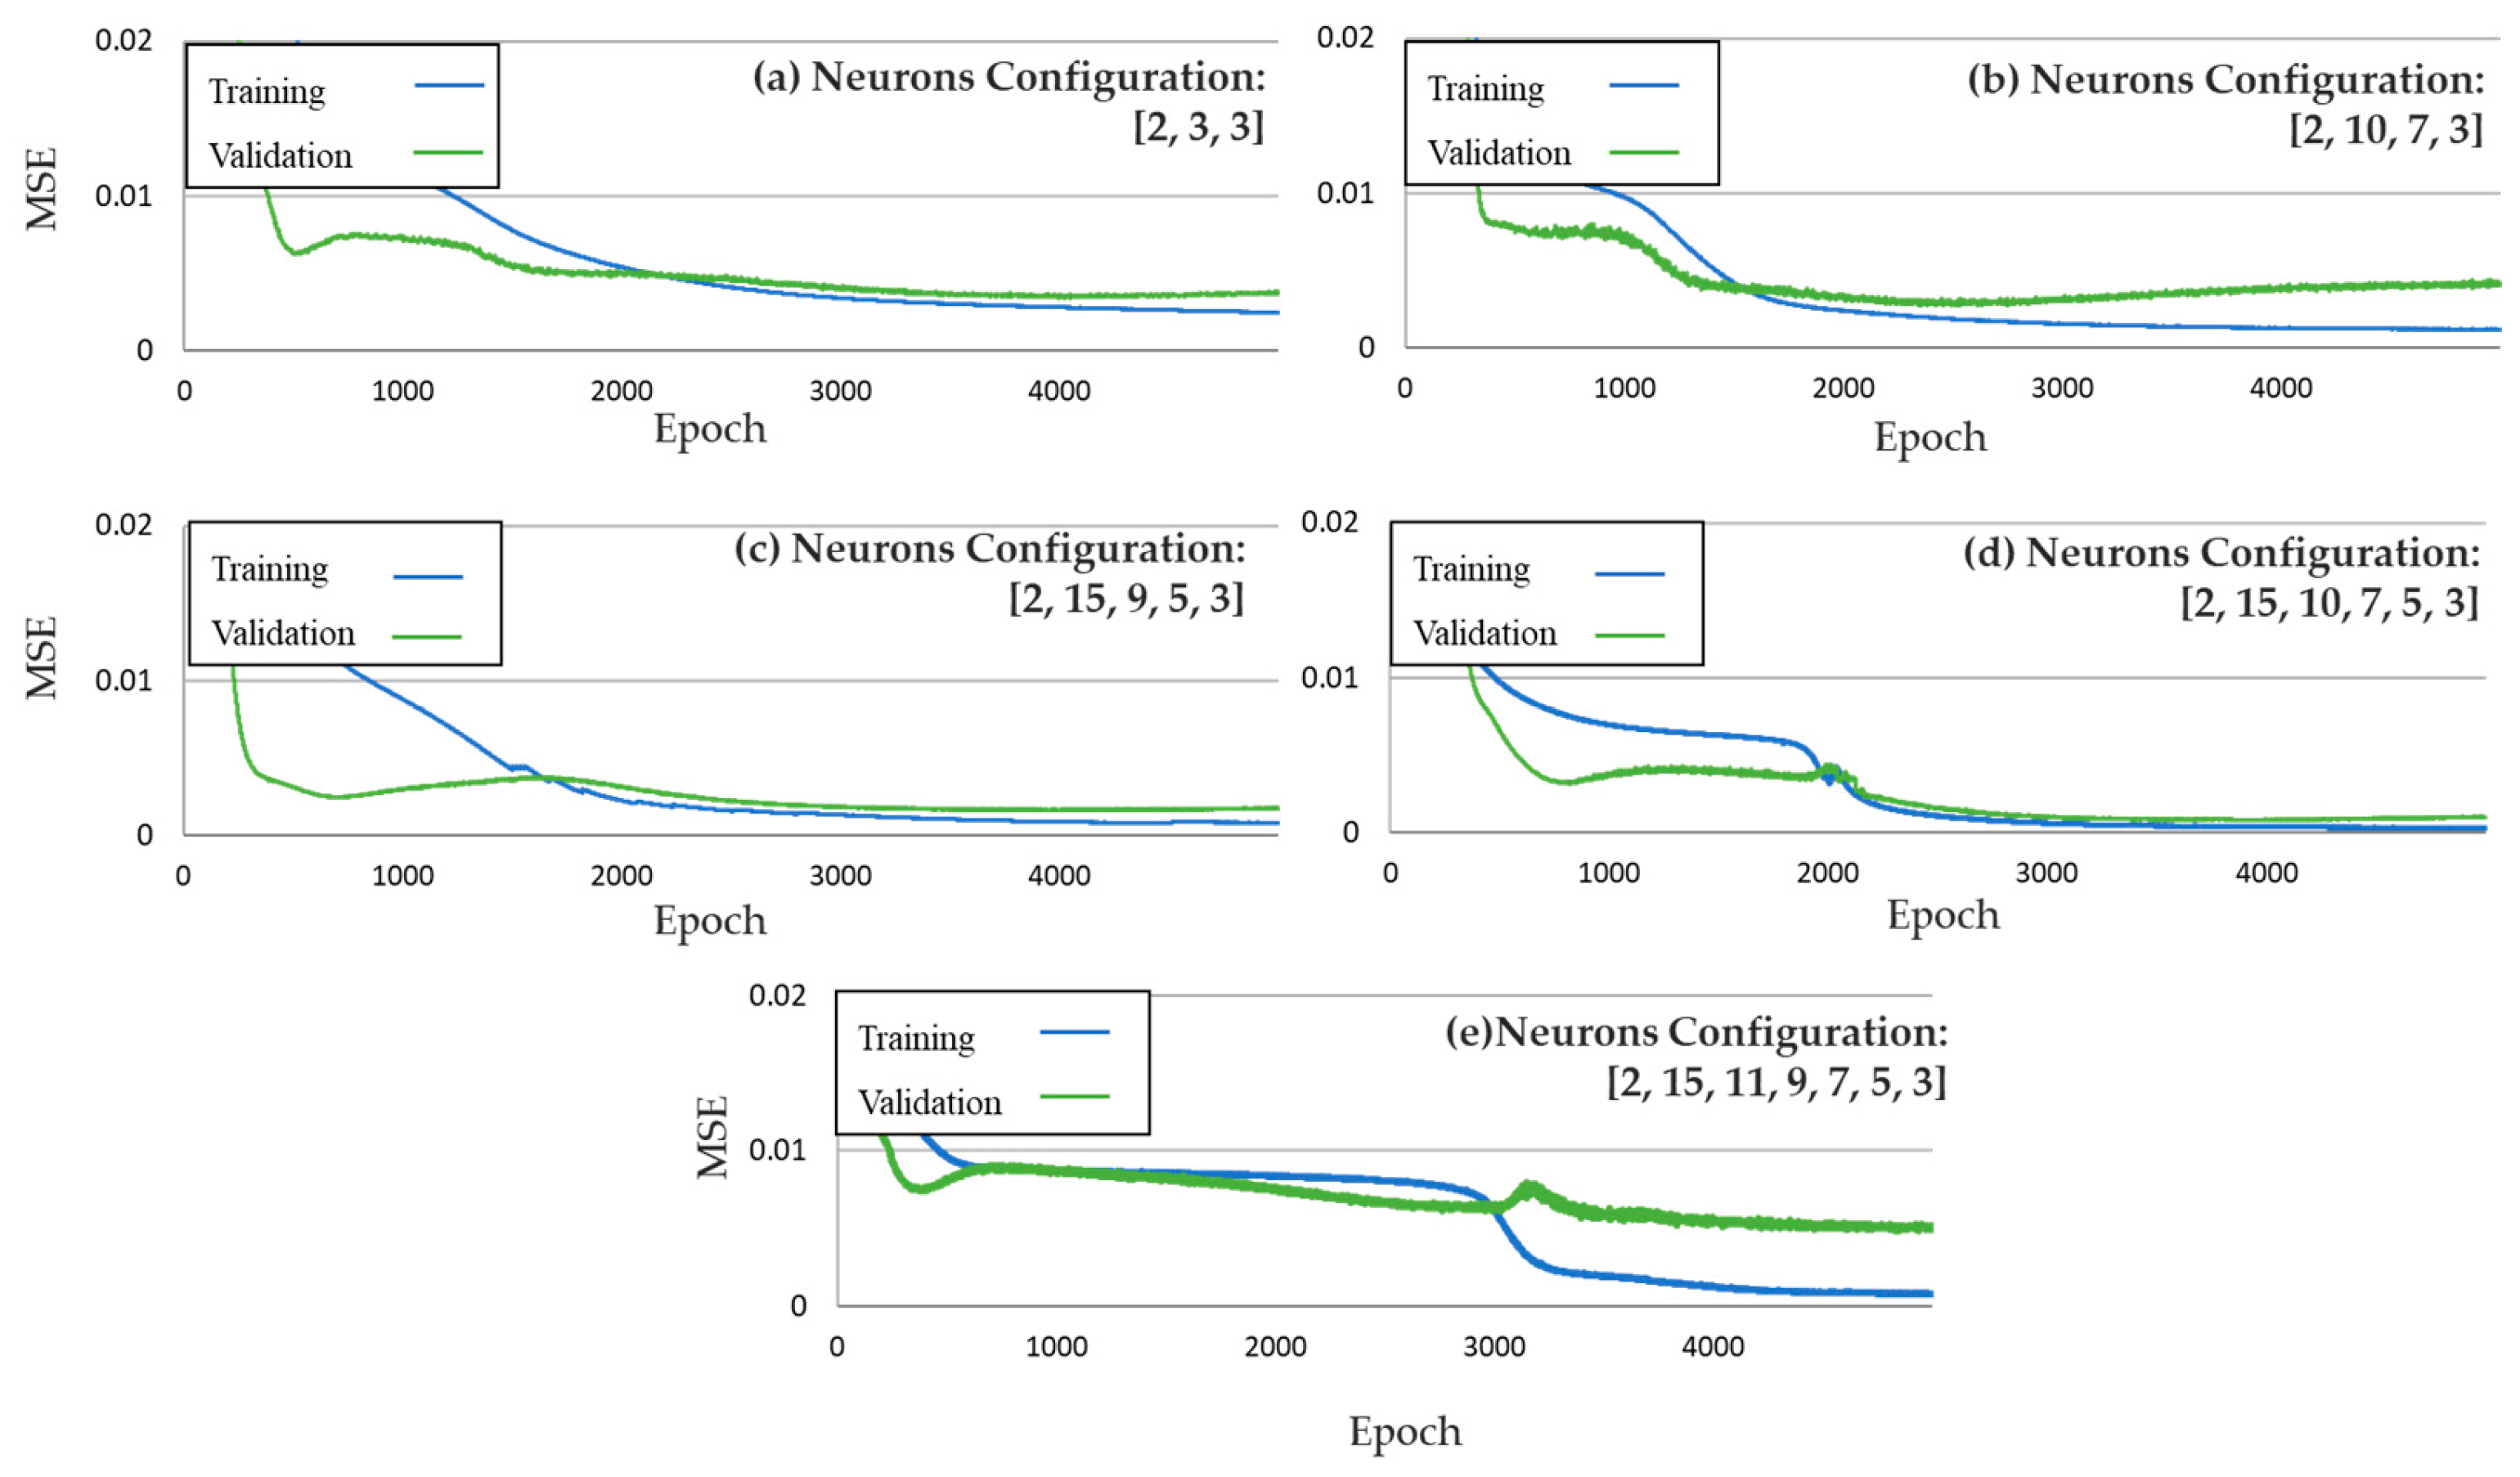
The training error and evaluation error of neural networks with 1, 2, 3, 4, and 5 hidden layers are shown in Figure 11. Graphically, it is possible to observe the behavior of the errors and detect possible problems of over-fitting. The training error is drastically reduced by increasing a hidden second layer. However, from five hidden layers, the over-fitting problem starts to appear significantly. The neural network with four hidden layers of neural configuration [2, 15, 10, 7, 5, 3] offers a good prediction with training data or evaluation data.
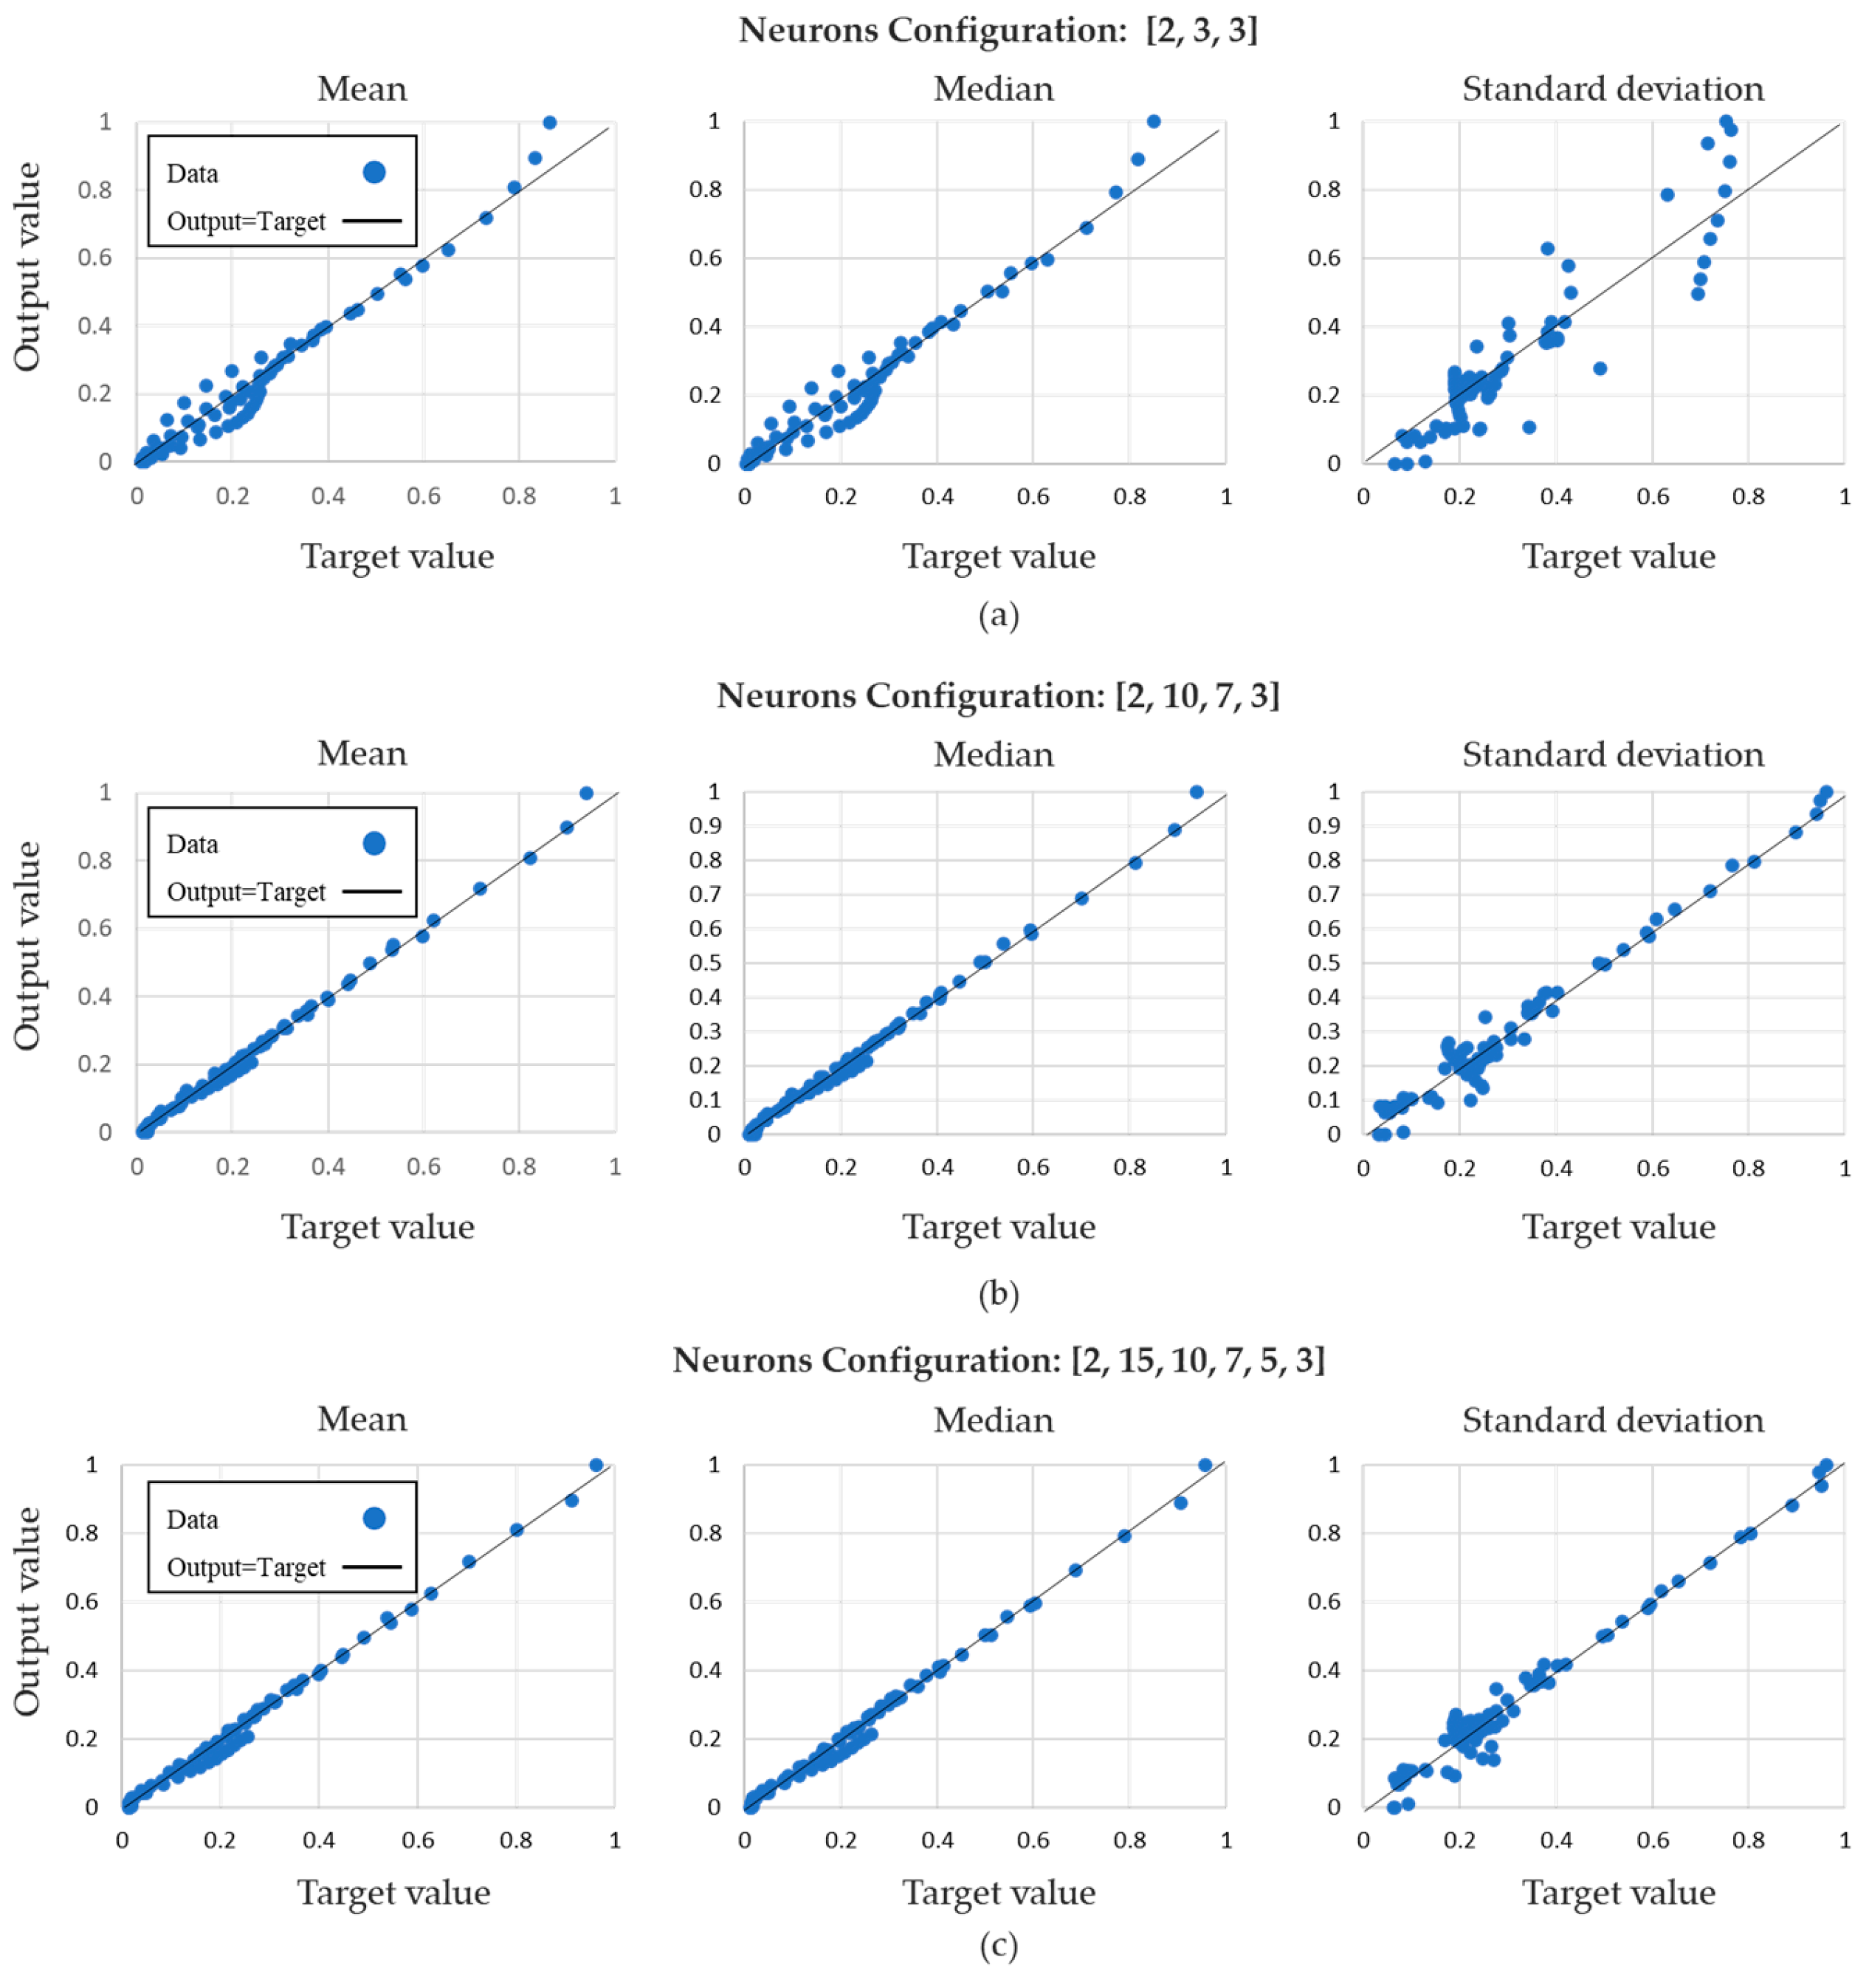
A correlation graph between the target value and the response of the neural network allows us to visualize the degree of dispersion. Several correlation graphs are introduced in Figure 12 to show the degree of approximation offered by some of the neural configurations. The neural network with one hidden layer presents great drawbacks in describing each one of the outputs. With two hidden layers, the problem of describing some of the three output variables is solved; however, the standard deviation is not well correlated. From four hidden layers, all output variables are adjusted to acceptable correlation values. While more layers can help to improve this fit and decrease dispersion, the problem of overfitting would become significant.
To validate the results of the neural configuration [2, 15, 10, 7, 5, 3], Table 5 shows the results of the application of the technique known as cross-validation. This technique allows us to observe the independent degree of the error with respect to the data selected for the training process [50]. A minimum variation of the error of each training process indicates that the magnitude of this error is independent of the randomly selected data, while a significant variation indicates that the random selection of data for the training process influences the degree of prediction of the neural network. The error variation for neural configuration with four hidden layers is minimal; therefore, the amount of data generated to describe the behavior of the output variables is adequate. In this way, the random selection of the data corresponding to the partition of the training process is independent of the efficiency achieved by the neural networks.
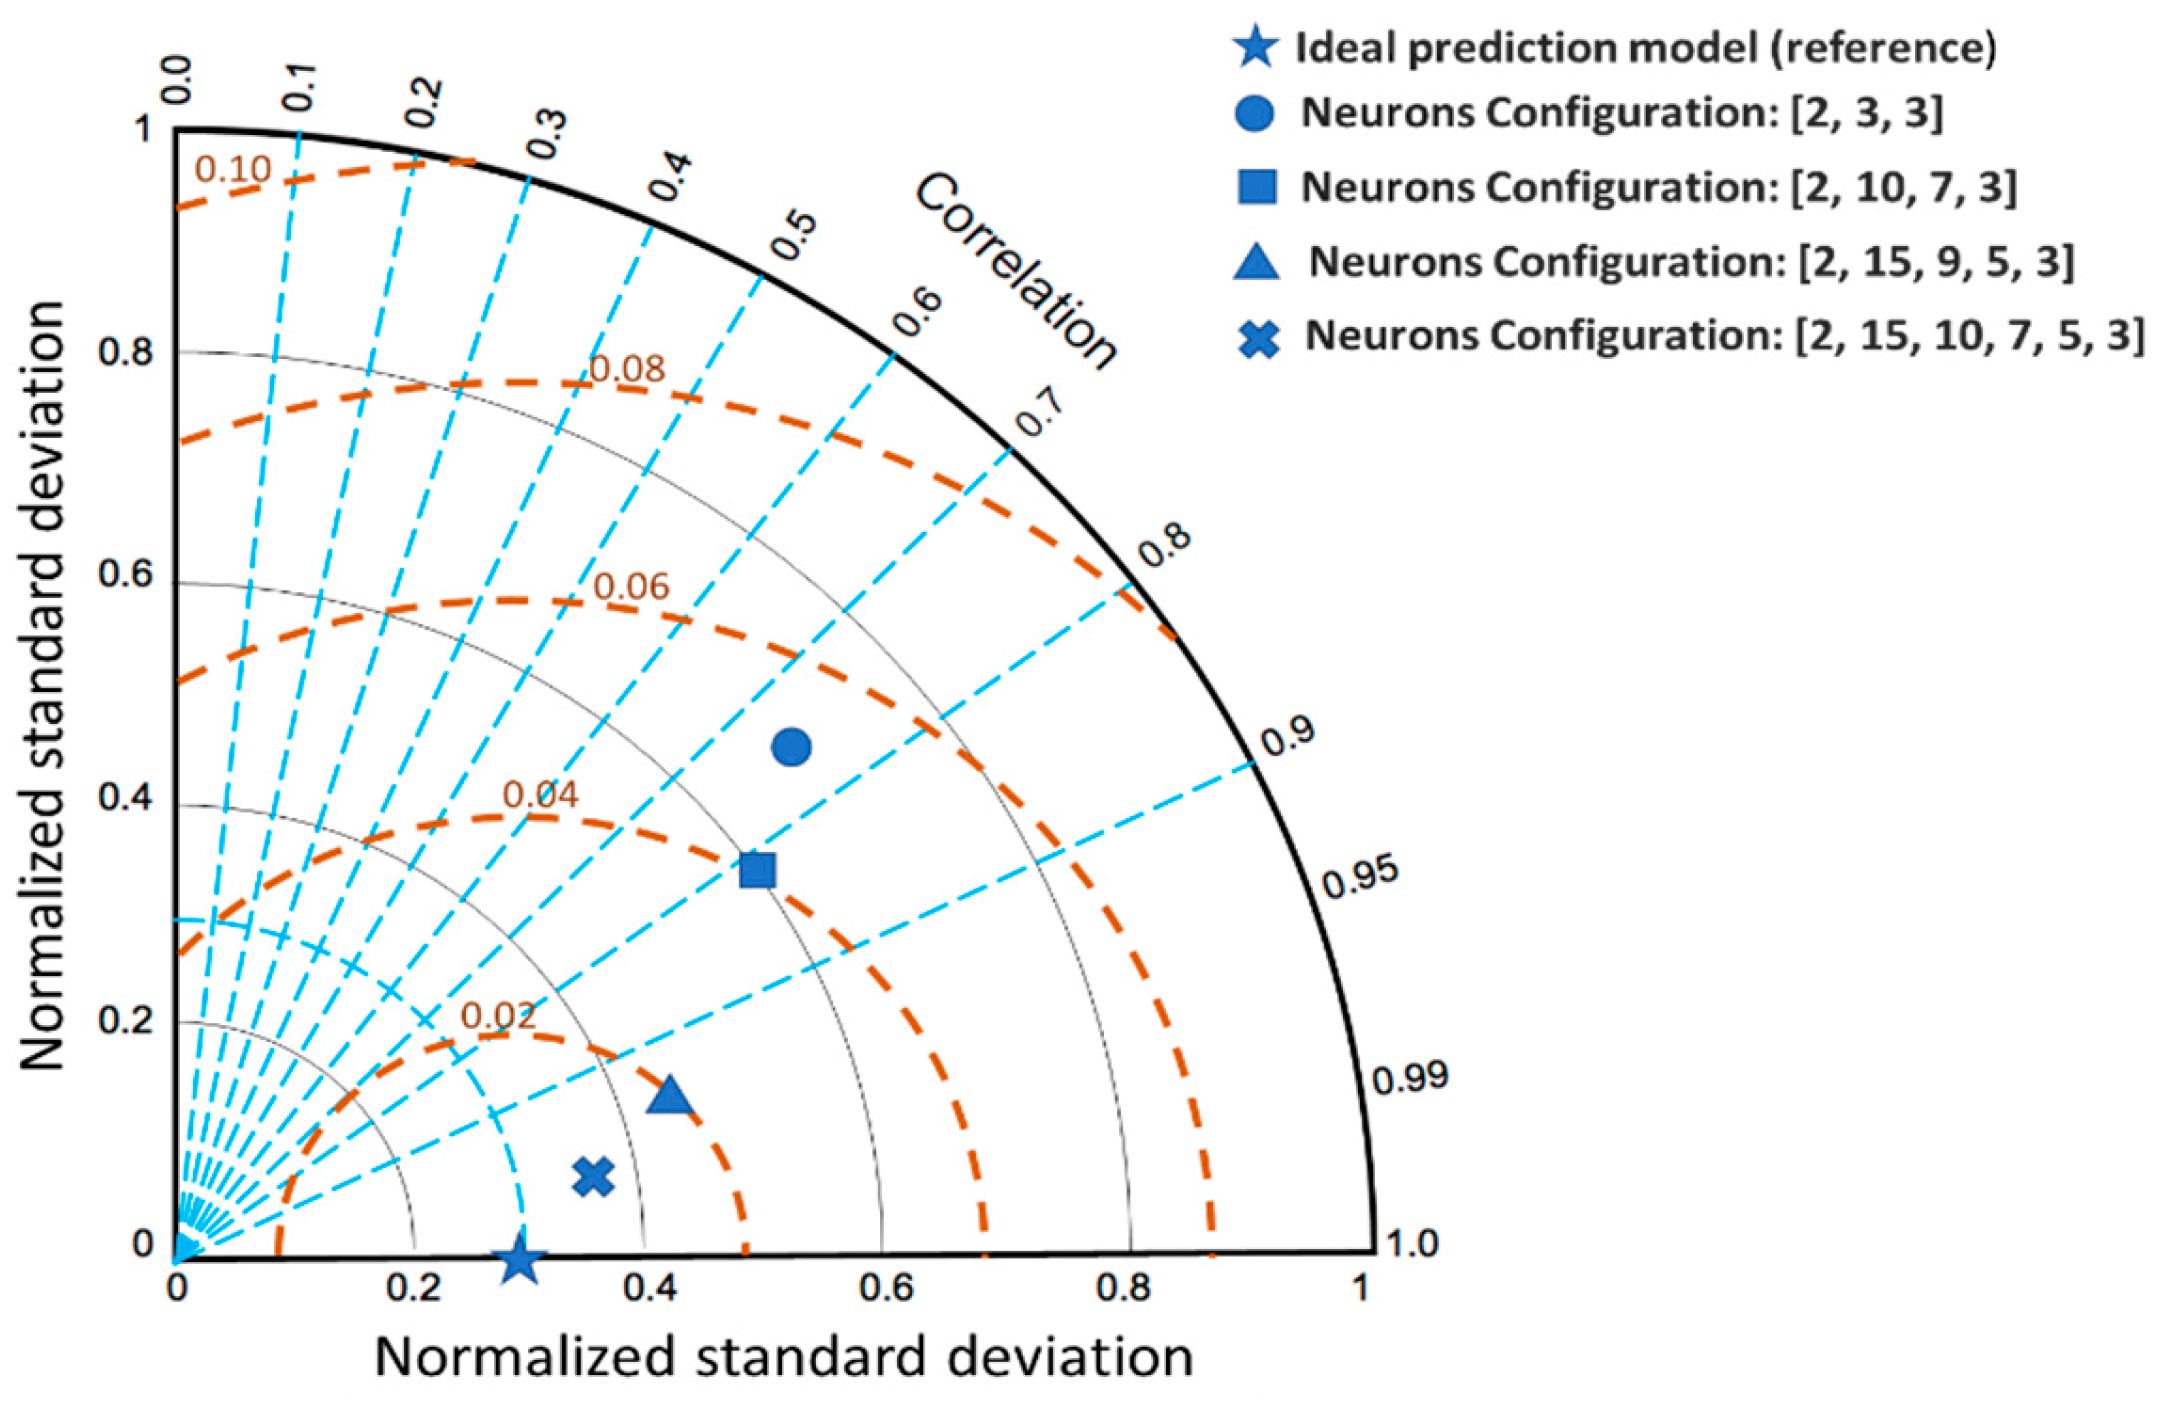
A graphic representation of the prediction performance of different models can be given from the well-known Taylor diagram, which is a visual aid to analyze and compare models from its three statistics attained: correlation coefficient, the root-mean-square error (RMSE), and the standard deviation [51]. Figure 13 shows a Taylor diagram with the prediction models of one, two, and four hidden layers. The brown circular dashed lines around the blue star (ideal prediction model) represent the error. The model with four hidden layers is the closest to the blue star; therefore, this model could be announced as the most accurate model because it has less error, higher correlation, and similar deviation.

5. Deep Learning Model Tested to Assess the Seismic Performance of a Complex RC-BRB Building

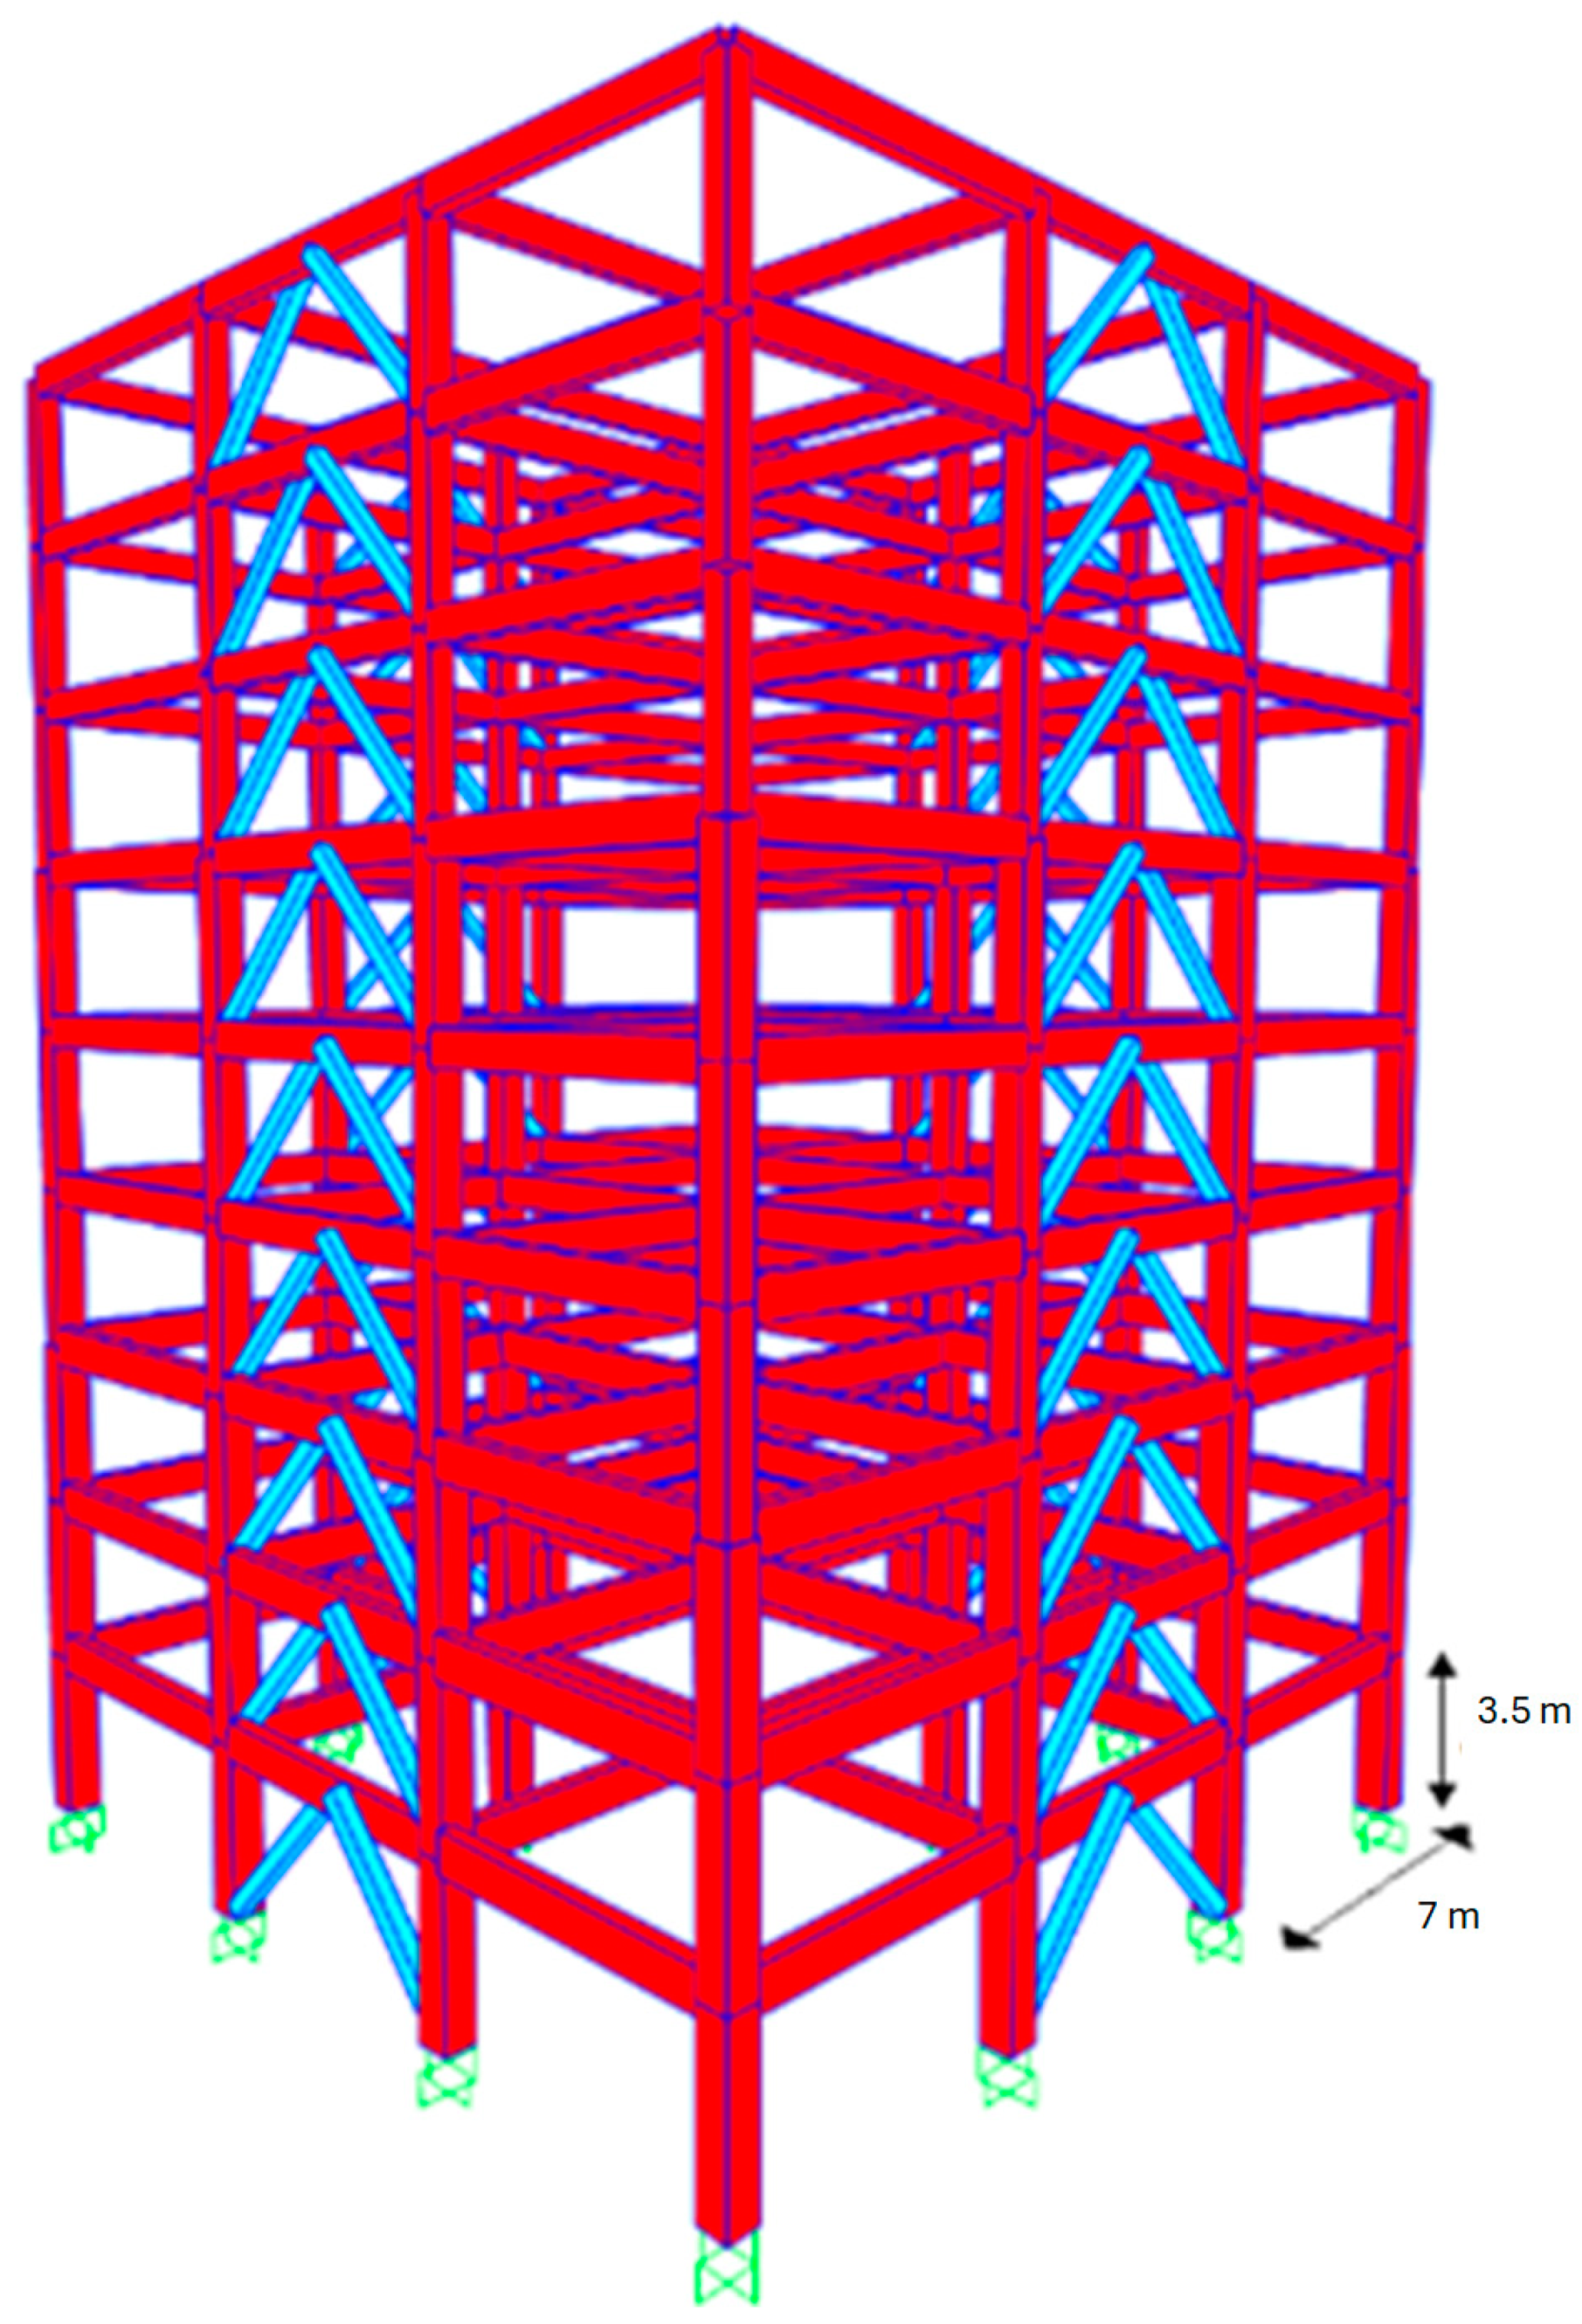
This chapter focuses on assessing the performance of deep learning neural networks in predicting the maximum interstory drift of an RC-BRB. In order to test the deep learning model presented in Chapter 4, a nine-story RC-BRB building is evaluated. The main characteristics of the structural model are shown in Table 6, and Figure 14 illustrates a 3D view of the braced building with 9 stories. Notice that all the buildings were designed under seismic loads corresponding to the Mexico City Building code. It was proposed to use a different section of beam and column for each 3 floors, and one BRB section for the framed building. Table 7 shows the sections and the main properties of the structural model obtained.
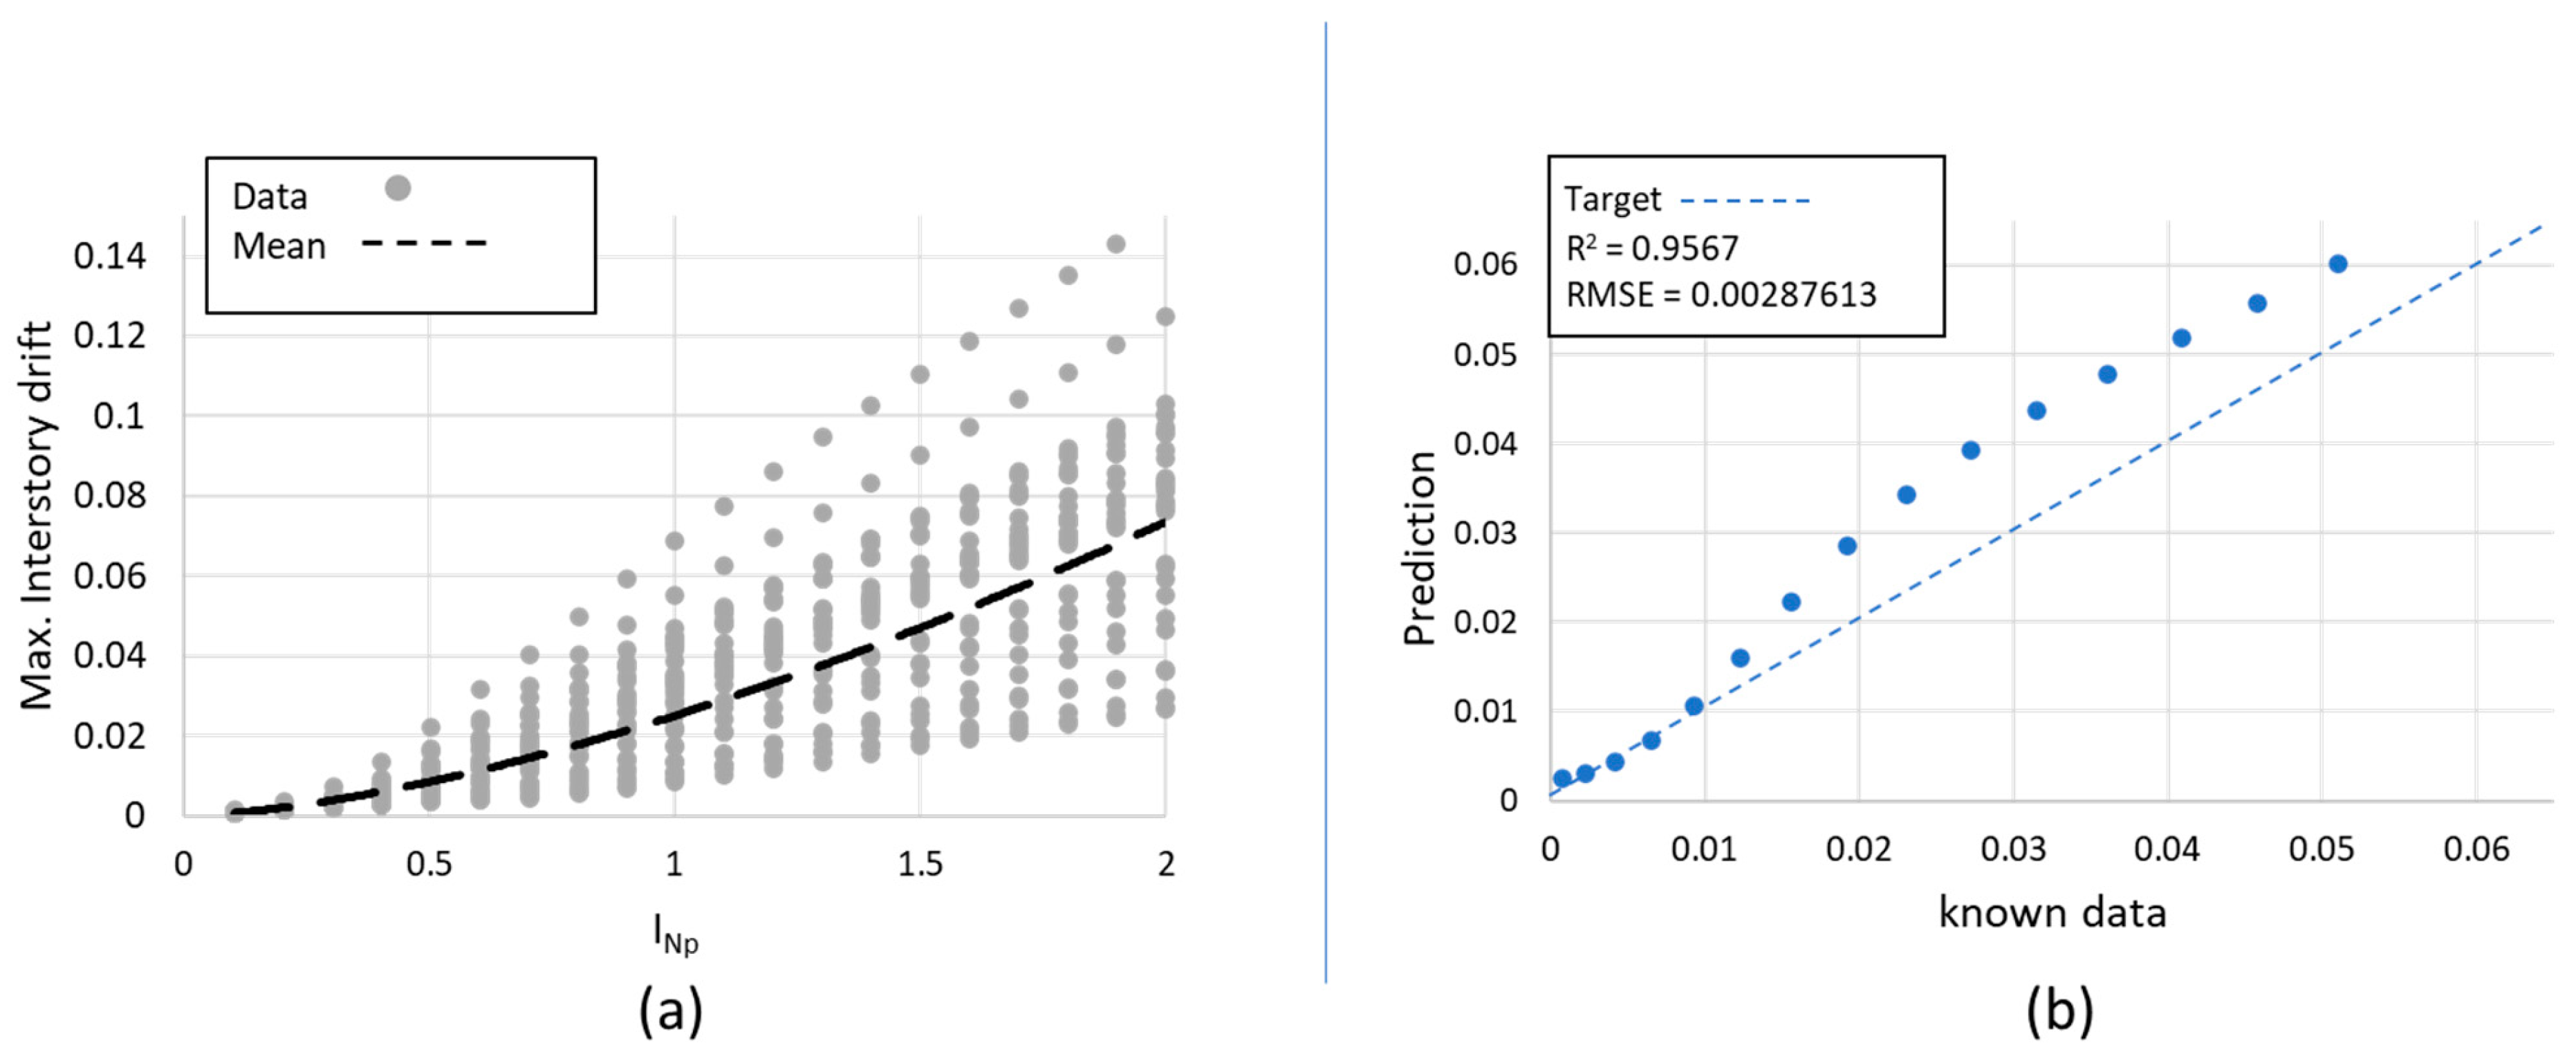
The RC-BRB building with nine stories was subjected to the ground motion earthquakes of Table 1 in order to compute incremental dynamic analysis at different intensity levels in terms of INp and maximum interstory drift. Figure 15a illustrates the results of the incremental dynamic analysis and the corresponding values of the maximum interstory drift, while Figure 15b shows the performance of the trained neural network. It is observed that the network allows close values to be obtained for the complex incremental dynamic analysis results. It is important to say that a coefficient of determination (R2) of 95% was obtained in such a way that the deep neural network could be a good tool for seismic predesign tasks and the fast estimation of the structural response or performance of buildings under earthquakes.

6. Seismic Performance Prediction of Nonlinear SDOF Structures via INp and Deep Learning

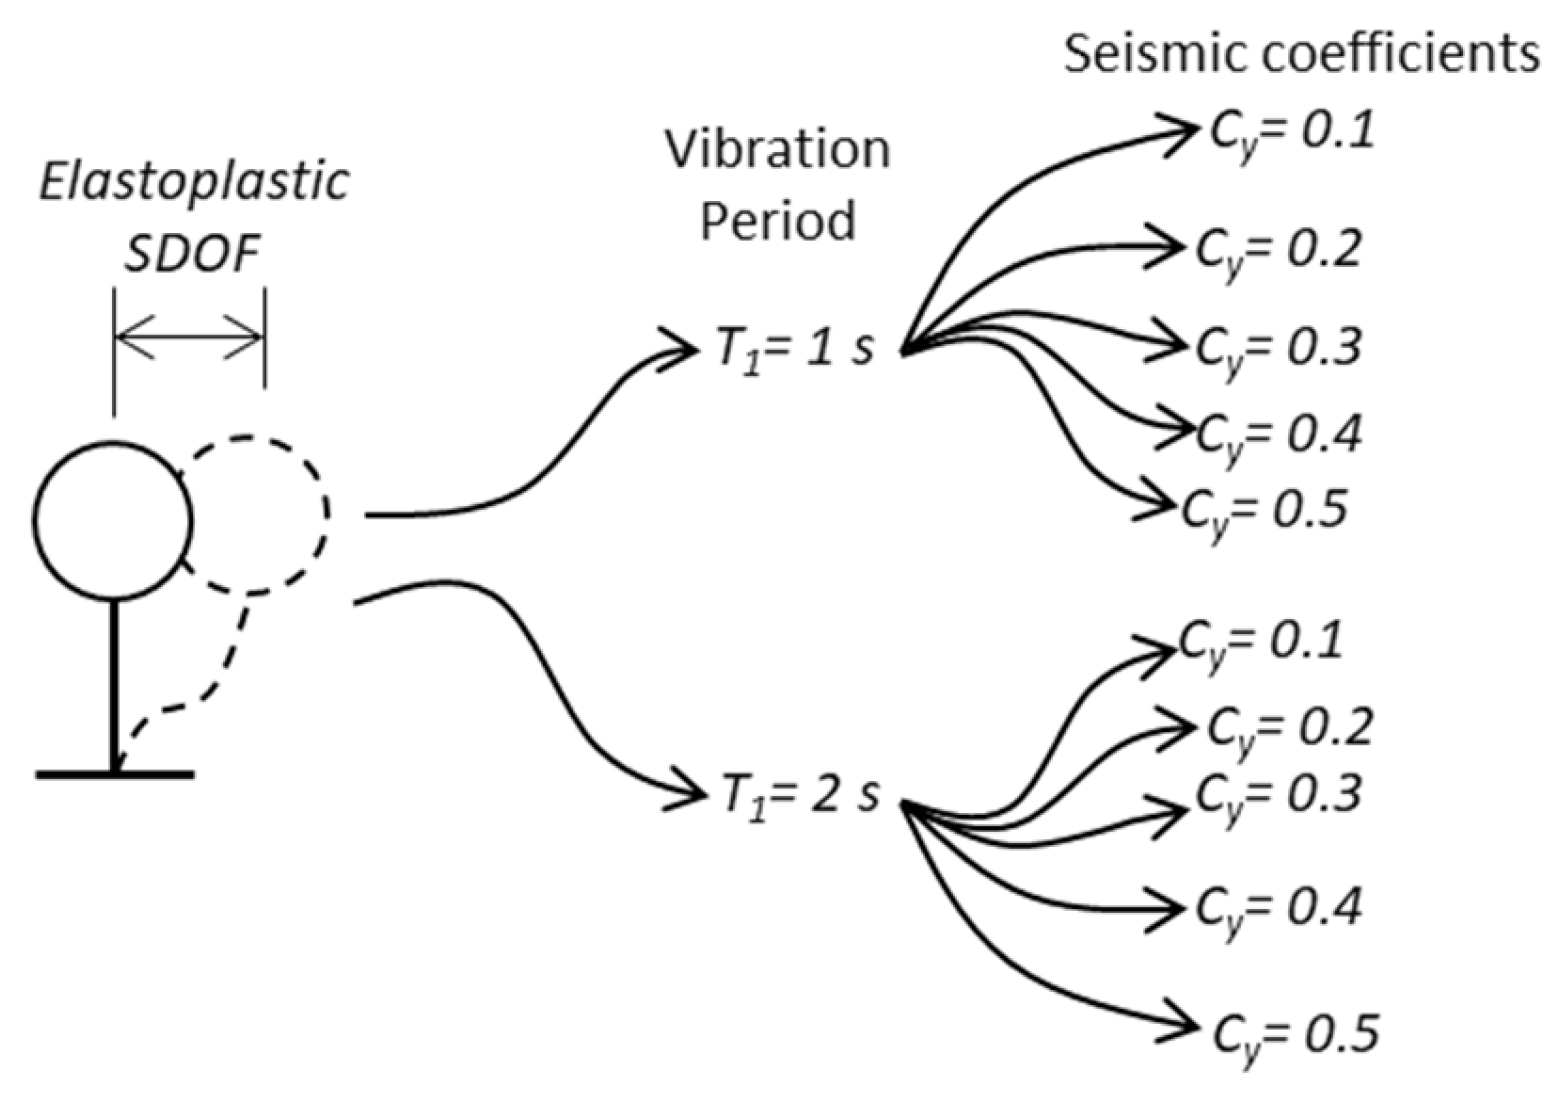
It is well known that the seismic performance of buildings is affected by many parameters like construction material, resisting system, etc. In the case of RC, BRBs frames, or most of the structural systems, the response prediction is very complicated, and the results can vary significantly. For this reason, all the seismic design codes around the world present earthquake-resistant methodologies, earthquake design spectra, record selection strategies for nonlinear dynamic analysis, ductility reduction factors, hazard analysis, and so on, based mainly on simplified models of the common, well-known single degree of freedom systems as the core of earthquake engineering. Motivated by this issue, thousands of nonlinear seismic analyses of various elastoplastic SDOF systems with different structural and in general dynamic characteristics (structural periods T, and seismic coefficients Cy), as those indicated in Figure 16, are obtained by using incremental dynamic analyses in terms of the novel and efficient intensity measure INp. Notice that, in this case, the new structural response parameters, ductility, and normalized hysteretic energy (the ratio of the hysteretic energy divided by the force and displacement at yielding), have been incorporated and calibrated via deep learning. These parameters have been selected since the ductility parameter is crucial in the international building codes; in fact, the ductility reduction factors usually selected to take into account the nonlinear behavior are based on the ductility [52,53,54]. The third parameter selected for this study was hysteretic energy, which is currently the most important parameter to account for cumulative demands on the structural design of buildings under earthquakes [55,56,57]. It is important to say that most of the new energy-based procedures and damage indices are based on hysteretic energy [58,59,60,61,62,63]. As an example, and for the sake of brevity, only the results of the incremental dynamic analyses of nonlinear systems with a period equal to one are presented for seismic coefficients of 0.2 and 0.3 in terms of ductility and in terms of normalized hysteretic energy demands, and for a period equal to two and for seismic coefficients of 0.2 and 0.3 (see Figure 17 and Figure 18).
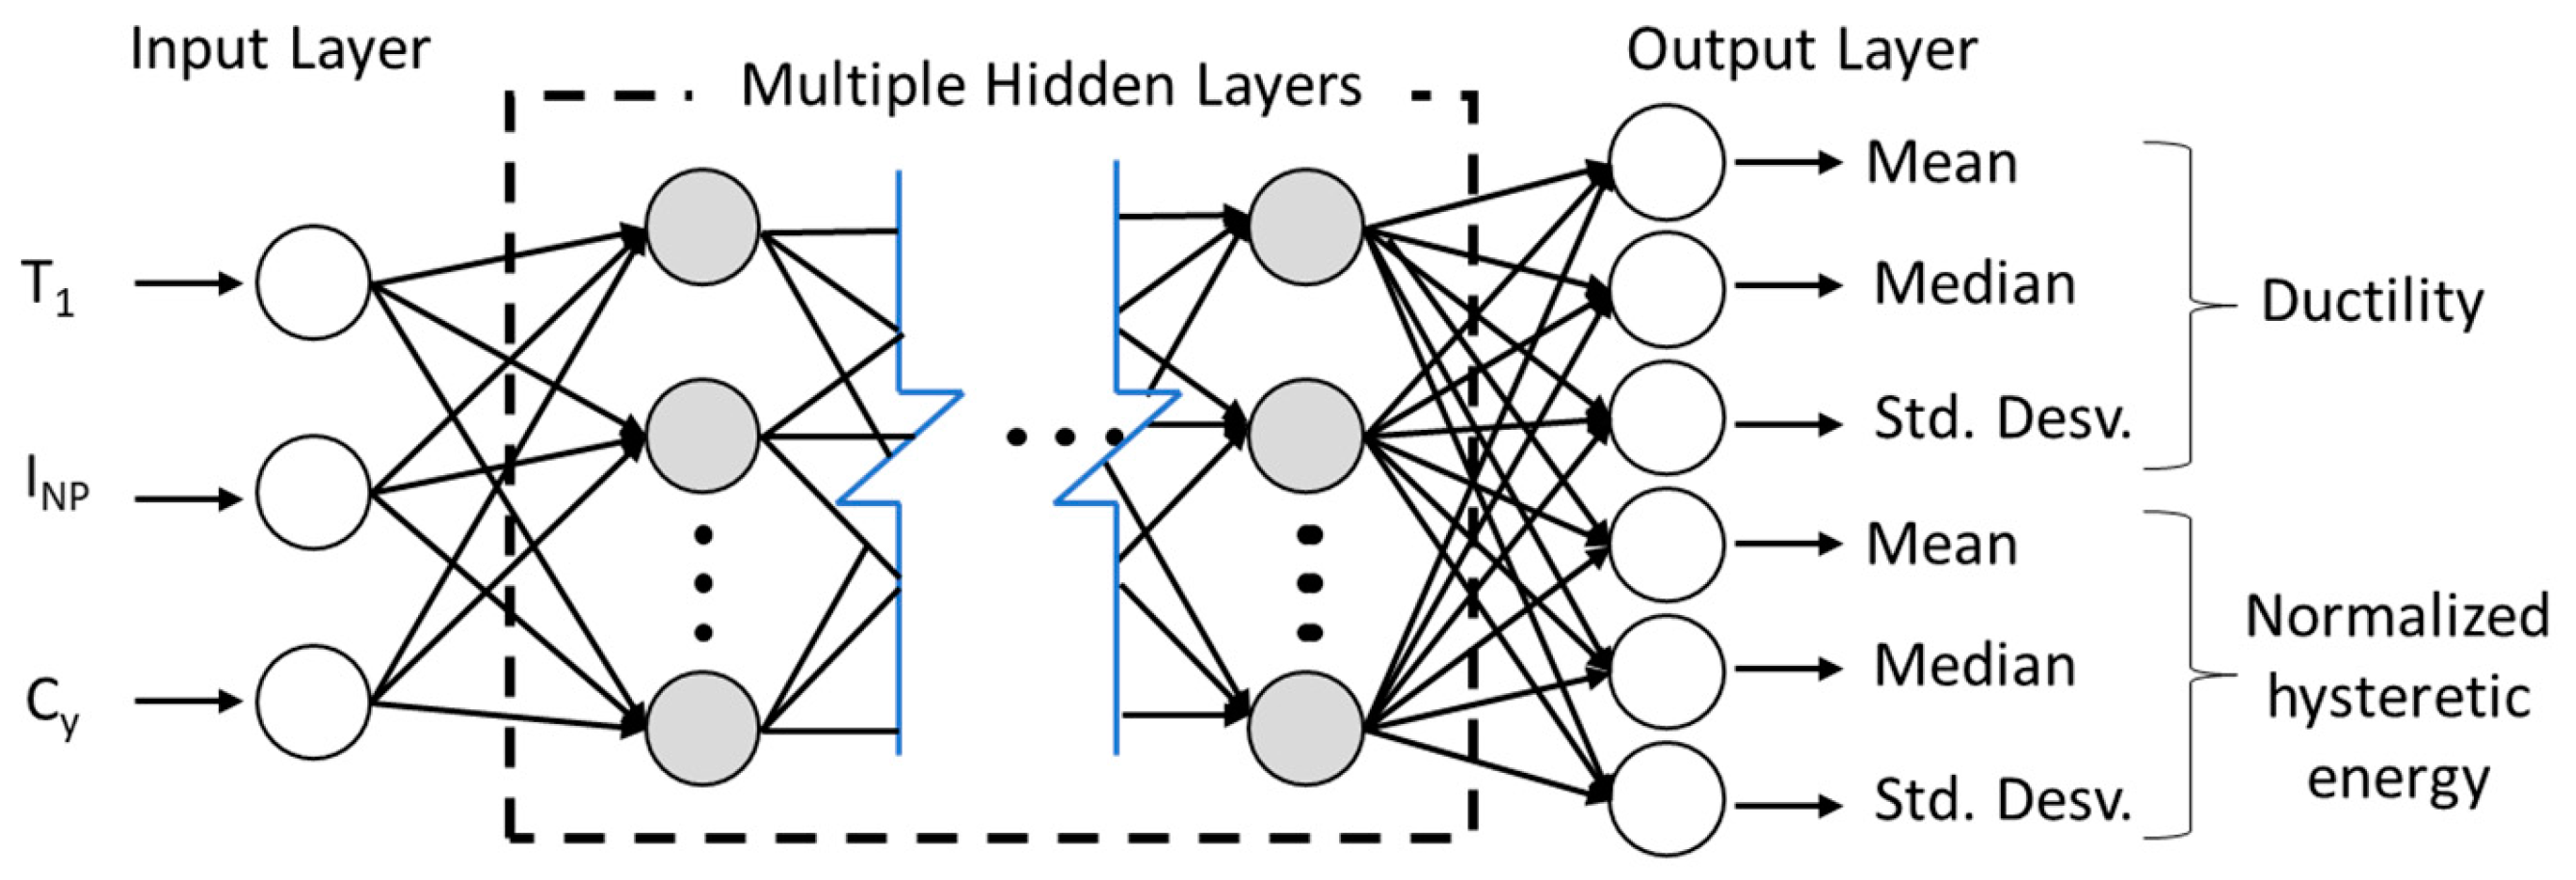
To analyze the performance of the approach presented via deep learning to predict the new parameters, the results obtained for ductility and normalized hysteretic energy are presented below. Figure 19 shows the configuration adopted in terms of input and output layers. Due to the large increase in outputs, it has been considered to add an important input (seismic coefficient Cy, one of the key parameters for earthquake-resistant design of buildings) to properly relate the problem with the new output parameters.
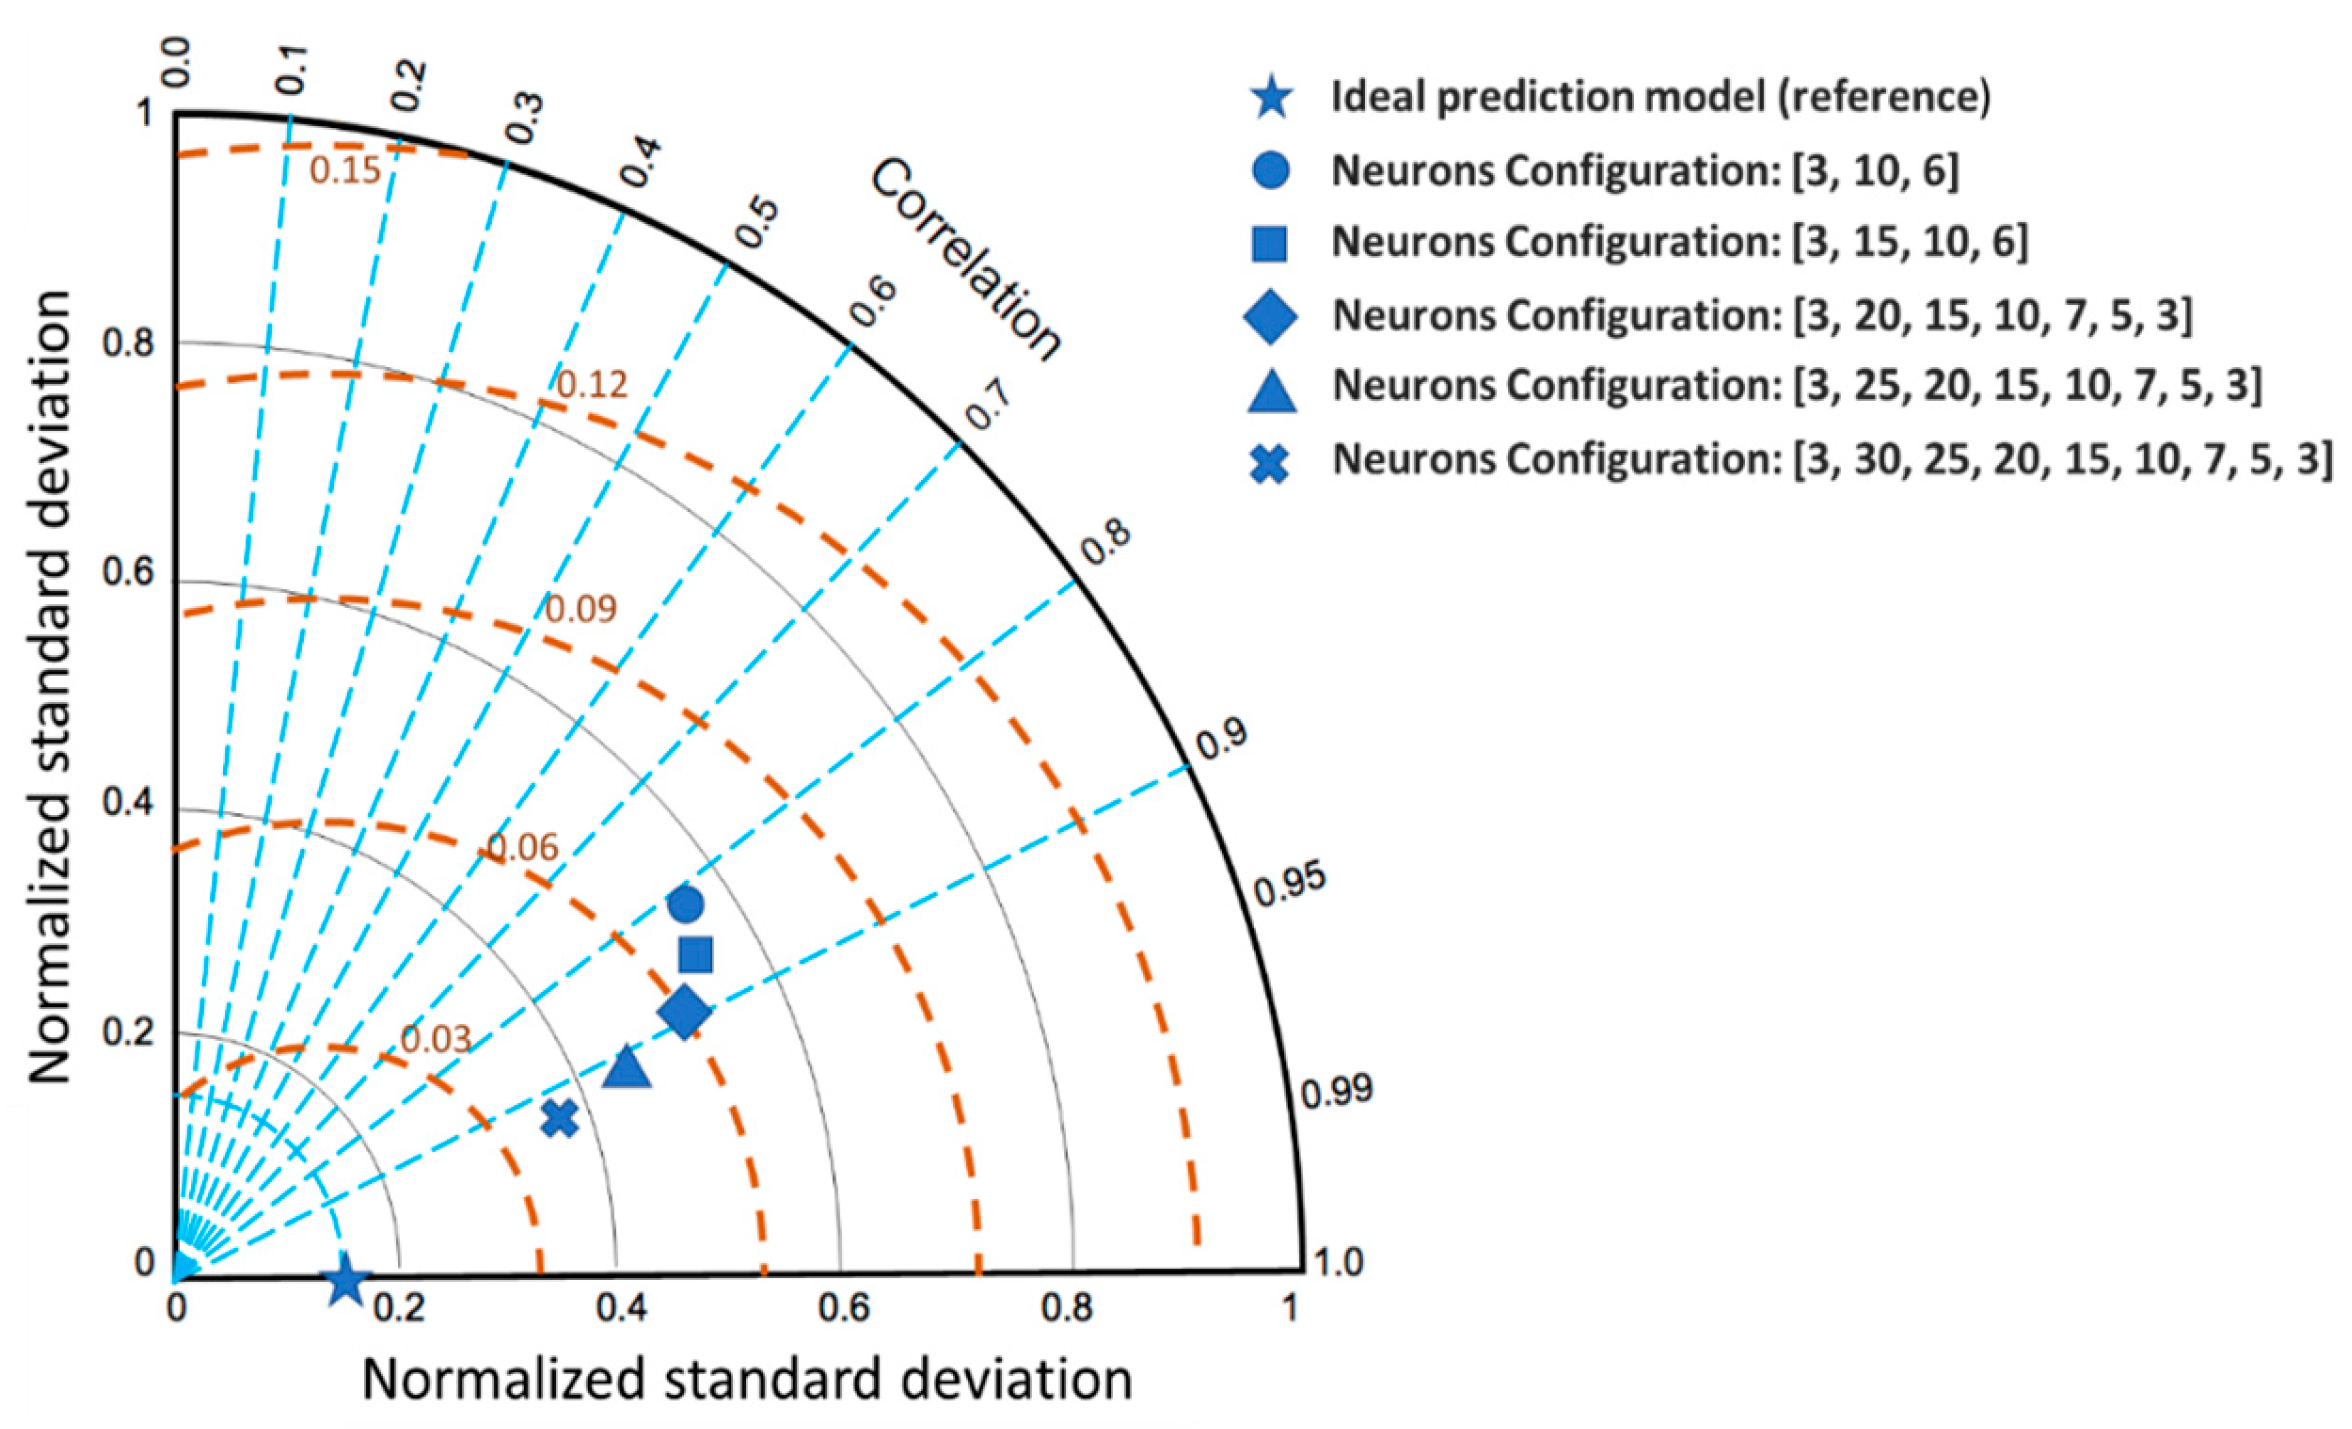
Table 8 presents the results of the training process to predict statistics of ductility and normalized hysteretic energy. It can be observed that the error decreases as the depth of the neuronal network increases; nevertheless, from five hidden layers, the overfitting problem is noticeable because the difference between the training error and evaluation error begins to grow. In addition, the Taylor diagram shown in Figure 20 helps to visualize the behavior of the model prediction performance. In this case, a better correlation and accuracy is observed when using more hidden layers.

7. Conclusions

In this study, several RC structural frames were dynamically analyzed using ground motion records scaled at different values of the spectral acceleration Sa(T1) and the ground motion intensity measure INp to compute the maximum interstory drift. The maximum interstory drift obtained was summarized using the statistical parameters known as mean, median, and standard deviation. Computational models based on artificial neural networks with multi-hidden layers were designed to evaluate the degree of prediction of the seismic response. The fundamental period and the seismic intensity measurement were proposed as the only input neurons to predict the statistical parameters of the maximum interstory drift.
The analysis of the results obtained from the training process demonstrated that, by increasing the number of hidden layers, it is possible to solve the determination problem due to the multiple non-linear transformations required. With a configuration of two hidden layers, an acceptable degree of prediction was obtained for only one of the three output variables. The approach towards a deep network configuration improved the prediction of all three variables; however, from five hidden layers, the problem of overfitting was evidenced significantly.
A cross-validation analysis was developed to evaluate the independence of the magnitude of the prediction error in relation to the randomly selected data set in the neural network training and testing process. Furthermore, the performance of the predictive learning models was visually evaluated using a Taylor diagram. In conclusion, the computational model based on deep learning can predict the structural behavior of buildings under earthquake ground motions in terms of the maximum interstory drift demand with good accuracy, acceptable cross-validation, and very close to ideal performance. The results also show that neural networks are a very flexible tool because it is possible to increase the number of input variables for the consideration of other structural forms; nevertheless, given the results of the different training tests, a major increase in computational demand is anticipated, which could be the scope of another study.
With the RC structures analyzed, an RC-BRB framed building with nine stories is tested to validate the model presented. The results indicate that a coefficient of determination (R2) of 95% was obtained in such a way that the deep neural network could be a good tool for seismic predesign tasks and the fast estimation of the structural response or performance of buildings under earthquakes.
Finally, because all the seismic design codes around the world are used to present earthquake-resistant approaches, design spectra, record selection strategies for seismic analysis, and so on, based mainly on simplified models as the commonly well-known single degree of freedom systems as the core of the earthquake engineering, thousands of seismic response analyses of several nonlinear elastoplastic SDOF systems were computed. These new numerical results provide the effectiveness of deep learning neural network models for structural prediction in terms of ductility and hysteretic energy demands of seismic performance. Therefore, this study is oriented toward the earthquake-resistant predesign and the fast estimation of the structural response of buildings under earthquakes using artificial intelligence advances in terms of the most important design parameters and by means of advanced and efficient intensity measures such as the novel INp.
For future research, analyzing the dataset using basic neural network architectures, including Feed Forward (FF), Radial Basis Function (RBF), and Multi-Layer Perceptron (MLP) models is planned, as well as comparing their performance against the deep learning and fast predesign techniques presented by other researchers.

Author Contributions

Conceptualization, O.P.-S. and E.B.; methodology, O.P.-S. and E.B.; software, O.P.-S.; validation, J.B., H.L. and A.R.-C.; formal analysis, J.C. (Julián Carrillo); investigation, O.P.-S.; resources, E.B. and J.B.; data curation, J.C. (Joel Carvajal); writing—original draft preparation, O.P.-S. and E.B.; writing—review and editing, E.B., J.B. and H.L.; visualization, A.R.-C. and J.T.; supervision, E.B.; project administration, E.B. and J.B. All authors have read and agreed to the published version of the manuscript.

Funding

This research was funded by Consejo Nacional de Humanidades under grant number Ciencia de Frontera CF-2023-G-1636 and Ciencia Básica 287103.

Institutional Review Board Statement

Not applicable.

Informed Consent Statement

Not applicable.

Data Availability Statement

The data used to support the findings of this study are available from the corresponding author upon request.

Acknowledgments

This research was developed thanks to economic support provided by the Consejo Nacional de Humanidades, Ciencias y Tecnologías (CONAHCYT) under Grant Ciencia de Frontera CF-2023-G-1636 and Ciencia Básica 287103. Finally, the support received from the Autonomous University of Sinaloa within the PROFAPI project is appreciated.

Conflicts of Interest

The authors declare no conflicts of interest.

Appendix A

Dataset of statistical parameters about maximum interstory drift.
Period of VibrationINpMeanStd. Desv.Median
0.90.10.001985570.000189300.00195350
0.90.20.003971030.000378380.00390650
0.90.30.005936300.000541590.00585900
0.90.40.008033730.000755500.00800800
0.90.50.011783000.002466310.01066000
0.90.60.021342670.010511870.01768500
0.90.70.034423000.017132270.03376500
0.90.80.047904330.023677040.04695000
0.90.90.061155330.026828960.05965500
0.910.076896670.032244950.07299000
0.91.10.091947330.036216390.09150000
0.91.20.105242330.038407790.10685000
0.91.30.122482000.044505850.11635000
0.91.40.133622670.043668430.13725000
0.91.50.151696000.047907690.15115000
1.20.10.001758700.000250720.00167250
1.20.20.003517470.000501320.00334550
1.20.30.005275870.000761450.00501850
1.20.40.007375230.001064500.00700900
1.20.50.011903800.001706330.01175000
1.20.60.020213670.005896940.01848500
1.20.70.028313670.008469090.02597000
1.20.80.035561670.009103760.03676500
1.20.90.042342330.009593510.04308000
1.210.048141330.010669810.04855000
1.21.10.053453330.011692600.05307000
1.21.20.058718330.012247320.05751000
1.21.30.064139670.013096620.06248500
1.21.40.070166000.014954240.06851000
1.21.50.075931000.016597350.07410000
1.380.10.001775800.000289730.00166350
1.380.20.003551830.000579540.00332750
1.380.30.005379030.000964850.00499100
1.380.40.007409170.001391750.00692350
1.380.50.010082770.001370130.00980850
1.380.60.015000670.002268930.01464000
1.380.70.021349000.004941910.02101000
1.380.80.027098330.005351090.02647500
1.380.90.032233000.005705920.03082000
1.3810.037039000.006290380.03550000
1.381.10.041438330.006759830.03908000
1.381.20.045650000.007248870.04377500
1.381.30.049426670.007680990.04884500
1.381.40.053549000.008402270.05392500
1.381.50.057705000.009432610.05799000
1.530.10.001892300.000290650.00188800
1.530.20.003784400.000581390.00377600
1.530.30.005708430.000919090.00566400
1.530.40.007786400.001127390.00792050
1.530.50.011704400.001809790.01182500
1.530.60.017977330.003120060.01780000
1.530.70.022674330.003167260.02170000
1.530.80.026718000.003758870.02544500
1.530.90.030169670.004546440.02883500
1.5310.033760000.004939500.03244500
1.531.10.037075670.005380010.03624500
1.531.20.040229670.005823090.03930000
1.531.30.043235330.006298720.04211000
1.531.40.046405670.006903430.04497500
1.531.50.049667000.007613940.04785500

References

  1. Wieland, M. Safety Aspects of Sustainable Storage Dams and Earthquake Safety of Existing Dams. Engineering 2016, 2, 325–331. [Google Scholar] [CrossRef]
  2. Rezvani Sharif, M.; Sadri Tabaei Zavareh, S.M.R. Predictive Modeling of the Lateral Drift Capacity of Circular Reinforced Concrete Columns Using an Evolutionary Algorithm. Eng. Comput. 2019, 37, 1579–1591. [Google Scholar] [CrossRef]
  3. Takagi, J.; Wada, A. Higher Performance Seismic Structures for Advanced Cities and Societies. Engineering 2019, 5, 184–189. [Google Scholar] [CrossRef]
  4. Fujino, Y.; Siringoringo, D.M.; Ikeda, Y.; Nagayama, T.; Mizutani, T. Research and Implementations of Structural Monitoring for Bridges and Buildings in Japan. Engineering 2019, 5, 1093–1119. [Google Scholar] [CrossRef]
  5. Nishiyama, I.; Kuramoto, H.; Noguchi, H. Guidelines: Seismic Design of Composite Reinforced Concrete and Steel Buildings. J. Struct. Eng. 2004, 130, 336–342. [Google Scholar] [CrossRef]
  6. Yang, H.; Feng, Y.; Wang, H.; Jeremić, B. Energy Dissipation Analysis for Inelastic Reinforced Concrete and Steel Beam-Columns. Eng. Struct. 2019, 197, 109431. [Google Scholar] [CrossRef]
  7. Xiao, J.; Zhang, K.; Ding, T.; Zhang, Q.; Xiao, X. Fundamental Issues towards Unified Design Theory of Recycled and Natural Aggregate Concrete Components. Engineering 2023, 29, 188–197. [Google Scholar] [CrossRef]
  8. Qiu, C.; Du, X.; Teng, J.; Li, Z.; Chen, C. Seismic Design Method for Multi-Story SMA Braced Frames Based on Inelastic Displacement Ratio. Soil. Dyn. Earthq. Eng. 2021, 147, 106794. [Google Scholar] [CrossRef]
  9. Housner, G.W. Spectrum Intensities of Strong-Motion Earthquakes. In Proceedings of the Symposium on Earthquake and Blast Effects on Structures, Los Angeles, CA, USA, June 1952; EERI: Oakland, CA, USA, 1952. [Google Scholar]
  10. Arias, A. A Measure of Earthquake Intensity. In Seismic Design for Nuclear Power Plants; MIT Press: Cambridge, MA, USA, 1970; ISBN 9780262080415. [Google Scholar]
  11. Padgett, J.E.; Nielson, B.G.; DesRoches, R. Selection of Optimal Intensity Measures in Probabilistic Seismic Demand Models of Highway Bridge Portfolios. Earthq. Eng. Struct. Dyn. 2008, 37, 711–725. [Google Scholar] [CrossRef]
  12. Kazantzi, A.K.; Vamvatsikos, D. Intensity Measure Selection for Vulnerability Studies of Building Classes. Earthq. Eng. Struct. Dyn. 2015, 44, 2677–2694. [Google Scholar] [CrossRef]
  13. Bojórquez, E.; Baca, V.; Bojórquez, J.; Reyes-Salazar, A.; Chávez, R.; Barraza, M. A Simplified Procedure to Estimate Peak Drift Demands for Mid-Rise Steel and R/C Frames under Narrow-Band Motions in Terms of the Spectral-Shape-Based Intensity Measure INp. Eng. Struct. 2017, 150, 334–345. [Google Scholar] [CrossRef]
  14. Torres, J.I.; Bojórquez, E.; Chavez, R.; Bojórquez, J.; Reyes-Salazar, A.; Baca, V.; Valenzuela, F.; Carvajal, J.; Payán, O.; Leal, M. Peak Floor Acceleration Prediction Using Spectral Shape: Comparison between Acceleration and Velocity. Earthq. Struct. 2021, 21, 551–562. [Google Scholar] [CrossRef]
  15. Tothong, P.; Luco, N. Probabilistic Seismic Demand Analysis Using Advanced Ground Motion Intensity Measures. Earthq. Eng. Struct. Dyn. 2007, 36, 1837–1860. [Google Scholar] [CrossRef]
  16. Mehanny, S.S.F. A Broad-Range Power-Law Form Scalar-Based Seismic Intensity Measure. Eng. Struct. 2009, 31, 1354–1368. [Google Scholar] [CrossRef]
  17. Bojórquez, E.; Iervolino, I. Spectral Shape Proxies and Nonlinear Structural Response. Soil. Dyn. Earthq. Eng. 2011, 31, 996–1008. [Google Scholar] [CrossRef]
  18. Buratti, N. A Comparison of the Performances of Various Ground–Motion Intensity Measures. In Proceedings of the 15th World Conference on Earthquake Engineering, Lisbon, Portugal, 24–28 September 2012. [Google Scholar]
  19. Cai, J.; Bu, G.; Yang, C.; Chen, Q.; Zuo, Z. Calculation Methods for Inter-Story Drifts of Building Structures. Adv. Struct. Eng. 2014, 17, 735–745. [Google Scholar] [CrossRef]
  20. Lee, H.J.; Aschheim, M.A.; Kuchma, D. Interstory Drift Estimates for Low-Rise Flexible Diaphragm Structures. Eng. Struct. 2007, 29, 1375–1397. [Google Scholar] [CrossRef]
  21. Ruiz-García, J.; Miranda, E. Probabilistic Estimation of Residual Drift Demands for Seismic Assessment of Multi-Story Framed Buildings. Eng. Struct. 2010, 32, 11–20. [Google Scholar] [CrossRef]
  22. VANLUCHENE, R.D.; SUN, R. Neural Networks in Structural Engineering. Comput.-Aided Civ. Infrastruct. Eng. 1990, 5, 207–215. [Google Scholar] [CrossRef]
  23. Adeli, H. Neural Networks in Civil Engineering: 1989–2000. Comput.-Aided Civ. Infrastruct. Eng. 2001, 16, 126–142. [Google Scholar] [CrossRef]
  24. Rafiq, M.Y.; Bugmann, G.; Easterbrook, D.J. Neural Network Design for Engineering Applications. Comput. Struct. 2001, 79, 1541–1552. [Google Scholar] [CrossRef]
  25. Barraza, M.; Bojórquez, E.; Fernández-González, E.; Reyes-Salazar, A. Multi-Objective Optimization of Structural Steel Buildings under Earthquake Loads Using NSGA-II and PSO. KSCE J. Civ. Eng. 2017, 21, 488–500. [Google Scholar] [CrossRef]
  26. Leyva, H.; Bojórquez, J.; Bojórquez, E.; Reyes-Salazar, A.; Carrillo, J.; López-Almansa, F. Multi-Objective Seismic Design of BRBs-Reinforced Concrete Buildings Using Genetic Algorithms. Struct. Multidiscip. Optim. 2021, 64, 2097–2112. [Google Scholar] [CrossRef]
  27. Reyes, H.E.; Bojórquez, J.; Cruz-Reyes, L.; Ruiz, S.E.; Reyes-Salazar, A.; Bojórquez, E.; Barraza, M.; Formisano, A.; Payán, O.; Torres, J.R. Development an Artificial Neural Network Model for Estimating Cost of R/C Building by Using Life-Cycle Cost Function: Case Study of Mexico City. Adv. Civ. Eng. 2022, 2022, 7418230. [Google Scholar] [CrossRef]
  28. Zhou, Y.; Meng, S.; Lou, Y.; Kong, Q. Physics-Informed Deep Learning-Based Real-Time Structural Response Prediction Method. Engineering 2024, 35, 140–157. [Google Scholar] [CrossRef]
  29. Marcelin, J.L. Evolutionary Optimisation of Mechanical Structures: Towards an Integrated Optimisation. Eng. Comput. 1999, 15, 326–333. [Google Scholar] [CrossRef]
  30. Spencer, B.F.; Hoskere, V.; Narazaki, Y. Advances in Computer Vision-Based Civil Infrastructure Inspection and Monitoring. Engineering 2019, 5, 199–222. [Google Scholar] [CrossRef]
  31. Rao, M.A.; Srinivas, J. Torsional Vibrations of Pre-Twisted Blades Using Artificial Neural Network Technology. Eng. Comput. 2000, 16, 10–15. [Google Scholar] [CrossRef]
  32. Lecun, Y.; Bengio, Y.; Hinton, G. Deep Learning. Nature 2015, 521, 436–444. [Google Scholar] [CrossRef]
  33. Seo, J.; Kapania, R.K. Topology Optimization with Advanced CNN Using Mapped Physics-Based Data. Struct. Multidiscip. Optim. 2023, 66, 21. [Google Scholar] [CrossRef]
  34. Mohammed Sahib, M.; Kovács, G. Multi-Objective Optimization of Composite Sandwich Structures Using Artificial Neural Networks and Genetic Algorithm. Results Eng. 2024, 21, 101937. [Google Scholar] [CrossRef]
  35. Kim, K.G. Book Review: Deep Learning. Health Inf. Res. 2016, 22, 351–354. [Google Scholar] [CrossRef]
  36. Harrou, F.; Dairi, A.; Dorbane, A.; Sun, Y. Energy Consumption Prediction in Water Treatment Plants Using Deep Learning with Data Augmentation. Results Eng. 2023, 20, 101428. [Google Scholar] [CrossRef]
  37. Armghan, A.; Logeshwaran, J.; Sutharshan, S.M.; Aliqab, K.; Alsharari, M.; Patel, S.K. Design of Biosensor for Synchronized Identification of Diabetes Using Deep Learning. Results Eng. 2023, 20, 101382. [Google Scholar] [CrossRef]
  38. Payán-Serrano, O.; Bojórquez, E.; Bojórquez, J.; Chávez, R.; Reyes-Salazar, A.; Barraza, M.; López-Barraza, A.; Rodríguez-Lozoya, H.; Corona, E. Prediction of Maximum Story Drift of MDOF Structures under Simulated Wind Loads Using Artificial Neural Networks. Appl. Sci. 2017, 7, 563. [Google Scholar] [CrossRef]
  39. Morfidis, K.; Kostinakis, K. Approaches to the rapid seismic damage prediction of r/c buildings using artificial neural networks. Eng. Struct. 2018, 165, 120–141. [Google Scholar] [CrossRef]
  40. Mishra, M.; Bhatia, A.S.; Maity, D. A Comparative Study of Regression, Neural Network and Neuro-Fuzzy Inference System for Determining the Compressive Strength of Brick–Mortar Masonry by Fusing Nondestructive Testing Data. Eng. Comput. 2019, 37, 77–91. [Google Scholar] [CrossRef]
  41. Raza, A.; Adnan Raheel Shah, S.; ul Haq, F.; Arshad, H.; Safdar Raza, S.; Farhan, M.; Waseem, M. Prediction of Axial Load-Carrying Capacity of GFRP-Reinforced Concrete Columns through Artificial Neural Networks. Structures 2020, 28, 1557–1571. [Google Scholar] [CrossRef]
  42. Yuan, X.; Zhong, J.; Zhu, Y.; Chen, G.; Dagli, C. Post-earthquake regional structural damage evaluation based on artificial neural networks considering variant structural properties. Structures 2023, 52, 971–982. [Google Scholar] [CrossRef]
  43. Hassoun, M.H. Fundamentals of Artificial Neural Networks; The MIT Press: Cambridge, MA, USA, 2005. [Google Scholar] [CrossRef]
  44. Yegnanarayana, B. Artificial Neural Networks for Pattern Recognition. Sadhana 1994, 19, 189–238. [Google Scholar] [CrossRef]
  45. Morelli, M.; Hauth, J.; Guardone, A.; Huan, X.; Zhou, B.Y. A Rotorcraft In-Flight Ice Detection Framework Using Computational Aeroacoustics and Bayesian Neural Networks. Struct. Multidiscip. Optim. 2023, 66, 197. [Google Scholar] [CrossRef]
  46. Vamvatsikos, D.; Allin Cornell, C. Incremental Dynamic Analysis. Earthq. Eng. Struct. Dyn. 2002, 31, 491–514. [Google Scholar] [CrossRef]
  47. Kingma, D.P.; Ba, J.L. Adam: A Method for Stochastic Optimization. In Proceedings of the 3rd International Conference on Learning Representations, ICLR 2015—Conference Track Proceedings, San Diego, CA, USA, 7–9 May 2015. [Google Scholar]
  48. Panchal, G.; Ganatra, A.; Shah, P.; Panchal, D. Determination of Over-Learning and Over-Fitting Problem in Back Propagation Neurl Network. Int. J. Soft Comput. 2011, 2, 40–51. [Google Scholar] [CrossRef]
  49. Koziel, S.; Calik, N.; Mahouti, P.; Belen, M. Accurate Modeling of Antenna Structures by Means of Domain Confinement and Pyramidal Deep Neural Networks. IEEE Trans. Antennas Propag. 2022, 70, 2174–2188. [Google Scholar] [CrossRef]
  50. Browne, M.W. Cross-Validation Methods. J. Math. Psychol. 2000, 44, 108–132. [Google Scholar] [CrossRef] [PubMed]
  51. Dabiri, H.; Rahimzadeh, K.; Kheyroddin, A. A Comparison of Machine Learning- and Regression-Based Models for Predicting Ductility Ratio of RC Beam-Column Joints. Structures 2022, 37, 69–81. [Google Scholar] [CrossRef]
  52. Park, R. Evaluation of Ductility of Structures and Structural Assemblages from Laboratory Testing. Bull. New Zealand Soc. Earthq. Eng. 1989, 22, 155–166. [Google Scholar] [CrossRef]
  53. Moghaddam, H.; Mohammadi, R.K. Ductility Reduction Factor of MDOF Shear-Building Structures. J. Earthq. Eng. 2001, 5, 425–440. [Google Scholar] [CrossRef]
  54. Arslan, M.H. Estimation of Curvature and Displacement Ductility in Reinforced Concrete Buildings. KSCE J. Civ. Eng. 2012, 16, 759–770. [Google Scholar] [CrossRef]
  55. Kunnath, S.K.; Chai, Y.H. Cumulative Damage-Based Inelastic Cyclic Demand Spectrum. Earthq. Eng. Struct. Dyn. 2004, 33, 499–520. [Google Scholar] [CrossRef]
  56. Bojórquez, E.; Terán-Gilmore, A.; Ruiz, S.E.; Reyes-Salazar, A. Evaluation of Structural Reliability of Steel Frames: Interstory Drift versus Plastic Hysteretic Energy. Earthq. Spectra 2011, 27, 661–682. [Google Scholar] [CrossRef]
  57. Zhou, Y.; Song, G.; Tan, P. Hysteretic Energy Demand for Self-Centering SDOF Systems. Soil. Dyn. Earthq. Eng. 2019, 125, 105703. [Google Scholar] [CrossRef]
  58. Bojorquez, E.; Ruiz, S.E.; Teran-Gilmore, A. Reliability-Based Evaluation of Steel Structures Using Energy Concepts. Eng. Struct. 2008, 30, 1745–1759. [Google Scholar] [CrossRef]
  59. Bojórquez, E.; Reyes-Salazar, A.; Terán-Gilmore, A.; Ruiz, S.E. Energy-Based Damage Index for Steel Structures. Steel Compos. Struct. 2010, 10, 331–348. [Google Scholar] [CrossRef]
  60. Song, Z.; Konietzky, H.; Frühwirt, T. Hysteresis Energy-Based Failure Indicators for Concrete and Brittle Rocks under the Condition of Fatigue Loading. Int. J. Fatigue 2018, 114, 298–310. [Google Scholar] [CrossRef]
  61. Qiu, C.; Qi, J.; Chen, C. Energy-Based Seismic Design Methodology of SMABFs Using Hysteretic Energy Spectrum. J. Struct. Eng. 2020, 146, 04019207. [Google Scholar] [CrossRef]
  62. Gentile, R.; Galasso, C. Hysteretic Energy-based State-dependent Fragility for Ground-motion Sequences. Earthq. Eng. Struct. Dyn. 2021, 50, 1187–1203. [Google Scholar] [CrossRef]
  63. Gholami, N.; Garivani, S.; Askariani, S.S.; Hajirasouliha, I. Estimation of Hysteretic Energy Distribution for Energy-Based Design of Structures Equipped with Dampers. J. Build. Eng. 2022, 51, 104221. [Google Scholar] [CrossRef]
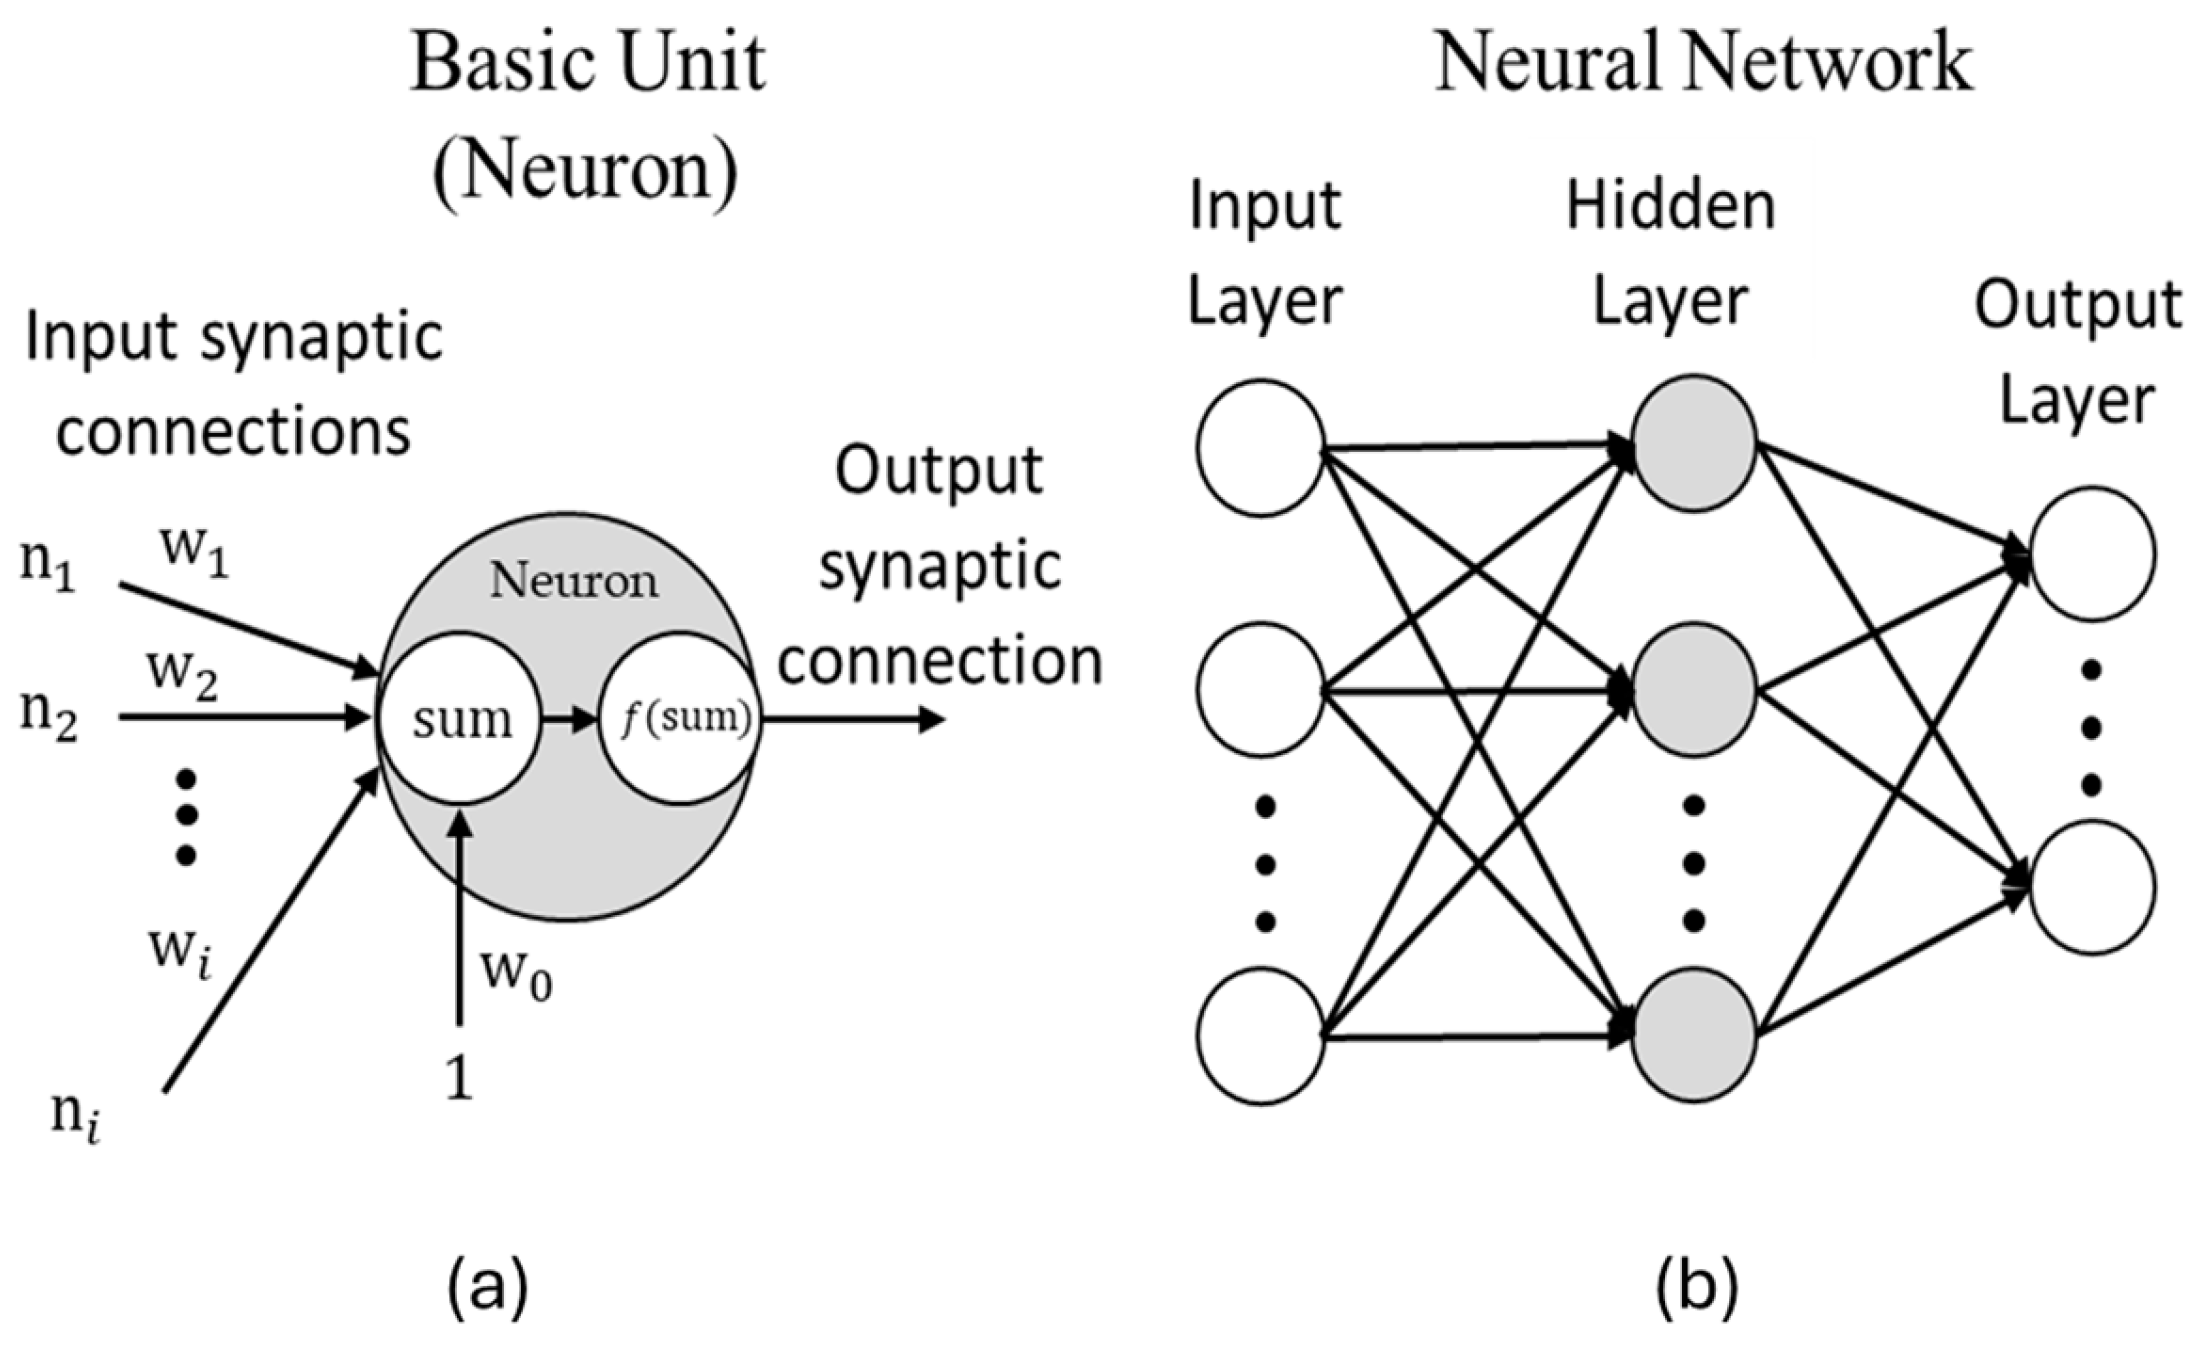
Figure 1. Artificial neural network: (a) internal neural process; (b) typical neural network.
Ai 05 00072 g001
Figure 2. Deep neural network.
Ai 05 00072 g002
Figure 3. Maximum interstory drift using spectral acceleration Sa(T1) for mid-rise buildings with (a) 4 stories; (b) 6 stories; (c) 8 stories; (d) 10 stories.
Ai 05 00072 g003
Figure 4. Maximum interstory drift using the spectral shape INp for mid-rise buildings with (a) 4 stories; (b) 6 stories; (c) 8 stories; (d) 10 stories.
Ai 05 00072 g004
Figure 5. RC frame configuration.
Ai 05 00072 g005
Figure 6. RC beams and columns configuration.
Ai 05 00072 g006
Figure 7. General configuration of deep neural networks to estimate the mean, median, and standard deviation.
Ai 05 00072 g007
Figure 8. Mean, median, and standard deviation of the maximum interstory drift using spectral acceleration Sa(T1) for mid-rise with (a) 4 stories; (b) 6 stories; (c) 8 stories; (d) 10 stories.
Ai 05 00072 g008
Figure 9. Mean, median, and standard deviation of the maximum interstory drift using the spectral shape INp for mid-rise with: (a) 4 stories; (b) 6 stories; (c) 8 stories; (d) 10 stories.
Ai 05 00072 g009
Figure 10. Correlation matrix between input and output variables.
Ai 05 00072 g010
Figure 11. Error behavior due to a neural configuration: (a) [2, 3, 3]; (b) [2, 10, 7, 3]; (c) [2, 15, 9, 5, 3]; (d) [2, 15, 10, 7, 5, 3]; (e) [2, 15, 11, 9, 7, 5, 3].
Ai 05 00072 g011
Figure 12. Relations between target values and output values due to a neural configuration: (a) [2, 3, 3]; (b) [2, 10, 7, 3]; (c) [2, 15, 10, 7, 5, 3].
Ai 05 00072 g012
Figure 13. Taylor diagram of models to predict statistics of the interstory drift.
Ai 05 00072 g013
Figure 14. 3D view of the nine-story reinforced concrete building with BRBs.
Ai 05 00072 g014
Figure 15. Seismic performance of the nine-story reinforced concrete building with BRBs: (a) Max. interstory drift and mean values via incremental dynamic analysis; (b) neural network predictions vs. mean values of the incremental dynamic analysis.
Ai 05 00072 g015
Figure 16. Characteristics of the SDOF structural models.
Ai 05 00072 g016
Figure 17. Ductility demands obtained via incremental dynamic analysis.
Ai 05 00072 g017
Figure 18. Normalized hysteretic energy demands obtained via incremental dynamic analysis.
Ai 05 00072 g018
Figure 19. Deep neural networks to estimate the mean, median, and standard deviation of ductility and normalized hysteric energy.
Ai 05 00072 g019
Figure 20. Taylor diagram of models to predict statistics of ductility and hysteretic energy.
Ai 05 00072 g020
Table 1. Earthquake ground motions.
RecordMagnitudePGV [cm/s]PGA [cm/s2]DateStation
18.159.5178.019 September 1985SCT
27.614.648.721 September 1985Tlahuac deportivo
36.915.645.025 April 1989Alameda
46.921.568.025 April 1989Garibaldi
56.912.844.925 April 1989SCT
66.915.345.125 April 1989Sector Popular
76.917.352.925 April 1989Tlatelolco TL08
86.917.349.525 April 1989Tlatelolco TL55
97.312.239.314 April 1995Alameda
107.310.639.114 September 1995Garibaldi
117.39.6230.114 September 1995Liconsa
127.39.3733.514 September 1995Plutarco Elías Calles
137.312.534.314 September 1995S. Popular
147.37.827.514 September 1995Tlatelolco TL08
157.37.427.214 September 1995Tlatelolco TL55
167.54.614.49 October 1995Cibeles
177.55.115.89 October 1995CU Juárez
187.54.815.79 October 1995C. urbano P Juárez
197.58.624.99 October 1995Córdoba
207.56.317.69 October 1995Liverpool
217.57.919.29 October 1995Plutarco Elías Calles
227.55.313.79 October 1995S. Popular
237.57.1817.99 October 1995V. Gómez
246.95.916.211 January 1997CU Juárez
256.95.516.311 January 1997C. urbano P Juárez
266.96.918.711 January 1997García Campillo
276.98.622.211 January 1997Plutarco Elías Calles
286.97.7621.011 January 199710 Roma A
296.97.120.411 January 199711 Roma B
306.97.216.011 January 1997Tlatelolco TL08
Table 2. Characteristics of RC frame models.
Frame IDNumber of
Stories
Period of Vibration (s)
T1T2
F440.900.31
F661.200.39
F881.380.44
F10101.530.48
Table 3. Characteristics of RC beams and columns in cm or cm2.
Element
ID_Frame(Story Loc)
CharacteristicF4F6F8F10
Beam 1
F4(1–2)
F6(1–3)
F8(1–3)
F10(1–4)
B25253535
H55608090
As_sup12.719.147.756.2
As_inf7.613.238.947.9
spacing_ext15151510
spacing_cen25251510
Beam 2
F4(3–4)
F6(4–6)
F8(4–6)
F10(5–7)
B20203535
H50557075
As_sup9.513.839.547.3
As_inf4.47.827.237.6
spacing_ext15151510
spacing_cen25252015
Beam 3
F8(7–8)
F10(8–10)
B 3035
H 5565
As_sup 22.627.3
As_inf 1015.2
spacing_ext 1515
spacing_cen 2525
Column 1
F4(1–2)
F6(1–3)
F8(1–3)
B506095110
H506095110
As64.3995.89190.25242.29
Spacing15101010
Column 2
F4(3–4)
F6(4–6)
F8(4–6)
B405085100
H405085100
As45.1949.1272.25100
Spacing10151515
Column 3
F8(7–8)
B 7590
H 7590
As 56.2581
spacing 1515
Table 4. Results of the training process to predict statistics of the interstory drift.
Neurons ConfigurationHidden LayersTraining DataEvaluation DataTraining IterationsMSE Training DataR2 Training DataMSE Evaluation DataR2 Evaluation Data
[2, 3, 3]170%30%50000.005380.750.008320.65
[2, 6, 3]170%30%50000.002840.770.003500.76
[2, 12, 3]170%30%50000.002620.780.003040.76
[2, 10, 7, 3]270%30%50000.000930.810.001200.80
[2, 15, 9, 5, 3]370%30%50000.000620.930.000840.85
[2, 15, 10, 7, 5, 3]470%30%50000.000360.950.000530.94
[2, 15, 11, 9, 7, 5, 3]570%30%50000.000160.980.001450.79
Table 5. Cross-validation for [2, 15, 10, 7, 5, 3].
Training IDMSE Training DataMSE Evaluation Data
10.00024500.0002520
20.00021450.0002235
30.00023200.0002420
40.00022140.0002315
50.00023510.0002452
60.00021700.0002260
70.00024430.0002533
80.00022460.0002335
90.00023300.0002410
100.00023020.0002413
Table 6. Main geometric characteristics from designed model.
ModelNumber of FloorsBays Dir. XBays Dir. YInterstory Height
(m)
Bays Length
(m)
RC9-BRB9333.57
Table 7. Main properties of the nine RC-BRB building model (dimensions in cms).
Model PropertyRC9-BRB
Column160x60
Column245x45
Column335x35
Beam130x55
Beam230x60
Beam325x50
BRB36
Cy0.45
Period (s)0.87
Table 8. Results of training process to predict statistics of ductility and hysteretic energy.
Neurons ConfigurationHidden LayersEvaluation DataTraining IterationsMSE Training DataR2 Training DataMSE Evaluation DataR2 Evaluation Data
[3, 6]030%50000.1260.820.1340.80
[3, 10, 6]130%50000.0900.850.1150.82
[3, 15, 10, 3]230%50000.0850.870.0970.83
[3, 20, 15, 10, 7, 5, 3]330%50000.0680.890.0900.85
[3, 25, 20, 15, 10, 7, 5, 3]430%50000.0580.910.0600.91
[3, 30, 25, 20, 15, 10, 7, 5, 3]530%50000.0490.920.0690.89
Disclaimer/Publisher’s Note: The statements, opinions and data contained in all publications are solely those of the individual author(s) and contributor(s) and not of MDPI and/or the editor(s). MDPI and/or the editor(s) disclaim responsibility for any injury to people or property resulting from any ideas, methods, instructions or products referred to in the content.