Article

The Eye in the Sky—A Method to Obtain On-Field Locations of Australian Rules Football Athletes

by
Zachery Born
1,
Marion Mundt
1,*,
Ajmal Mian
2,
Jason Weber
1,3 and
Jacqueline Alderson
1
1
UWA Tech and Policy Lab, The University of Western Australia, Crawley 6009, Australia
2
School of Computer Science, The University of Western Australia, Crawley 6009, Australia
3
SpeedSig, Perth 6000, Australia
*
Author to whom correspondence should be addressed.
AI 2024, 5(2), 733-745; https://doi.org/10.3390/ai5020038
Submission received: 12 April 2024 / Revised: 10 May 2024 / Accepted: 13 May 2024 / Published: 16 May 2024
(This article belongs to the Special Issue Artificial Intelligence-Based Image Processing and Computer Vision)

Abstract

:
The ability to overcome an opposition in team sports is reliant upon an understanding of the tactical behaviour of the opposing team members. Recent research is limited to a performance analysts’ own playing team members, as the required opposing team athletes’ geolocation (GPS) data are unavailable. However, in professional Australian rules Football (AF), animations of athlete GPS data from all teams are commercially available. The purpose of this technical study was to obtain the on-field location of AF athletes from animations of the 2019 Australian Football League season to enable the examination of the tactical behaviour of any team. The pre-trained object detection model YOLOv4 was fine-tuned to detect players, and a custom convolutional neural network was trained to track numbers in the animations. The object detection and the athlete tracking achieved an accuracy of 0.94 and 0.98, respectively. Subsequent scaling and translation coefficients were determined through solving an optimisation problem to transform the pixel coordinate positions of a tracked player number to field-relative Cartesian coordinates. The derived equations achieved an average Euclidean distance from the athletes’ raw GPS data of 2.63 m. The proposed athlete detection and tracking approach is a novel methodology to obtain the on-field positions of AF athletes in the absence of direct measures, which may be used for the analysis of opposition collective team behaviour and in the development of interactive play sketching AF tools.

1. Introduction

Performance analysts in professional sports teams are increasingly required to analyse large sets of athlete data to derive insights that result in a competitive advantage over the opposition [1]. The in-depth analysis of team sports is on the rise due to advancements in sensor technology and computing power [2,3,4]. The first step of all analyses is the accurate tracking of players on the field. This can be achieved by sensor data such as GPS, LPS, or IMUs, or using video [3]. The notion of tracking data refers to spatiotemporal data describing ball and/or player positions during a sports event [5]. The use of easy-to-access video data to derive 2D spatiotemporal data is increasingly popular. For this purpose, computer vision methods have been applied in multiple sports, with the majority of applications in soccer and basketball [2]. Using solely video data, researchers and sport professionals aim to better understand tactical behaviour and interactions of a team or individual [5,6] or to support decision-making pertaining to performance and injury risk [4].
For meaningful outcomes, it is important to consider the demands and constraints of specific team sports [4]. Australian rules Football (AF) provides challenges that cannot be found in more frequently investigated team sports like soccer and basketball: in AF, 36 players are on a field that is not consistent in size across different stadiums, which is a unique constraint of the sport. The dimensions of fields used within the professional Australian Football League (AFL) vary from 175 m in length and 145 m in width (University of Tasmania Stadium) to 155 m by 136 m (Sydney Cricket Ground). The average length and width of AFL grounds are 163.6 ± 5.9 m and 132.1 ± 6.9 m, respectively [4]. To provide player location information, all players are equipped with a commercial GPS unit, but professional teams can only access the GPS data of their own team, while limited or no information on any of the opposition AF teams is accessible. Therefore, current state-of-the-art tactical analysis cannot be performed easily, since the location of the opposition AF team is unknown. Consequently, despite the ubiquity of GPS data, the analysis of opposition collective behaviour in AF is currently restricted to conventional 2D video analysis, a manual and time-consuming process. Therefore, computer vision technology presents an exciting opportunity to overcome this issue in AF [7,8,9].
The major challenges of vision-based methods are their dependency on the environment—they are susceptible to frequent changes in athlete velocities and occlusions in congested play, changes in field lighting, and similarities in the appearances of teammates [2,3]. Further, the unique challenge of varying field sizes in combination with the large field size requiring multiple cameras makes the use of conventional player tracking methods impossible [4]. Varying pre-processing steps are therefore necessary to successfully track athletes [10,11]. Recommended techniques include the following: (1) the removal of shadows to combat changes in lighting conditions [12]; (2) the use of multiple camera set-ups to ensure all athletes are in the field of view during filming [13]; (3) the use of pre-trained object detection models [14,15,16]; (4) and jersey number recognition models for the detection and identification of individual athletes [17].
Two computer vision-based methods regularly used to obtain on-field athlete locations are detection embedded tracking and tracking by detection [11]. The detection of athletes is part of the tracking pipeline in detection embedded tracking [7,18,19], considered as a costly manual method when compared with modern deep learning implementations [8,20]. The tracking process begins by extracting the playing field area using a combination of basic computer vision techniques, such as background subtraction, Canny edge detection, and contour extraction [7,8,21] to ensure that the subsequent feature extraction of the tracking subjects (usually colour, shape, and trajectory features) is free from variations in the playing field appearance and noise from spectators and advertisement banners. One example of this approach is in tracking athletes in soccer across video frames using Haar-like features [19], defined as differences in the summed pixel intensities of various rectangular regions across the tracking subjects [22]. A more recent example built upon this approach is using particle filters as the feature extraction method, which considers differences in pixel intensities between smaller regions in comparison to Haar-like features [23]. Blob detection [24,25], Otsu detectors [12], and motion vectors [26] are also commonly used feature extraction methods in detection embedded tracking. Athletes are tracked by associating similar features across frames, such as edge detection [12], three-dimensional topographic features [25], and Efficient Convolution Operator (ECO) tracking algorithms [27,28].
Tracking by detection differs from the aforementioned approaches in that it first detects the athletes in the input image prior to passing detections to stand-alone object trackers [14,15]. This approach results in improved accuracy as the athlete appearances and locations are known prior to the application of the tracking algorithm. However, the accuracy of the stand-alone tracking methods are heavily dependent on the accuracy of the detector, meaning it is extremely important to use an object detector that has been optimised for the desired task to obtain the best tracking results. Deep learning techniques based on convolutional neural networks have shown promising results in object detection [29], and pre-trained person detectors are a popular form of object detectors as they avoid the need to train from scratch. For example, Histograms of Oriented Gradients-based person detectors [30], Faster-Recurrent Convolutional Neural Network (a popular state-of-the-art object detector architecture [31]), and a faster state-of-the-art object detector known as You Only Look Once (YOLO) [32,33] that were trained to detect persons in images and videos have all been used to detect athletes in sporting contexts. The detections were subsequently passed into designated tracking algorithms, such as support vector machines, Long Short-Term Memory neural networks [34], and Simple Online and real-time Tracking with a Deep Association Metric (DeepSORT) [35], to track the athletes across video frames [9,15,36].
Previous progress in tracking athlete movements using computer vision-based methods has examined sports where playing field dimensions remain constant across competition arenas. Further, the playing field boundaries in previous research are all rectangular in shape, such as the playing fields and courts encountered in soccer, basketball, and squash [25,37,38,39,40], serving to greatly simplify the technical processes required to determine the field-relative position of detected athletes [4]. A majority of the existing works has also used stationary cameras that minimises, and in some cases eliminates, issues related to a shifting background, appearance distortions, and camera motion that arise from operator pan, tilt, and zoom functions [10]. These challenges are amplified in AF due to the permissible differences in field shapes and sizes across stadiums [41], and the use of multiple, manually operated pan, tilt, and zoom cameras in which the entire playing field will seldom be in full field of view. Frequent occlusions of athletes are also a common feature of video footage due to the full-contact nature of the sport. These limitations severely impact the aforementioned tracking methods’ performance, serving to inhibit the application of athlete detection and tracking methods in AF [4]. One study used a custom person detector and team classifier for detection and then tracked the athletes across frames of broadcast video with a combination of Kalman filters and energy minimisation techniques [42]. The results of this investigation struggled to overcome the changes in lighting conditions and frequent occlusions of athletes.
Athlete tracking data, from body-worn Global Positioning System (GPS) to Local Positioning System (LPS) devices, overcome the aforementioned challenges plaguing video footages of AF matches [43]. However, the raw athlete tracking data from opposition teams are unavailable to professional AF teams, meaning that an alternative method is needed to obtain this information. Unique to professional AF is the commercial availability of animations of athlete GPS data from all professional AF matches, which include opposition teams, by Champion Data, the official statistics provider for the Australian Football League. Athletes are represented as circles from a birds-eye view of a playing field (Figure 1, top right), which simplifies the athlete tracking task because it removes the issues of lighting variations, changes in athlete appearances, ambiguous differences between teammates, occluded areas of the playing field, and camera distortion. Consequently, the animated athlete tracking data provides a unique opportunity for the application of modern tracking-by-detection techniques.
The aim of this technical study is to develop a tracking by detection technique to obtain the field-relative positions of AF athletes using player animations based on GPS signals. We will further establish pixel-to-Cartesian coordinate transformation coefficients unique to each stadium. This novel application of tracking by detection enables tactical analyses of opposition collective team behaviour and the development of interactive play sketching tools in AF.

2. Materials and Methods

Two sources of data obtained from a single professional AF team from the 2019 Australian Football League season, comprising 22 matches, were used for this study. A total of three matches were excluded from analysis due to errors in the raw GPS data. A further two matches were excluded due to errors in the visualisations. Another two matches included only three of the four available quarters due to visualisation errors in the final quarter. Data from a total of 15 full matches, and the first three quarters of an additional two matches were included. An overview of the full workflow of this study is displayed in Figure 1.
The first data source comprised the visual representation of athlete GPS tracking data, which was overlaid onto an image of the playing field it was originally collected from (i.e., the actual ground the match was played on) (Figure 1). A visual animation of the GPS data is produced by animating the output from the GPS sensors (Catapult S5 units) during match play and was provided to the industry research partner, a professional AF team, by the official statistics provider of the Australian Football League, Champion Data. These third-party vendor athlete tracking data animations are commercially available to all professional AF teams. The second source of data was raw GPS data from the GPS sensors worn by a single team of athletes (n = 37) drawn from all matches in the 2019 AF playing season. This study was approved by the Ethics committee from the University of Western Australia (2020/ET000197).

2.1. Athlete Detection

Two-minute samples of the athlete tracking data animations, selected as the first two minutes of match play from a total match time of two hours, were used to train a state-of-the-art multiple-object detection ANN [44] to detect a single team. For this purpose, athlete player animations were manually labelled using an online labelling tool; supervise.ly (accessed on 9 May 2024) [45]. A total of 3476 images resulted in 60,612 labelled athlete examples. This dataset was synthetically enlarged via conventional computer vision cropping and flipping methods [46], resulting in a total of 41,712 images containing 704,987 labelled examples. The data were split into 85% (35,483 images) for training and 15% (6229 images) for testing. The images were resized to 416 × 416 pixels and used to fine-tune a YOLOv4 object detection model (backbone: CSPDarknet53, neck: PANet, head: YOLO Head) that was pre-trained on the MS-COCO dataset and which is publicly available through the Darknet framework [44]. Training took place over 74,000 iterations with a batch size of 64 [33], an initial learning rate of 0.001, a momentum of 0.949, and a decay of 0.0005. The mean average precision (mAP), precision, recall, and F1-scores were reported as standard measures of model accuracy with an Intersection over Union (IoU) threshold of 0.5. The trained model was used to detect athletes in animations across the entire two hours of a match and the centre of the detected bounding box was used to define an athlete’s position in pixel coordinates.

2.2. Athlete Tracking

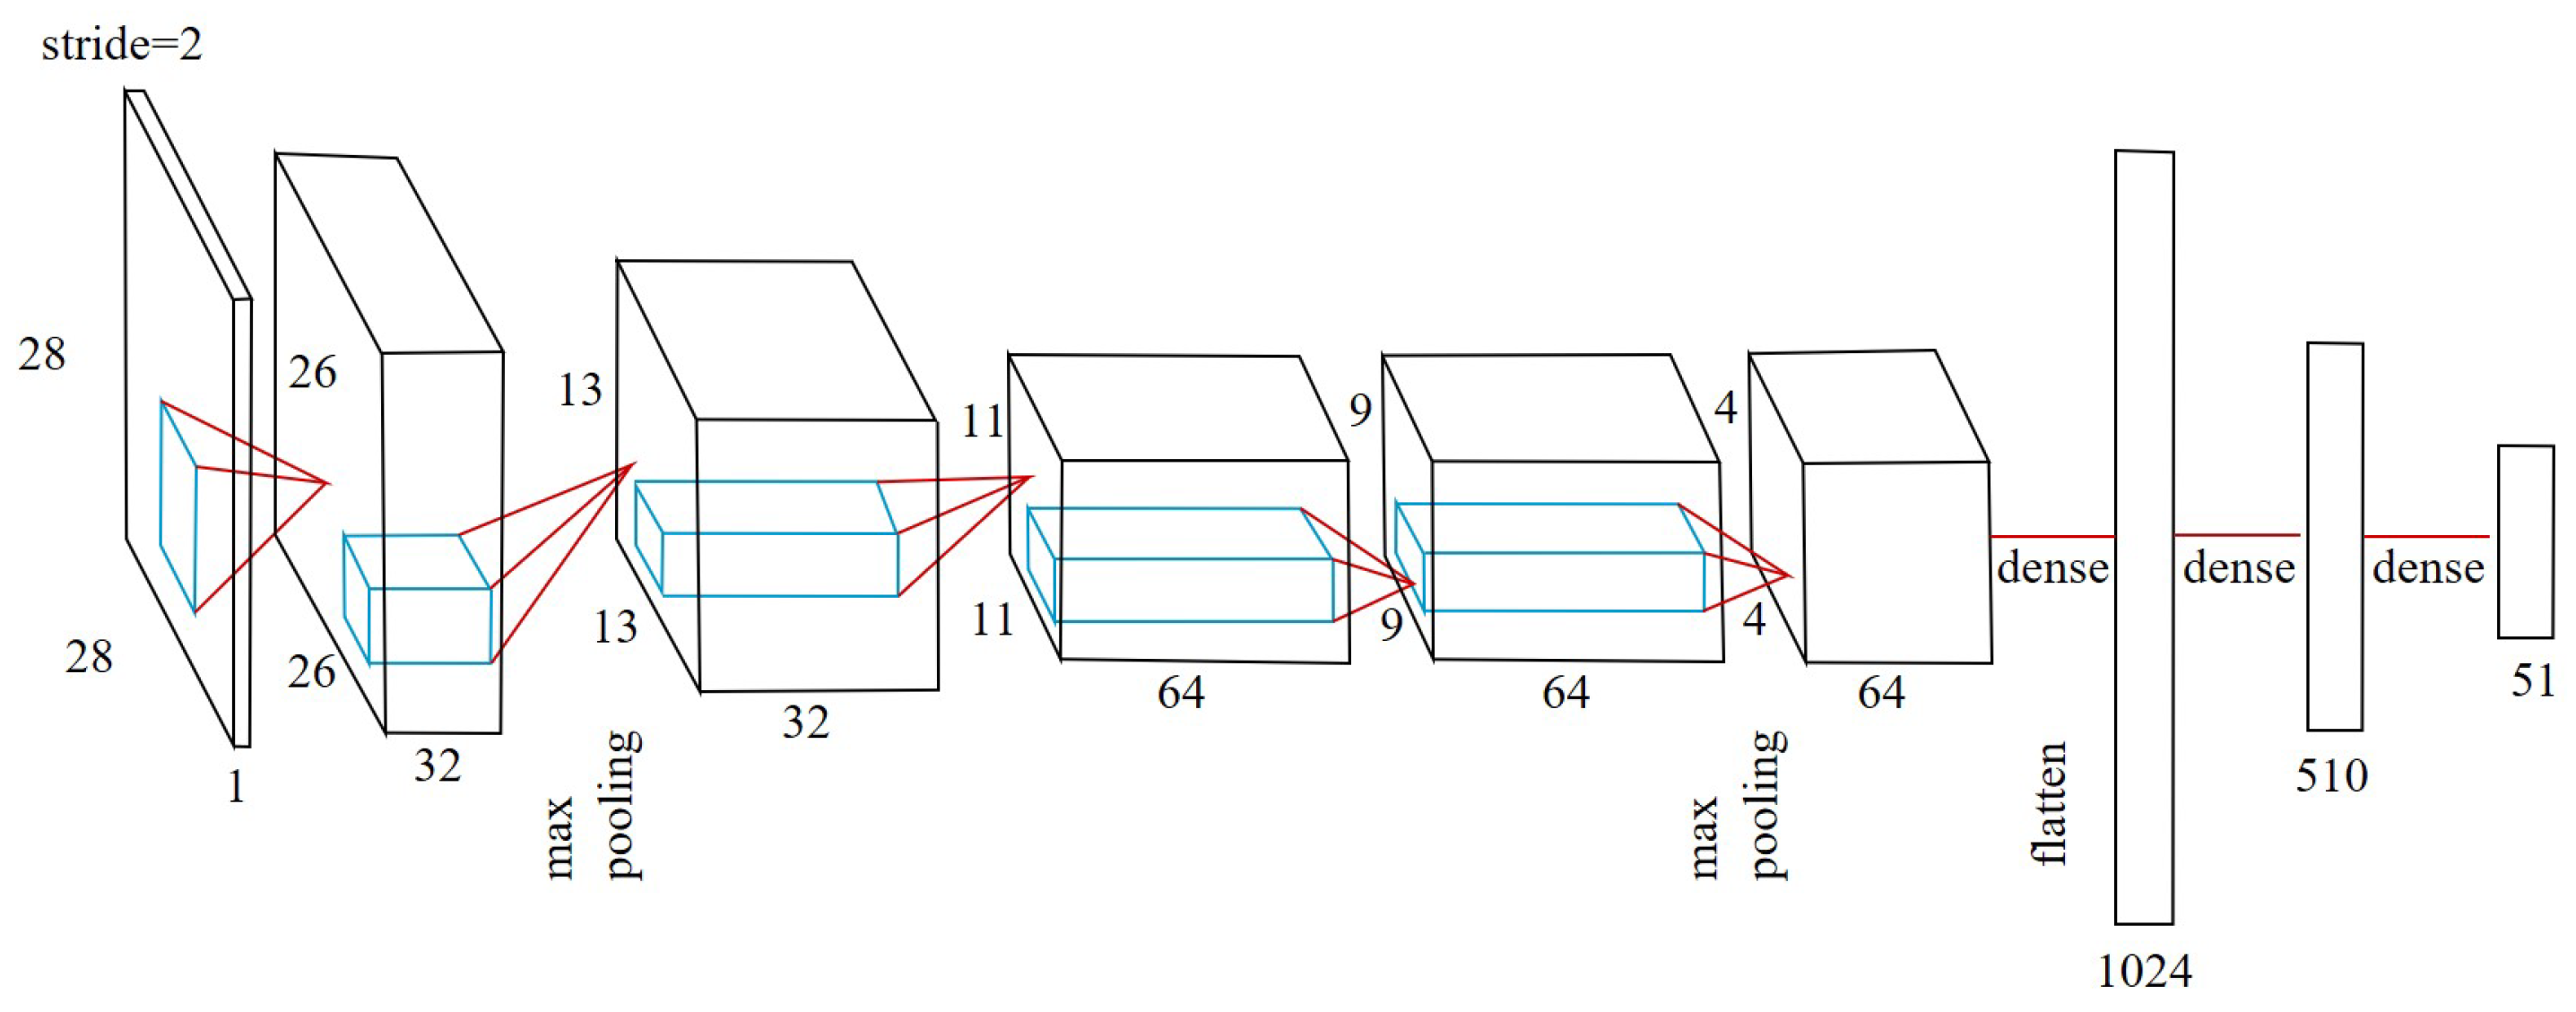
A pre-trained tesseract Optical Character Recognition (OCR) model was initially employed to identify the athlete player numbers present in each detection [47]. However, upon visual inspection, it was clear that the outputs of the OCR model were prone to misidentification. Erroneous outputs were saved, corrected, and labelled, and comprised multiple samples of images ranging from the digit 1 through 50 (i.e., the expected range in athlete player numbers allocated to AF athletes). Data were split into 80% (121,230 samples) for training and 20 % (30,331 samples) for testing. The fully corrected labels were used to train a custom CNN to identify athlete player numbers in the detections (Figure 2), since CNNs have shown their applicability in text recognition in images [48]. After performing a grid search, the convolution kernels were set to a size of 3 × 3 and the pooling kernels were set to a size of 2 × 2. Each layer utilised a rectified linear unit activation, with the exception of the final classification layer, which used a softmax activation. The CNN was trained using a five-fold cross-validation over 10 epochs with a batch size of 32, a learning rate of 0.01, and a momentum of 0.9. A categorical cross-entropy loss function was optimised during training using a stochastic gradient descent training process. Training accuracy and loss were analysed during training, while the accuracy of the trained model was evaluated on the test set. The trained CNN number reader was used to identify the athlete player numbers present in each of the detections with an imposed condition that each number can only occur once per team to reflect the actual use case.

2.3. Conversion to the Field

To transform the athlete tracks in the animations from the image coordinate system to a field-relative Cartesian coordinate system, the raw GPS data and the equivalent track of athletes in the animations were used.

2.3.1. GPS Data

The start and end times of each quarter were recorded for each match and used to extract the GPS information during match play. The GPS data were converted from Earth-centred coordinates, in longitude and latitude, to field-relative Cartesian coordinates, where the origin of the field-relative coordinate system was located at the centre of the field, the X-axis was aligned from field-goal to field-goal, and the Y-axis aligned orthogonal to the X-axis such that the positive direction is away from the team benches (Figure 1, bottom left). The longitudinal and latitudinal coordinates of the centre of all competition fields ( L F , θ F ) were recorded using Google Earth [49]. Equations (1) and (2) were used to convert the longitudinal and latitudinal coordinates of the athletes ( L A t h , θ A t h ) to field-centred Cartesian coordinates ( X A t h , Y A t h ).
X A t h = ( θ F θ A t h ) × A r c ,
Y A t h = ( L A t h L F ) × A r c ,
where A r c represents the arc distance of a degree over the Earth’s surface, as determined by
A r c = 2 π R 360 ,
where R represents the radius of the Earth in meters, which is assumed to be a uniform sphere with a constant radius of 6,378,137 m [50]. The bearing ( ψ ) between the field’s centre ( L F , θ F ) and the position on the fields boundary that corresponds with the maxima of the y-coordinate ( L F m a x , θ F m a x ) was determined for each field using Equation (4):
ψ = arctan ( J , K ) ,
where
J = cos θ F m a x sin Δ L ,
K = cos θ F sin θ F m a x sin θ F cos θ F m a x cos Δ L ,
and
Δ L = L F m a x L F .
The bearing was used to align the field-centred Cartesian coordinates ( X G P S , Y G P S ) with the local coordinate system using the following:
X G P S = X A t h c o s ψ + Y A t h s i n ψ ,
and
Y G P S = X A t h s i n ψ + Y A t h c o s ψ .
The field-relative GPS outputs were down-sampled to 1 Hz.

2.3.2. Animation Data

The athlete track in the animations were down-sampled to 1 Hz for ease of handling prior to a conditional filtering data cleaning process to correct for errors in the detection/tracking. (1) The position of any athlete whose movement was greater than a pre-defined threshold of 55 pixels per frame was replaced with a missing value. This threshold value was determined in initial pilot testing and equates to a speed of 8.2 m/s, which is categorised as a high-intensity sprint that reportedly occurs 22 ± 9 times per match [51]. (2) To avoid large jumps in an athlete’s movements in the instance where the position was missed across multiple consecutive frames, the subsequent detected position was also replaced with a missing value if the athlete’s movement exceeded the pre-defined threshold. (3) An athlete’s position was also removed if the athlete was tracked in less than five times in the subsequent ten frames following a missing value. Linear interpolation was applied to minimise the number of missed positions and was only applied in instances of less than or equal to five consecutive missing values. The athlete tracks and field-relative GPS outputs were temporally aligned for each quarter.
An optimisation problem was established to determine the optimal scaling ( m x , y ) and translation ( c x , y ) coefficients to transform the pixel coordinate outputs (u, v) to field-relative Cartesian coordinates ( X u , Y v ). This step is necessary for every stadium given that the nine standard home stadiums used by AF teams nationally are of varying size. Initial tests revealed a linear relationship defined by the following:
X u = m x u + c x ,
and
Y v = m y v + c y .
The linear equation was optimised using the Levenberg–Marquardt algorithm through a non-linear least squares method [52]. Axis-specific scaling and translation coefficients were determined using separate optimisation problems because the scaling and translation are different for the field’s X and Y axes. The optimisation was undertaken on a quarter-by-quarter basis to account for variations in temporal alignments between the athlete detections and the field-relative GPS. The Euclidean distance d p , q between the transformed object detector output tracks p = ( X u , Y v ) and the GPS Cartesian coordinates q = ( X G P S , Y G P S ) was determined as an accuracy measure if an athlete was present in both GPS and tracking data. The Euclidean distance was defined as
d p , q = i = 1 n q i p i 2 ,
where n is the total number of frames tracked.

3. Results

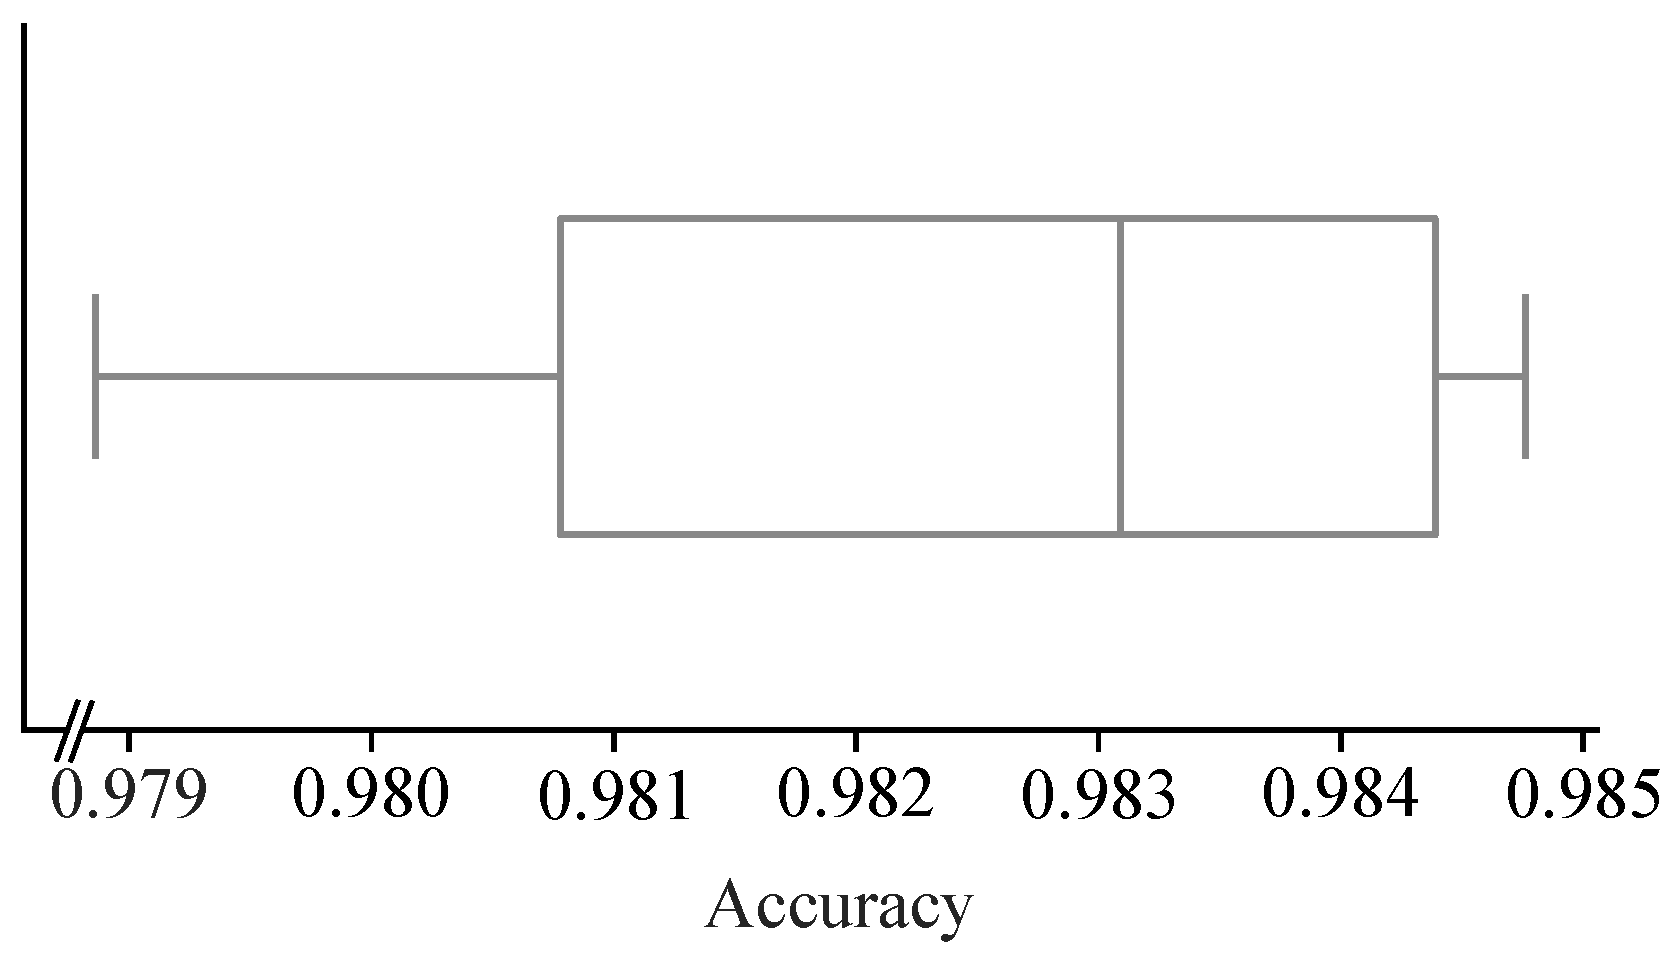
The athlete detector achieved an mAP of 0.94, a precision of 0.95, a recall of 0.97, and an F1-score of 0.96. The custom CNN trained to read the two-digit player numbers achieved an average accuracy of 0.98 ± 2 × 10⁻³ on the test set across the five-folds of training (Figure 3).
Each stadium had a unique pixel-to-Cartesian coordinate transformation equation (see Equations (10) and (11) due to the non-standardised dimensions of an AF field. The stadium-specific scaling and translation coefficients are presented in Table 1.
The median Euclidean distance between the GPS Cartesian coordinates and the transformed pixel coordinates across the entire season was 2.63 m, with lower and upper quartile values of 1.58 m and 4.04 m, respectively (Figure 4).

4. Discussion

The aims of this research were to develop a tracking-by-detection technique to obtain the field-relative positions of AF athletes based on commercially available GPS-based player animations and to establish unique pixel-to-Cartesian coordinate transformation equations for each AF stadium. Due to the vast ground sizes in AF, standard optical tracking methods cannot be applied in AF [3]. Athlete tracking systems have therefore been largely confined to GPS data that are not available for the opposing team. Hence, the novel method using animated GPS data presented in this research is a valuable first step to analyse tactical behaviour of both playing teams.
The high accuracy of the custom athlete detector (mAP 0.94, precision 0.95, recall 0.97, F1-score 0.96) was comparable to previous successful attempts of similar tasks [3,9,14,17,53]. These results support the position that fine-tuning a multiple object detector is sufficient for detecting AF athlete’s in animations. Due to the data volume and time requirements to train a fully customised multiple object detector from scratch, the most appropriate approach was to utilise a pre-trained object detector and fine-tune the model on our custom dataset [16]. As such, the training time was reduced while also achieving favourable results with a reduced data volume. Future work in this area may compare different multiple object detectors, e.g., [54,55,56,57], to improve detection accuracy and reduce the time taken for inference. Additionally, the model developed in this study may be used to generate a larger athlete detection dataset to enable a multiple object detector to be trained from scratch as a means for comparison. The dataset should also be expanded to include multiple teams to increase the applicability of the athlete detector method presented here.
The use of a customised two-digit number reader for identifying the player numbers of each tracked athlete, similar to the approach taken by Yoon and colleagues (2019) [17], was substantively different to previous tracking-by-detection methods used in sports [9,15,36] and achieved a high accuracy of 0.98. Although the combination of using multiple, separate deep learning architectures in the athlete tracking pipeline is not an efficient process, the good performance allowed for the determination of stadium-specific pixel-to-Cartesian coordinate transformation coefficients, which can be used in future research. Previously implemented pre-trained tracking models [15,35] were not suitable for implementation in the current study due to the uniqueness of the dataset (i.e., athletes represented as dots with playing numbers) in comparison to the data used to develop open-source tracking methods (i.e., real-world images of humans). The application of pre-trained tracking models should be explored by using the current method to generate the required data for training custom tracking models specific to AF. In doing so, future work may develop alternative and more streamlined tracking-by-detection methods.
The stadium-grouped coefficients of the pixel-to-Cartesian coordinate transformation equations (Table 1) demonstrated low variability, thereby establishing a stadium-specific method for transforming pixel coordinates to field-relative Cartesian coordinates. The slight differences in the scaling and translation coefficients between stadiums demonstrated the robustness of the approach in accounting for the varying field sizes used in AF [41].
The average positional accuracy of the current approach (2.63 m) is considered high compared to the reported accuracy of commonly used GPS and LPS devices (0.96 ± 0.49 m and 0.23 ± 0.07 m, respectively [43]). However, it was observed that the positional differences between the transformed pixel coordinates and the GPS Cartesian coordinates were systematic in nature (i.e., the magnitude and direction of was consistent for each detected athlete). These observations suggest that the Euclidean distance between the transformed pixel coordinates and GPS Cartesian coordinates can be reduced by fine-tuning the transformation equations. Additionally, it is evident that the novel approach resulted in significant outliers (Figure 4) that were found to be attributable to detection method errors and the subsequent misidentification of athletes. This error may be mitigated by adopting more sophisticated post-processing and filtering protocols, or through the use of custom tracking models. The applied conditional filter removed large outliers but at the same time introduced large gaps without any information. Custom tracking models or filters such as a Kalman filter could be used to minimise large detection gaps and therefore, by extension, the misidentification of athletes [35]. The unequal representation of matches played at each stadium impacted the present work, which can be attributed to idiosyncrasies of the AF playing season draw, which saw the industry research partner not having played at every AF stadium over the course of the 2019 season. This limitation could be addressed by using data from multiple teams and seasons in future work, which, however, is challenging due to the limited data availability of GPS data of different professional AF teams. Therefore, the proposed method offers the opportunity to create a larger dataset that can be used in the future to train more sophisticated and streamlined machine learning models for player detection and tracking based on unique AF animations.
This research is the first step towards an automated tool for the determination of the on-field position of players of both teams in AF. This information will allow sport professionals to better understand tactical behaviour and interactions of a team or individual [5,6] and support decision-making pertaining to performance and injury risk [4].

5. Conclusions

This study introduced a novel method to obtain the on-field location of AF athletes with high accuracy from commercially available animations of athlete’s GPS data, circumventing the pitfalls of video data. The ability to obtain the on-field location of athletes in this manner unlocks the potential of recent analytic advances in the study of collective team behaviour, a research stream currently hampered by the unavailability of opposition team athlete tracking data in AF. The method may easily be extended to obtain the on-field locations of opposition team athletes and for the analysis of opposition team strategies. Athlete tracking data of this type may also be used to develop interactive play sketching tools in AF, which have recently been realised in the context of basketball and soccer [58,59].
Future work should expand on these methods across multiple areas. First, the total volume of data should be increased by including multiple teams from the competition. Second, variations in the proposed CNN architectures should be explored to realise a real-time pipeline. And last, matches played at all stadiums should be included to ensure that the transformation equations developed are applicable for any given competition.

Author Contributions

Conceptualisation, J.W. and J.A.; Data curation, Z.B.; Formal analysis, Z.B.; Funding acquisition, J.A. and J.W.; Investigation, Z.B.; Methodology, Z.B. and A.M.; Project administration, J.A.; Resources, J.W.; Software, Z.B.; Supervision, A.M. and J.A.; Validation, M.M., A.M. and J.A.; Visualisation, Z.B. and M.M.; Writing—original draft, Z.B.; Writing—review and editing, J.A. and M.M. All authors have read and agreed to the published version of the manuscript.

Funding

This research is supported by Fremantle Football Club, an Australian Government Research Training Program (RTP) Scholarship, and the University of Western Australia and UWA Tech & Policy Lab. Support for open-access publishing came from the University of Western Australia.

Institutional Review Board Statement

This study was approved by the ethics committee from the University of Western Australia (2020/ET000197).

Informed Consent Statement

De-identified data collected by GPS units was provided by Fremantle Football Club for research purposes in accordance with player agreements managed by the Club.

Data Availability Statement

The data presented in this study are available on request from the first author due to legal restrictions.

Conflicts of Interest

Jason Weber is employed by the SpeedSig. The authors declare no conflicts of interest.

References

  1. Robertson, S. Man & machine: Adaptive tools for the contemporary performance analyst. J. Sport. Sci. 2020, 38, 2118–2126. [Google Scholar] [CrossRef] [PubMed]
  2. Naik, B.T.; Hashmi, M.F.; Bokde, N.D. A Comprehensive Review of Computer Vision in Sports: Open Issues, Future Trends and Research Directions. Appl. Sci. 2022, 12, 4429. [Google Scholar] [CrossRef]
  3. Rahimian, P.; Toka, L. Optical tracking in team sports: A survey on player and ball tracking methods in soccer and other team sports. J. Quant. Anal. Sport. 2022, 18, 35–57. [Google Scholar] [CrossRef]
  4. Torres-Ronda, L.; Beanland, E.; Whitehead, S.; Sweeting, A.; Clubb, J. Tracking Systems in Team Sports: A Narrative Review of Applications of the Data and Sport Specific Analysis. Sport. Med.-Open 2022, 8, 15. [Google Scholar] [CrossRef]
  5. Kovalchik, S.A. Player Tracking Data in Sports. Annu. Rev. Stat. Its Appl. 2023, 10, 677–697. [Google Scholar] [CrossRef]
  6. Vella, A.; Clarke, A.C.; Kempton, T.; Ryan, S.; Coutts, A.J. Assessment of Physical, Technical, and Tactical Analysis in the Australian Football League: A Systematic Review. Sport. Med.-Open 2022, 8, 124. [Google Scholar] [CrossRef]
  7. Junliang, X.; Haizhou, A.; Liwei, L.; Shihong, L. Multiple Player Tracking in Sports Video: A Dual-Mode Two-Way Bayesian Inference Approach With Progressive Observation Modeling. IEEE Trans. Image Process. 2011, 20, 1652–1667. [Google Scholar] [CrossRef] [PubMed]
  8. Heydari, M.; Moghadam, A. An MLP-based player detection and tracking in broadcast soccer video. In Proceedings of the 2012 International Conference of Robotics and Artificial Intelligence, Rawalpindi, Pakistan, 22–23 October 2012. [Google Scholar] [CrossRef]
  9. Ivankovic, Z.; Rackovic, M.; Ivkovic, M. Automatic player position detection in basketball games. Multimed. Tools Appl. 2014, 72, 2741–2767. [Google Scholar] [CrossRef]
  10. Manafifard, M.; Ebadi, H.; Abrishami Moghaddam, H. A survey on player tracking in soccer videos. Comput. Vis. Image Underst. 2017, 159, 19–46. [Google Scholar] [CrossRef]
  11. Liu, J.; Huang, G.; Hyyppä, J.; Li, J.; Gong, X.; Jiang, X. A survey on location and motion tracking technologies, methodologies and applications in precision sports. Expert Syst. Appl. 2023, 229, 120492. [Google Scholar] [CrossRef]
  12. Bastanfard, A.; Jafari, S.; Amirkhani, D. Improving Tracking Soccer Players in Shaded Playfield Video. In Proceedings of the 2019 5th Iranian Conference on Signal Processing and Intelligent Systems (ICSPIS), Shahrood, Iran, 18–19 December 2019; pp. 1–8. [Google Scholar] [CrossRef]
  13. Previtali, F.; Bloisi, D.; Iocchi, L. A distributed approach for real-time multi-camera multiple object tracking. Mach. Vis. Appl. 2017, 28, 421–430. [Google Scholar] [CrossRef]
  14. Hurault, S.; Ballester, C.; Haro, G. Self-Supervised Small Soccer Player Detection and Tracking. In Proceedings of the 3rd International Workshop on Multimedia Content Analysis in Sports, Seattle, WA, USA, 16 October 2020; pp. 9–18. [Google Scholar]
  15. Host, K.; Ivasic-Kos, M.; Pobar, M. Tracking Handball Players with the DeepSORT Algorithm. In Proceedings of the ICPRAM, Valletta, Malta, 22–24 February 2020; pp. 593–599. [Google Scholar]
  16. Buric, M.; Ivasic-Kos, M.; Pobar, M. Player tracking in sports videos. In Proceedings of the 2019 IEEE International Conference on Cloud Computing Technology and Science (CloudCom), Sydney, Australia, 11–13 December 2019; pp. 334–340. [Google Scholar]
  17. Yoon, Y.; Hwang, H.; Choi, Y.; Joo, M.; Oh, H.; Park, I.; Lee, K.H.; Hwang, J.H. Analyzing Basketball Movements and Pass Relationships Using Realtime Object Tracking Techniques Based on Deep Learning. IEEE Access 2019, 7, 56564–56576. [Google Scholar] [CrossRef]
  18. Santiago, C.B.; Sousa, A.; Reis, L.P.; Estriga, M.L. Real Time Colour Based Player Tracking in Indoor Sports. In Computational Vision and Medical Image Processing: Recent Trends; Springer: Dordrecht, The Netherlands, 2011; pp. 17–35. [Google Scholar] [CrossRef]
  19. Tong, X.; Liu, J.; Wang, T.; Zhang, Y. Automatic player labeling, tracking and field registration and trajectory mapping in broadcast soccer video. ACM Trans. Intell. Syst. Technol. 2011, 2, 1–32. [Google Scholar] [CrossRef]
  20. Ben Shitrit, H.; Berclaz, J.; Fleuret, F.; Fua, P. Multi-Commodity Network Flow for Tracking Multiple People. IEEE Trans. Pattern Anal. Mach. Intell. 2014, 36, 1614–1627. [Google Scholar] [CrossRef] [PubMed]
  21. Santiago, C.; Sousa, A.; Reis, L. Vision system for tracking handball players using fuzzy color processing. Mach. Vis. Appl. 2013, 24, 1055–1074. [Google Scholar] [CrossRef]
  22. Viola, P.; Jones, M. Rapid object detection using a boosted cascade of simple features. In Proceedings of the IEEE Conference on Computer Vision and Pattern Recognition, Kauai, HI, USA, 8–14 December 2001; Volume 1, pp. 511–518. [Google Scholar] [CrossRef]
  23. de Padua, P.; Padua, F.; Sousa, M.; De A. Pereira, M. Particle Filter-Based Predictive Tracking of Futsal Players from a Single Stationary Camera. In Proceedings of the 2015 28th SIBGRAPI Conference on Graphics, Patterns and Images, Salvador, Brazil, 26–29 August 2015. [Google Scholar] [CrossRef]
  24. Martín, R.; Martínez, J. A semi-supervised system for players detection and tracking in multi-camera soccer videos. Multimed. Tools Appl. 2014, 73, 1617–1642. [Google Scholar] [CrossRef]
  25. Kim, W.; Moon, S.W.; Lee, J.; Nam, D.W.; Jung, C. Multiple player tracking in soccer videos: An adaptive multiscale sampling approach. Multimed. Syst. 2018, 24, 611–623. [Google Scholar] [CrossRef]
  26. Li, W.; Powers, D. Multiple Object Tracking Using Motion Vectors from Compressed Video. In Proceedings of the 2017 International Conference on Digital Image Computing: Techniques and Applications (DICTA), Sydney, Australia, 29 November–1 December 2017; pp. 1–5. [Google Scholar] [CrossRef]
  27. Danelljan, M.; Bhat, G.; Shahbaz Khan, F.; Felsberg, M. ECO: Efficient convolution operators for tracking. In Proceedings of the IEEE Conference on Computer Vision and Pattern Recognition, Honolulu, HI, USA, 21–26 July 2017; pp. 6638–6646. [Google Scholar]
  28. Thinh, N.H.; Son, H.H.; Phuong Dzung, C.T.; Dzung, V.Q.; Ha, L.M. A video-based tracking system for football player analysis using Efficient Convolution Operators. In Proceedings of the 2019 International Conference on Advanced Technologies for Communications (ATC), Hanoi, Vietnam, 17–19 October 2019; pp. 149–154. [Google Scholar] [CrossRef]
  29. Pathak, A.R.; Pandey, M.; Rautaray, S. Application of Deep Learning for Object Detection. Procedia Comput. Sci. 2018, 132, 1706–1717. [Google Scholar] [CrossRef]
  30. Dalal, N.; Triggs, B. Histograms of oriented gradients for human detection. In Proceedings of the IEEE Conference on Computer Vision and Pattern Recognition, San Diego, CA, USA, 20–26 June 2005; Volume 1, pp. 886–893. [Google Scholar]
  31. Ren, S.; He, K.; Girshick, R.; Sun, J. Faster R-CNN: Towards real-time object detection with region proposal networks. In Proceedings of the Advances in Neural Information Processing Systems, Montreal, QC, Canada, 7–12 December 2015; pp. 91–99. [Google Scholar]
  32. Redmon, J.; Farhadi, A. YOLOv3: An incremental improvement. arXiv 2018, arXiv:1804.02767. [Google Scholar] [CrossRef]
  33. Bochkovskiy, A.; Wang, C.Y.; Liao, H.Y. YOLOv4: Optimal Speed and Accuracy of Object Detection. arXiv 2020, arXiv:2004.10934. [Google Scholar] [CrossRef]
  34. Hochreiter, S.; Schmidhuber, J. Long Short-Term Memory. Neural Comput. 1997, 9, 1735–1780. [Google Scholar] [CrossRef]
  35. Wojke, N.; Bewley, A.; Paulus, D. Simple online and realtime tracking with a deep association metric. In Proceedings of the 2017 IEEE International Conference on Image Processing (ICIP), Beijing, China, 17–20 September 2017; pp. 3645–3649. [Google Scholar] [CrossRef]
  36. Ran, N.; Kong, L.; Wang, Y.; Liu, Q. A Robust Multi-Athlete Tracking Algorithm by Exploiting Discriminant Features and Long-Term Dependencies. In MultiMedia Modeling: 25th International Conference, MMM 2019, Thessaloniki, Greece, 8–11 January 2019; Springer International Publishing: Cham, Switzerland, 2018. [Google Scholar] [CrossRef]
  37. Baysal, S.; Duygulu, P. Sentioscope: A Soccer Player Tracking System Using Model Field Particles. IEEE Trans. Circuits Syst. Video Technol. 2016, 26, 1350–1362. [Google Scholar] [CrossRef]
  38. Fu, X.; Zhang, K.; Wang, C.; Fan, C. Multiple player tracking in basketball court videos. J. Real-Time Image Process. 2020, 17, 1811–1828. [Google Scholar] [CrossRef]
  39. Santhosh, P.; Kaarthick, B. An Automated Player Detection and Tracking in Basketball Game. Comput. Mater. Contin. 2019, 58, 625. [Google Scholar] [CrossRef]
  40. Maria Martine, B.; Noah, E.; Qipei, M.; Mustafa, G.; Samer, A.; Lindsey, W. A Deep Learning and Computer Vision Based Multi-Player Tracker for Squash. Appl. Sci. 2020, 10, 8793. [Google Scholar] [CrossRef]
  41. Johnston, R.; Black, G.; Harrison, P.; Murray, N.; Austin, D. Applied Sport Science of Australian Football: A Systematic Review. Sport. Med. 2018, 48, 1673–1694. [Google Scholar] [CrossRef] [PubMed]
  42. Faulkner, H.; Dick, A. AFL player detection and tracking. In Proceedings of the 2015 International Conference on Digital Image Computing: Techniques and Applications (DICTA), Adelaide, Australia, 23–25 November 2015; pp. 1–8. [Google Scholar] [CrossRef]
  43. Linke, D.; Link, D.; Lames, M. Validation of electronic performance and tracking systems EPTS under field conditions. PLoS ONE 2018, 13, e0199519. [Google Scholar] [CrossRef] [PubMed]
  44. Redmon, J. Darknet: Open Source Neural Networks in C. 2013. Available online: http://pjreddie.com/darknet/ (accessed on 17 February 2022).
  45. Supervisely. Unified OS/Platform for Computer Vision. 2022. Available online: https://supervise.ly/ (accessed on 17 February 2022).
  46. Perez, L.; Wang, J. The effectiveness of data augmentation in image classification using deep learning. arXiv 2017, arXiv:1712.04621. [Google Scholar]
  47. Ooms, J. Tesseract: Open Source OCR Engine. 2022. Available online: https://github.com/ropensci/tesseract (accessed on 17 February 2022).
  48. Rizky, A.F.; Yudistira, N.; Santoso, E. Text recognition on images using pre-trained CNN. arXiv 2023, arXiv:2302.05105. [Google Scholar]
  49. Earth, G. Riverway Stadium. 2023. Available online: https://www.google.com/maps (accessed on 12 June 2023).
  50. The Defense Mapping Agency. World Geodetic System 1984, Its Definition and Relationship with Local Geodetic Systems; Report; Department of Defense: Washington, DC, USA, 1991.
  51. Varley, M.; Gabbett, T.; Aughey, R. Activity profiles of professional soccer, rugby league and Australian football match play. J. Sport. Sci. 2014, 32, 1858–1866. [Google Scholar] [CrossRef]
  52. Levenberg, K. A Method for the Solution of Certain Non-Linear Problems in Least Squares. Q. Appl. Math. 1944, 2, 164–168. [Google Scholar] [CrossRef]
  53. Liang, Q.; Wu, W.; Yang, Y.; Zhang, R.; Peng, Y.; Xu, M. Multi-Player Tracking for Multi-View Sports Videos with Improved K-Shortest Path Algorithm. Appl. Sci. 2020, 10, 864. [Google Scholar] [CrossRef]
  54. Zhang, Y.; Sun, P.; Jiang, Y.; Yu, D.; Weng, F.; Yuan, Z.; Luo, P.; Liu, W.; Wang, X. ByteTrack: Multi-Object Tracking by Associating Every Detection Box. arXiv 2022, arXiv:2110.06864. [Google Scholar]
  55. Pu, Y.; Liang, W.; Hao, Y.; YUAN, Y.; Yang, Y.; Zhang, C.; Hu, H.; Huang, G. Rank-DETR for High Quality Object Detection. In Proceedings of the Advances in Neural Information Processing Systems; Oh, A., Neumann, T., Globerson, A., Saenko, K., Hardt, M., Levine, S., Eds.; Curran Associates, Inc.: Red Hook, NY, USA, 2023; Volume 36, pp. 16100–16113. [Google Scholar]
  56. Yang, L.; Zheng, Z.; Wang, J.; Song, S.; Huang, G.; Li, F. AdaDet: An Adaptive Object Detection System Based on Early-Exit Neural Networks. IEEE Trans. Cogn. Dev. Syst. 2024, 16, 332–345. [Google Scholar] [CrossRef]
  57. Wang, C.Y.; Yeh, I.H.; Liao, H.Y.M. YOLOv9: Learning What You Want to Learn Using Programmable Gradient Information. arXiv 2024, arXiv:2402.13616. [Google Scholar]
  58. Le, H.; Carr, P.; Yue, Y.; Lucey, P. Data-driven ghosting using deep imitation learning. In Proceedings of the MIT Sloan Sports Analytics Conference, Boston, MA, USA, 3–4 March 2017. [Google Scholar]
  59. Seidl, T.; Cherukumudi, A.; Hartnett, A.; Carr, P.; Lucey, P. Bhostgusters: Realtime Interactive Play Sketching with Synthesized NBA Defenses. In Proceedings of the MIT Sloan Sports Analytics Conference, Boston, MA, USA, 23–24 February 2018. [Google Scholar]
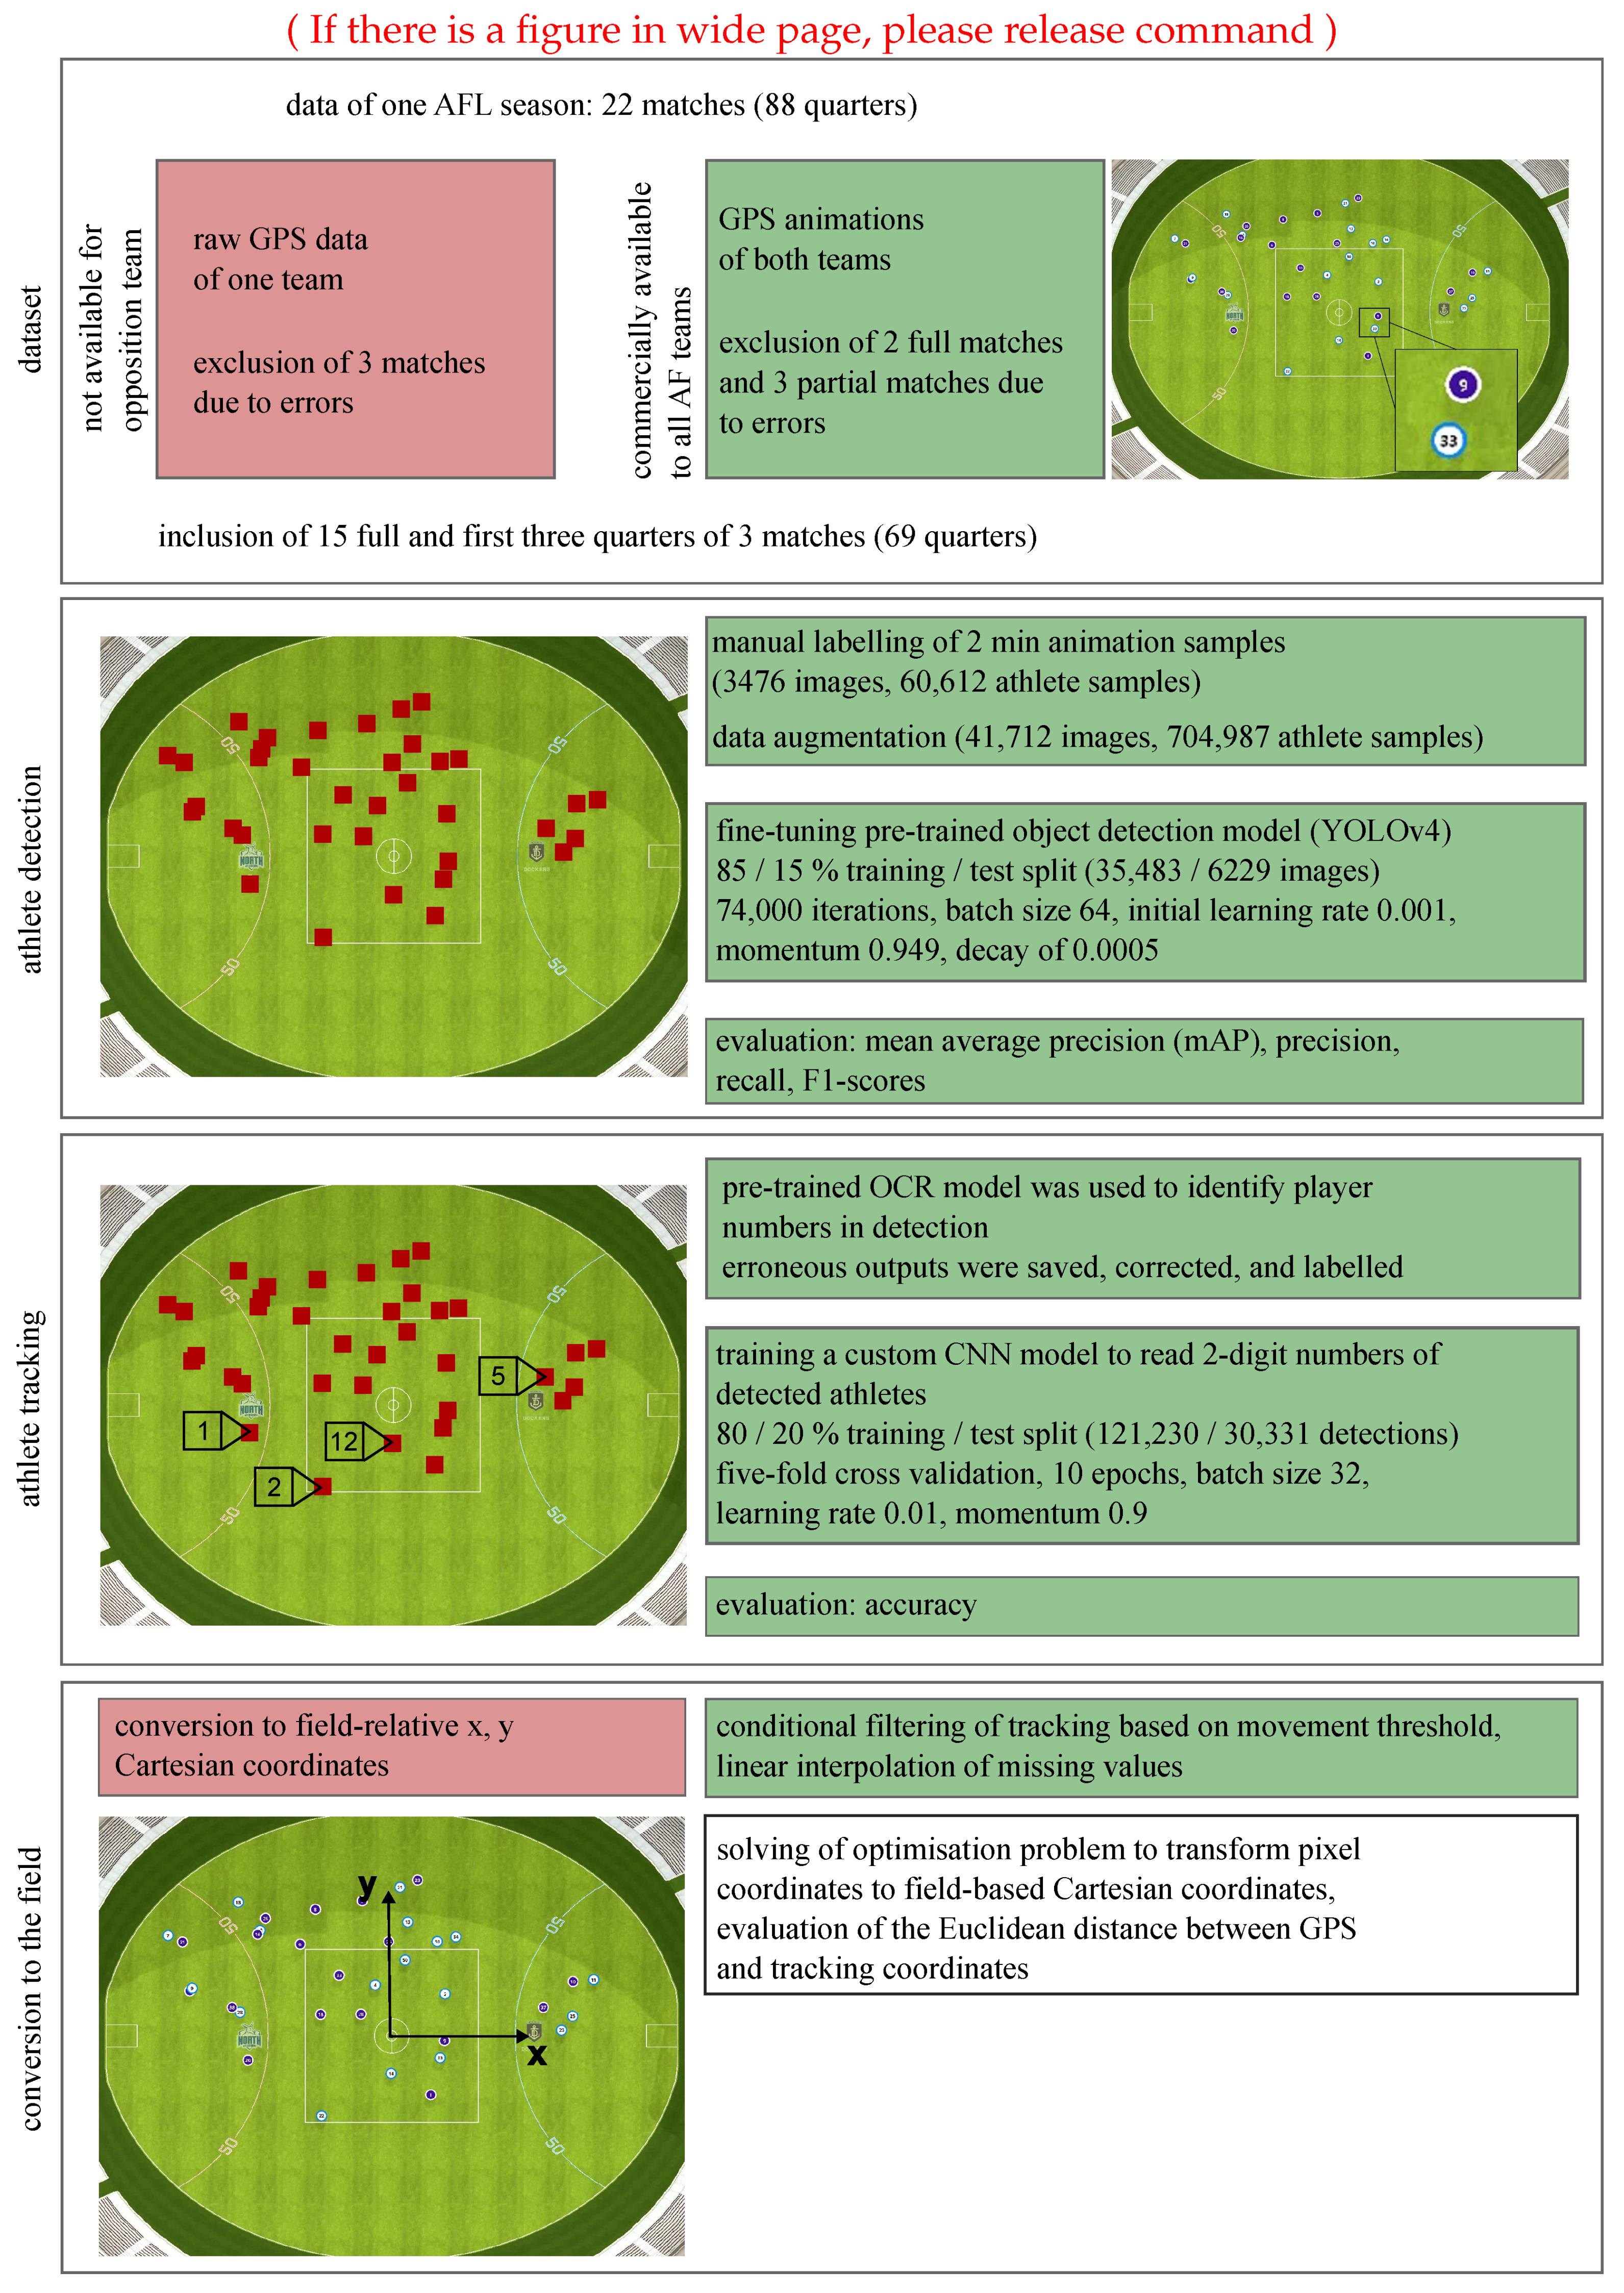
Figure 1. Overview of the workflow used in this study. Raw GPS data is not available for the opposition team. All steps using this information are highlighted by red boxes. GPS animations are commercially available for both teams and all steps in the workflow using this data are highlighted by green boxes. The numbers provided in brackets indicate the data set size used for each step.
Ai 05 00038 g001
Figure 2. Architecture details of the custom athlete number convolutional neural network. The first box displays the input layer, followed by five convolutional layers of different sizes described by the numbers. After flattening the data, the convolutional layers are followed by three dense layers of different sizes. The blue and red shapes display the data flow through the network.
Ai 05 00038 g002
Figure 3. Boxplot of the accuracy measure distribution of the custom number reader model across the five-fold cross-validation training protocol.
Ai 05 00038 g003
Figure 4. Boxplot of the distribution of the 95% confidence interval Euclidean distance between the transformed pixel coordinates and GPS field-relative coordinates. The distribution of the Euclidean distance for round 20 had a greater spread than all other matches. Further investigations revealed an issue with the number reader implementation in this match. It was found that two athletes with similar playing numbers were repeatedly misidentified.
Ai 05 00038 g004
Table 1. Optimisation problem coefficient results grouped by stadium. Pix-uv is the pixel coordinates; m Coeff and c Coeff are the scaling and translation coefficients, respectively.
Stadium (No. Matches)Pix-uvm Coeff (Mean ± Std)c Coeff (Mean ± Std)
Optus Stadium (10)u0.15 ± 4.32 × 10⁻³−160.02 ± 3.99
v0.13 ± 3.46 × 10⁻³−69.36 ± 2.04
Metricon Stadium (1)u0.13 ± 7.85 × 10⁻⁴−129.01 ± 0.62
v0.15 ± 3.76 × 10⁻⁴−81.69 ± 0.51
Adelaide Oval (2)u0.12 ± 3.60 × 10⁻⁴−117.23 ± 0.40
v0.15 ± 3.96 × 10⁻⁴−84.85 ± 0.38
Melbourne Cricket Ground (1.75)u0.18 ± 3.13 × 10⁻⁴−172.77 ± 0.24
v0.14 ± 6.11 × 10⁻⁴−81.65 ± 0.43
University of Tasmania Stadium (1)u0.14 ± 6.42 × 10⁻⁴−131.02 ± 0.52
v0.18 ± 2.22 × 10⁻³−101.01 ± 0.91
Manuka Oval (0.75)u0.14 ± 1.17 × 10⁻⁴−132.54 ± 0.22
v0.17 ± 1.07 × 10⁻³−95.14 ± 0.29
Disclaimer/Publisher’s Note: The statements, opinions and data contained in all publications are solely those of the individual author(s) and contributor(s) and not of MDPI and/or the editor(s). MDPI and/or the editor(s) disclaim responsibility for any injury to people or property resulting from any ideas, methods, instructions or products referred to in the content.