Article

Bibliometric Mining of Research Trends in Machine Learning

Department of Computer Science, Blekinge Institute of Technology, 37179 Karlskrona, Sweden
*
Author to whom correspondence should be addressed.
AI 2024, 5(1), 208-236; https://doi.org/10.3390/ai5010012
Submission received: 25 December 2023 / Revised: 13 January 2024 / Accepted: 15 January 2024 / Published: 19 January 2024

Abstract

:
We present a method, including tool support, for bibliometric mining of trends in large and dynamic research areas. The method is applied to the machine learning research area for the years 2013 to 2022. A total number of 398,782 documents from Scopus were analyzed. A taxonomy containing 26 research directions within machine learning was defined by four experts with the help of a Python program and existing taxonomies. The trends in terms of productivity, growth rate, and citations were analyzed for the research directions in the taxonomy. Our results show that the two directions, Applications and Algorithms, are the largest, and that the direction Convolutional Neural Networks is the one that grows the fastest and has the highest average number of citations per document. It also turns out that there is a clear correlation between the growth rate and the average number of citations per document, i.e., documents in fast-growing research directions have more citations. The trends for machine learning research in four geographic regions (North America, Europe, the BRICS countries, and The Rest of the World) were also analyzed. The number of documents during the time period considered is approximately the same for all regions. BRICS has the highest growth rate, and, on average, North America has the highest number of citations per document. Using our tool and method, we expect that one could perform a similar study in some other large and dynamic research area in a relatively short time.

1. Introduction

The basic idea of machine learning (ML) is that the behavior of a computer (a machine) should not be (completely) defined by a programmer. Instead, the computer should learn from existing data observations through the use of algorithms and, based on that, handle (e.g., classify) previously unknown data observations. This resembles the way that humans can handle new and unknown situations based on previous experience. The origin of modern ML is often associated with Frank Rosenblatt from Cornell University. In the late 1950s, he and his group created the perceptron classifier for recognizing the letters of the alphabet [1,2]. During the 1980s, the concept of backpropagation was rediscovered, increasing the interest in ML research. In the 1990s, there was a general shift toward more data-driven ML approaches compared with the prior knowledge-based approaches. Researchers created algorithms and methods for analyzing large amounts of data observations by training ML models, which learned patterns from the data [3].
Today, ML is a rapidly evolving research area, and there are many research directions within ML, e.g., different ML algorithms and different applications of ML technology. The rate at which the number of articles and other documents related to ML grows is staggering. It is, therefore, very difficult for researchers and practitioners to follow and analyze the research trends in ML. In the Scopus database, there are over 106,000 documents from 2022 that have “machine learning” in the title, abstract, or list of keywords.
Two examples of classification systems for research documents are the ACM Computing Classification System [4] and the system for Mathematics Subject Classification (MSC) [5]. However, such classification systems are static and do not easily adapt to new trends and research directions. As well as other research areas, ML grows fast and is very dynamic in the sense that new research directions appear frequently. As a consequence, static classification systems such as the ACM classification system and MSC are not widely used in dynamic areas such as ML. In dynamic and fast-growing research areas, research directions need to be dynamically identified based on articles and other documents in the area. An additional problem with existing classification systems is that only a limited number of documents are classified according to these systems.
This paper presents a data-driven approach for the analysis of research trends within the ML area using the Scopus publication database. One previous data-driven approach for automatically identifying research directions was to create clusters of keywords from documents in the area. The idea behind this approach was that the clusters with the most frequent keywords define the important research directions in a research area. However, such approaches often result in clusters of keywords that are too general for identifying research directions (e.g., ‘risk’ [6], ‘costs’ [7], ‘new’ [8], and ‘mouse’ [9]) or unclear and ambiguous (e.g., ‘micro grid’ different from ‘microgrid’ different from ‘microgrids’ [7]; ‘svm’ different from ‘support vector machine’ [9]; and ‘neural network’ different from ‘neural networks’ [10]). Here, the problem with keywords that are too general is handled by a blacklist, while the problem of ambiguous clusters is handled by an expert-defined thesaurus that groups keywords into research directions (see Section 3 for details).
A systematic literature review [11] is an approach that is often used to provide an overview of a research area. However, due to the overwhelming number of documents in ML, it was not feasible to do a systematic literature review on trends in this research area. In this paper, we used a Python program and four human experts to perform bibliometric mining of research trends in ML. The approach is semi-automatic in the sense that human experts define a taxonomy with research directions and group keywords into these research directions. After this action was performed, the Python program automatically identified research trends during the years 2013 to 2022 by performing bibliometric mining of 398,782 documents related to ML from the Scopus database. The program makes it possible to determine which research directions are the largest, are growing the fastest, and have the highest number of citations. The geographic distribution of research in ML was also analyzed by the program. The program and method were based on a similar program and method used for identifying research trends in Big Data [12].
This paper makes two contributions: (i) identifying important research directions and trends in ML and (ii) defining a method and a tool for bibliometric mining of large and dynamic research areas.
The rest of this paper is structured in the following way: Section 2 discusses previous research related to the two research contributions in this paper. In Section 3 the method and Python program are presented. Section 4 presents the results. The results and other aspects are discussed in Section 5. Section 6 presents conclusions and future work. Appendix A describes the competence profile of the experts (which are the same as the authors). Appendix B contains the blacklist and thesaurus, and the exact values corresponding to all graphs in the paper can be found at https://github.com/Lars-Lundberg-bth/bibliometric-ml (accessed on 10 January 2024).

2. Literature Reviews

Section 2.1 discusses bibliometric studies related to research directions and trends in ML, and Section 2.2 discusses work and tools related to bibliometric studies. In Section 2.3, the identified research gap is described.

2.1. Studies of Research Trends and Directions in ML

There are a number of bibliometric studies related to trends and directions in ML. Most of these were conducted for a particular application area. Table 1 summarizes 21 such bibliometric studies. For each study, the table shows the number of documents included in the study, the databases used in the study, the tools and graphs used when analyzing the results, the parameters analyzed in the study, the time period covered by the study, and the application area of the study.
When looking at Table 1, it becomes clear that no study has considered as many documents as we did in the current study. We considered 398,782 documents, whereas the studies shown in Table 1 considered between 86 and 3057 documents, i.e., the number of documents in our study is more than 100 times larger than the number of documents in any of the other studies.
Table 1 shows that Scopus and WoS (Web of Science) are the two dominating databases; we used Scopus. The table also shows that VOSviewer is a very popular tool when analyzing results from this kind of study. The typical way of analyzing keywords in bibliometric studies is to use tools such as VOSviewer or CiteSpace for plotting graphs showing how the different keywords relate to each other (see Section 2.2 for a discussion on VOSviewer and CiteSpace and why such tools are less suited in our case).
Table 2 summarizes 10 bibliometric studies in ML that are not application area specific. The focus of each study can be seen in the rightmost column. There are two types of focus areas for these studies: a specific type of algorithms (e.g., deep learning, neural networks, and support vector machines) or a specific geographic region (e.g., Africa, India, or China). Some studies combined these two types of foci. One study analyzed the publications in a certain journal during an eight-year period. The number of documents considered in these studies varies between 262 and 13,224, i.e., no study considered as many documents as we did in the current study. The databases, tools/graphs, and parameters analyzed in Table 2 are similar to those in Table 1.

2.2. Bibliometric Analysis and Tools

Bibliometrics is often used for research performance assessment of countries, universities, or researchers. Another way to use bibliometrics is science mapping, where bibliometric techniques are used to delimit a research field and detect subfields (research directions) [39,40]. Bibliometric research performance assessment is most popular in Scandinavia, Italy, the Netherlands, and Great Britain [41], and the H-index is one of the most popular performance metrics [42]. New research directions can, in some cases, be identified by analyzing citations [43], e.g., the yearly report on research fronts from the Chinese Academy of Science and Clarivate [44].
In order to identify research directions based on a corpus of documents, one wants to cluster related documents. One usually identifies relations between documents either based on citations or based on words in common [45]. Obviously, citation data are only available for a certain time after a document has been published. To handle such delays, different ML techniques have been used to predict future citations [46]. ML techniques have also been used for handling the problem of gradually changing the semantic meaning of certain concepts and topics [47]. Clustering based on word relations, which is what we did in this study, has proven very useful in studies involving a large number of documents [48].
The two most popular software tools for bibliometric analysis are CiteSpace 6.2 [49] and VOSviewer 1.6.20 [50,51]. These tools have similar functionality [52], and both tools use graphs to visualize bibliometric data. Such graphs become very complex and difficult to interpret, even when the number of documents is relatively small (e.g., Figures 9 and 10 in [9], Figure 16 in [8], and Figure 13 in [7]). Such visualization tools are, therefore, not suitable for studies based on hundreds of thousands of documents.

2.3. Research Gaps

The research gaps related to each of the two contributions defined in the Introduction are described in the two paragraphs below.
Table 1 and Table 2 show that all bibliometric ML studies considered a much smaller number of documents compared with the current study (398,782 documents). This means that compared with previous research, the number of documents is very large, and our study, therefore, offers a much more comprehensive overview of the major research directions in ML compared to previous research. We analyzed productivity and citations for different research directions in ML. We also analyzed geographic distribution. From Table 1 and Table 2, we see that productivity, citations, and geographic distribution are common (and important) parameters. Some studies also analyzed authors and journals. However, when dealing with a very large corpus of documents covering many application areas and algorithms, it becomes less relevant to analyze specific journals and authors. As discussed above, the automatic analysis of keywords (typically performed using VOSviewer or similar tools) often becomes confusing and difficult to interpret. We handle these two problems using an expert-defined blacklist and thesaurus (see Section 3 and Appendix B for details).
There is no bibliometric tool that, in a useful way, (semi-)automatically identifies important research directions and trends in large and dynamic research areas such as ML. Our approach is semi-automatic. By using a tool (in the form of a Python program), research area experts could identify research directions through data mining of a large corpus of documents. It turned out that only 30–40 h of the experts’ time were needed (further discussed in Section 5). Since we considered author-defined keywords when defining the taxonomy, our approach easily adapts to emerging topics and new trends in dynamic research areas such as ML.

3. Methodology

Our research question is, “What are the trends in machine learning regarding research directions, geographic regions, and citations?”. All authors are experts with several years of experience in ML research (see Appendix A for details).
The first step was to create an initial taxonomy of different research directions in ML. The taxonomy was hierarchical, i.e., it corresponded to a tree. This taxonomy was created by the authors in three two-hour workshops. During these workshops, the taxonomy was created in parallel with the thesaurus that connects author-defined keywords with the research directions in the taxonomy. As a starting point, the experts considered existing taxonomies in ML [53,54,55,56,57], as well as ACM’s Computing Classification System (The relevant subsection: Theory of computation->Theory and algorithms for application domains- > Machine learning theory) [58] and the Scikit Learns API division [59]. It should be noted that most taxonomies on ML are in different subfields and, as such, do not cover the complete research area. When defining the taxonomy, the experts also used a tool in the form of a Python program that extracted common keywords in ML from the Scopus database (see Section 3.3 for details about the program). The list of these keywords provided useful information when defining the taxonomy, e.g., if a frequent author-defined keyword could not be allocated to a research direction, the experts discussed how the taxonomy could be modified so that the author-defined keyword could be allocated to a research direction. This means that the final taxonomy and the thesaurus were created in parallel during the three workshops. By adapting it to frequent author-defined keywords, our taxonomy reflected important trends that may not have been identified in existing taxonomies.
After the author-defined keywords were connected to the leaves in the taxonomy, the Python program was used to generate graphs and citation statistics for research directions at different levels in the hierarchical taxonomy (see Section 3.2).

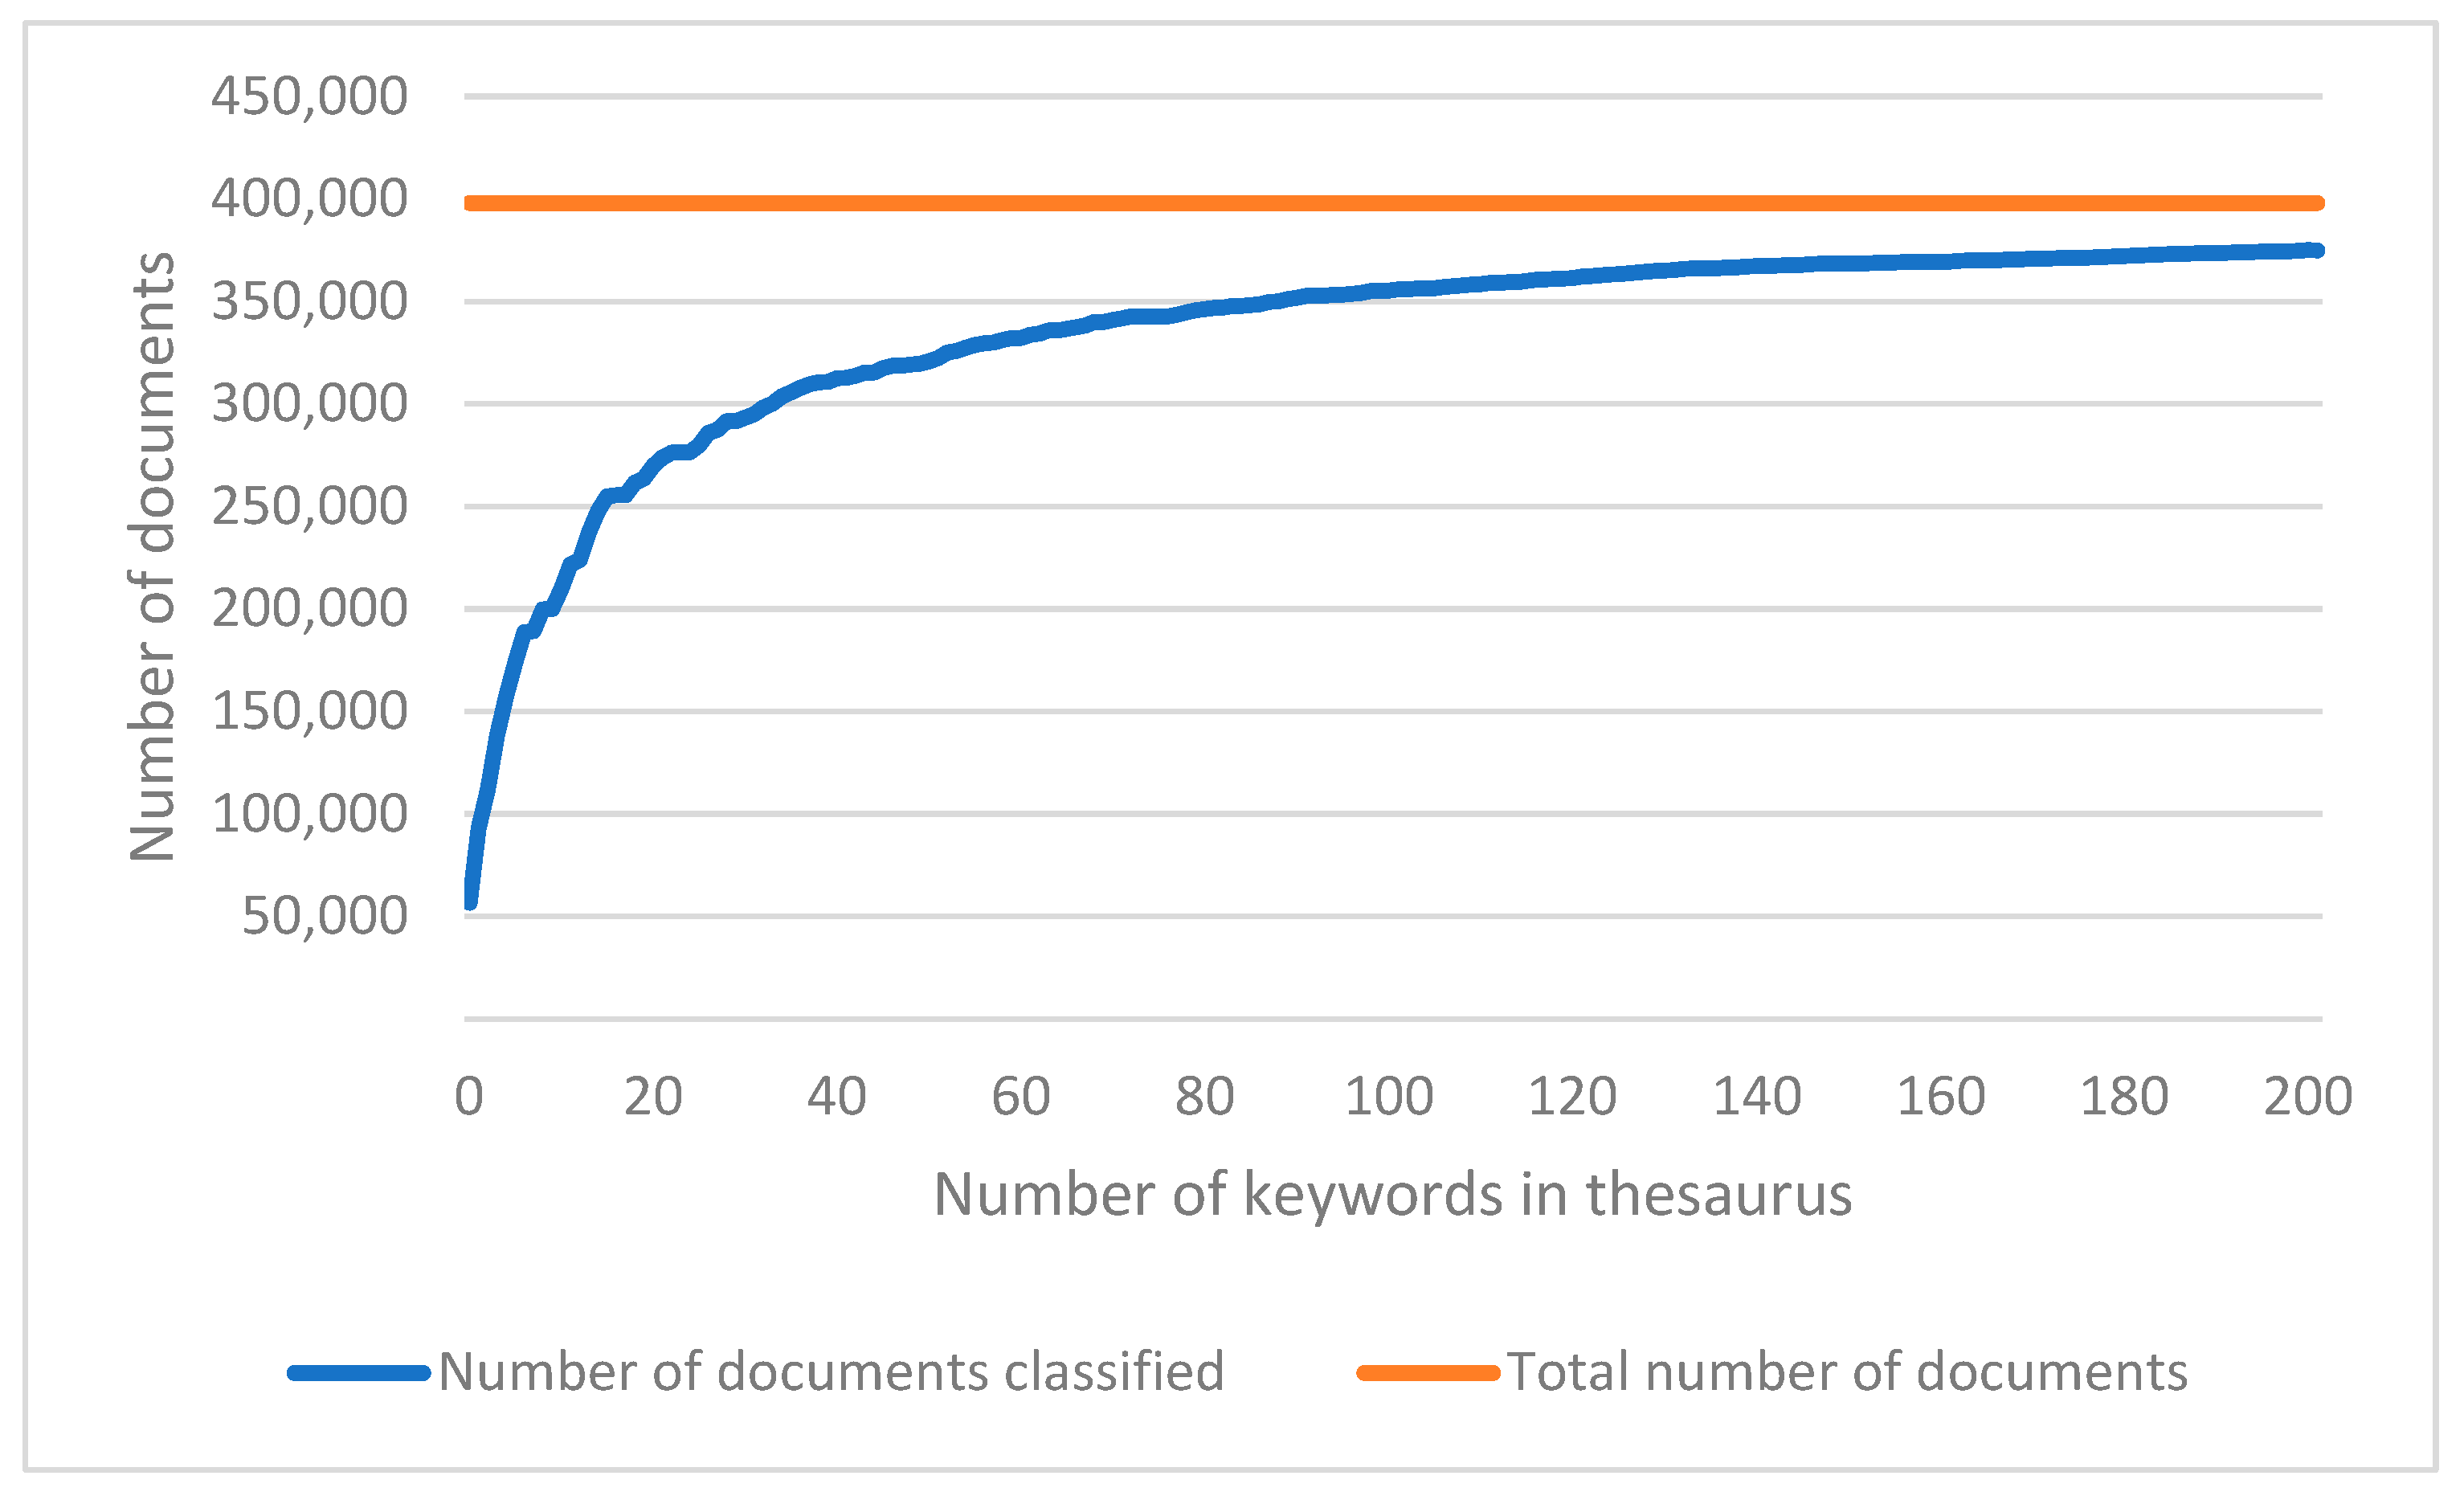
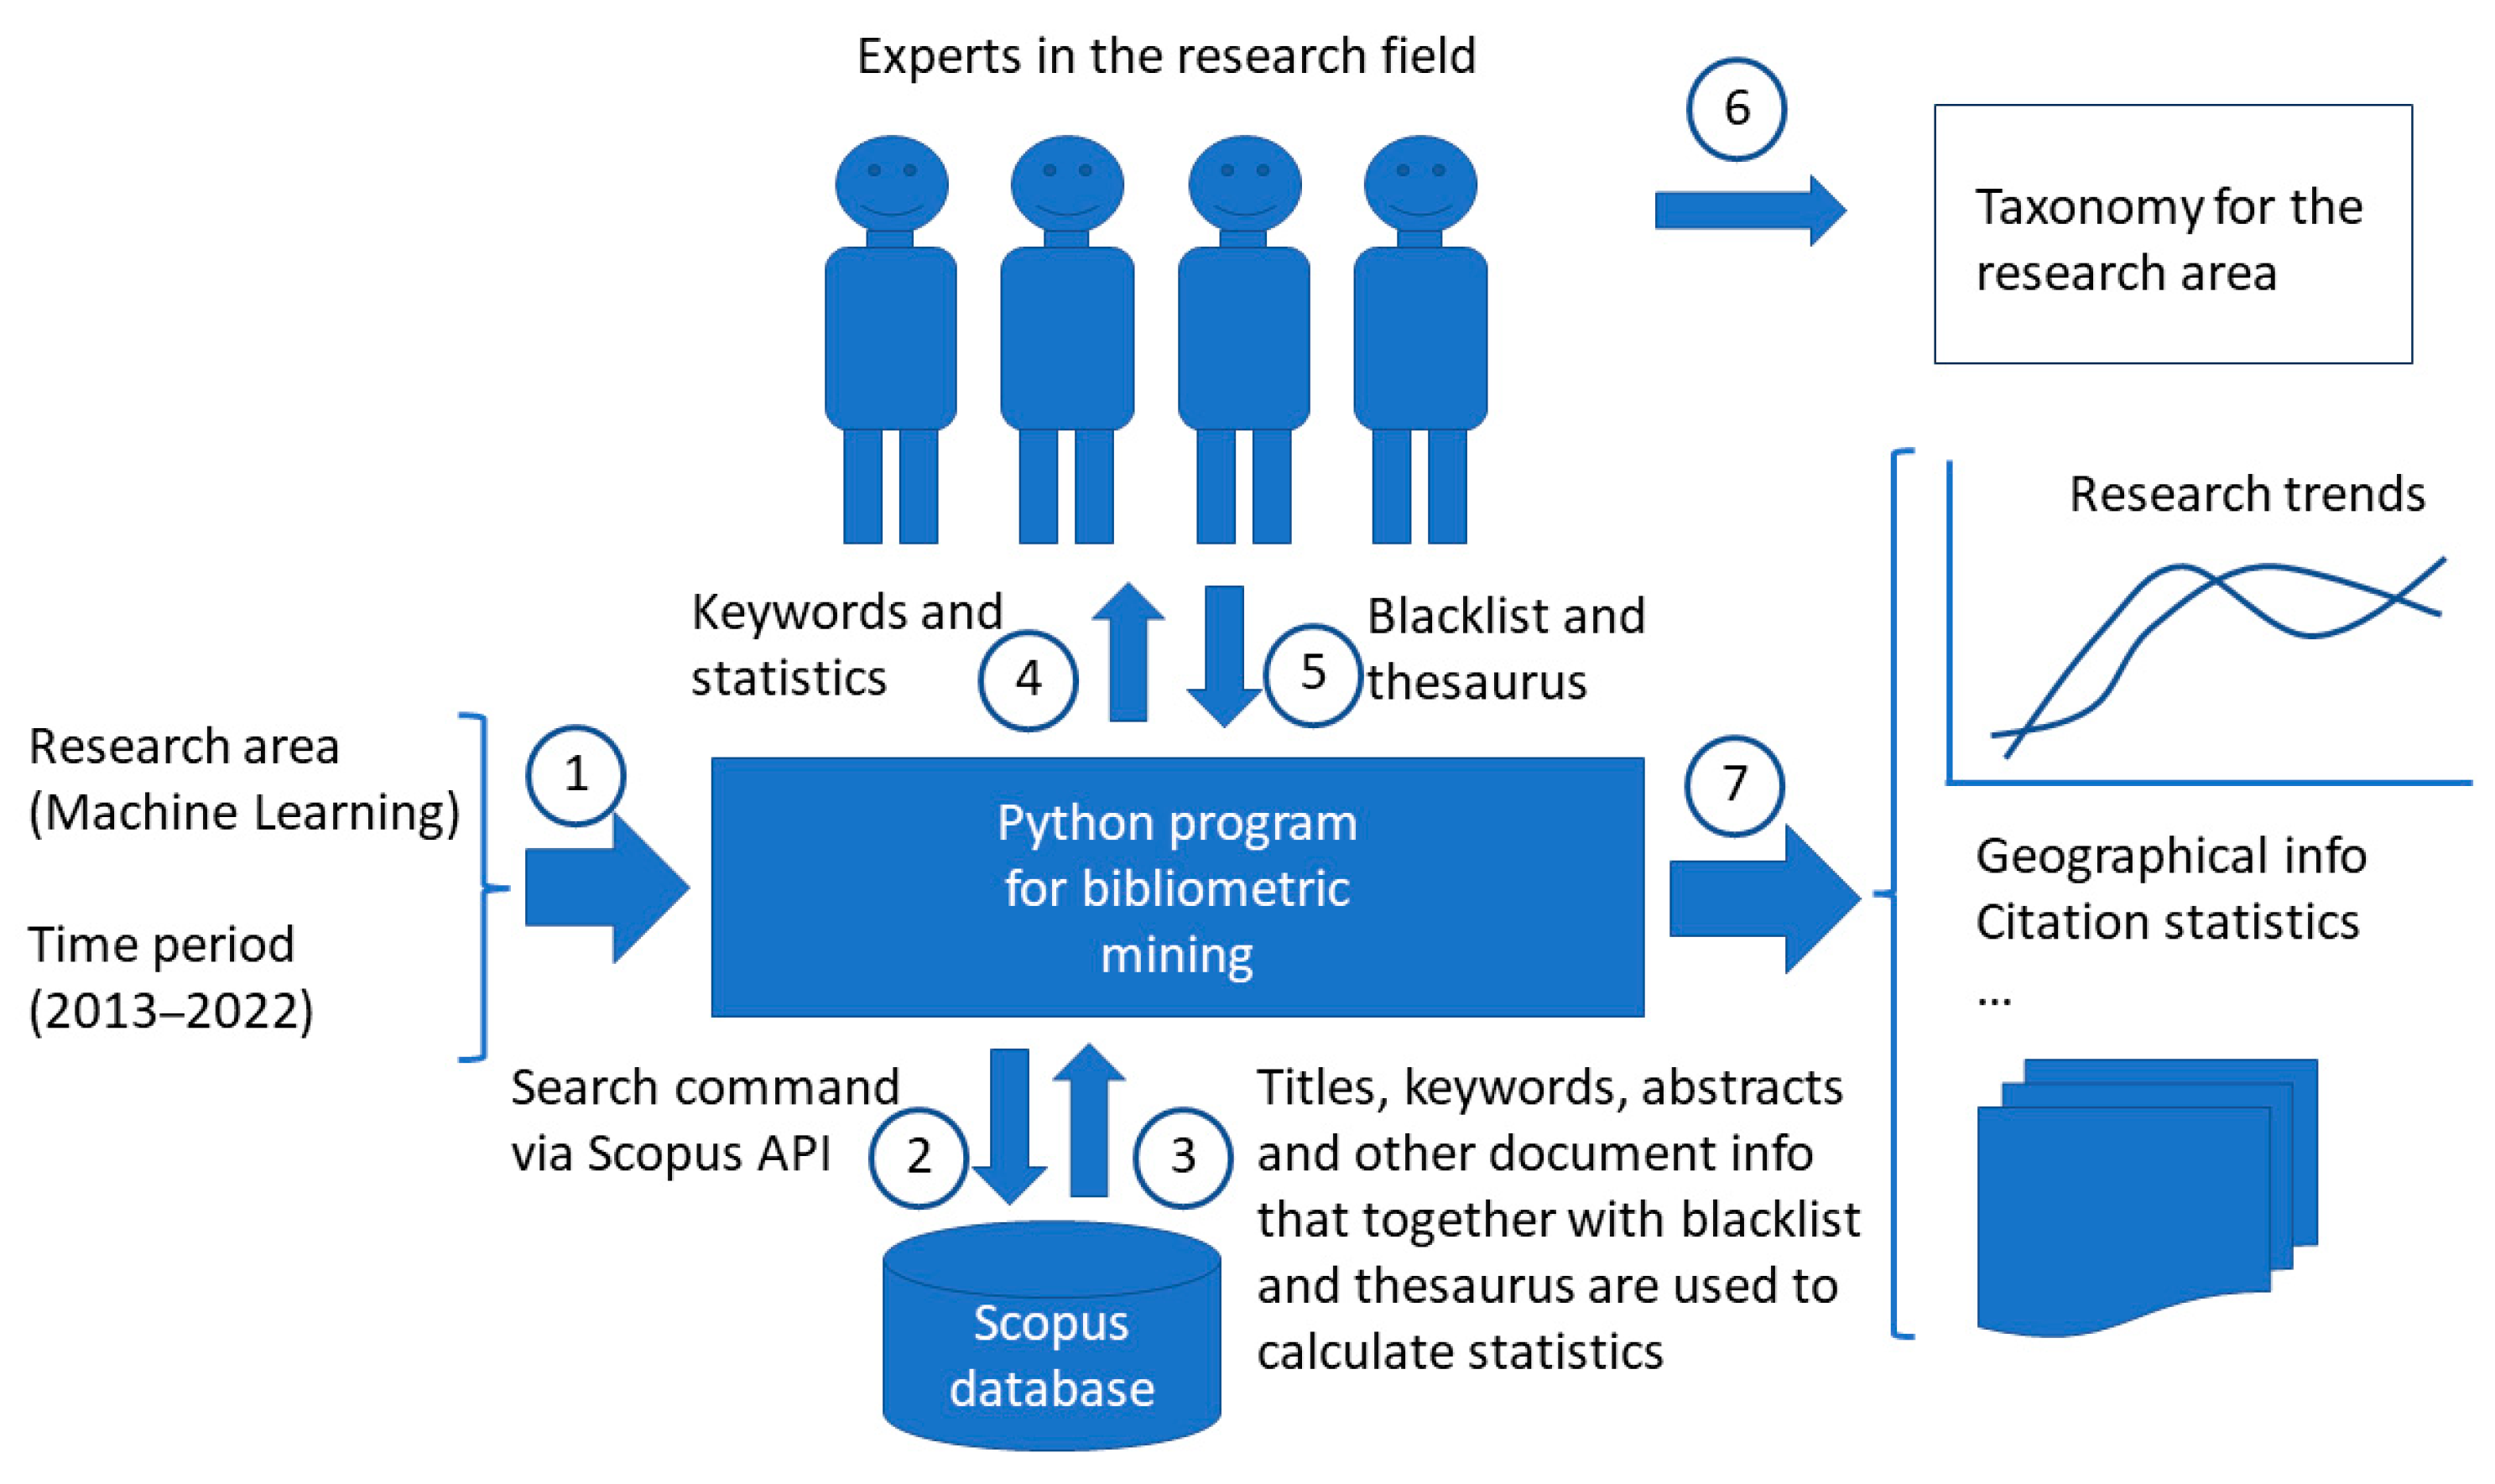
3.1. The Mining Process

Figure 1 shows our process for bibliometric mining. First, the research area (machine learning) and time period (2013–2022) were sent to the program for bibliometric mining (Step 1 in Figure 1).
We retrieved all documents with “machine learning” in the title, list of keywords, or abstract for the 10-year time period (Step 2). This was done using the 10 search strings: “TITLE-ABS-KEY ({machine learning}) AND (PUBYEAR = 2013)”,…, “TITLE-ABS-KEY ({machine learning}) AND (PUBYEAR = 2022)”.
For each document retrieved using the search strings above, we obtained a record from Scopus (Step 3). Each record contained information that made it possible to determine which keywords the document could be connected to. This information included the title, abstract, and author-defined list of keywords of the document. The record also contained the number of citations of the document and the affiliations (including country) of the authors. In our case, there were 398,782 such records, with one record for each document retrieved from Scopus. There were 383,559 unique author-defined keywords. Some author-defined keywords were very general, e.g., ‘data’, ‘research’, and ‘new’ (all author-defined keywords were changed to lower case). Clearly, general keywords are not useful when defining research directions, e.g., a research direction called ‘new’ would be very difficult to relate to and, thus, would not be very useful. Once the experts looked at the list of the most common keywords from the documents retrieved from Scopus (Step 4), the keywords that were too general were put on a blacklist. After looking at the list of common author-defined keywords, the experts also created an initial taxonomy with research directions. They then clustered the common keywords into research directions, which were the leaves in the taxonomy. The clustering of the keywords into research directions became our thesaurus. The blacklist and the thesaurus were then sent to the program (Step 5).
Some clustering of author-defined keywords into research directions was trivial, e.g., ‘neural network’ and ‘neural networks’ were put into the same cluster, and ‘health care’ and ‘healthcare’ were put into the same cluster. Moreover, ‘internet of things’ and ‘iot’ were put in the same cluster, and ‘artificial intelligence’ and ‘ai’ were put into the same cluster. However, some clustering required the experts’ knowledge (e.g., putting ‘malware’ and ‘security’ in the same cluster and putting ‘nlp’ and ‘sentiment analysis’ in the same cluster) (see Appendix B for details).
Steps 4 and 5 were repeated three times in our case, one time for each workshop. As discussed above, the taxonomy and the thesaurus were created in parallel during these workshops. Once the experts were happy with the taxonomy and thesaurus, the taxonomy was finalized (Step 6). The results presented in Section 4 were generated using the program based on the documents from Scopus, the blacklist, and thesaurus (Step 7).
As mentioned above, 383,559 unique author-defined keywords were collected from the 398,782 documents that are included in this study. A document belonged to a research direction (i.e., a leaf in the thesaurus) if at least one of the keywords that the experts allocated to that research direction was present in either the title, the abstract, or the list of author-defined keywords of the document. N.b., a document could belong to many research directions, and, as can be seen in Figure 2, a small number of documents did not belong to any research direction.
In Figure 2, the keywords in the expert-defined blacklist are removed, and the remaining keywords are ordered according to the number of documents that have the keyword in either the title, abstract, or author-defined list of keywords, with the most frequent keywords being first. The blue line in Figure 2 indicates the number of documents that have been classified as belonging to at least one research direction as a function of the number of keywords considered. The figure shows that for 200 (out of 383,559) keywords, more than 94% of the documents have already been classified as belonging to at least one research direction. The expert-defined thesaurus used in this study contained 202 keywords (see Appendix B).

3.2. Data from the Mining Process

3.2.1. Data Related to Research Directions

The pi keywords that correspond to research direction i, i.e., to leaf i in the taxonomy, were obtained from the expert-defined thesaurus (as mentioned above p i = 202 in our case). For each of the pi keywords, we created a set B k i consisting of the documents that contain the keyword ki (1 ≤ kipi) in the title, abstract, or list of keywords. A set Ai is then created the following:
A i = k i = 1 p i B k i
The number of documents belonging to research direction i is given by the cardinality of Ai (1).
As mentioned previously and as will be shown in Section 4, the expert-defined taxonomy is hierarchical. This means that there are internal nodes, i.e., nodes that are not leaves. We refer to such nodes as high-level research directions. The set of documents belonging to a high-level research direction is the union of the documents belonging to all the nodes below the internal node in the taxonomy tree.
The total number of documents for each research direction (including high-level research directions) during the time period of 2013 to 2022 was calculated. The growth factor for each research direction and each year was also calculated. The growth factor for research direction i for year j is defined as the number of documents for direction i for year j divided by the number of documents for research direction i for the year 2013 (2013 is the first year in the time interval considered).
A document that was published 10 years ago will normally have more citations than a document that was published recently. In order to compare the number of citations between documents published in different years, a year-normalized citation score, NCS (Normalized Citation Score), was defined for each document. NCS is obtained by dividing the number of citations within the document by the average number of citations for all documents in our dataset from the same year. As a consequence of this definition, the average NCS was 1 for the documents in our dataset.

3.2.2. Data Related to Geographic Information

We considered four geographic regions: Europe, North America (USA and Canada), the BRICS countries (Brazil, Russia, India, China, and South Africa), and The Rest of the World. A document with authors from more than one geographic region was counted proportionally in the corresponding regions, e.g., a document with three authors—one from China, one from Sweden, and one from Argentina—was allocated 1/3 to the region BRICS, 1/3 to the region Europe, and 1/3 to the region The Rest of the World. A small fraction (less than 3%) of the documents did not have information about affiliation country. These documents were excluded from this part of the study.

3.2.3. Data Related to Authors and Document Sources

We identified the 10 most productive authors in our dataset during the time period of 2013 to 2022. For the five most productive authors we plotted the number of documents per year. We also identified the 10 document sources that contributed the most to our dataset during the time period of 2013 to 2022. For the five most important sources, we plotted the number of documents per year.

3.3. The Program for Bibliometric Mining

The Python program for bibliometric mining used the pybliometrics interface to Scopus [60]. The program went through all the documents two times. First, all author-defined keywords were collected and put on a list. After that, the program went through all documents again and, for each keyword, counted the number of documents with the keyword in the title, author-defined list of keywords, or abstract. As discussed above, each leaf in the taxonomy (i.e., each research direction) corresponded to a list of author-defined keywords (defined by the thesaurus). For each leaf in the taxonomy, a set was created. This set contained all documents that had one of the author-defined keywords associated with the taxonomy leaf in the document title, abstract, or author-defined keyword list. Finally, the normalized citation score (NCS), the number of documents, and the growth factor for each research direction and geographic region were calculated. The code is available at https://github.com/Lars-Lundberg-bth/bibliometric-ml (accessed on 10 January 2024).

4. Results

The number of documents retrieved from Scopus was 398,782; 316,462 of these documents had author-defined keywords. The total number of author-defined keywords was 1,642,925, and 383,559 of these keywords were unique.
Section 4.1 presents the taxonomy defined by the experts, Section 4.2 presents the trends and citation counts for the research directions defined in the taxonomy, and Section 4.3 presents the trends and citation counts for the four geographic regions considered.

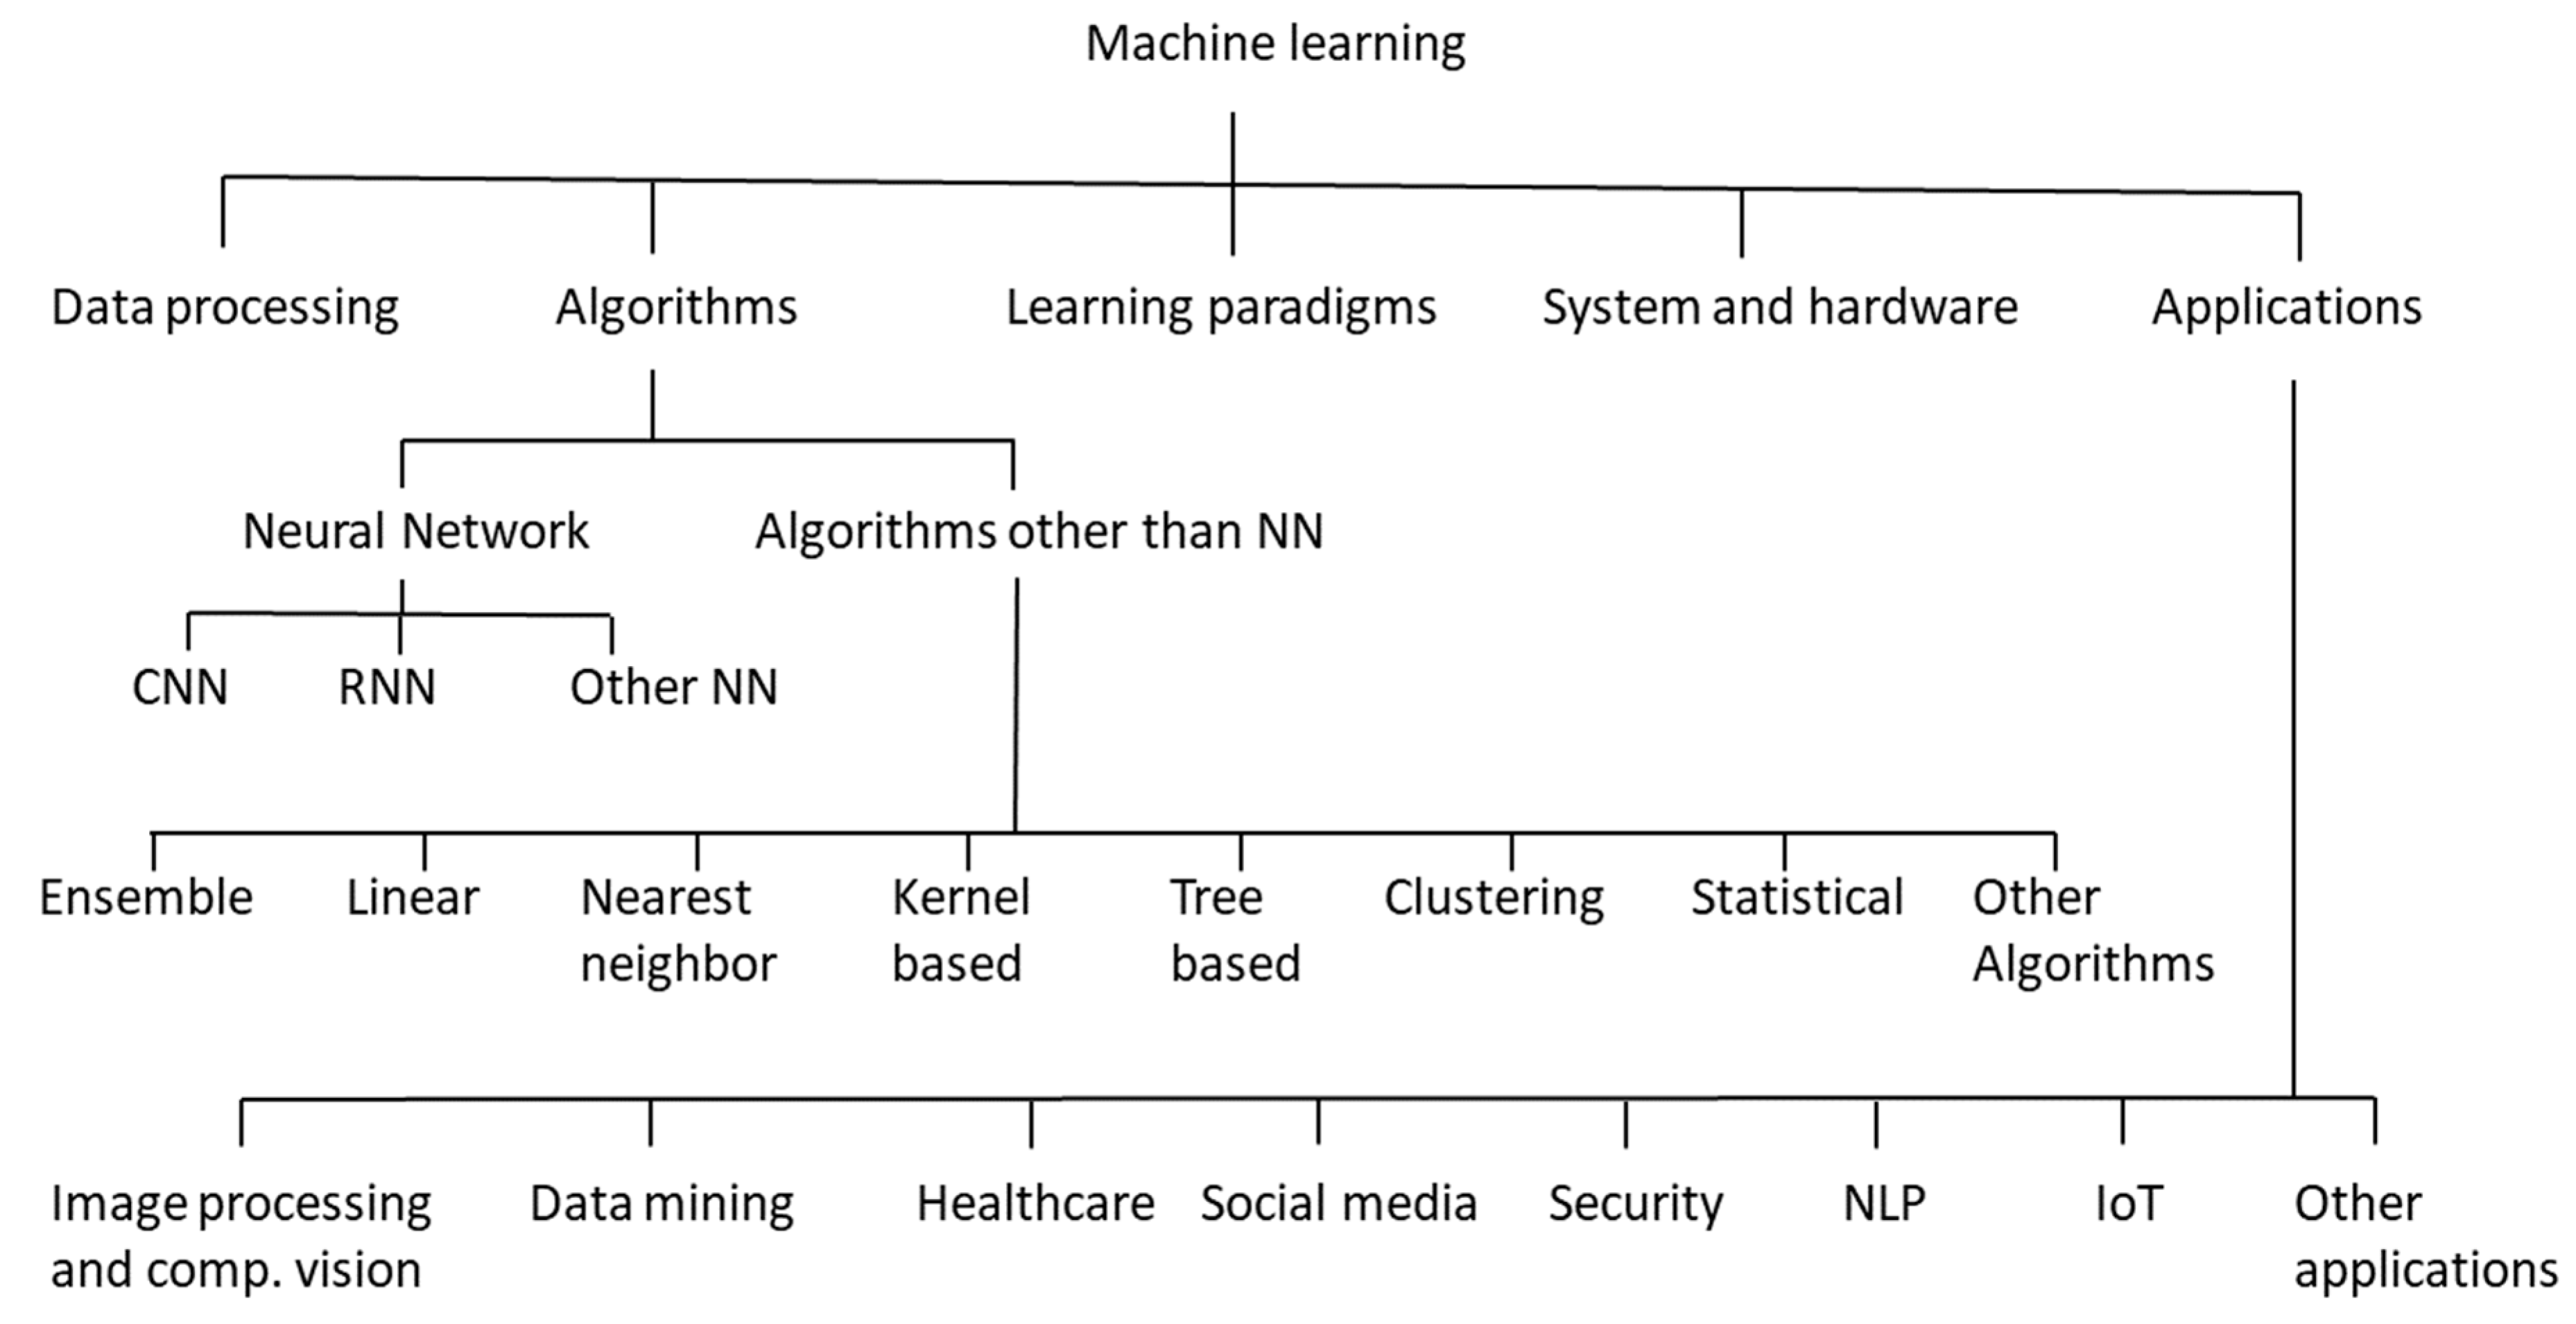
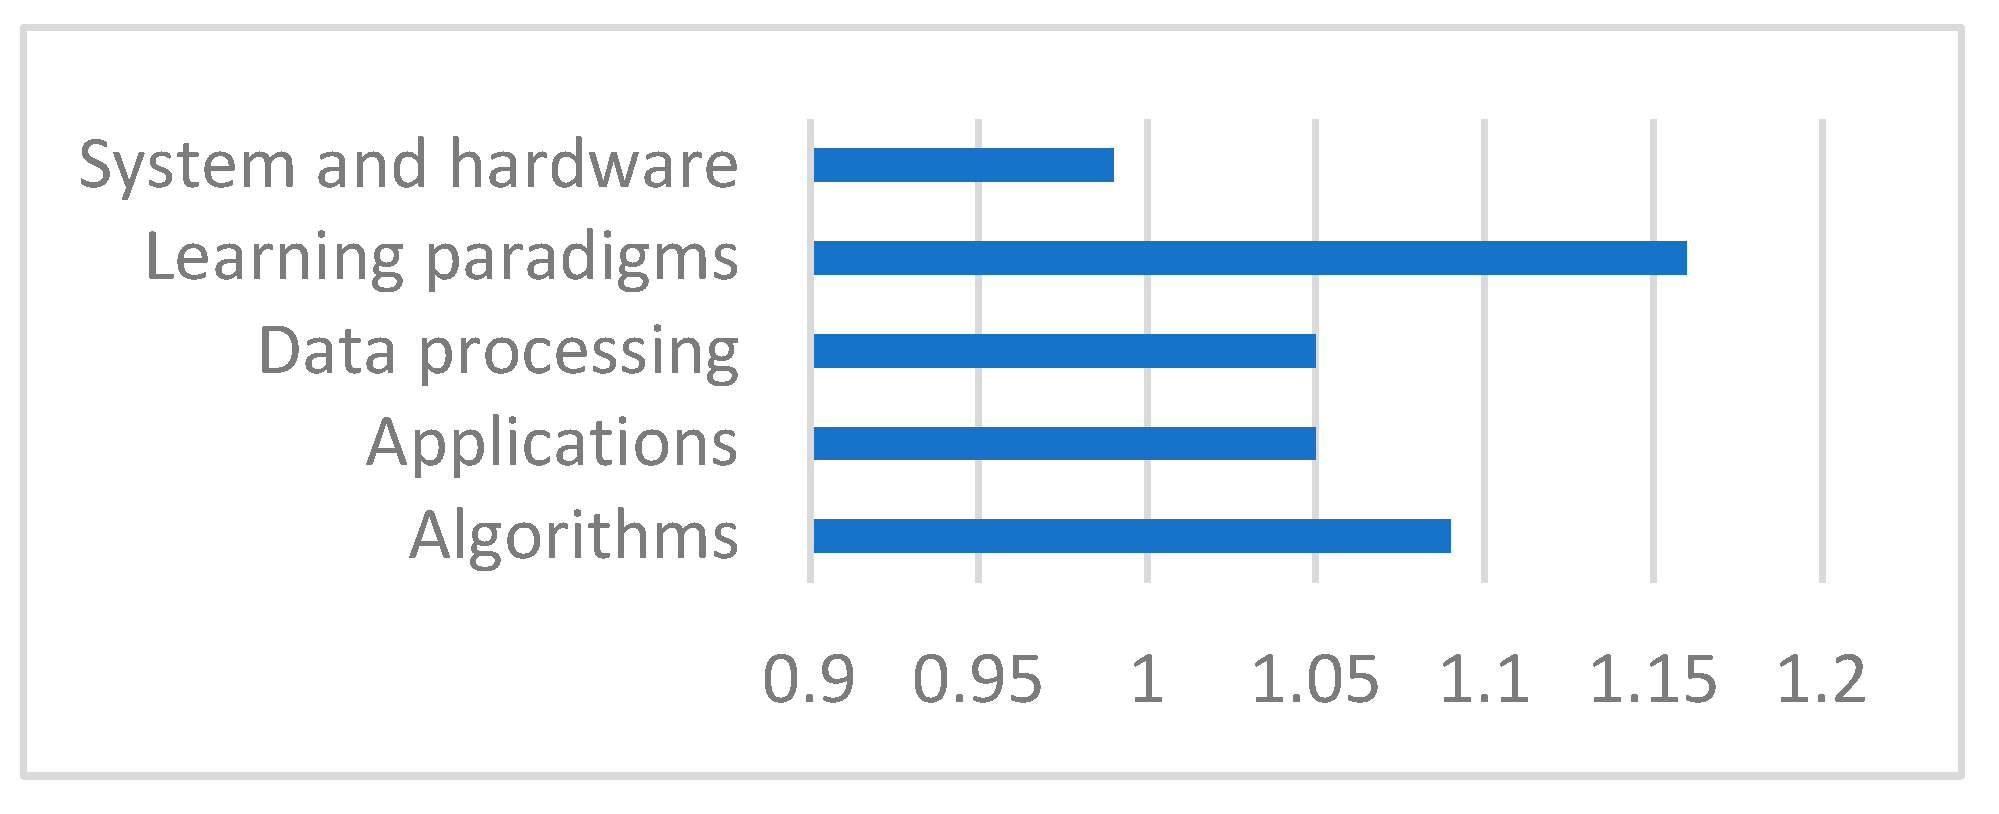
4.1. Directions in ML Research

Figure 3 shows the expert-defined taxonomy used in this study. As can be seen in the figure, there are 22 leaf nodes, four internal nodes (Algorithms, Neural Network, Algorithms other than NN, and Applications), and one top node (Machine learning). Section 4.2 covers the different levels in the taxonomy.

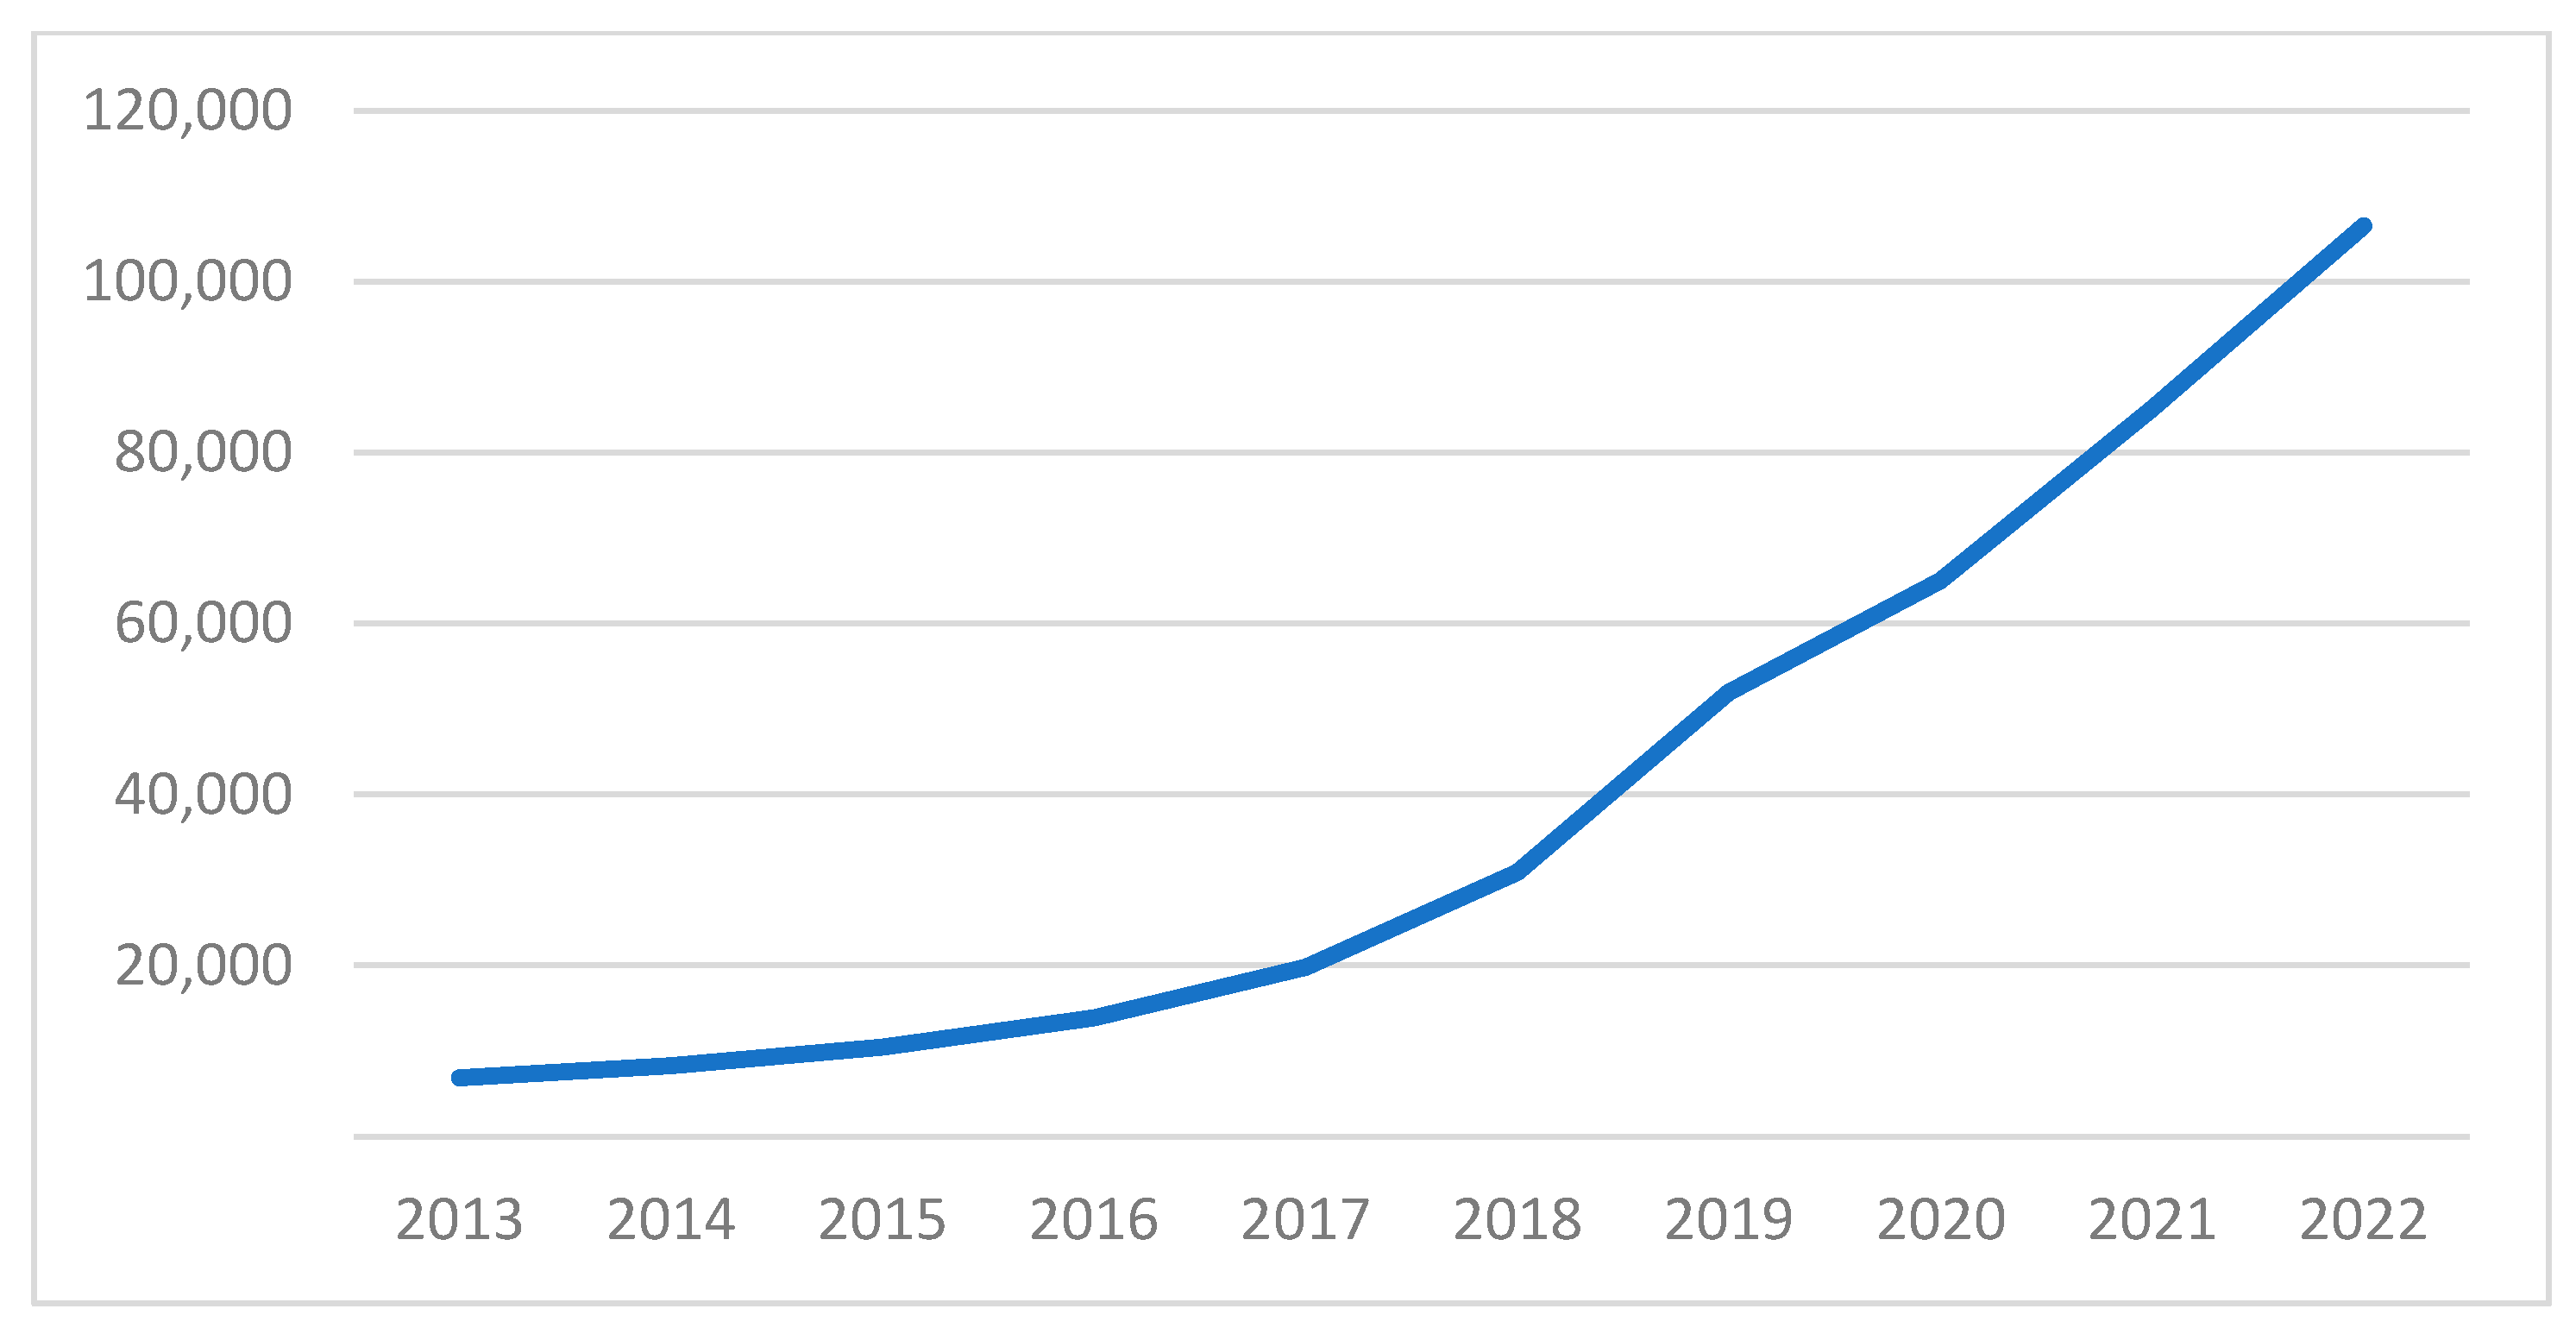
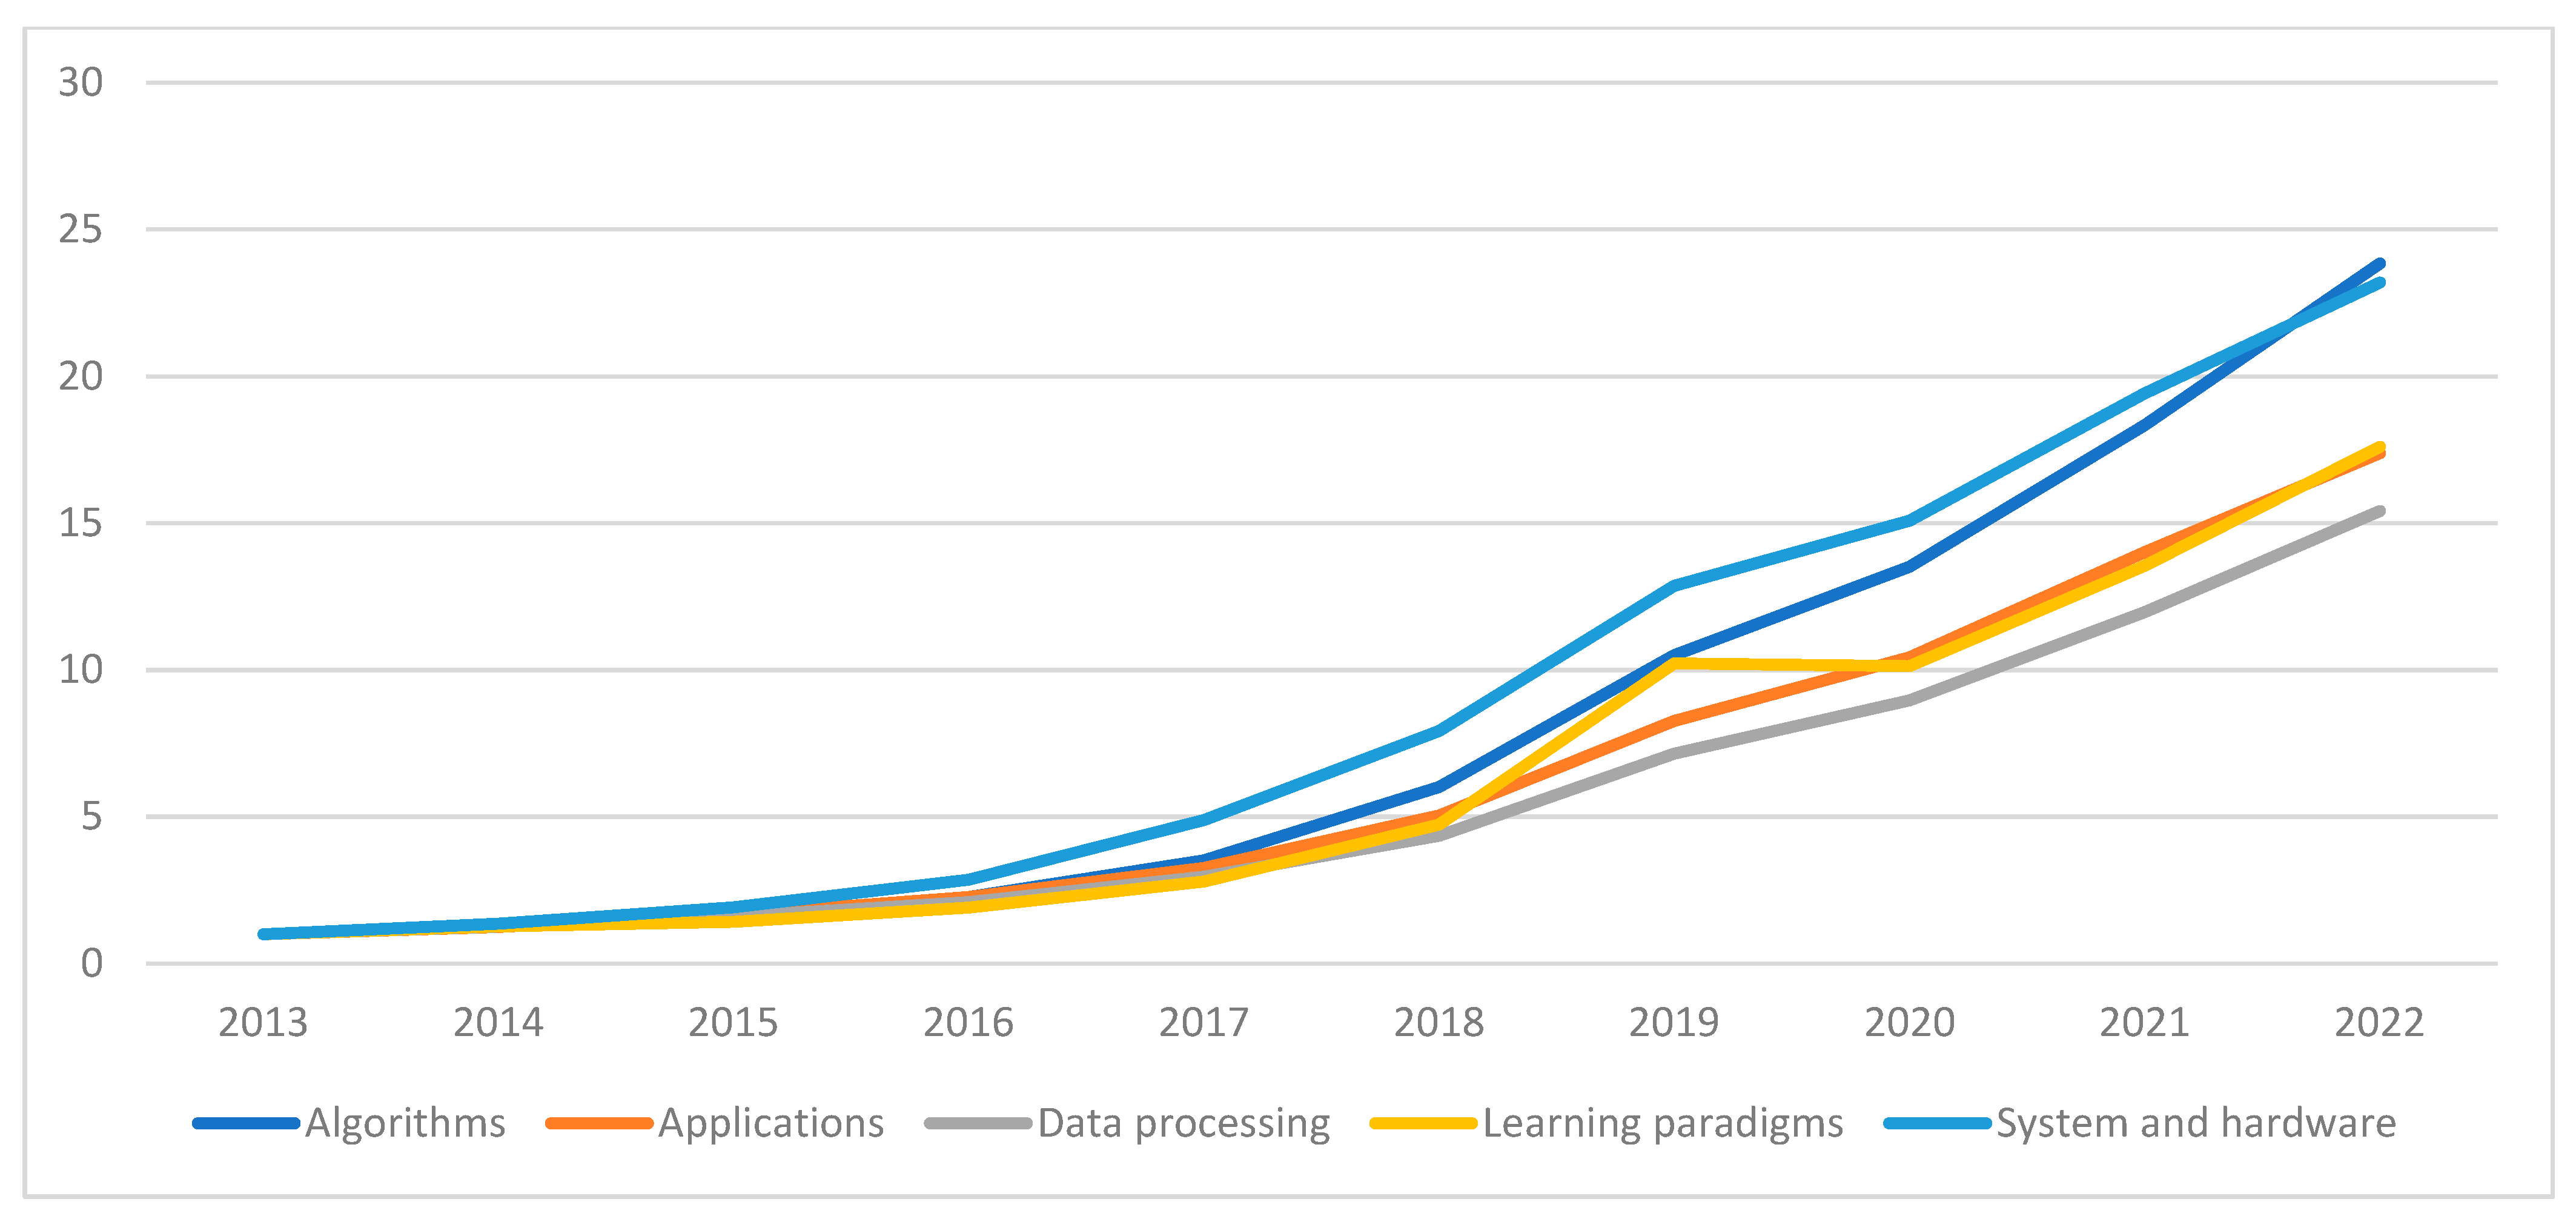
4.2. Trends in ML Research

Figure 4 shows that the total number of documents in ML is increasing rapidly, and the increase rate has been constant during the last years, i.e., the line is more or less linear during the last years.
Figure 5 shows that Algorithms and Applications are the two largest research directions in ML. Figure 6 shows that all the five top-level research directions in ML are growing. However, Algorithms and System and hardware are the directions that have grown fastest during the 10-year period from 2013 to 2022. Figure 6 shows that the research direction Learning paradigms has a local maximum 2019. By looking at the keywords included in this research direction, it was clear that the reason for this local maximum was related to the keyword ‘reinforcement learning’ (see Figure 7). We believe that the peak in interest in reinforcement learning during 2019 was related to the remarkable success of reinforcement learning in games such as Go and Chess during that period, e.g., the Go world champion Lee Sedol lost to AlphaGo in March 2016. For instance, MuZero, which is a computer program developed by the AI research company DeepMind to master games without knowing their rules, was released in 2019.
Figure 8 shows the average NCS for the five top-level research directions in ML from 2013 to 2022. The figure shows that documents in the research direction Learning paradigms are the most cited ones (NCS = 1.16) and that documents in the research direction System and hardware have the lowest number of citations (NCS = 0.99). One can see that the average of the four NCS values shown in Figure 8 is more than 1. By definition, the average NCS for all documents was 1. However, as mentioned previously, some documents may belong to many research directions, and some other documents may not belong to any research direction. Since the average of the NCS values in Figure 8 is larger than 1, it seems that documents with many citations tend to belong to many research directions.

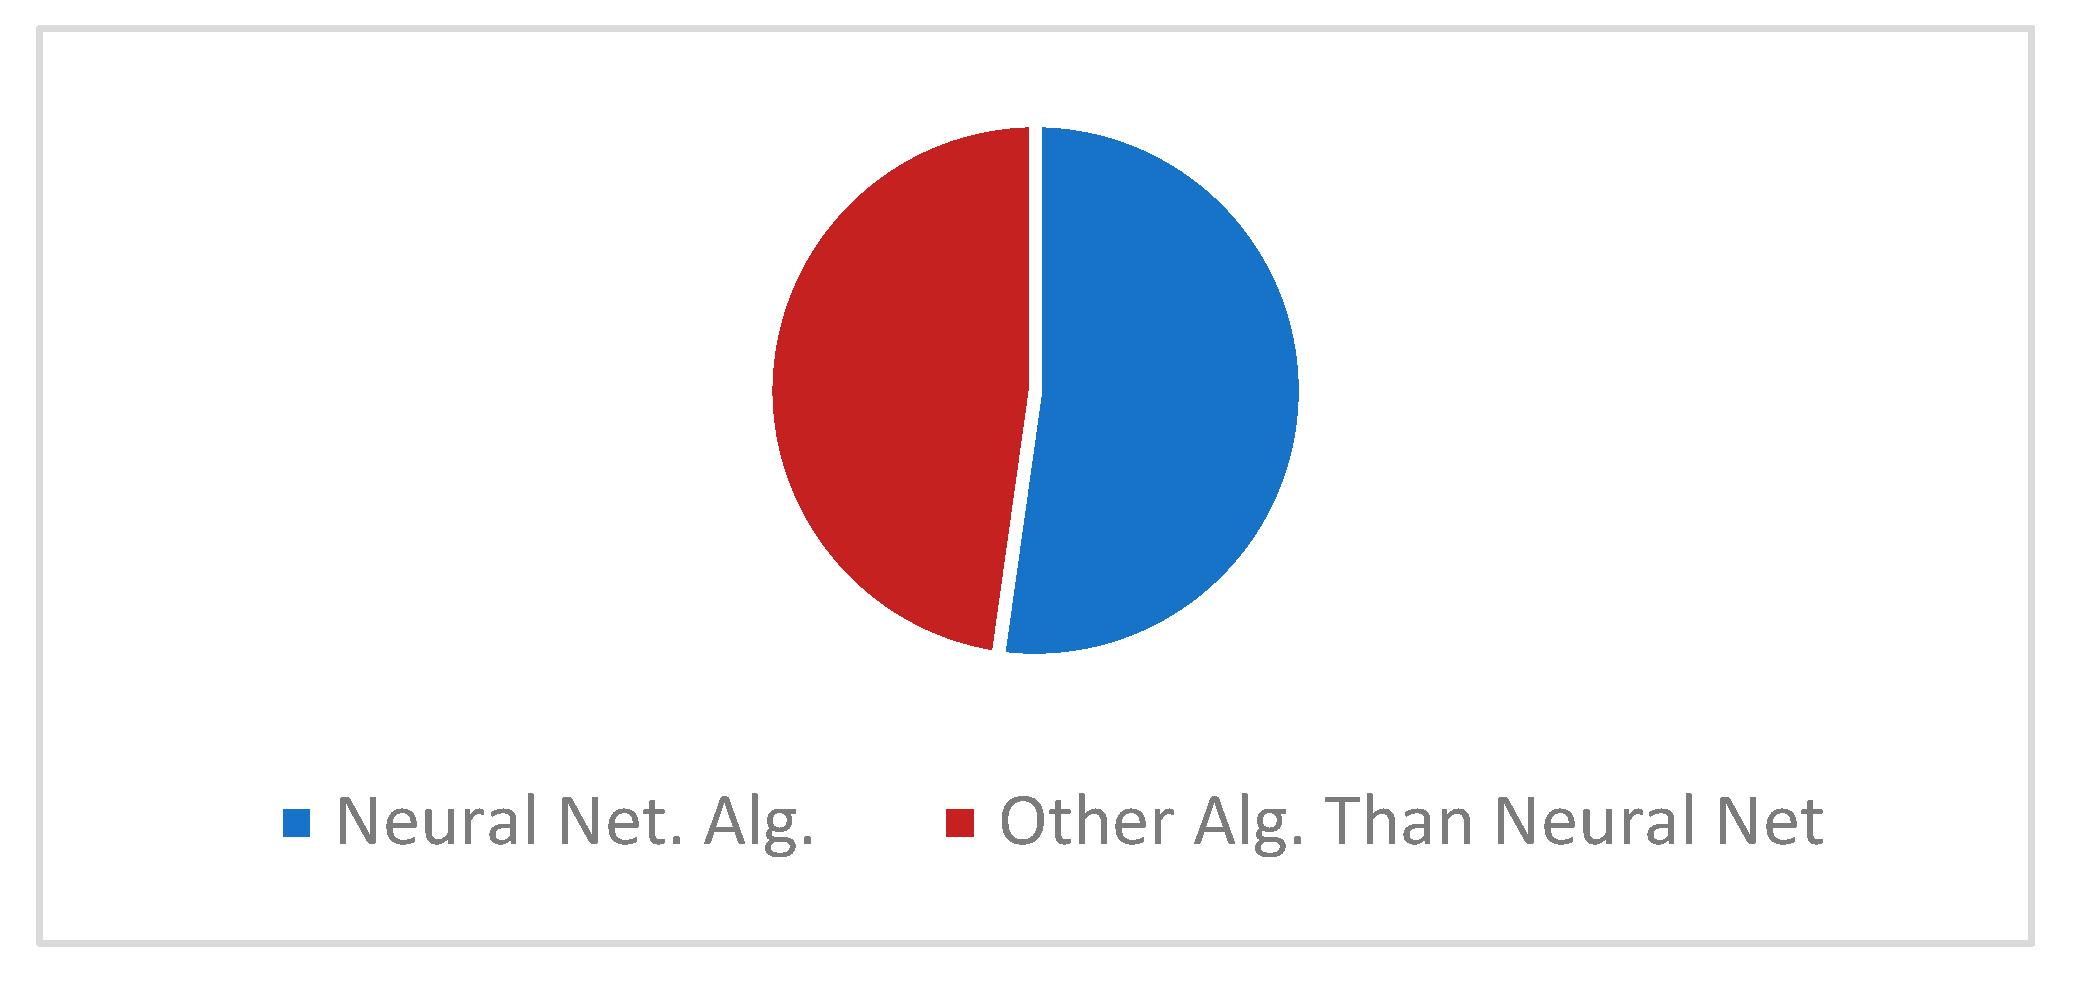
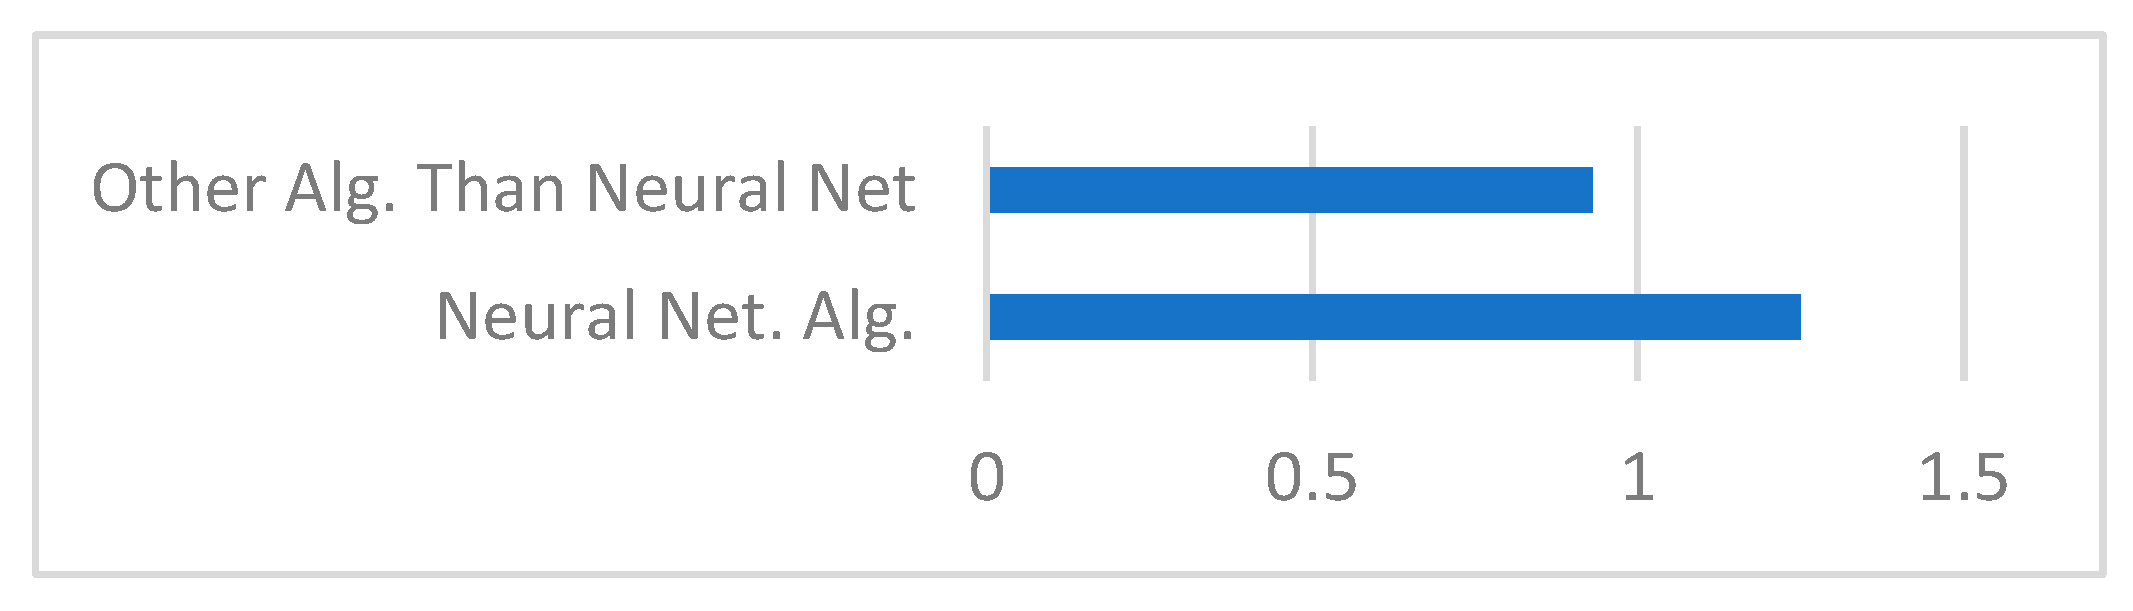
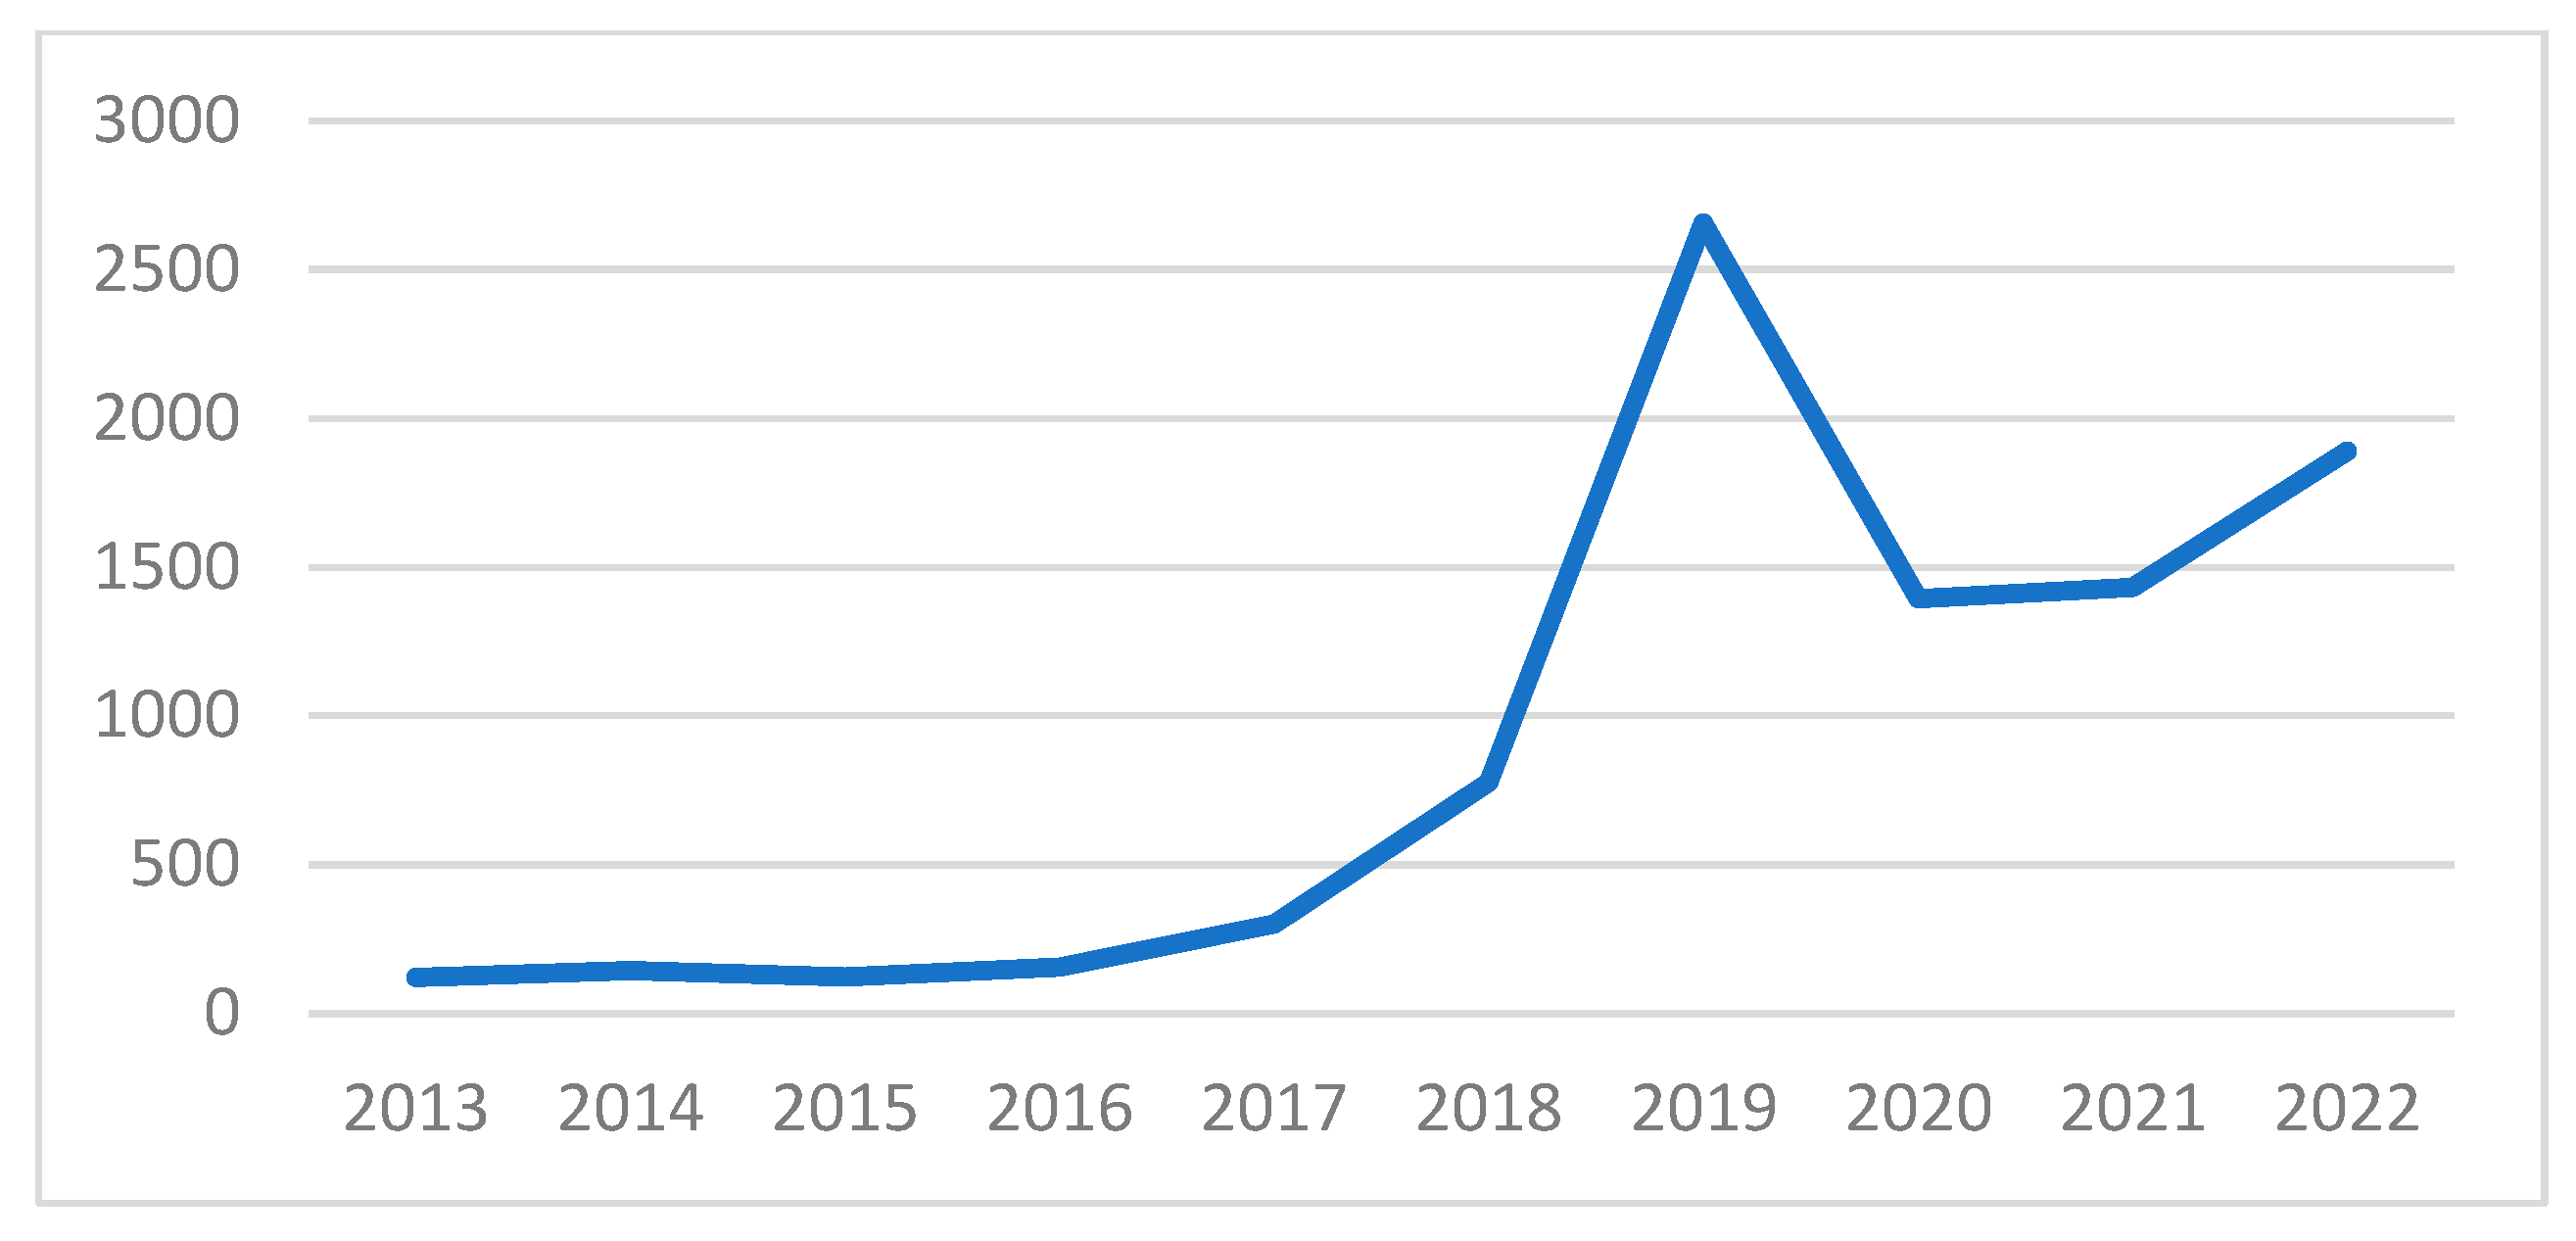
4.2.1. Trends for the Direction Algorithms in ML Research

As can be seen in the taxonomy in Figure 3, the research direction Algorithms was divided into two categories: Neural Networks and Algorithms other than NN or Other Algorithms Than Neural Networks. Figure 9 shows that these two categories contain almost the same number of documents (Neural Networks is slightly larger). Figure 10 shows that the category Neural Network is growing significantly faster than the other category.
Figure 11 shows the NCS for the two categories in the research direction Algorithms. The figure shows that, on average, documents in the category Neural Networks have more citations than documents in the other category.

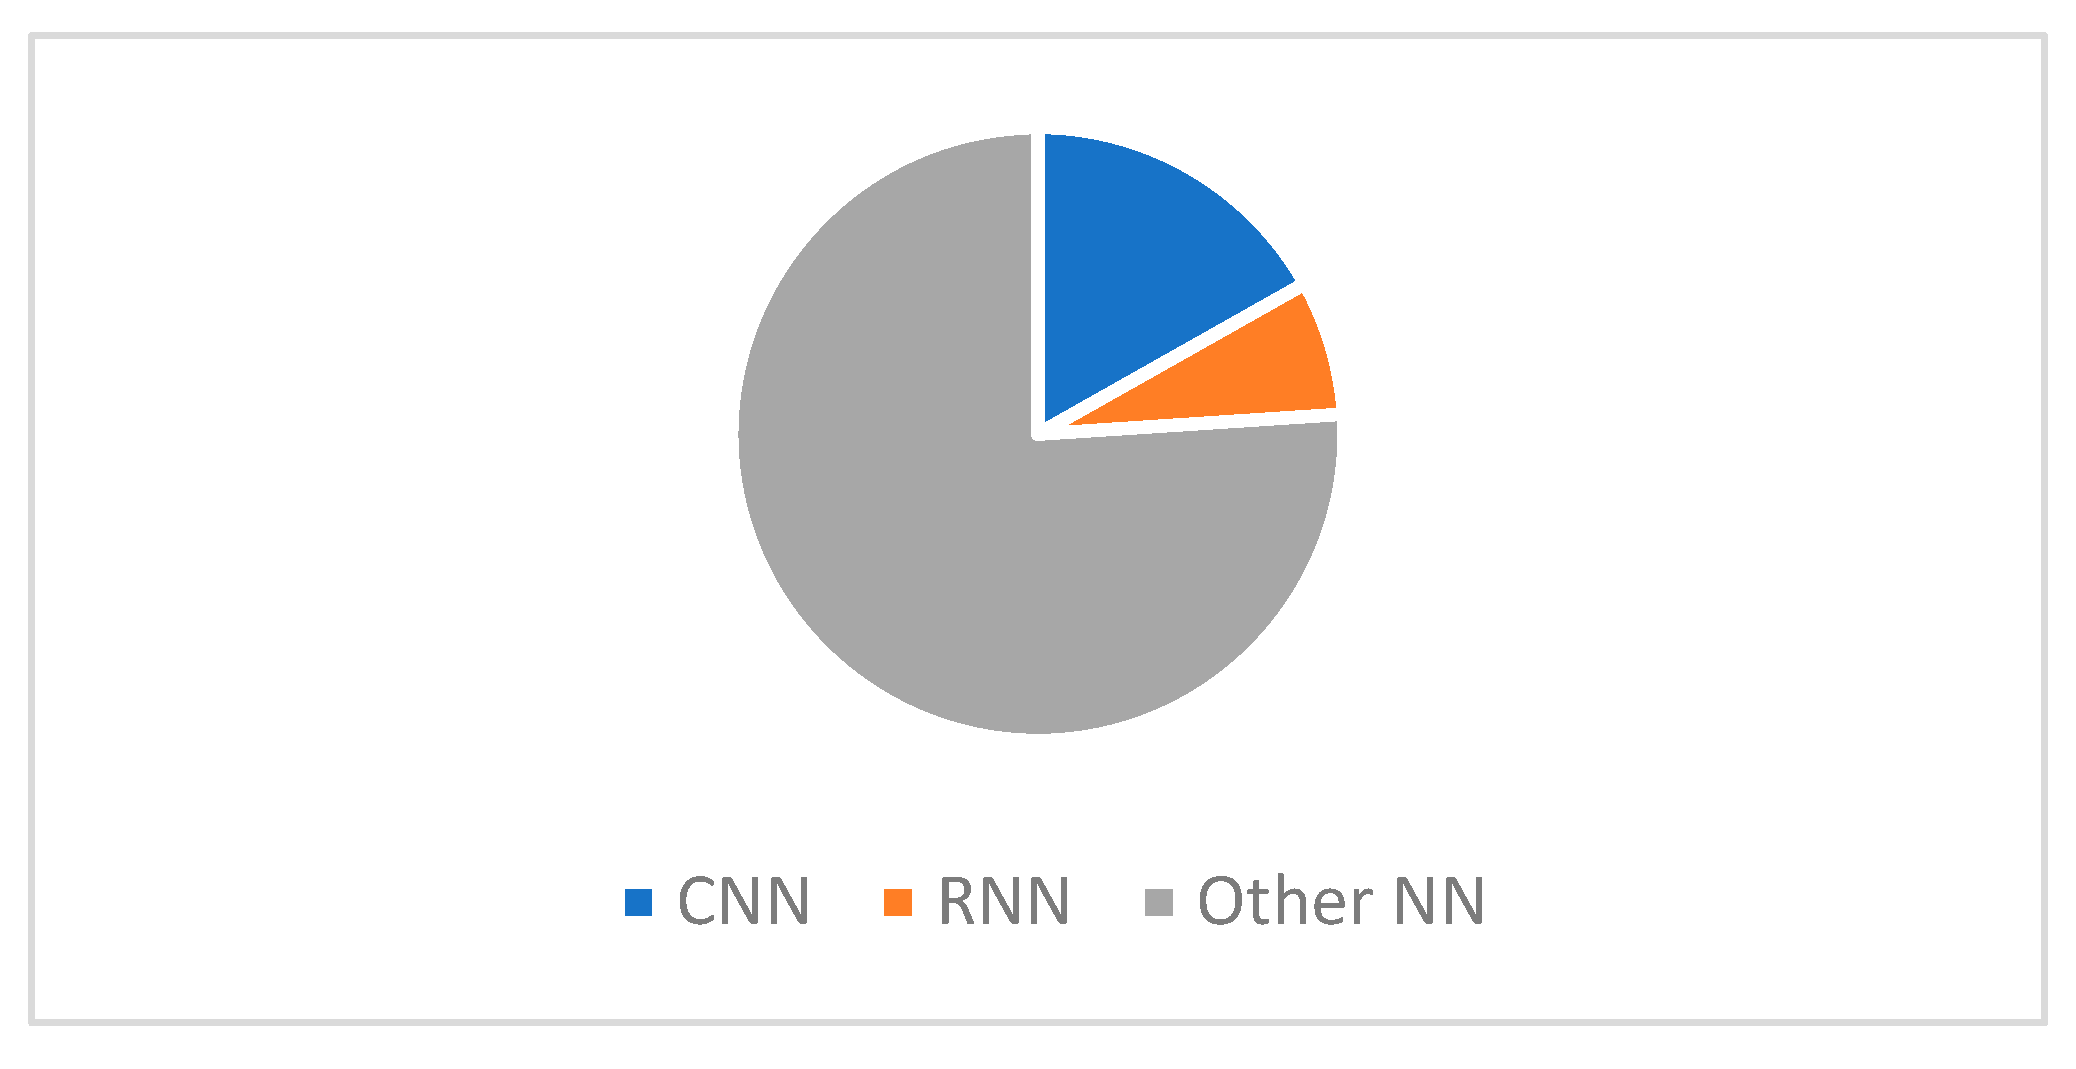
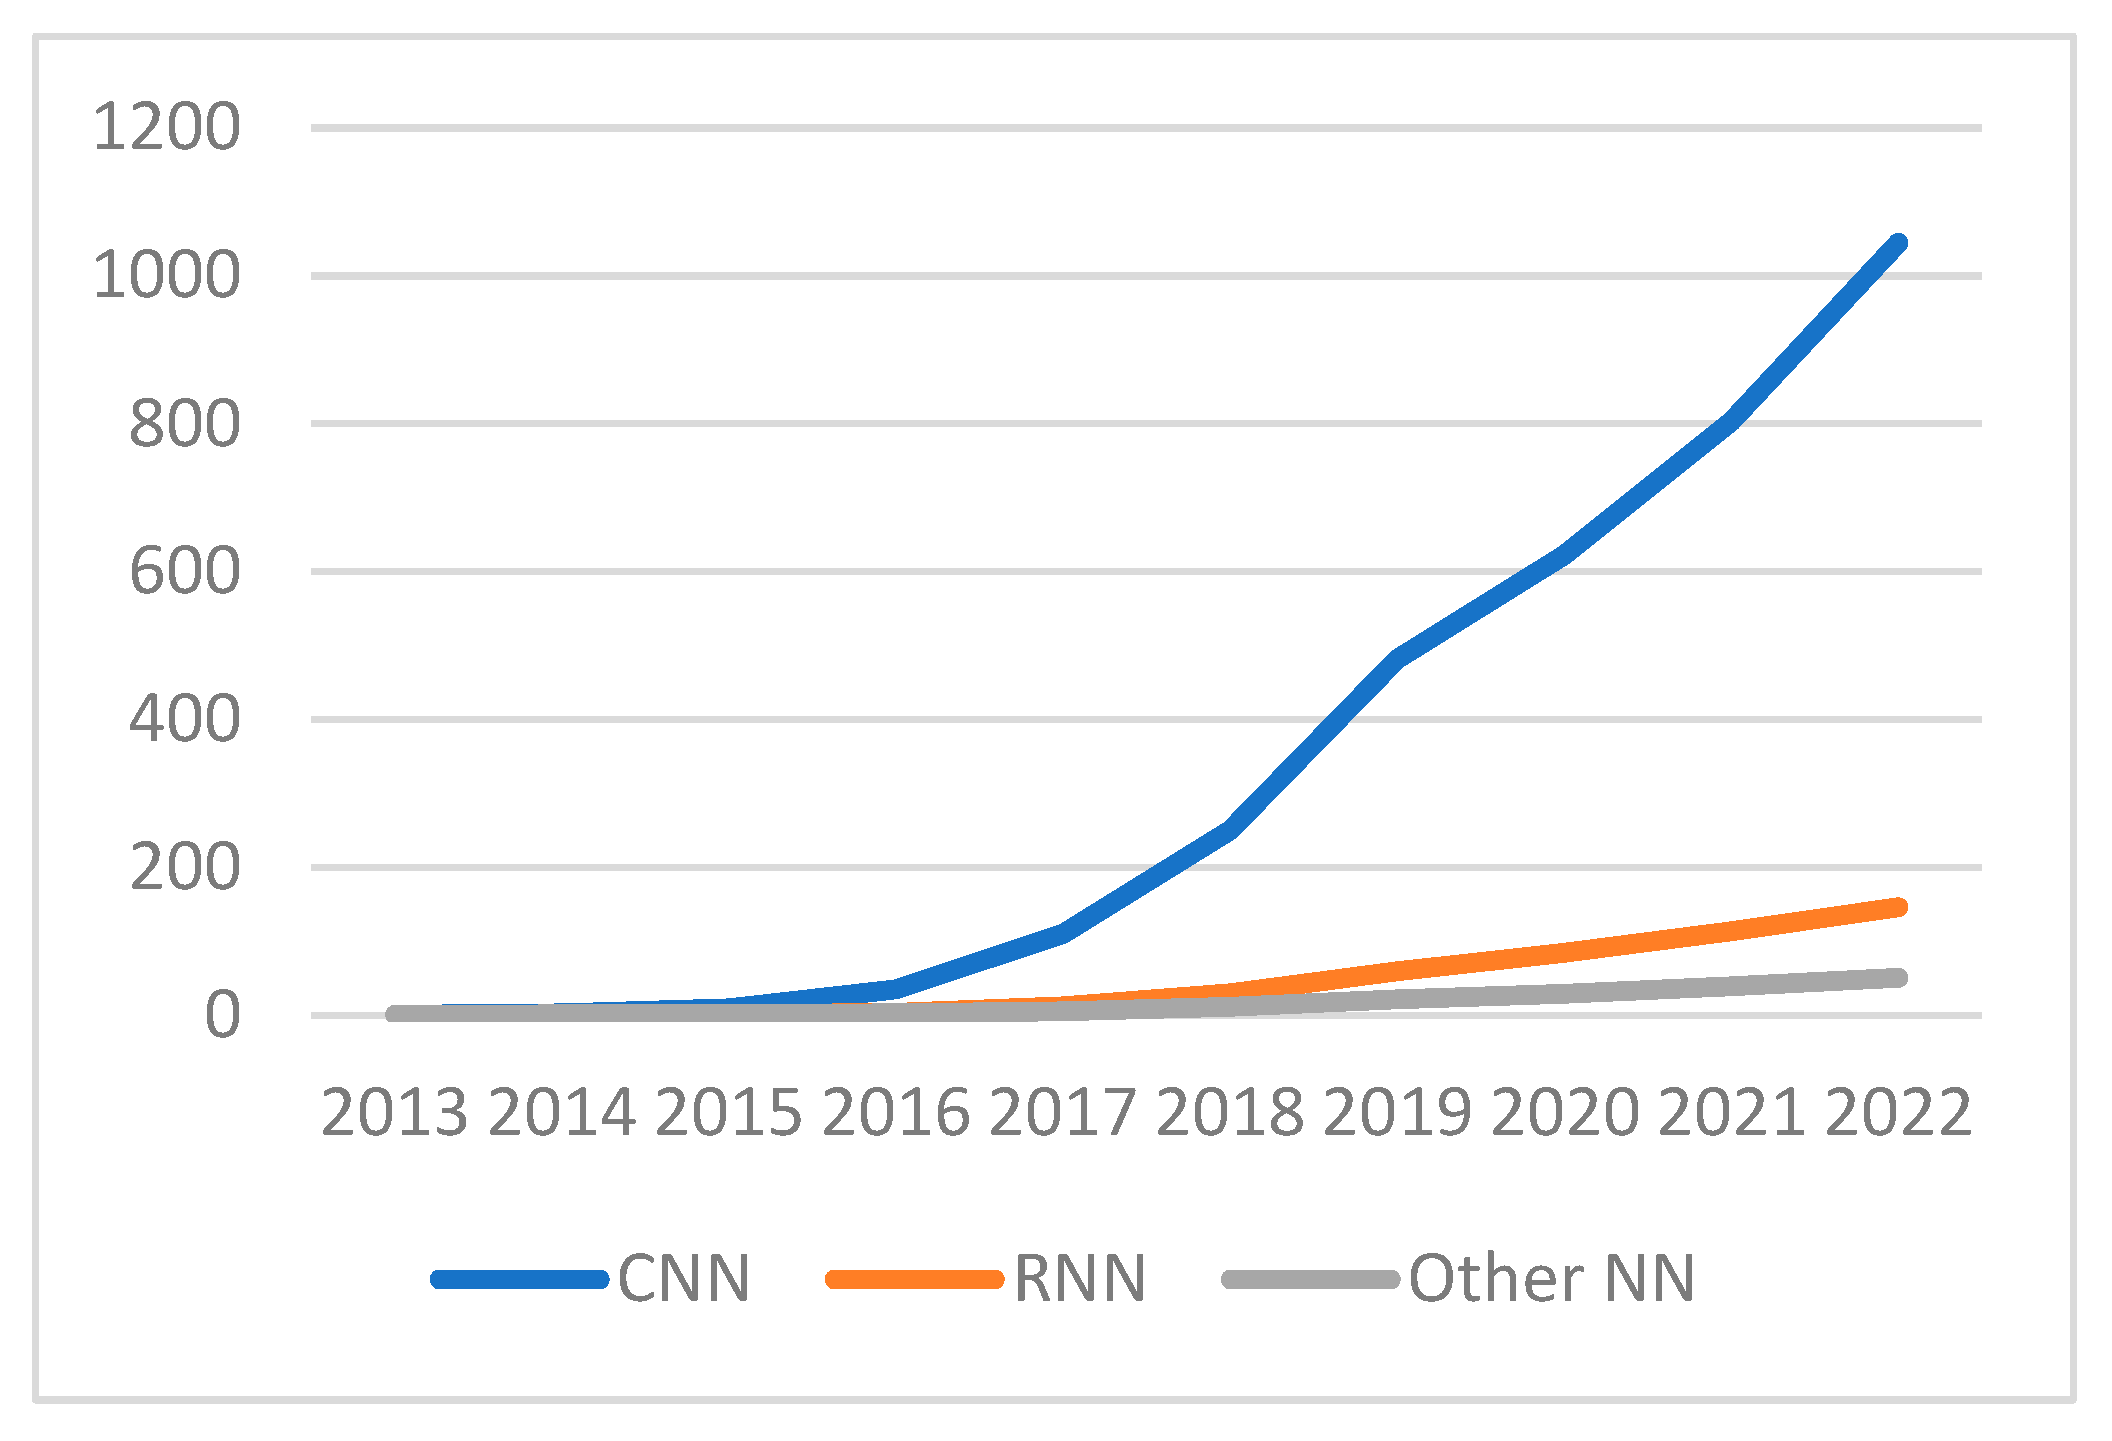
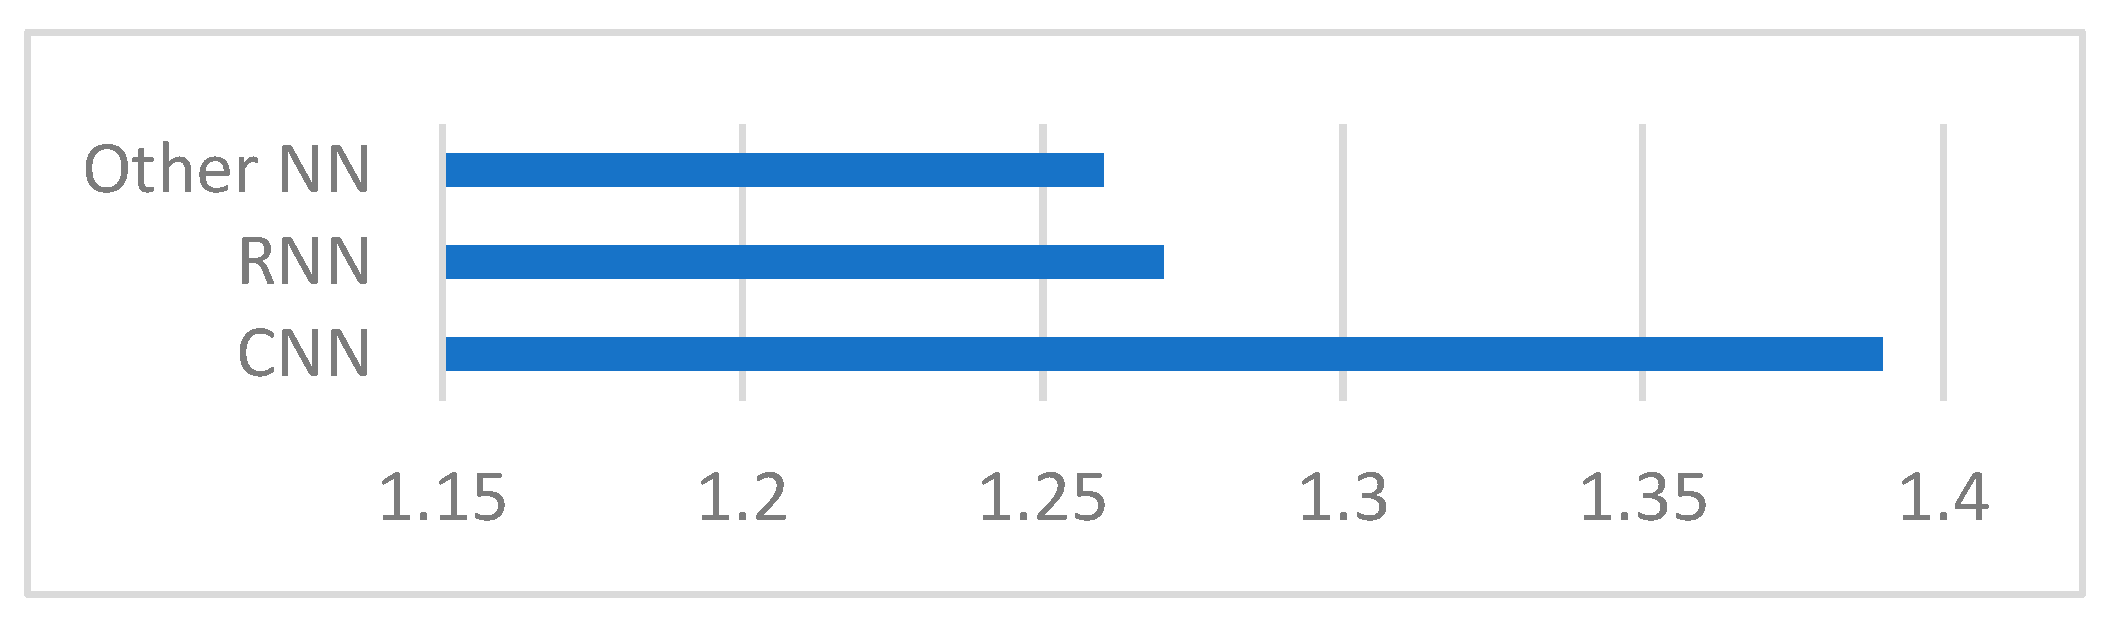
4.2.2. Trends for Research on Neural Networks

The taxonomy in Figure 3 shows that the research direction Neural Networks can be split into three categories: CNN (Convolutional Neural Networks), RNN (Recurrent Neural Networks), and Other Neural Network Algorithms. Figure 12 shows that the category Other Neural Network Algorithms contains the largest number of documents for the time period considered. Figure 13 shows that the research direction CNN is growing very rapidly.
Figure 14 shows that, on average, documents belonging to the research direction CNN have more citations compared with the other two categories.

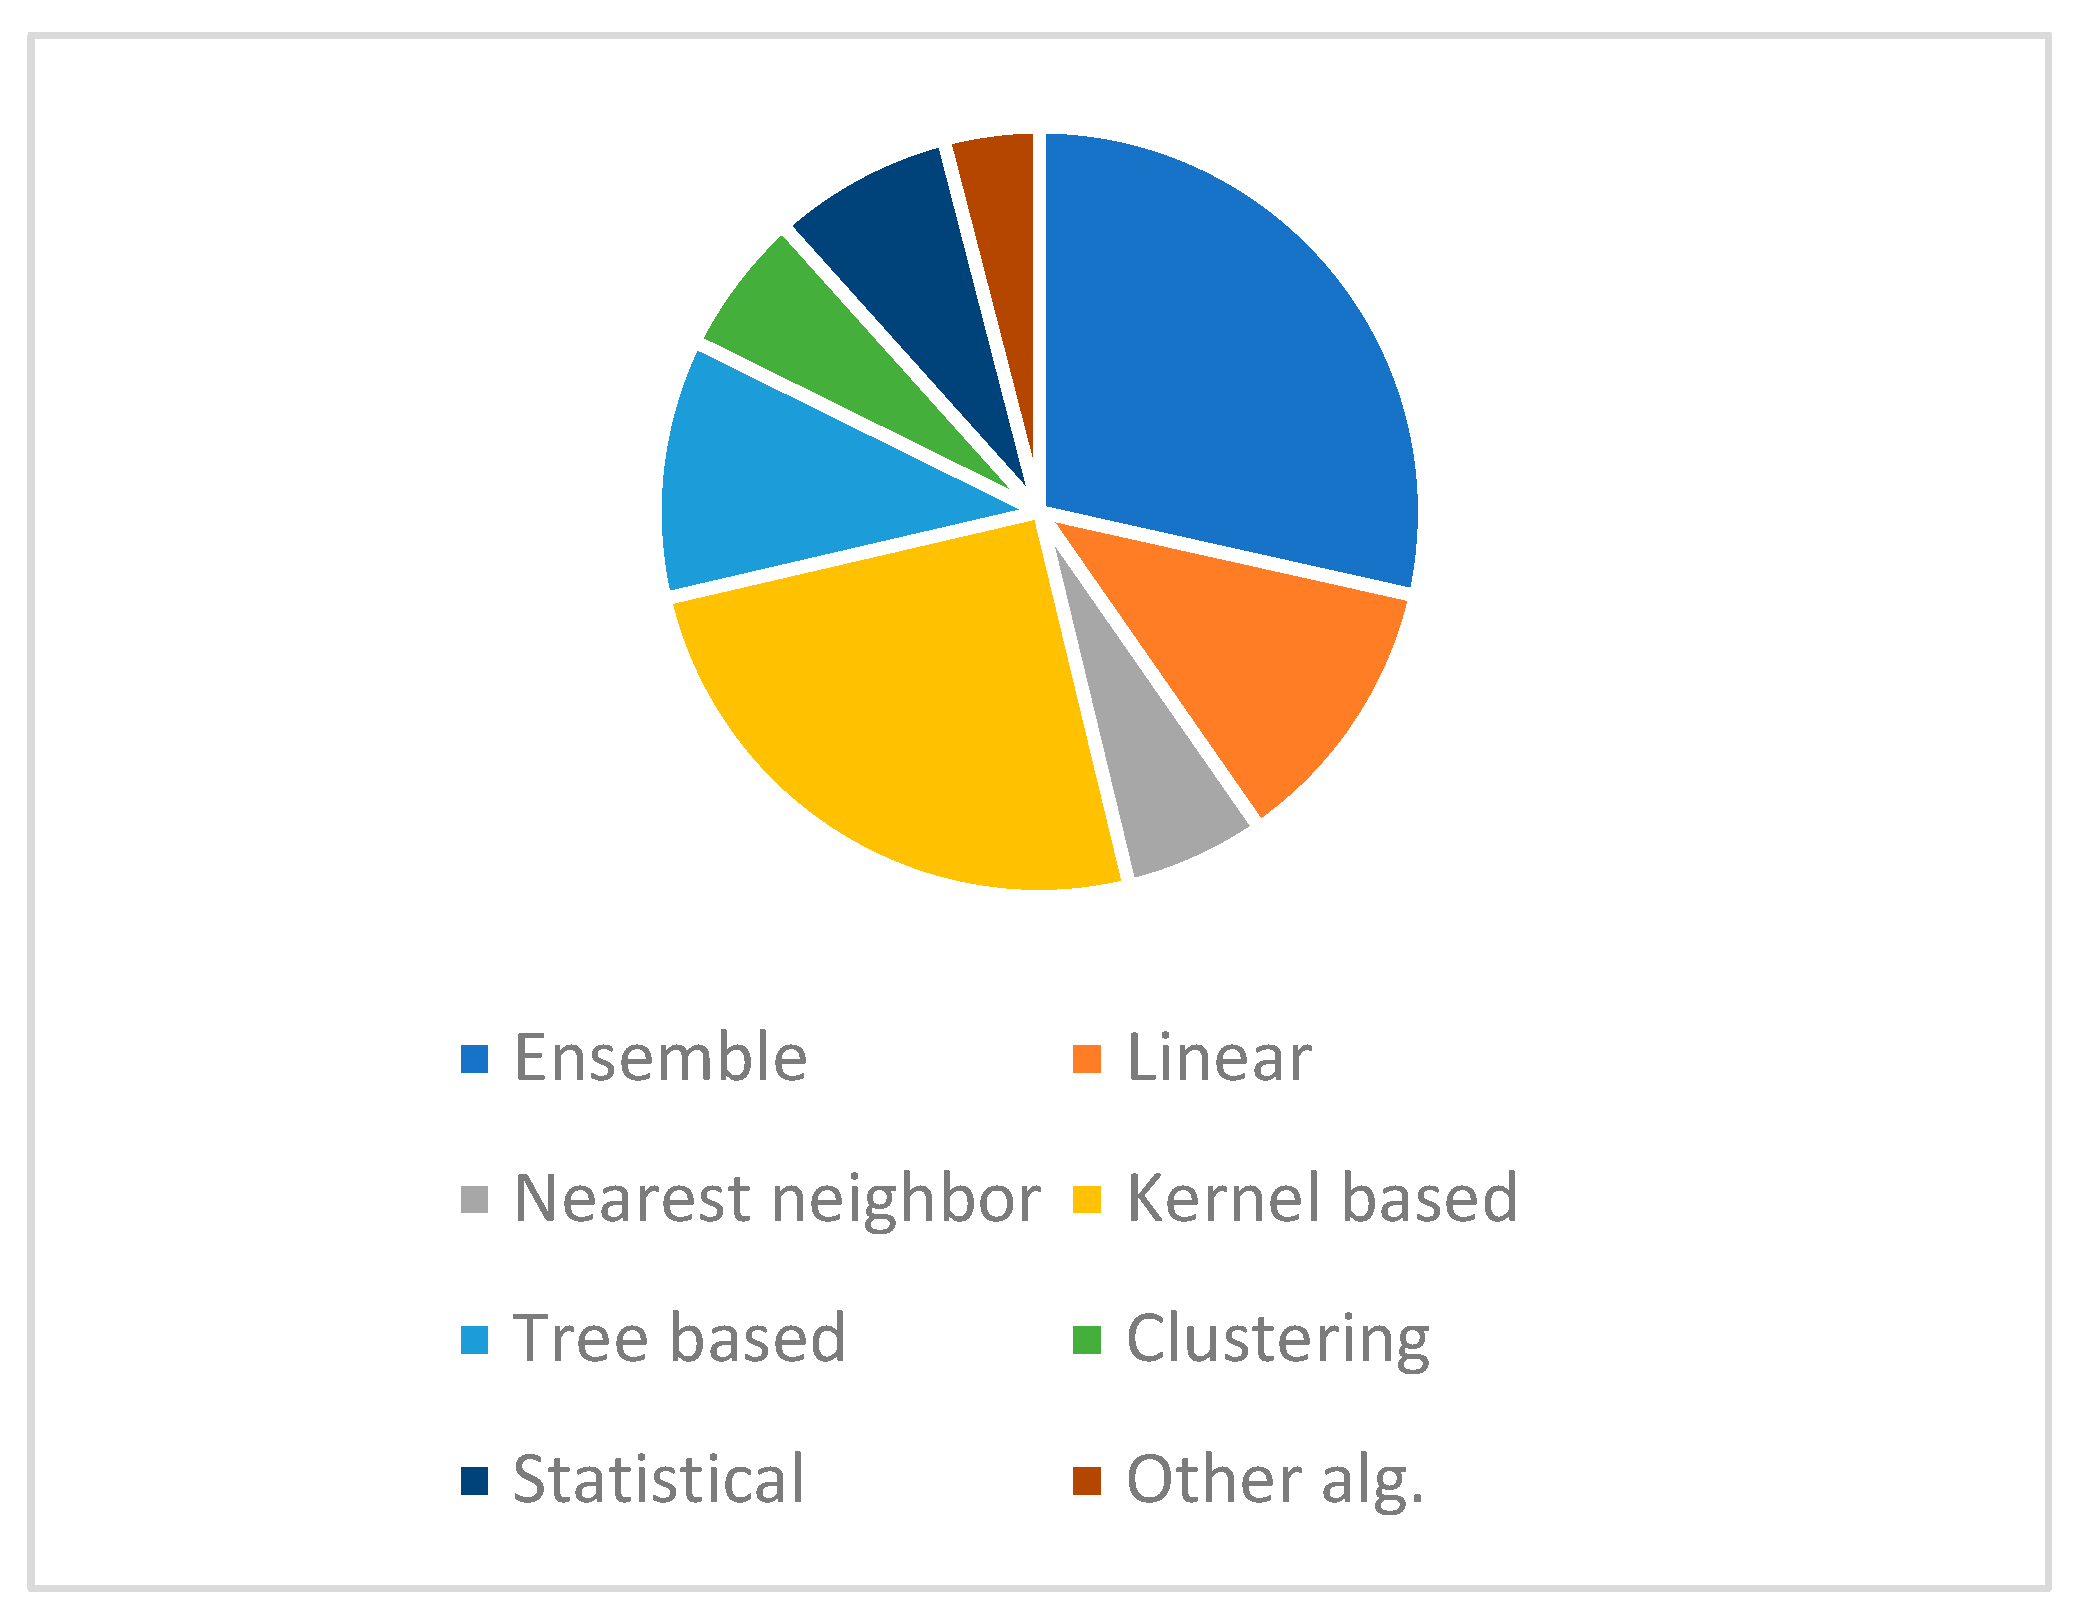
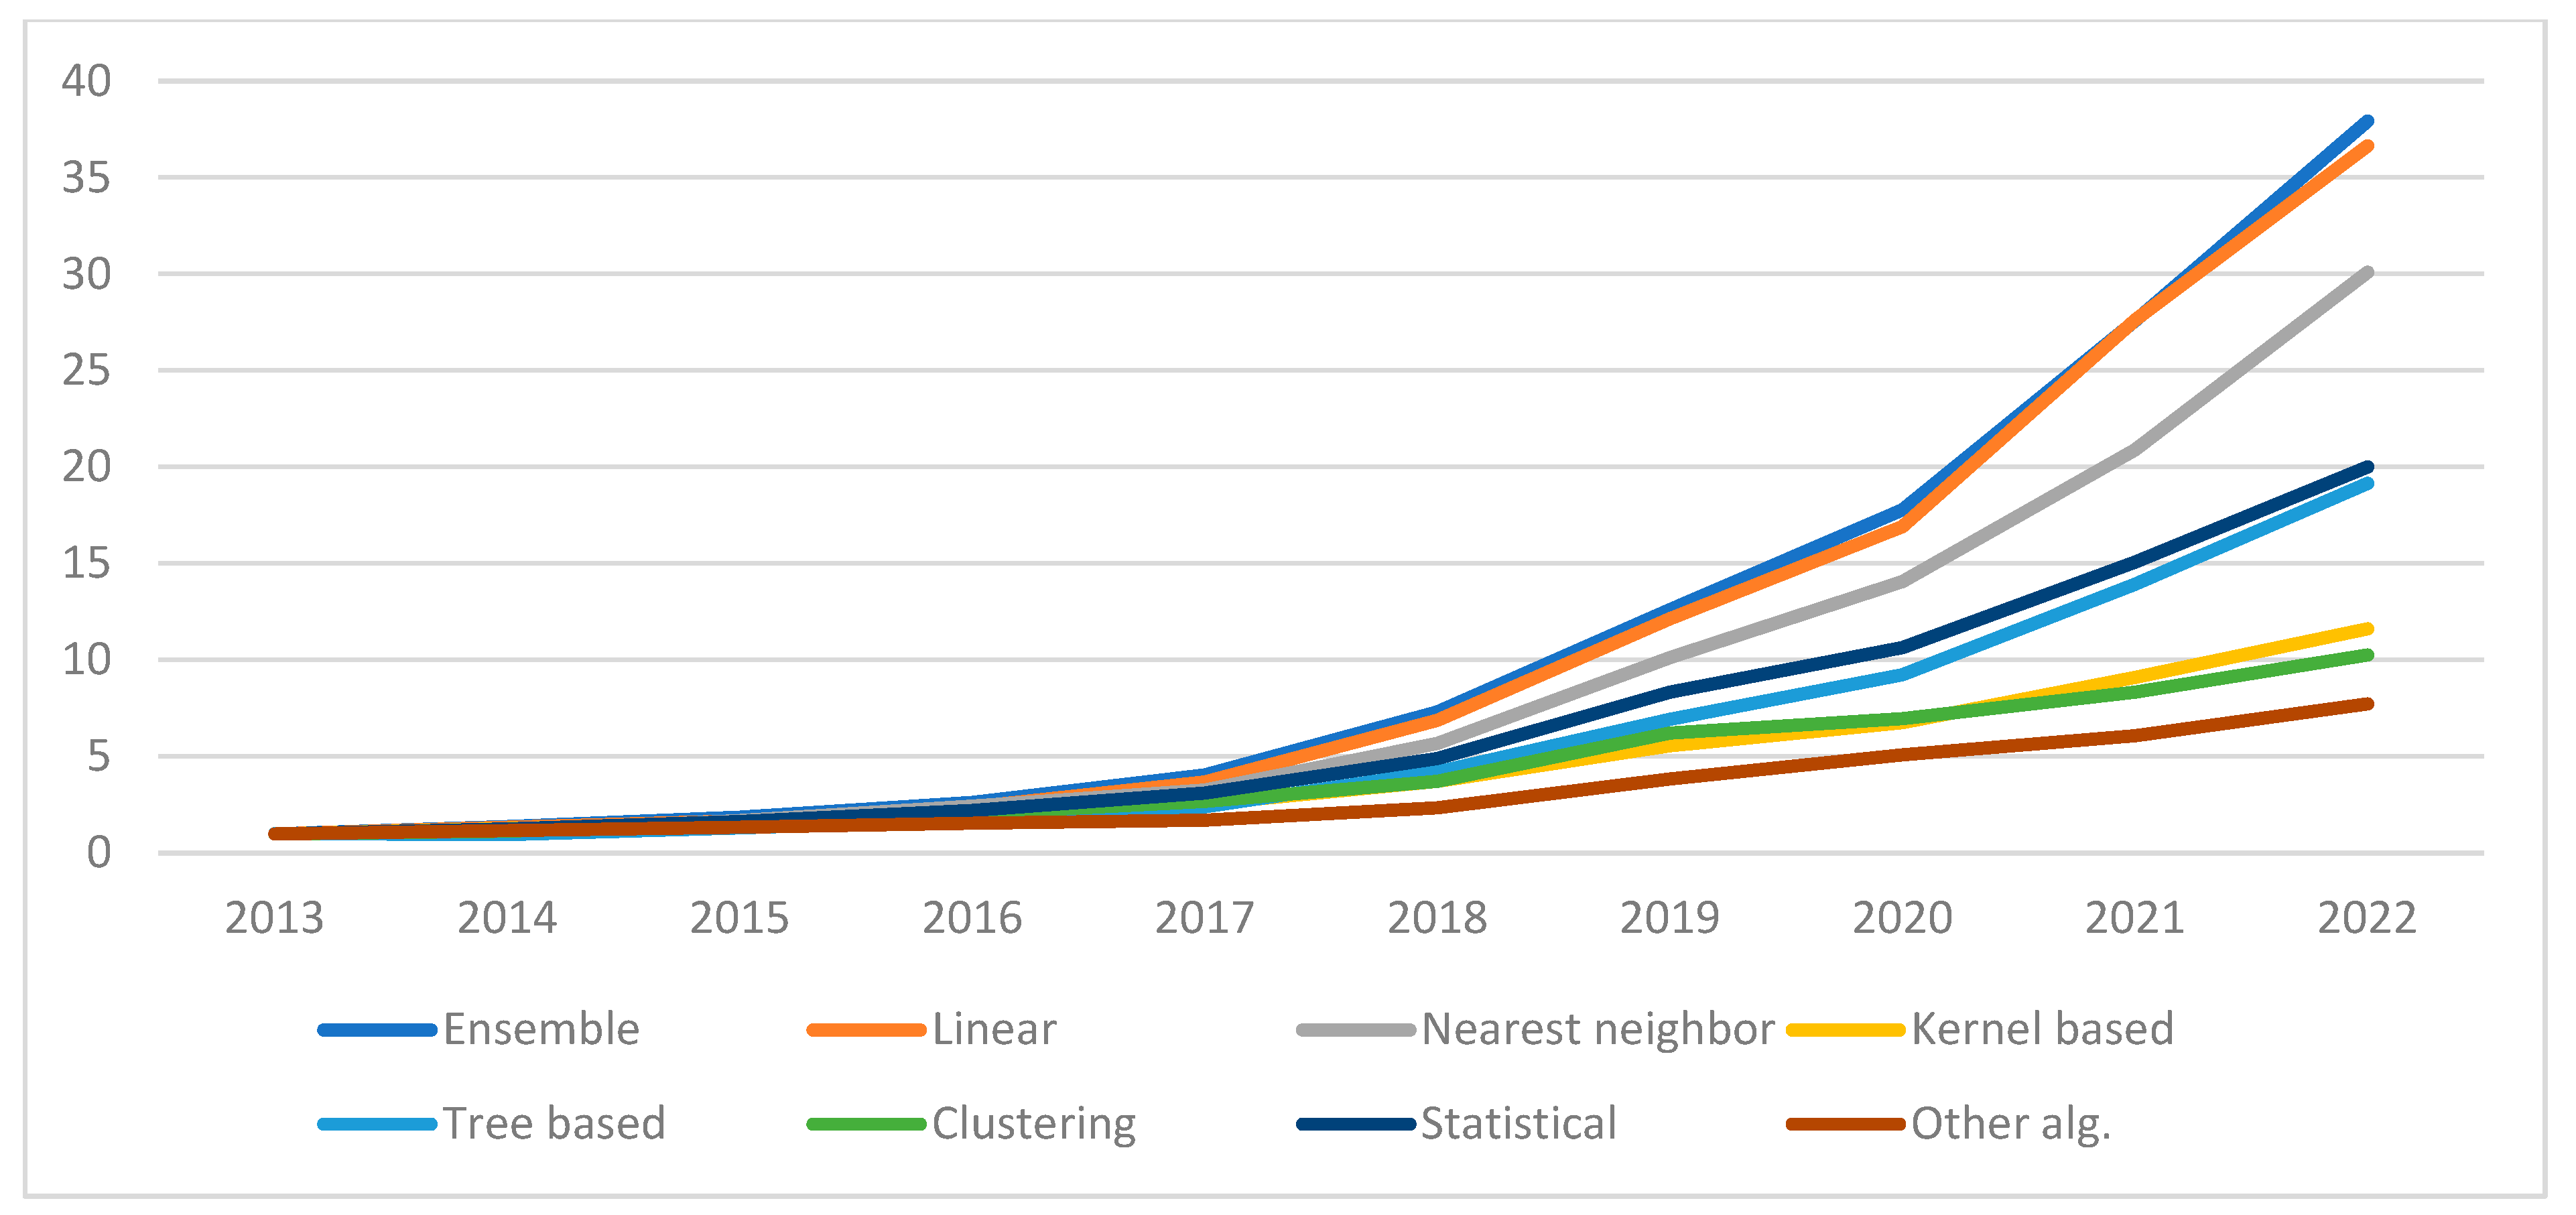
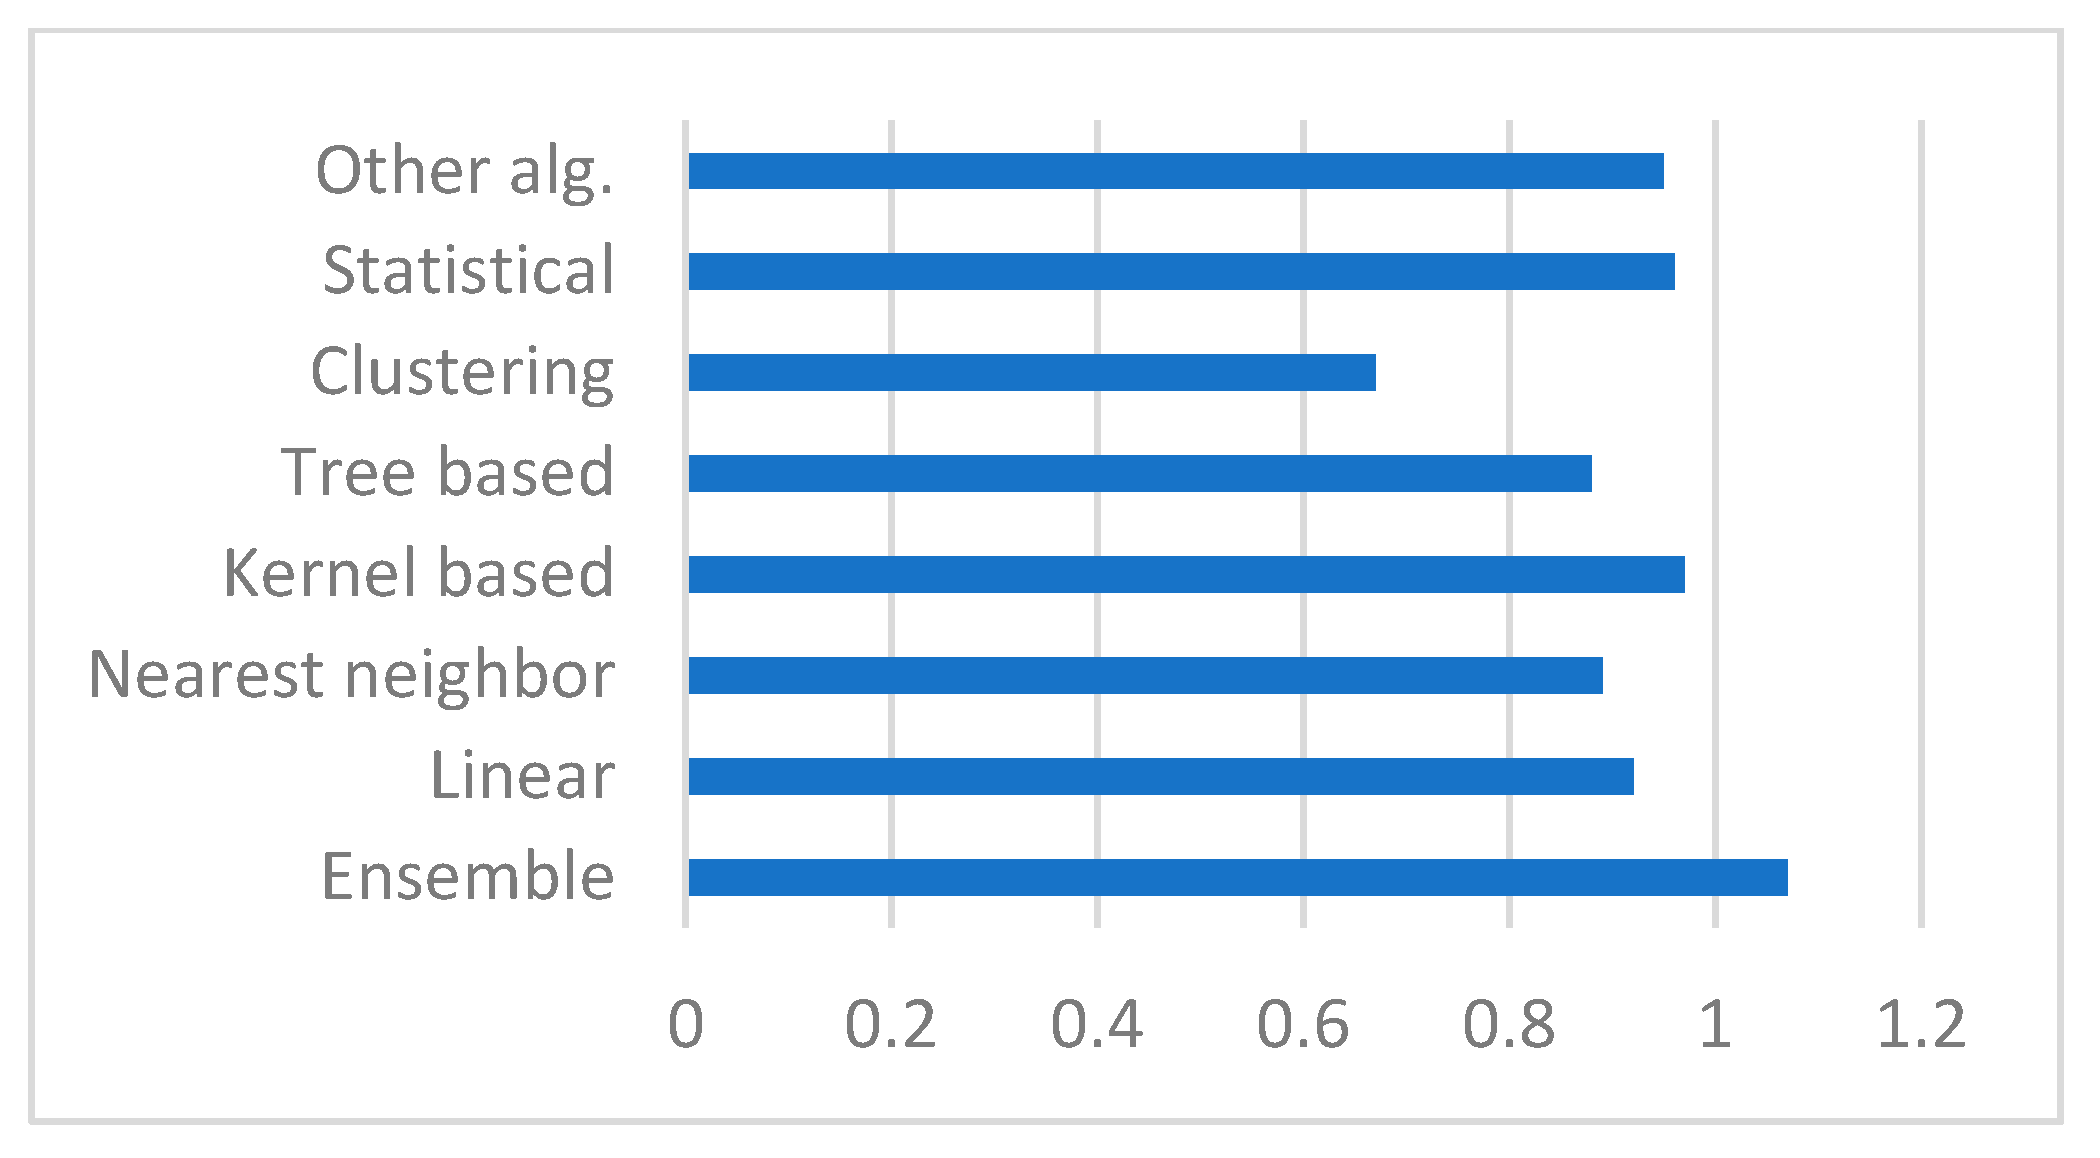
4.2.3. Trends for Research on Algorithms Other than Neural Networks

The taxonomy in Figure 3 shows that the research direction Other Algorithms Than Neural Networks can be split into eight categories: Ensemble methods, Linear methods, Nearest Neighbor methods, Kernel-based methods, Tree-based methods, Clustering, Statistical methods, and Other algorithms. Figure 15 shows that the categories Ensemble methods and Kernel-based methods contain the largest number of documents for the time period considered. Figure 16 shows that the categories Ensemble methods and Linear methods are the categories within the research direction Other Algorithms Than Neural Networks that grow the fastest.
Figure 17 shows that, on average, documents belonging to the category Ensemble methods have more citations than the other categories in the research direction Other Algorithms Than Neural Networks. The figure also shows that documents belonging to the category Clustering have the smallest NCS value.

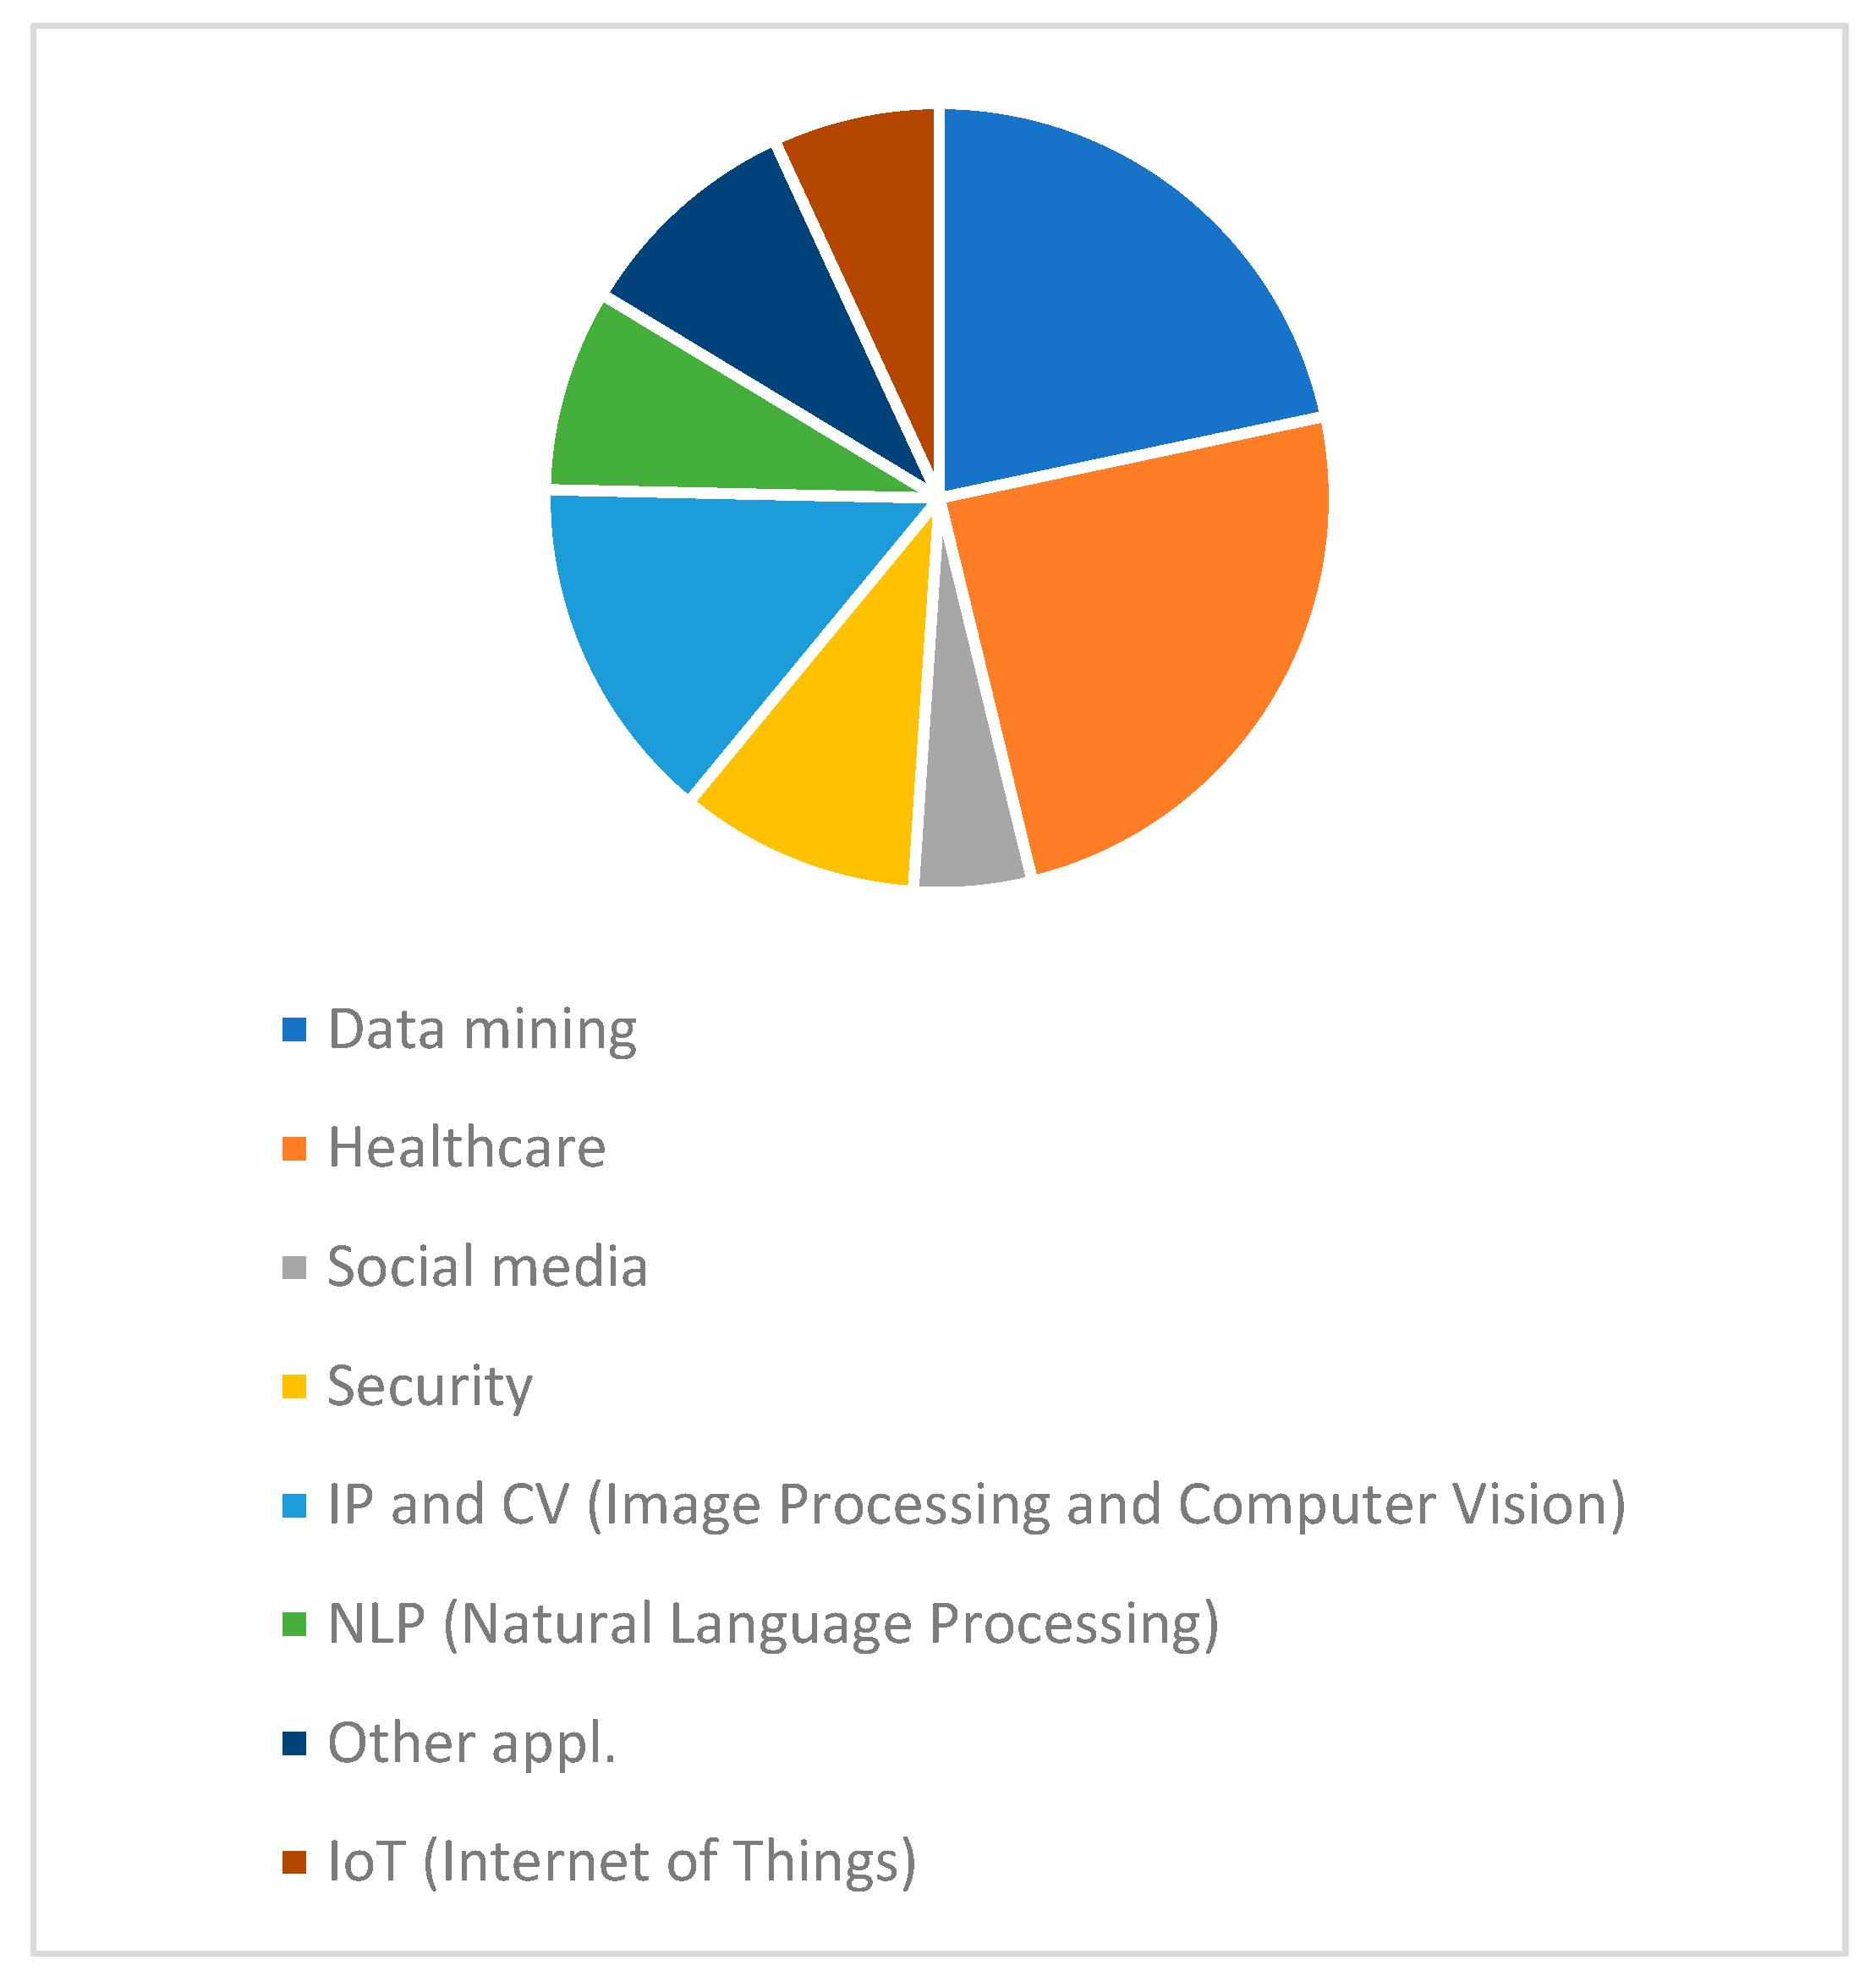
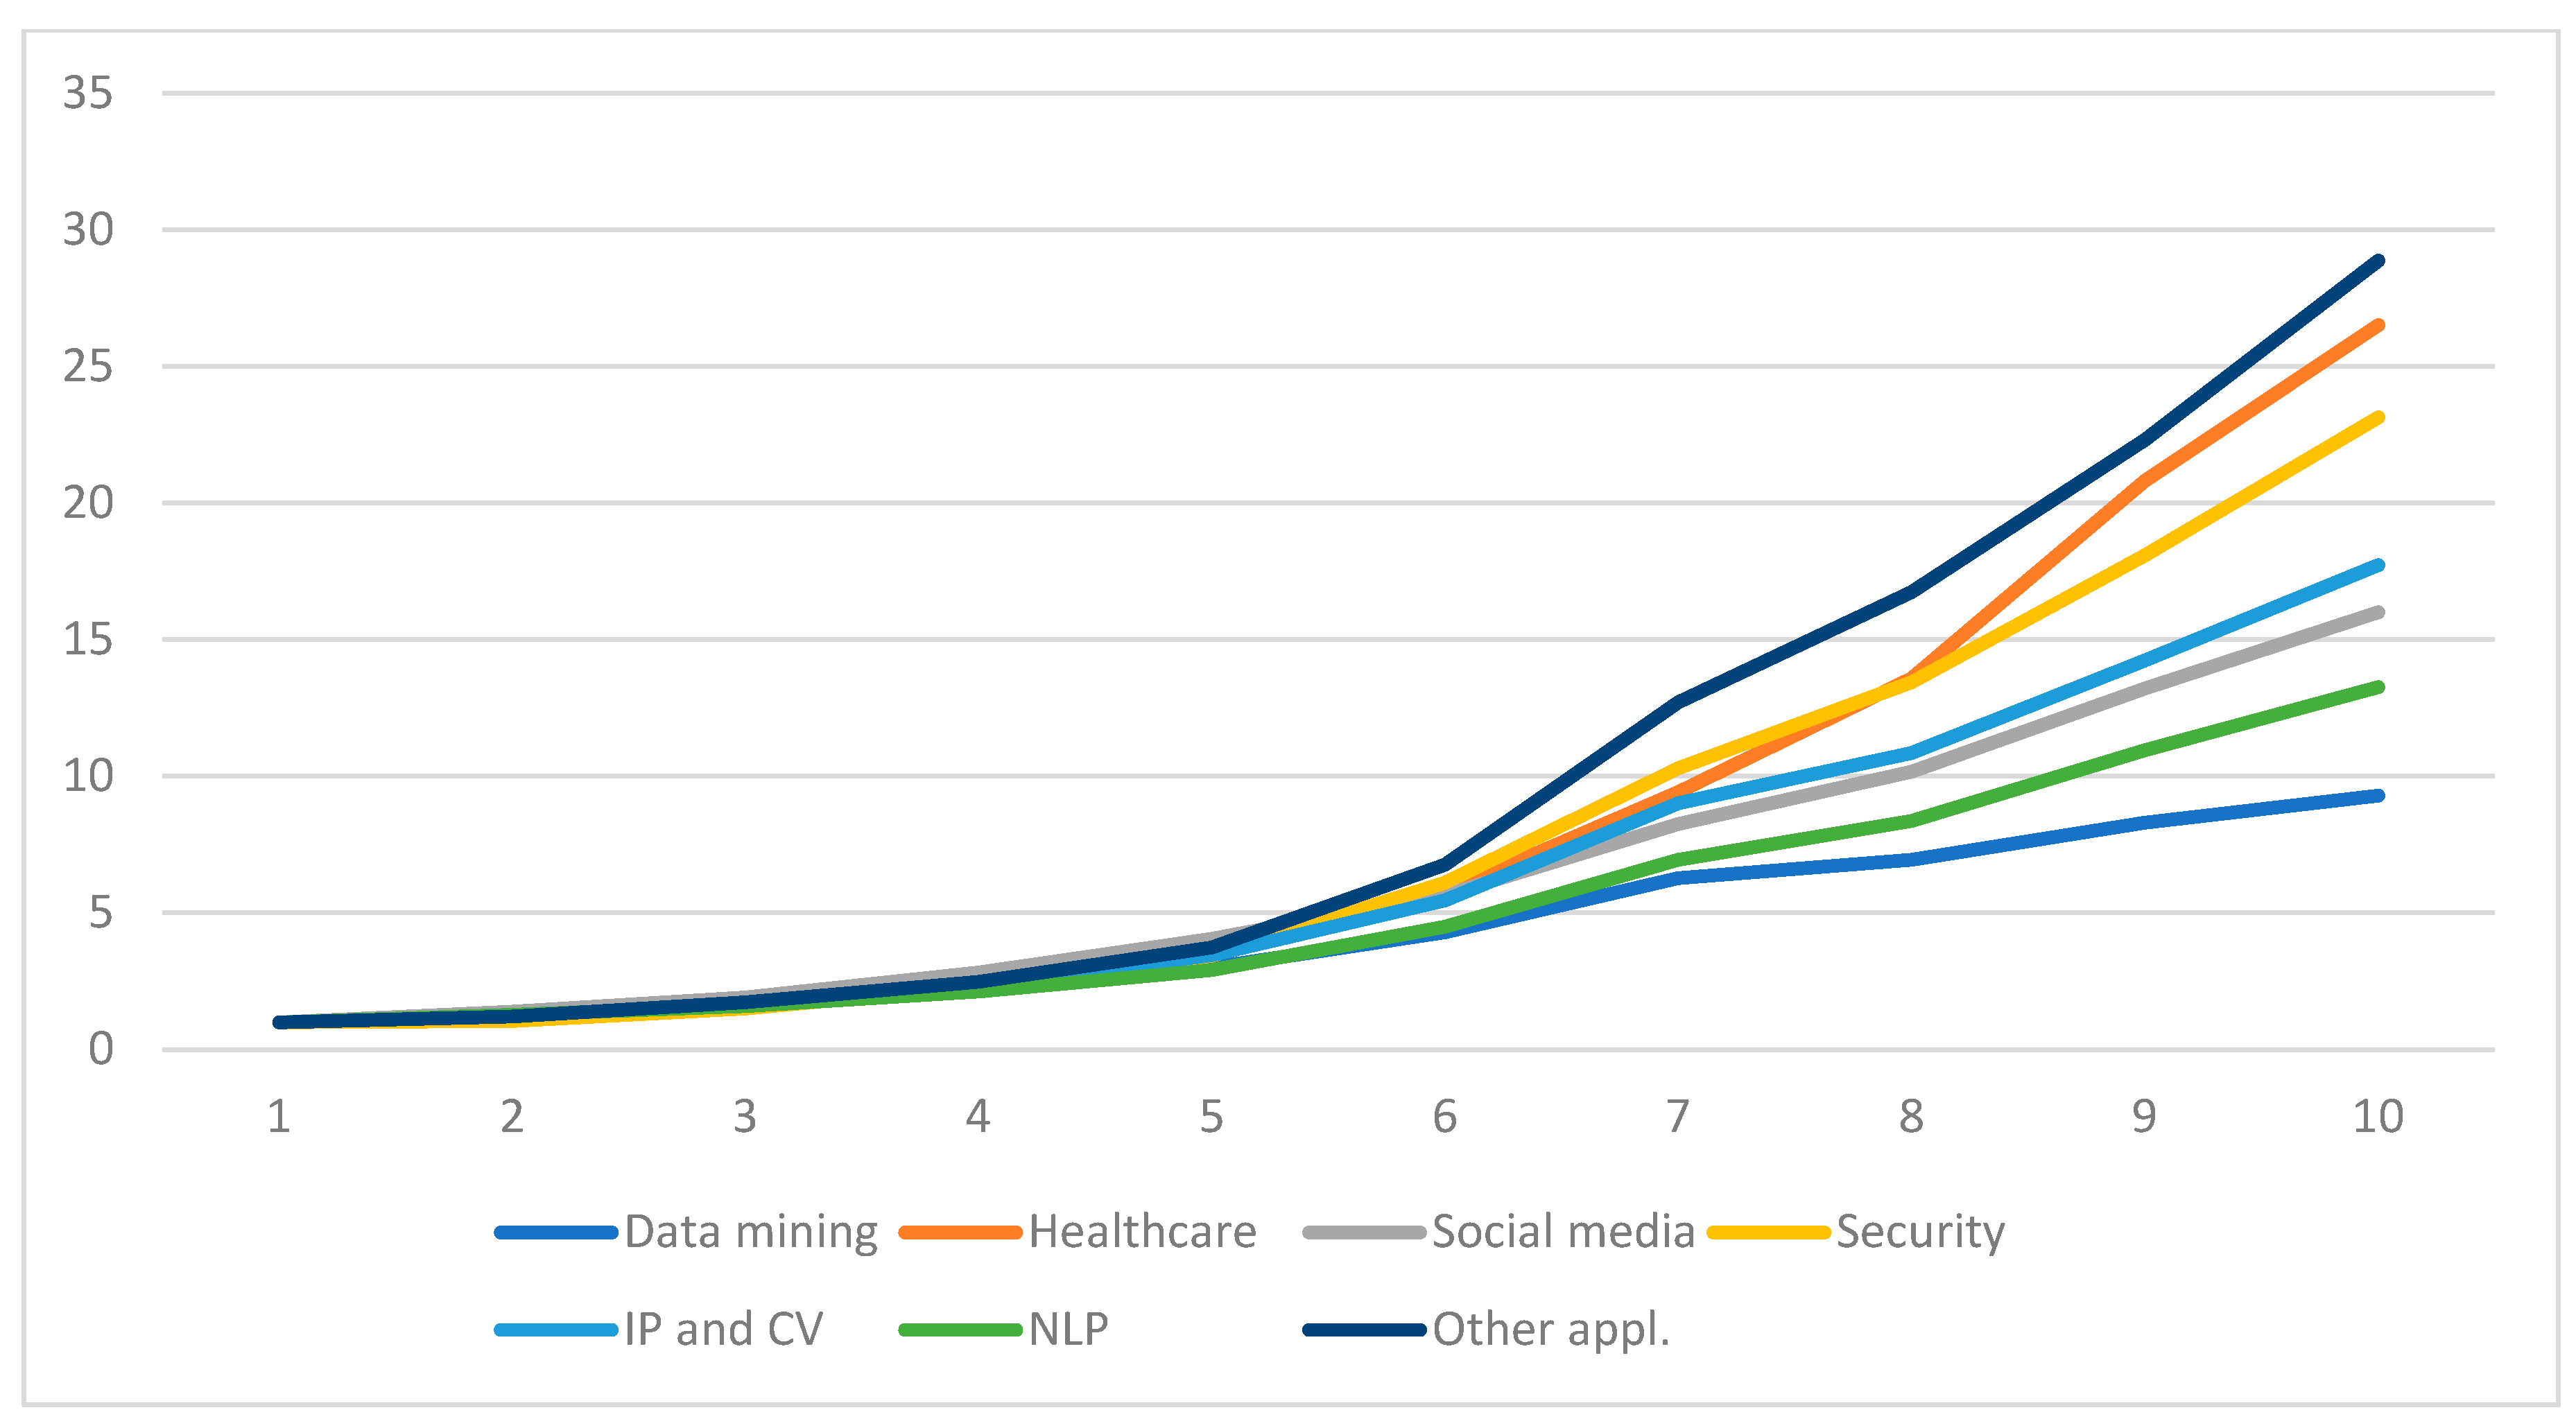
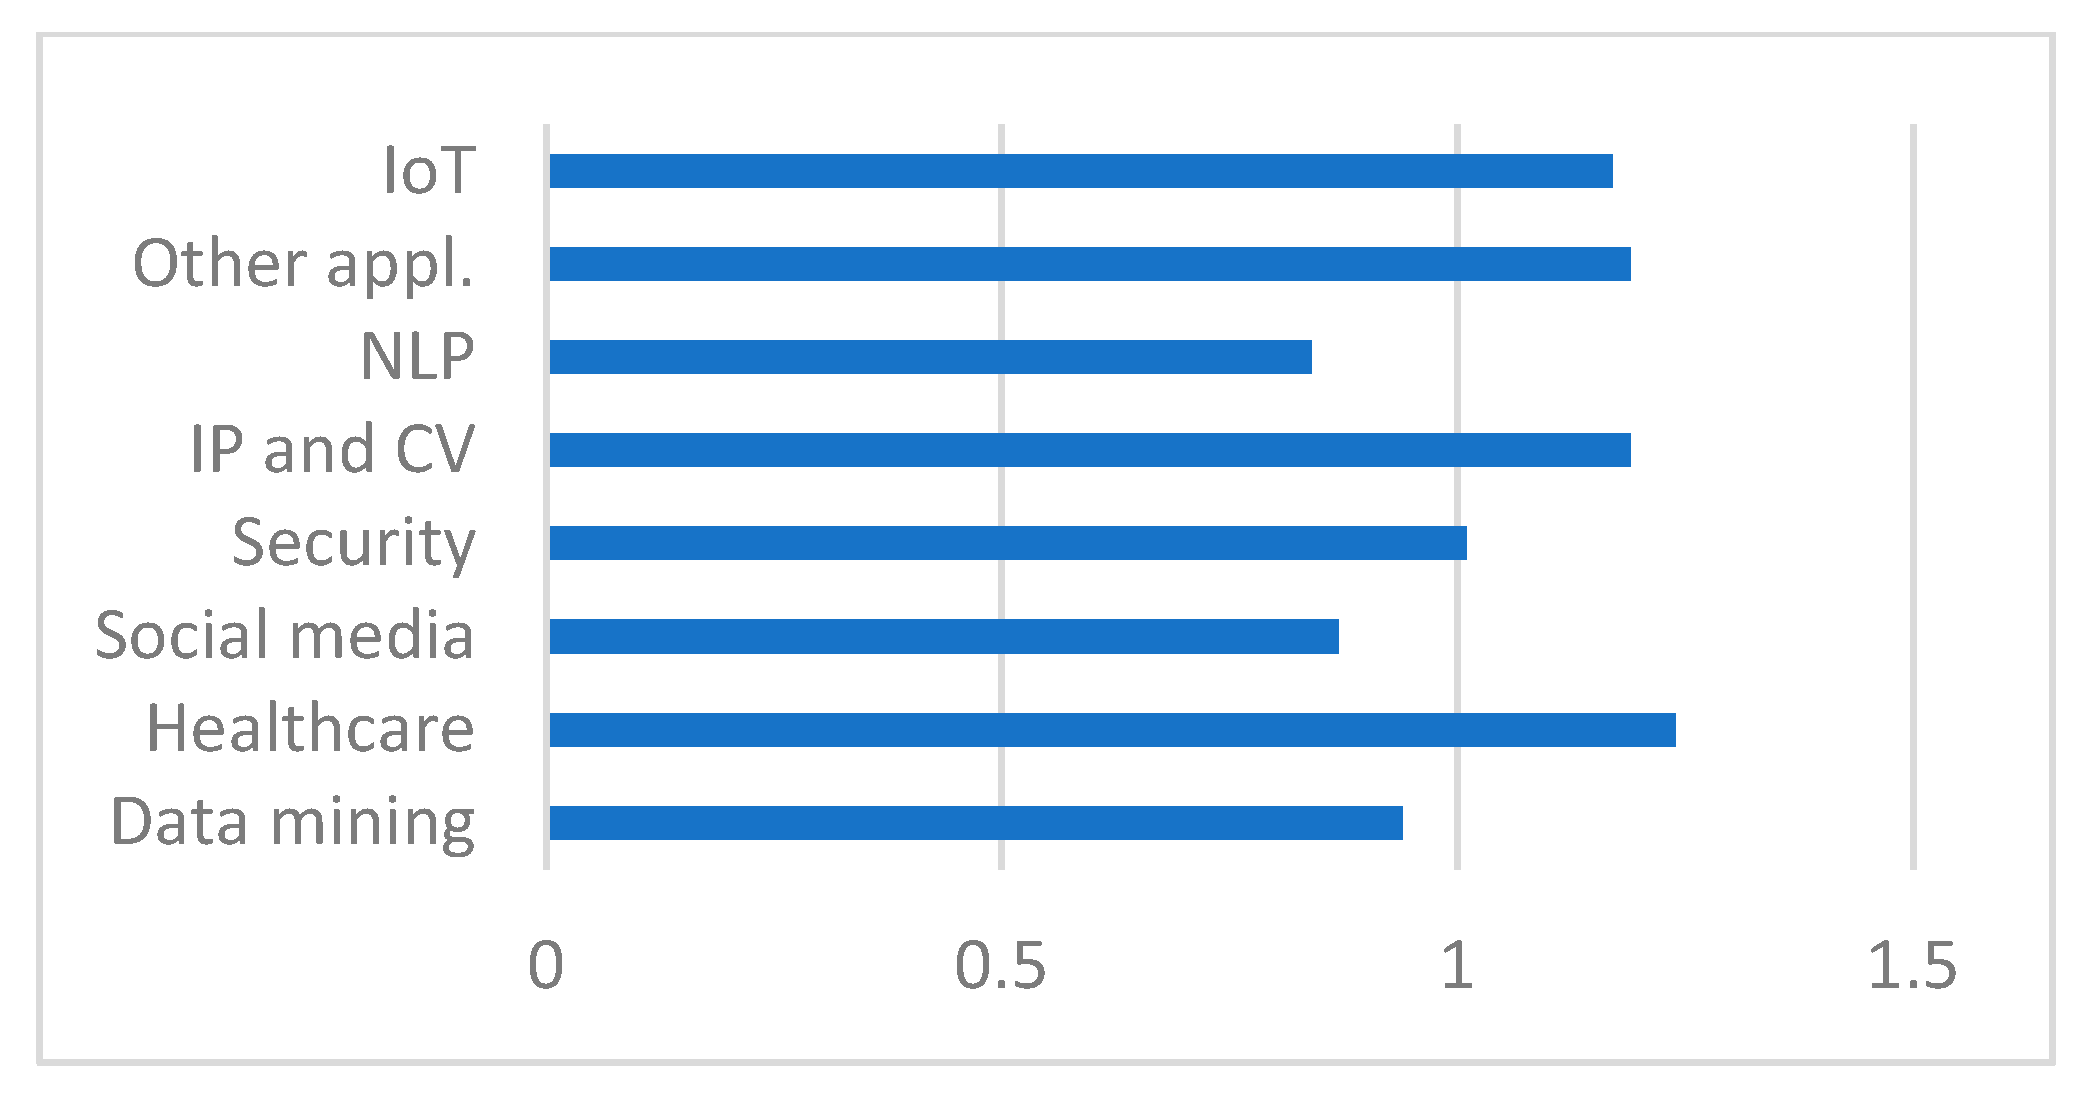
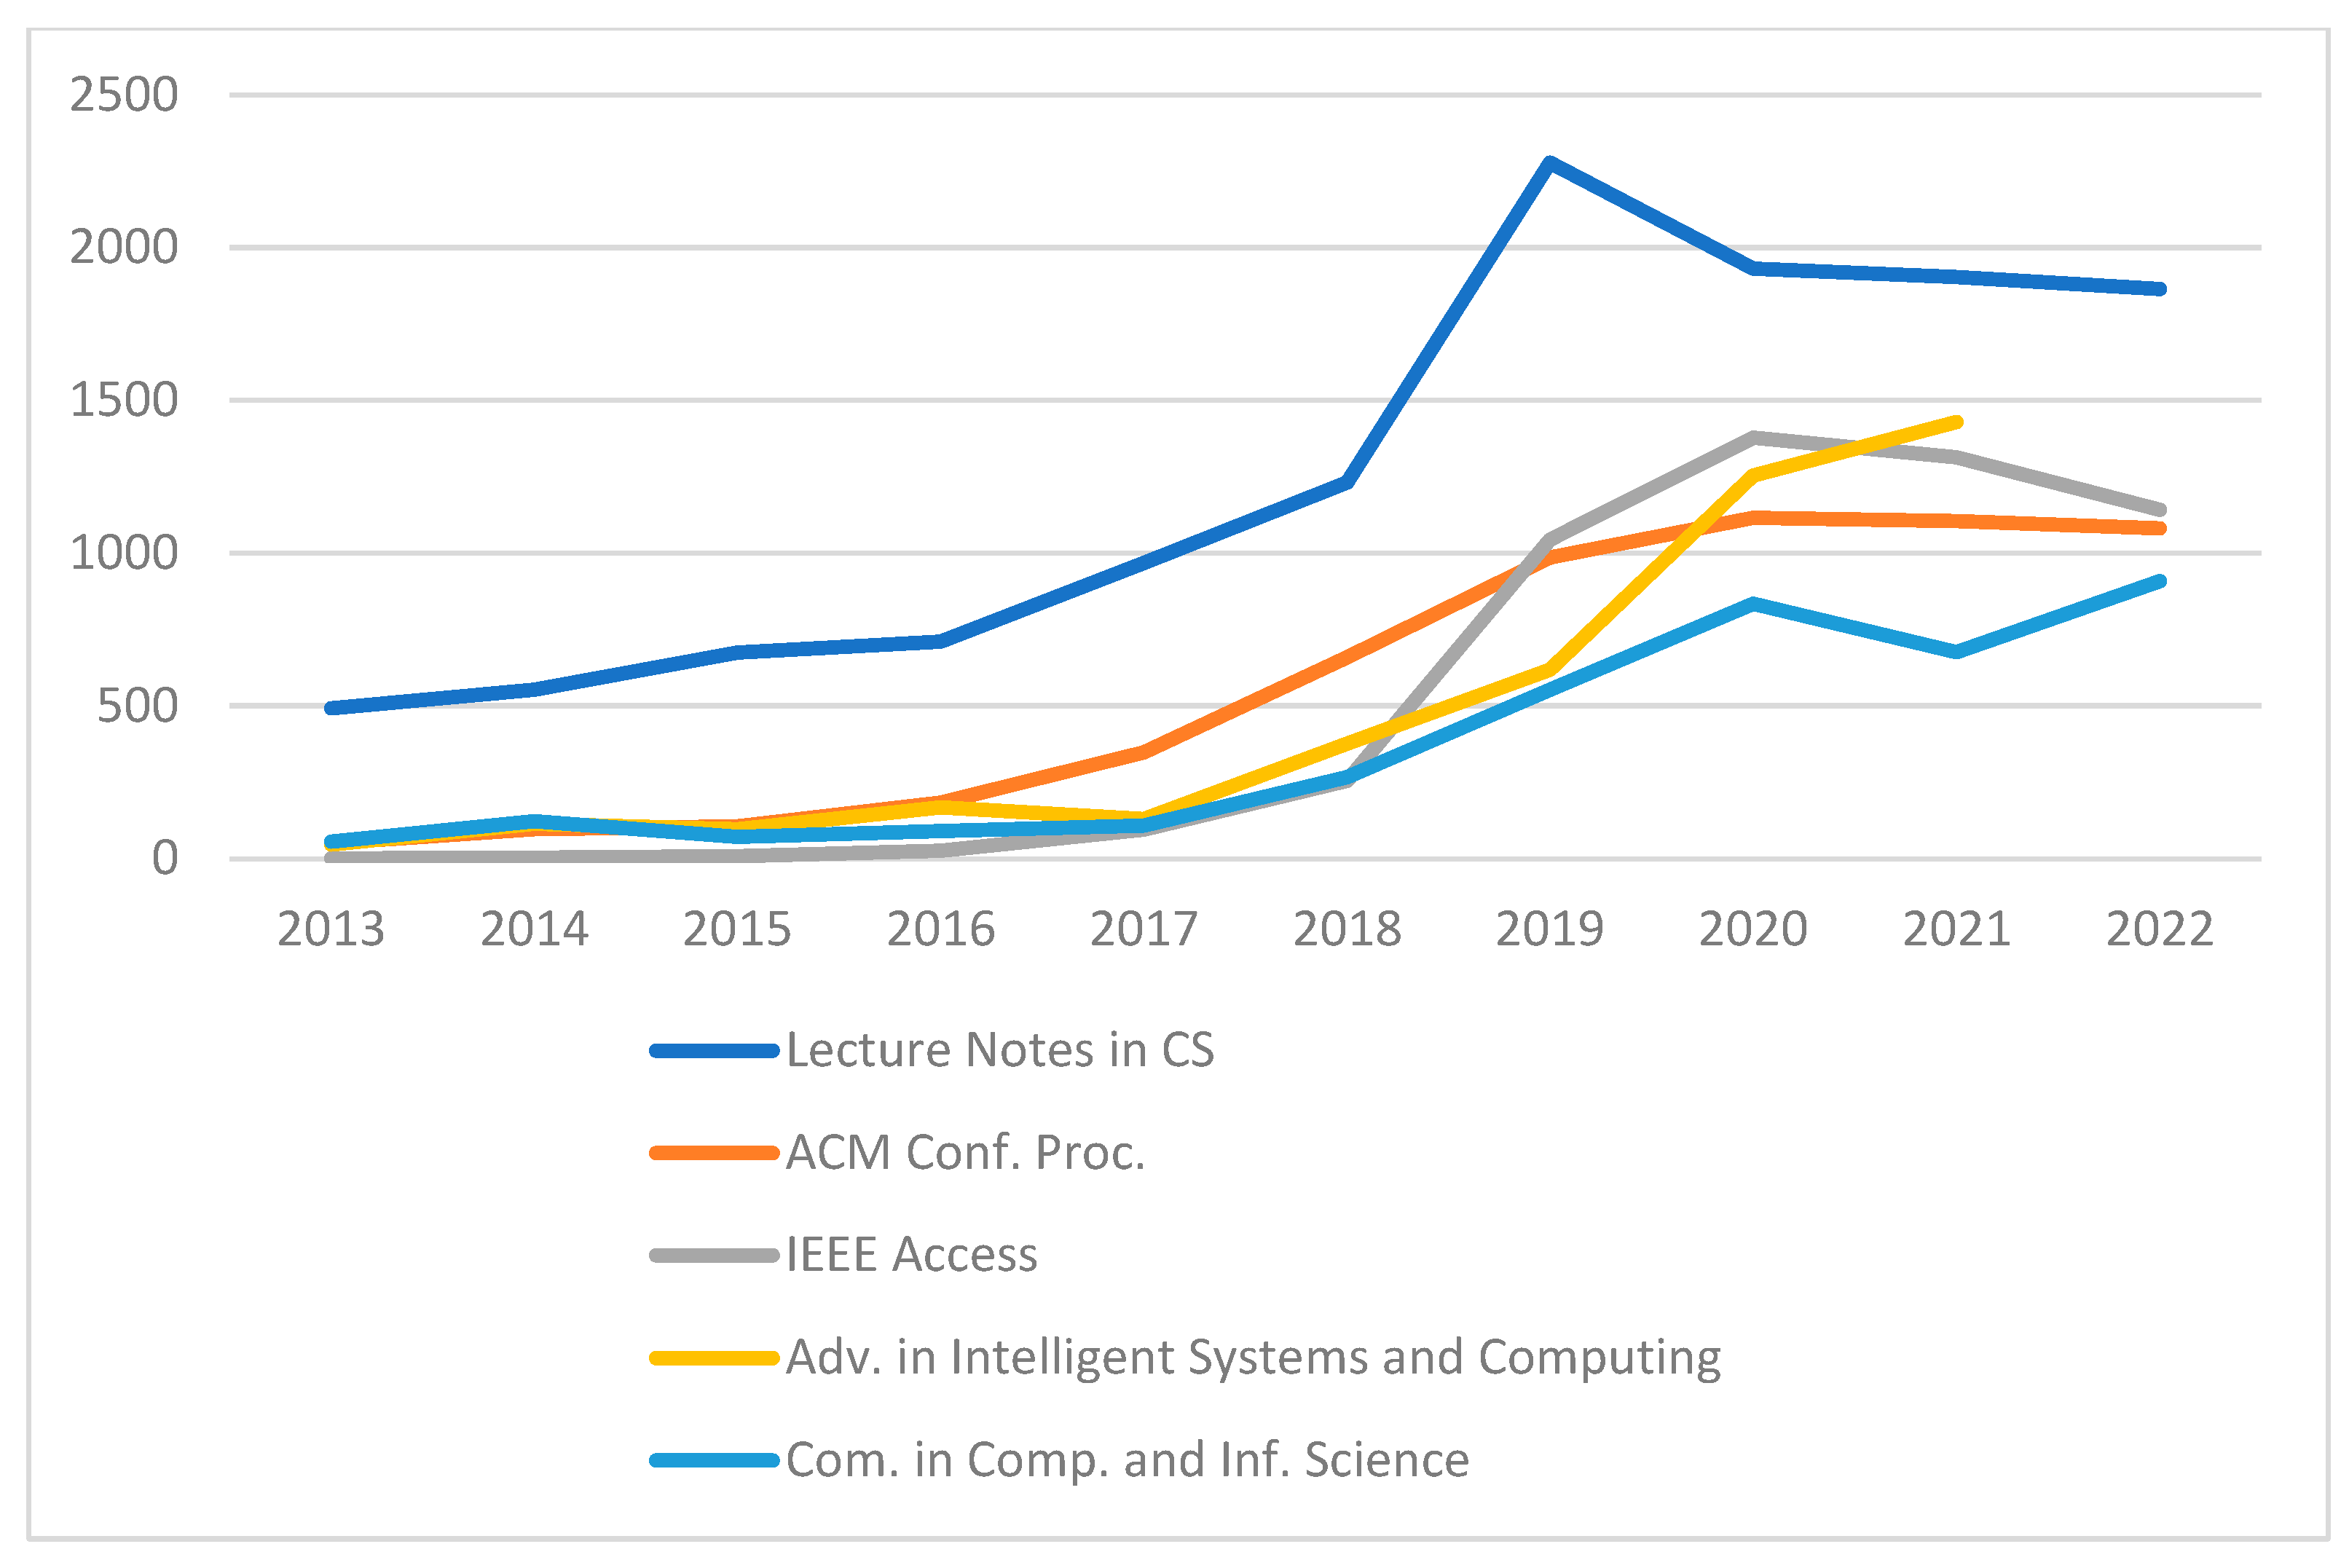
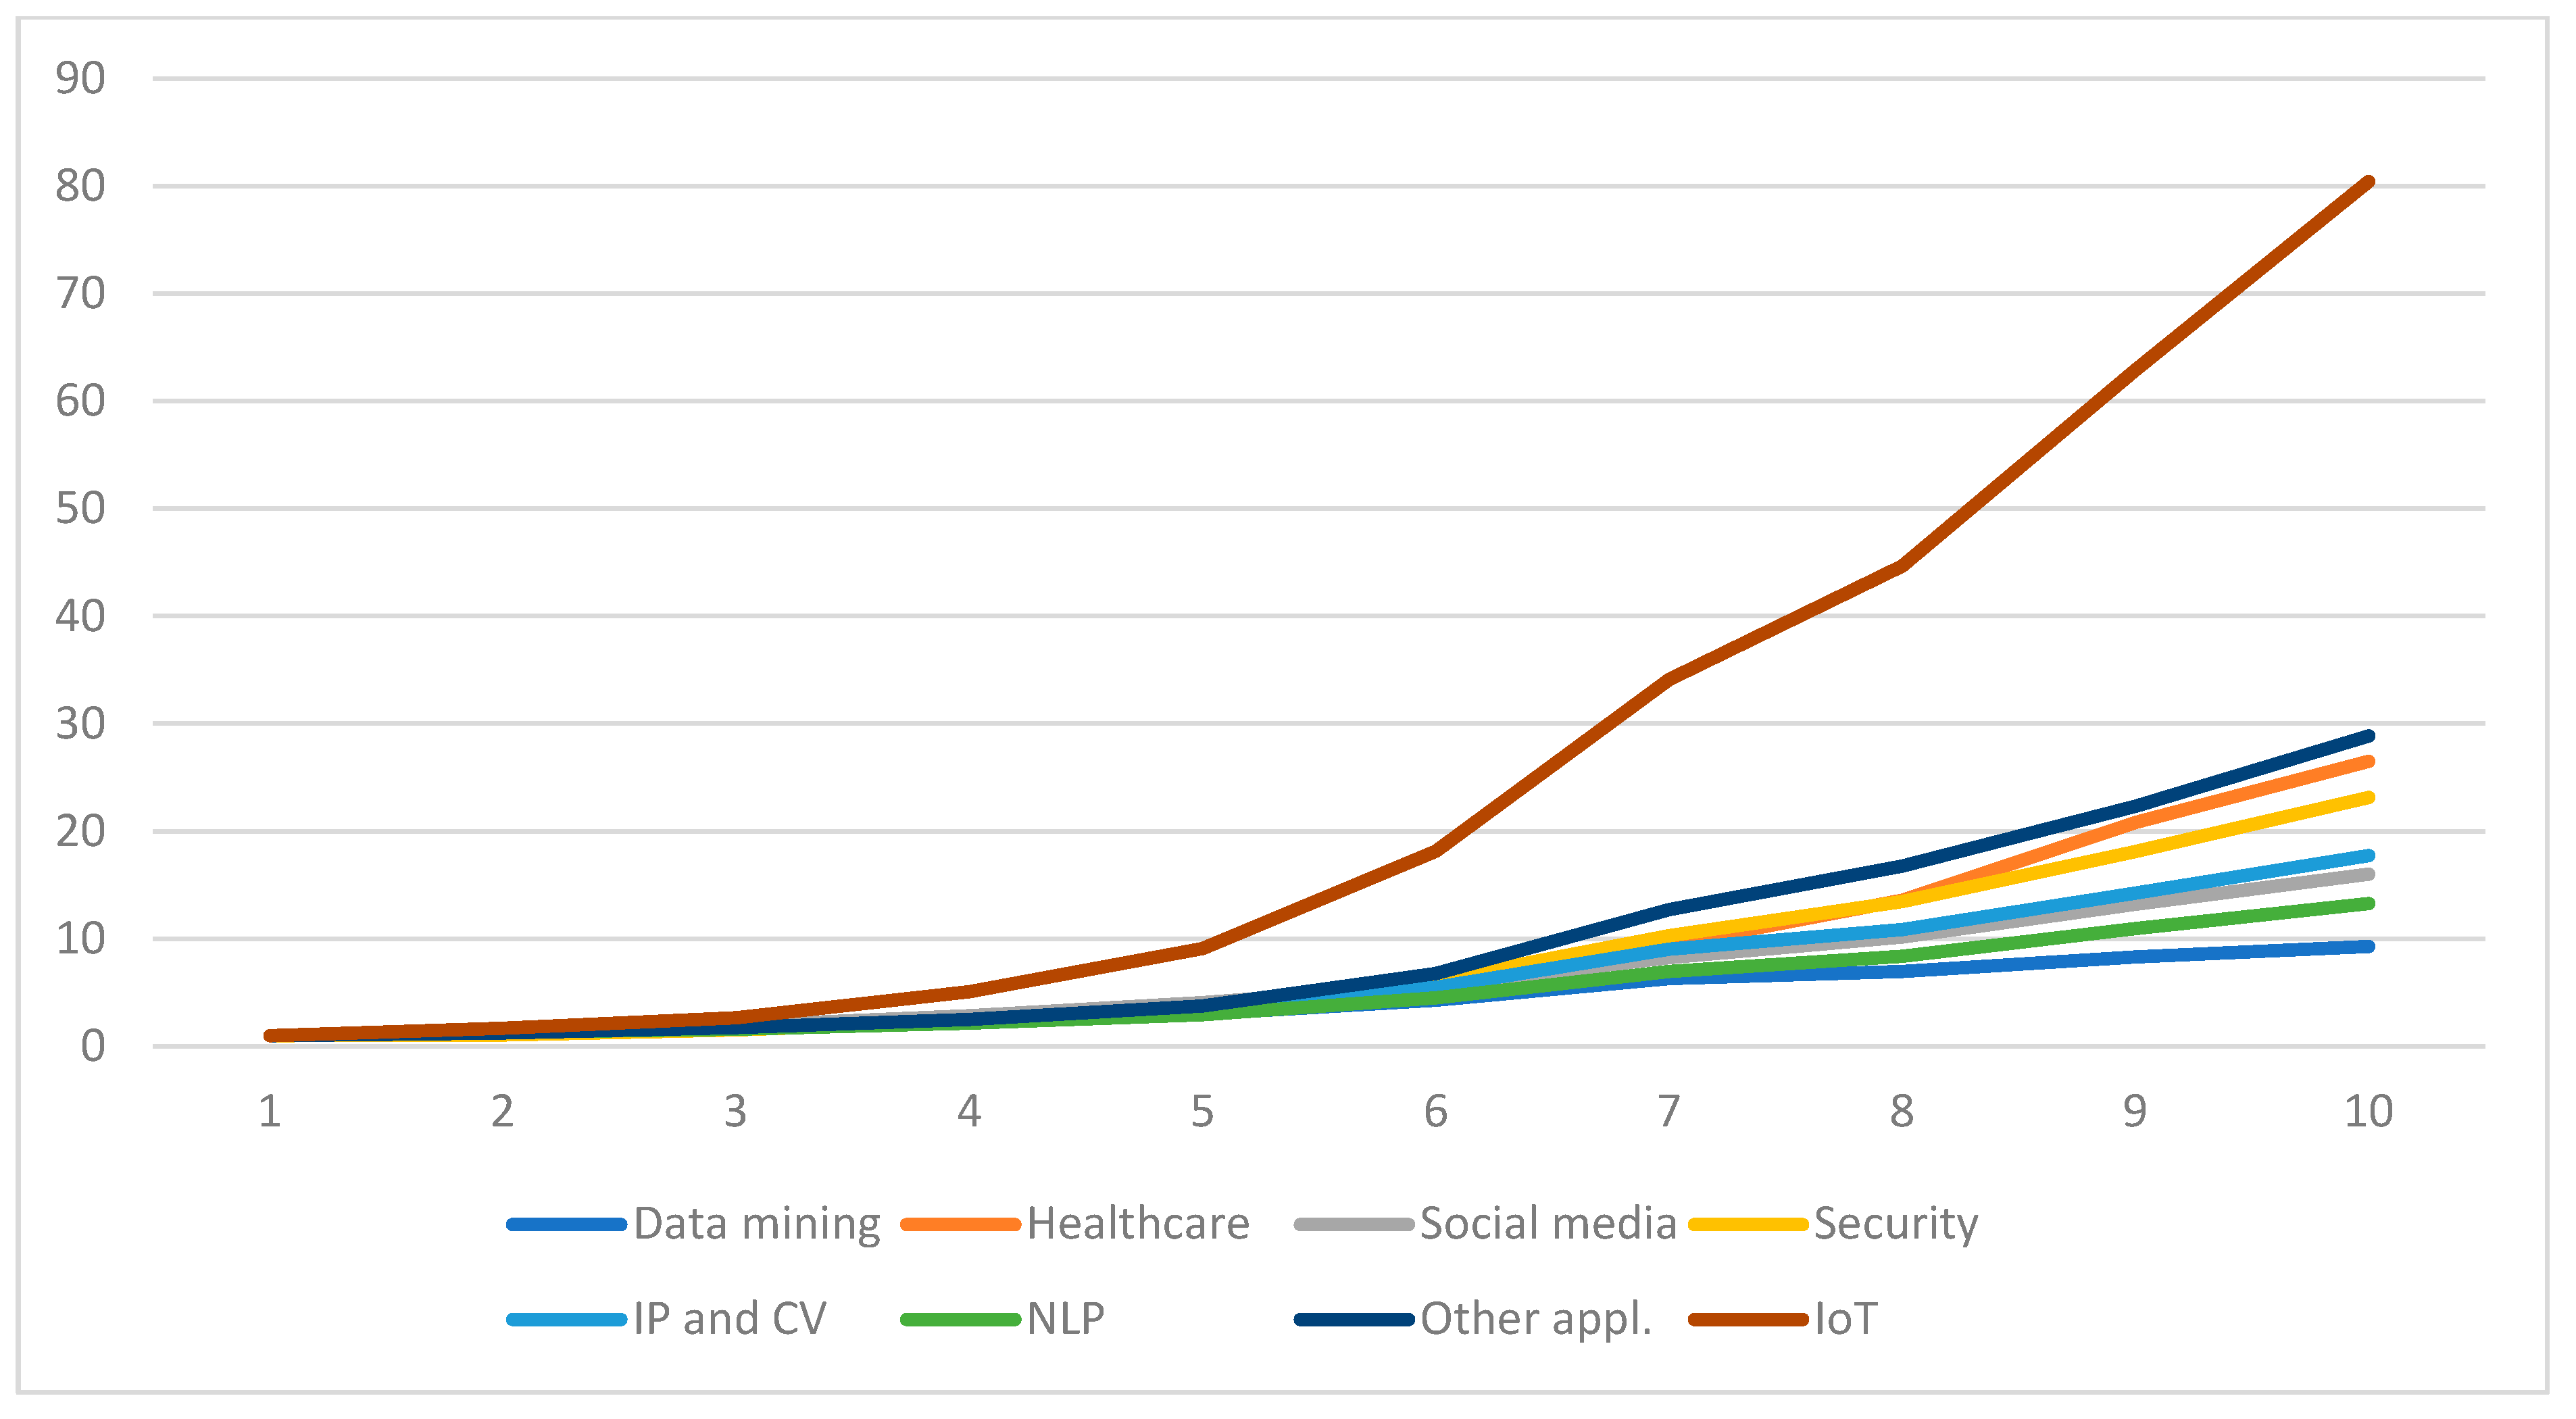
4.2.4. Trends for the Direction Applications in ML Research

The taxonomy shows that the research direction Applications can be split into eight categories: Data mining, Healthcare, Social media, Security, Image Processing and Computer Vision (IP and CV), Natural Language Processing (NLP), Internet of Things (IoT), and Other applications. Figure 18 shows that the categories Healthcare and Data mining contain the largest number of documents for the time period considered. Figure 19 shows that the category IoT grows very fast. To better visualize the growth factors for the other categories, the growth factors for these categories, excluding IoT, have been plotted in Figure 20. Figure 20 shows that the growth factors of the categories Other applications and Healthcare are the highest for these seven categories.
Figure 21 shows that, on average, documents belonging to the category Healthcare have more citations compared with the other categories in the research direction Applications.

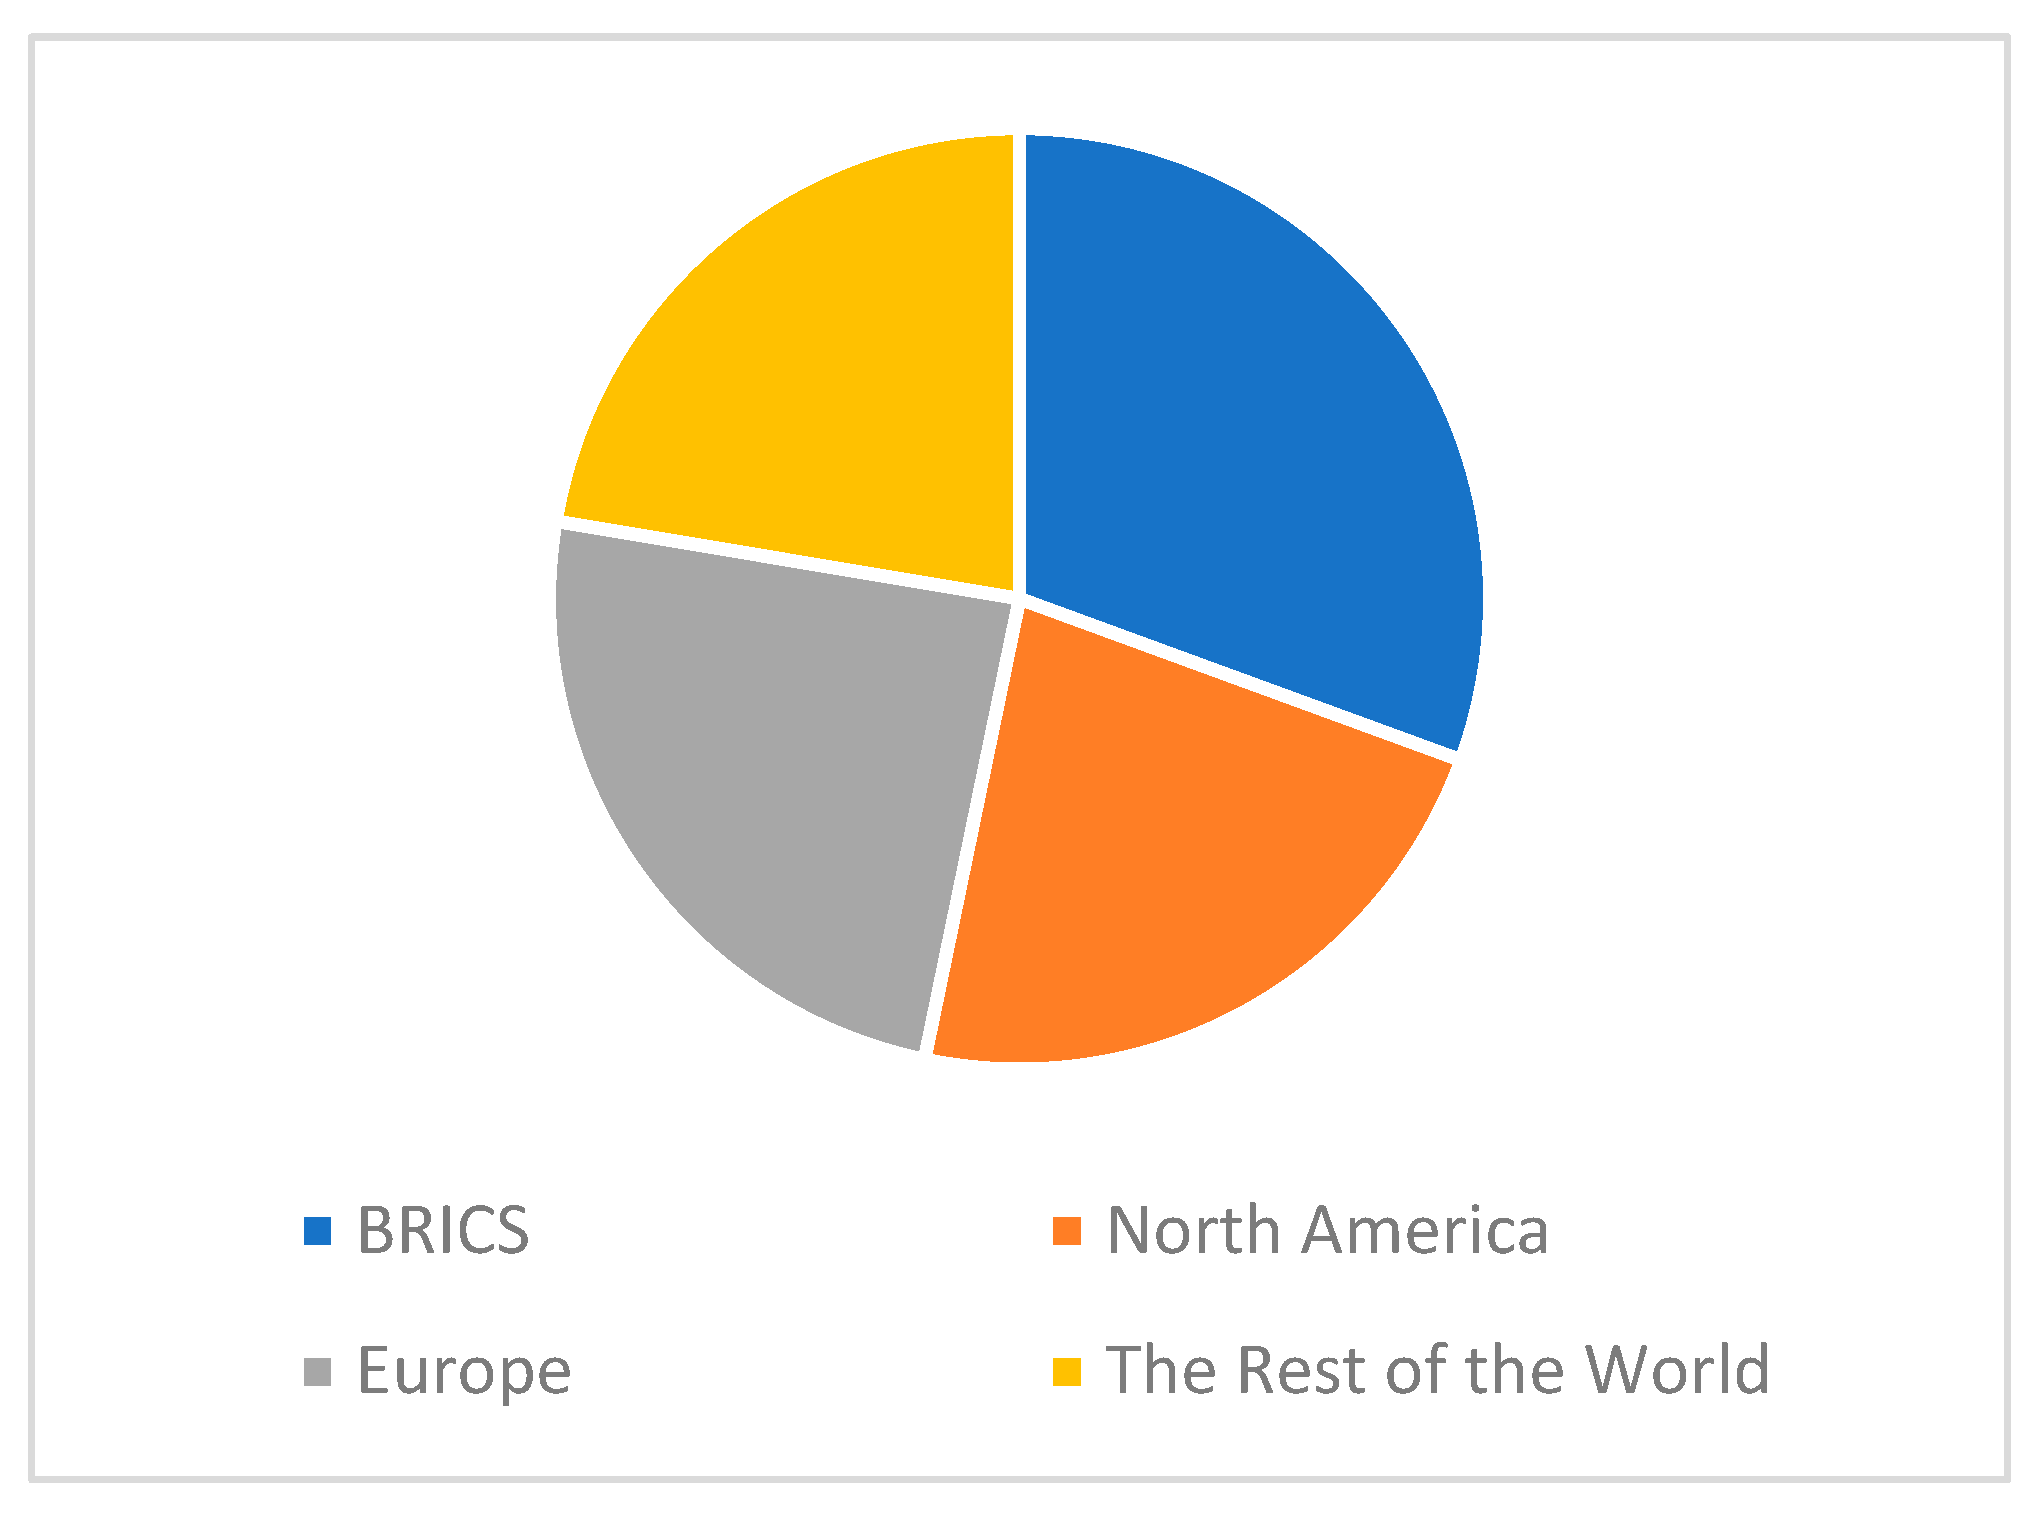
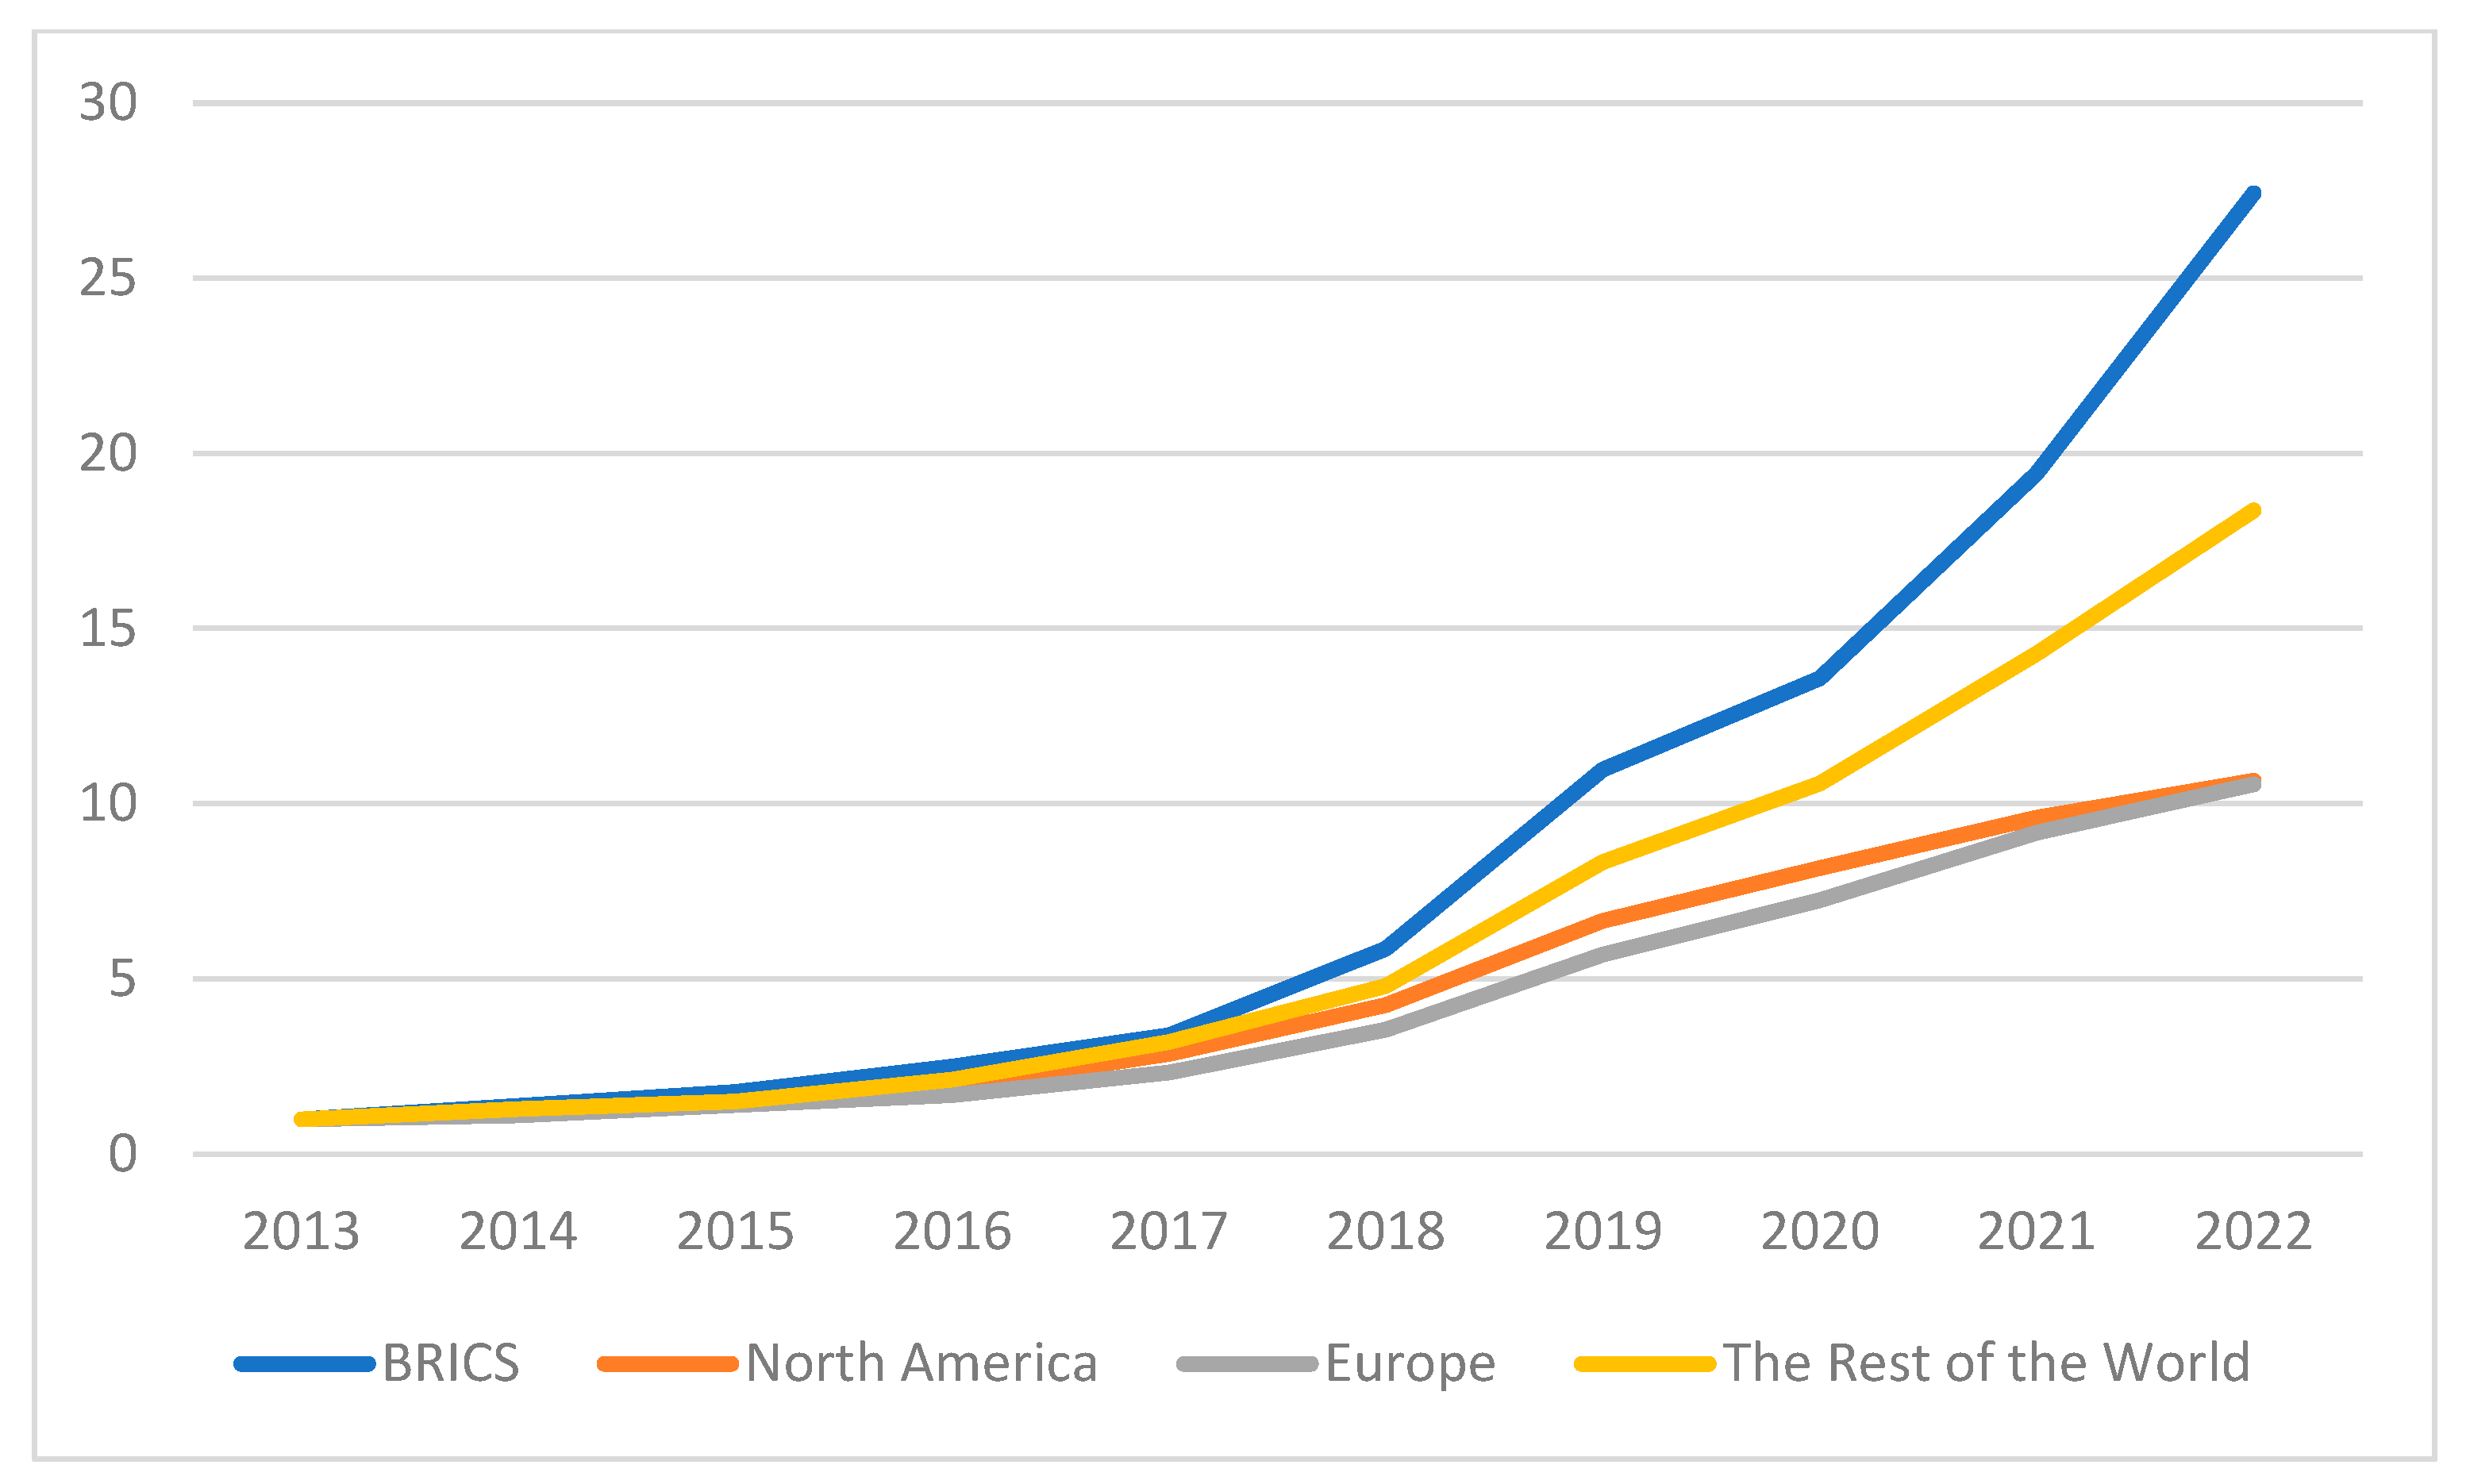
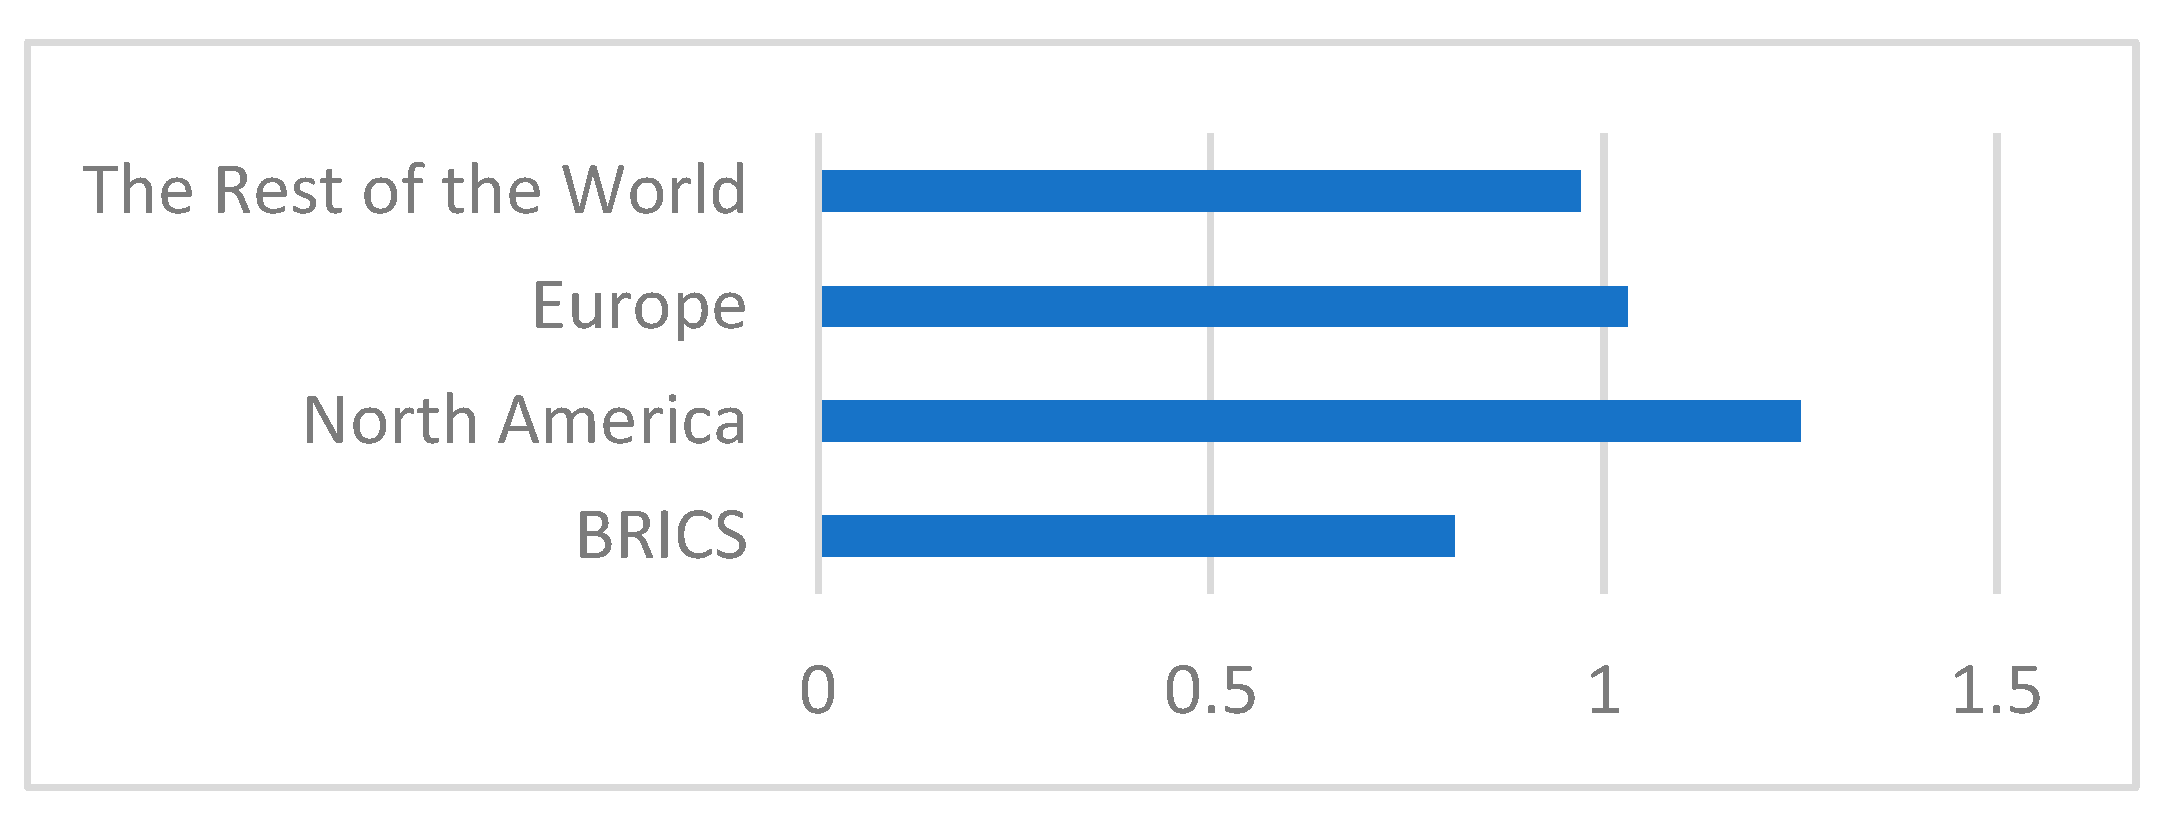
4.3. Geographic Regions in ML Research

Table 3 shows the 20 most productive countries in ML research for the period of 2013 to 2022.
We considered four geographic regions: Europe, North America, BRICS (Brazil, Russia, India, China, and South Africa) and The Rest of the World. Figure 22 shows that approximately the same number of documents were produced in these regions from 2013 to 2022 (the BRICS countries have a slightly higher production than the other regions). Figure 23 shows that the BRICS region has the highest growth factor and that the growth factors for Europe and North America are similar.
Figure 24 shows that, on average, documents from North America have more citations compared with documents from the other regions. Documents from the BRICS countries have the lowest number of citations on average. In fact, there are, on average, 54% more citations to documents from North America compared with BRICS (1.25/0.81 = 1.54).

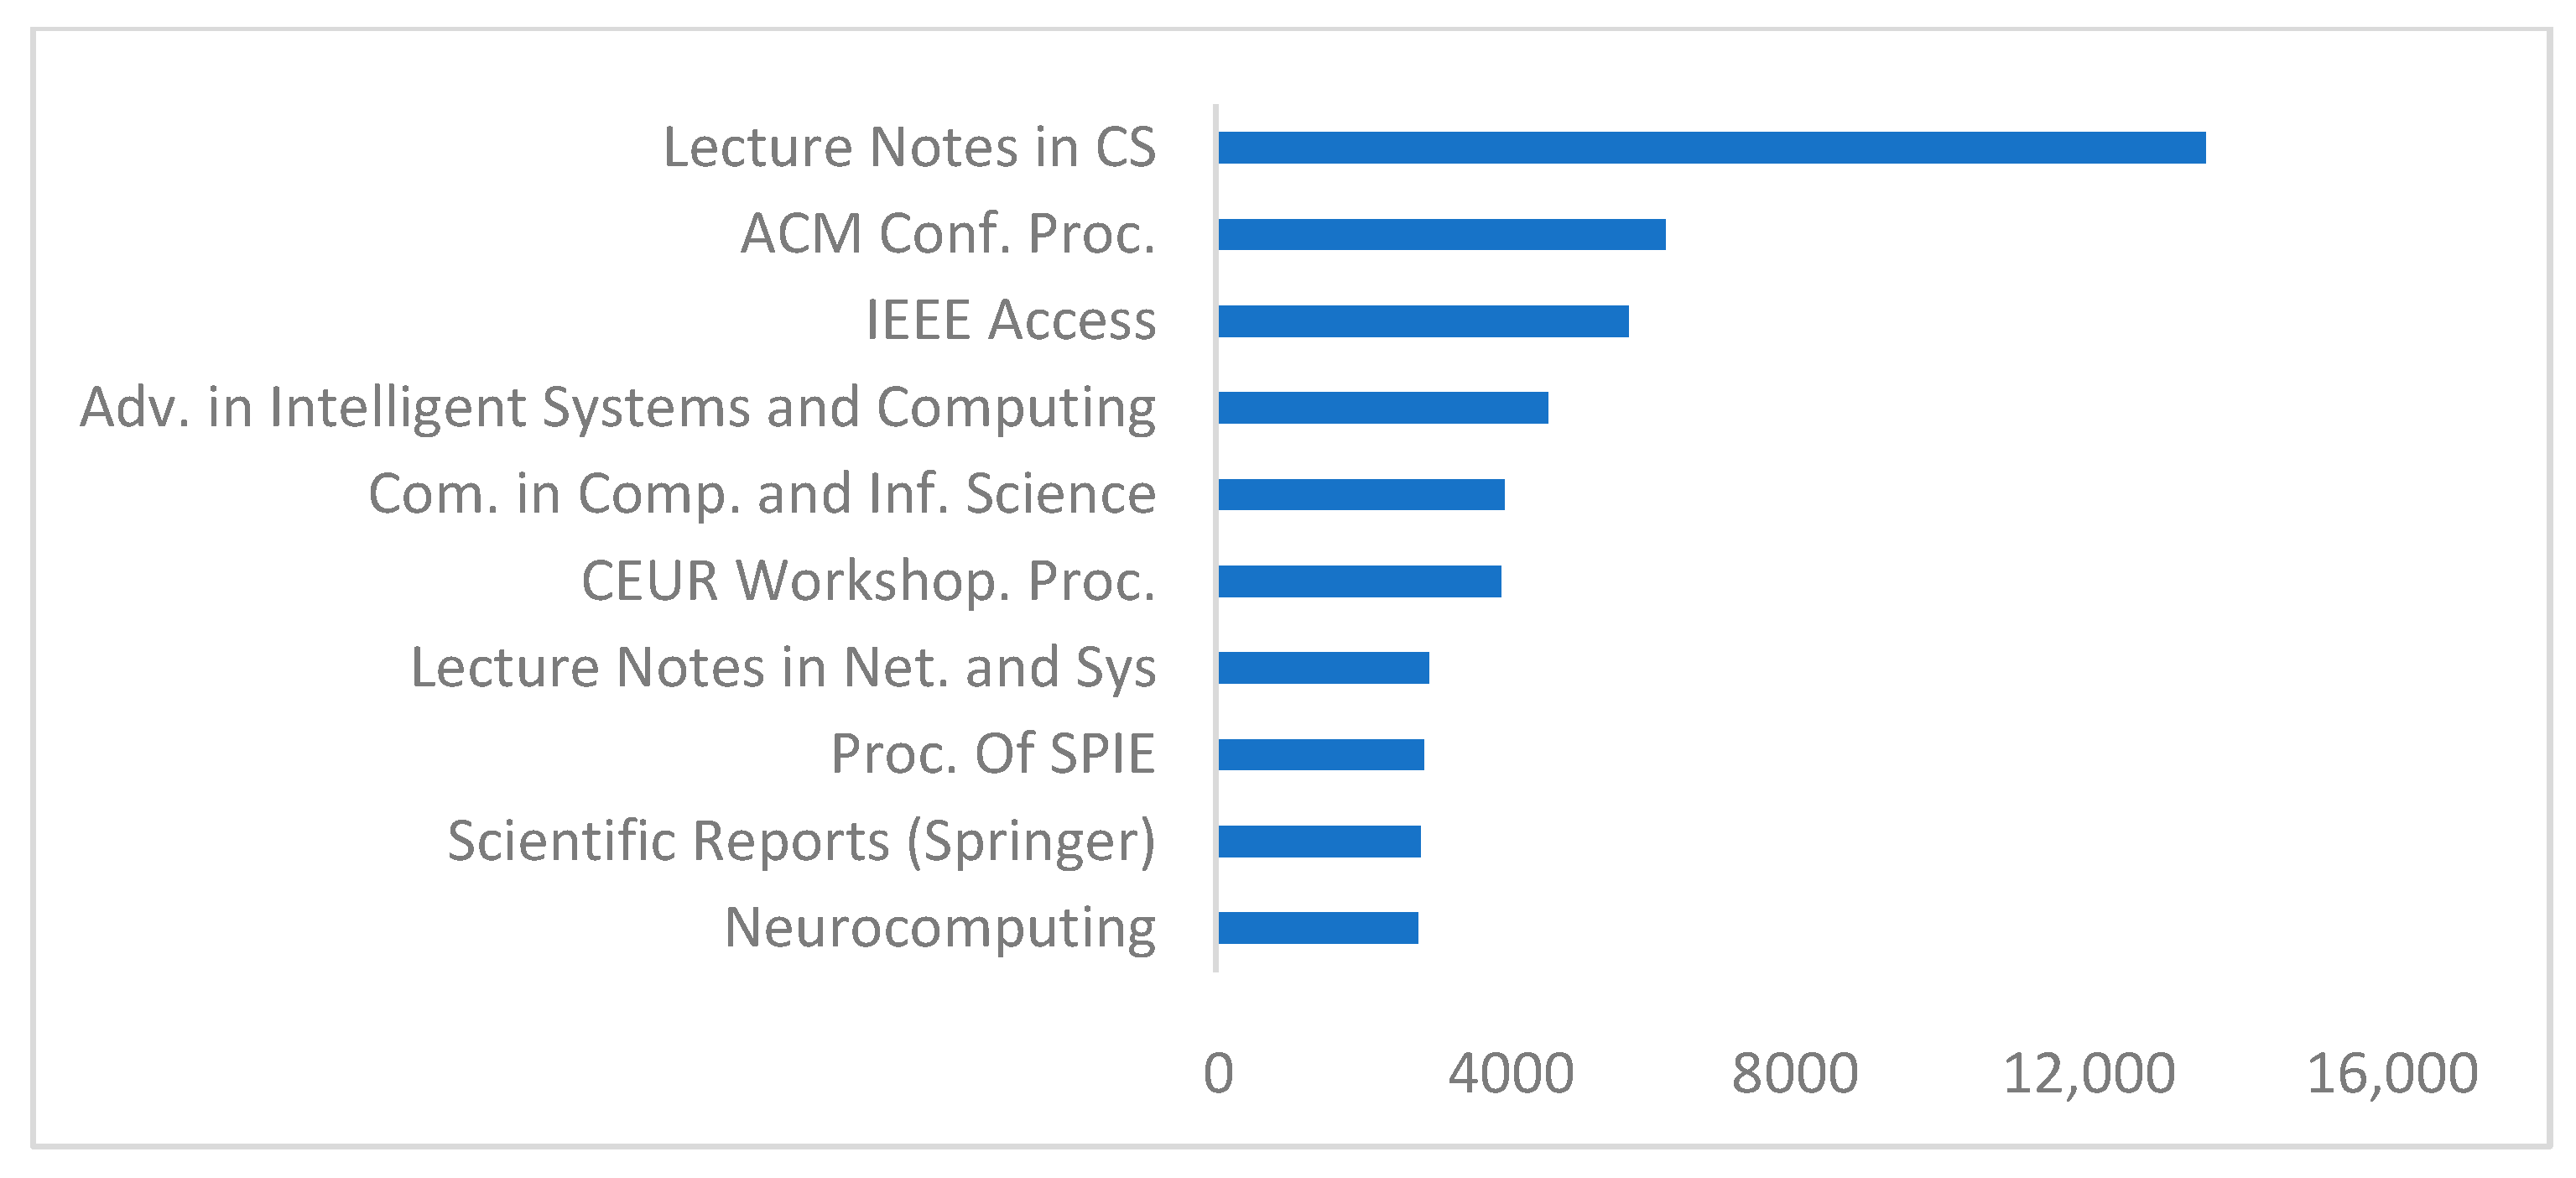
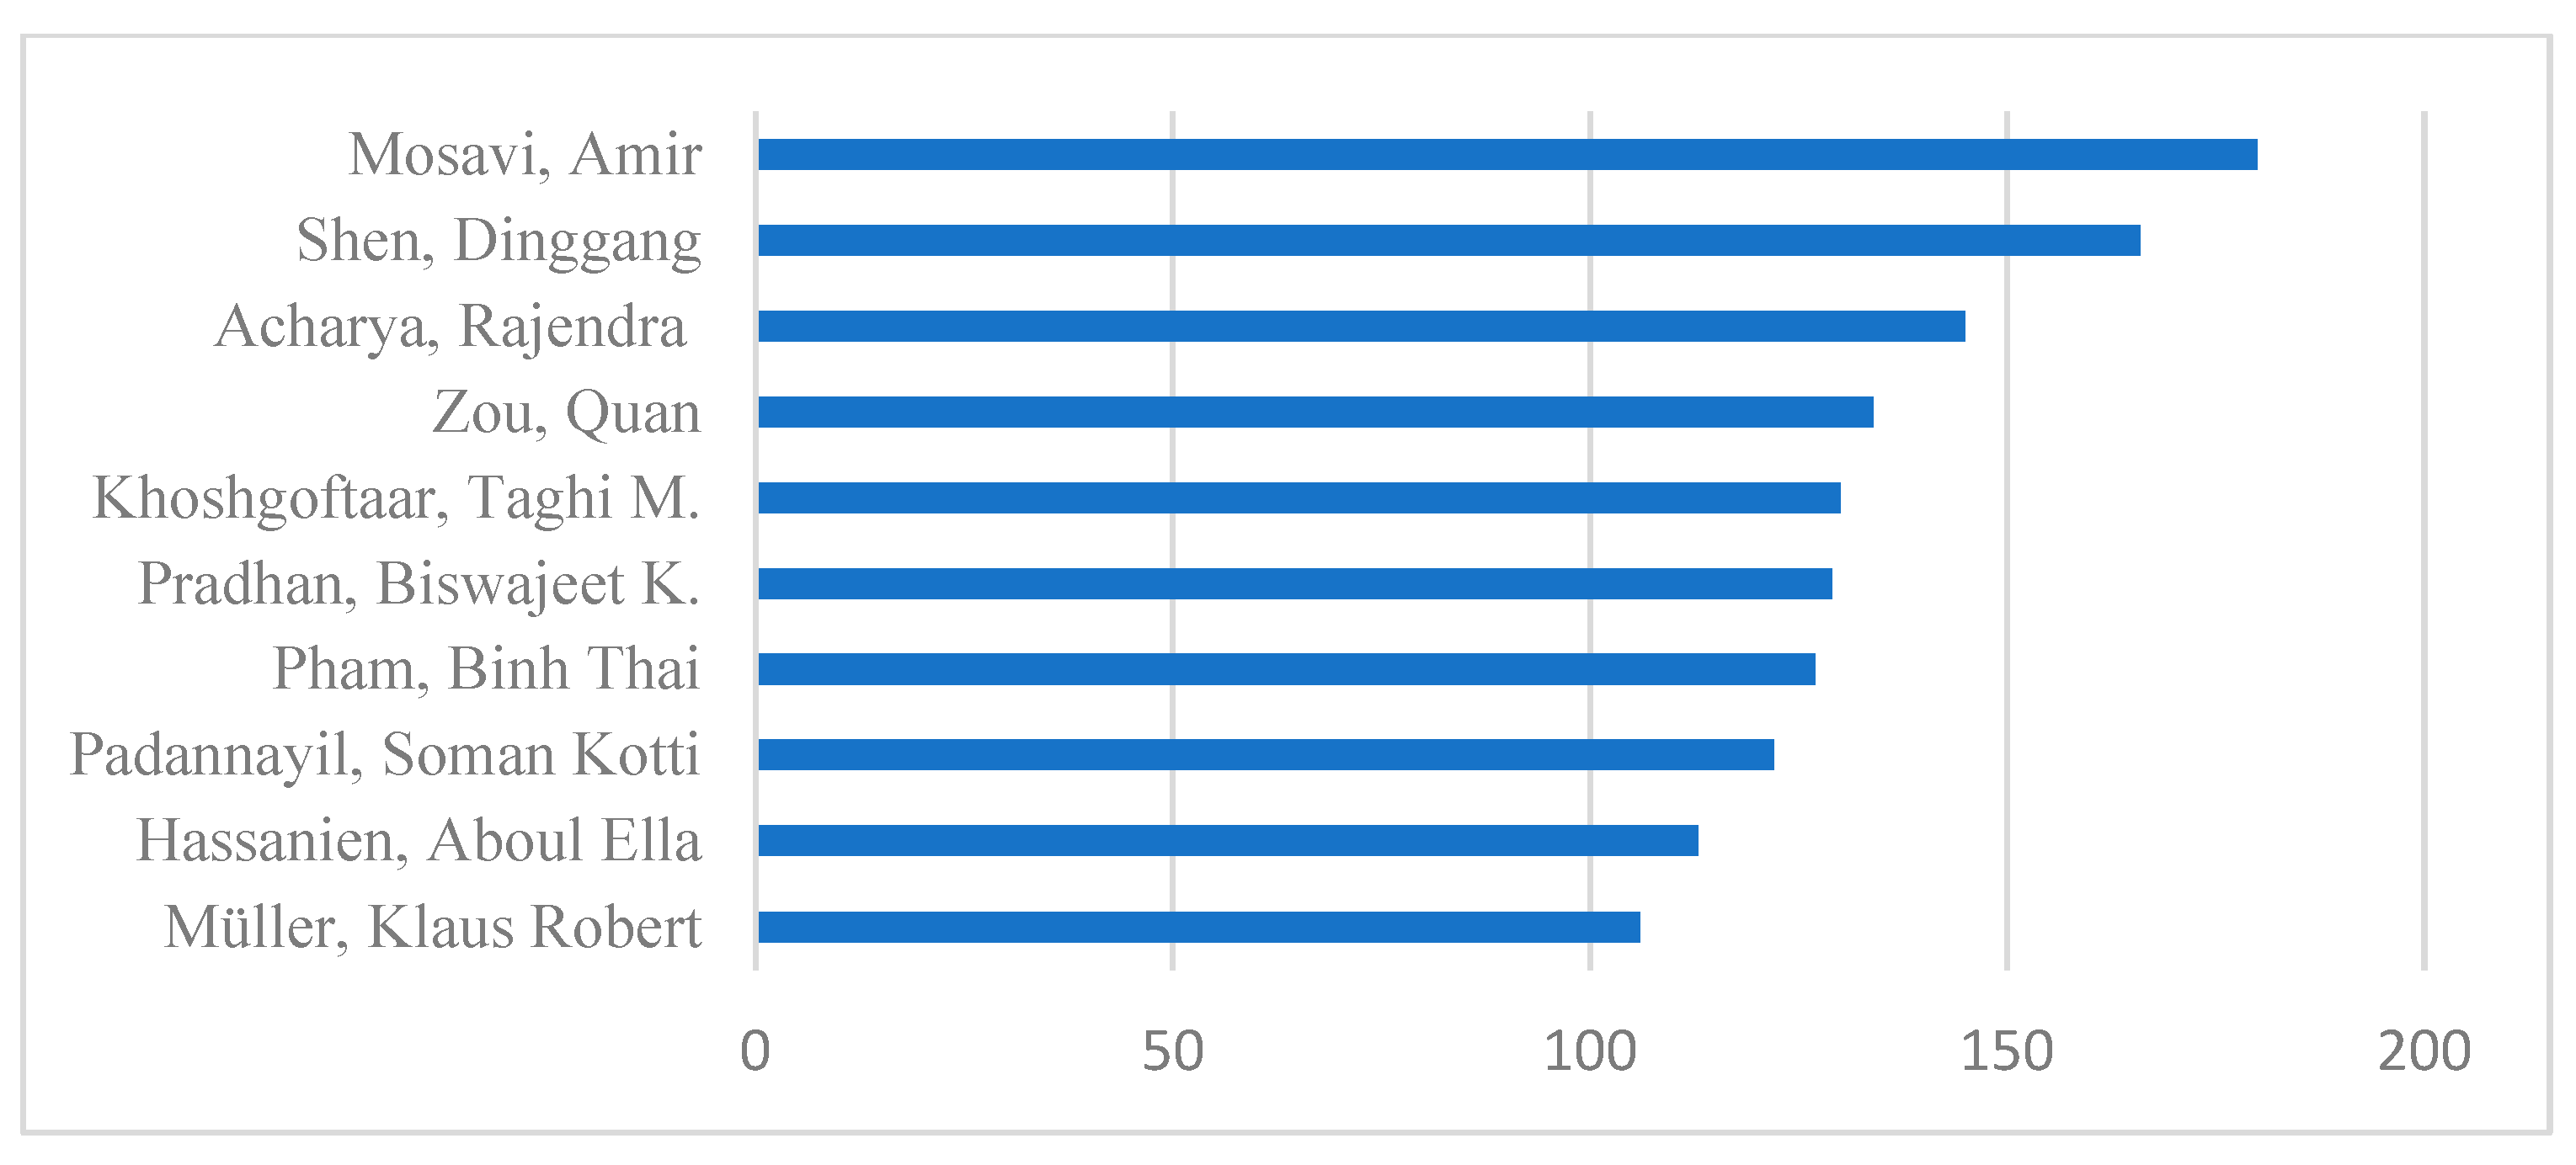
4.4. Important Authors and Document Sources for ML Research

Figure 25 shows the total number of documents during the time period of 2013 to 2022 for the 10 most productive authors in our dataset. The figure shows that Amir Mosavi from Obuda University in Hungary is the most productive author, with 180 documents. The total number of documents for all 10 top authors is 1,352 (see datafile on https://github.com/Lars-Lundberg-bth/bibliometric-ml (accessed on 10 January 2024)). This is less than 0.4% of the total number of publications (398,782). This means that ML research is a large area that is not dominated by a small set of authors. Figure 26 shows the number of documents per year for the five most productive authors in our dataset. The figure shows that Amir Mosavi produced 76 documents in 2020, which is the highest number of documents by the same author during the same year.
Figure 27 shows the total number of documents during the time period 2013 to 2022 for the 10 largest sources of ML documents, i.e., the 10 largest sources of documents in our dataset. The figure shows that Lecture Notes in Computer Science (including the subseries Lecture Notes in Artificial Intelligence and Lecture Notes in Bioinformatics) is the source with the largest number of documents in our dataset (12,603 documents). The figure also shows that IEEE Access is the journal with the largest number of documents in our dataset. Figure 28 shows the number of documents per year for the five largest sources of documents in our dataset. The figure shows that none of these five sources increased significantly during the last two years of the period considered (in fact, most of them decreased). Since the total number of documents in ML also increased significantly during the last two years of the time period (see Figure 4), it is clear that the spread of sources of ML documents increased. This seems reasonable since ML has worked its way into new areas, resulting in a wider range of publication sources.

5. Discussion

When looking at the graphs in Section 4, one can make some general observations. One such observation is that there seems to be a correlation between a high NCS score and a large growth factor. In total, 26 research directions and subdirections were analyzed in Section 4. For each direction and subdirection, there is a pair (growth factor 2022, NCS). If one looks at these 26 pairs and calculates the Spearman correlation [61] between the two values in the pair, one gets a value of 0.67, i.e., there is a clear positive correlation between the growth factor and the NCS value. This means that, on average, documents in fast-growing directions are cited more than documents in directions with slower growth.
Since we only considered four geographic regions, it did not make sense to do any statistical analysis between the NCS value and the growth factor of the regions. However, the relationship between citations and growth factor seems to be the opposite compared with the research directions, i.e., the region that grows the fastest (BRICS) has the lowest NCS, and the regions that grow the slowest (North America and Europe) have the highest NCS values. One reason for this finding could be that North America and Europe are pioneers and leaders in ML research. One implication of being a leader in the field is that one gets more citations. This would explain the high NCS values for North America and Europe. An implication of being a pioneer is that one starts with research in ML early, resulting in a relatively high number of documents already since 2013. Since the growth factor is relative to the productivity in 2013, this could explain why the growth factors in North America and Europe are lower than the growth factors in BRICS and The Rest of the World.
Our results show that documents from North America are the most cited ones. The same observation was made in a similar study related to Big Data [12]. In that study, the country/region with the lowest NCS was China, and in this study, the region/group with the lowest NCS is BRICS. This means that the citation patterns seem to be similar in ML and Big Data, which is not very surprising since there is some overlap between these two research areas.
Our method provides tool support, making it possible to identify research directions and trends in areas with a large number of documents (almost 400,000 documents in our case). Since we used human experts, the identified research directions became useful and easy to relate to. Completely automatic approaches tend to identify research directions (in the form of common keywords) that are too general (e.g., ‘risk’ [6], ‘costs’ [7], ‘new’ [8], and ‘mouse’ [9]) or confusing (e.g., ‘micro grid’ different from ‘microgrid’ different from ‘microgrids’ [7]; ‘svm’ different from ‘support vector machine’ [9]; and ‘neural network’ different from ‘neural networks’ [10]). In our case, the problem with keywords that are too general was handled using the blacklist, and the problem with confusing keywords was handled using the thesaurus.
The time required by the experts was rather limited. Defining the taxonomy and thesaurus and grouping the keywords into research directions or a blacklist (see Appendix B) was performed during three workshops. Each such workshop took approximately two hours, and all four experts participated in these workshops. Taking into account some preparation work before the workshops, we estimate that only 30–40 h of the experts’ time were needed to produce the taxonomy, thesaurus, and blacklist.
The Python program was not only used to automatically generate the results after the experts grouped the keywords into research directions and blacklist. The Python program was also used when defining the taxonomy. The program produced a list of the most common author-defined keywords in the corpus of documents considered. Having a list of common author-defined keywords was very helpful when defining research directions in the taxonomy since this list provided a bottom-up approach in the sense that when defining the taxonomy, the experts needed to consider how the list of author-defined keywords could be grouped into research directions in a good way. This kind of bottom-up grouping was a very useful complement to the different existing taxonomies that the experts looked at when defining the taxonomy used in this study. We believe that a combination of bottom-up grouping of author-defined keywords and considering existing taxonomies was the best way to create our taxonomy. Since we considered frequent author-defined keywords when defining our taxonomy, our approach easily adapted to hot topics and new trends in dynamic research areas such as ML.
As mentioned in the Introduction, the method used in this study is similar to the one used in a previous bibliometric study on trends in Big Data research [12]. However, one important improvement in the current study is the method and tool support used for defining the taxonomy. In the study on trends in Big Data research, no taxonomy was defined. If a similar study as the one presented here is conducted five years from now using the same tool and methodology, the tool will identify new frequent author-defined keywords, and the experts will adapt the taxonomy accordingly. For instance, if the recent trends in multi-modal machine learning [62,63] turn out to be important five years from now, this will be reflected in the author-defined keywords found by the tool and, as a consequence, be reflected in future versions of the expert-defined taxonomy. In this way, the tool and methodology will identify emerging topics. The trends in the areas defined in the existing taxonomy can be identified using the graphs presented in Section 4. For instance, Figure 13 shows that there is a rapid increase in research related to CNN, and Figure 19 shows that there is a clear trend toward ML research related to IoT. Identification of such trends is important for policy- and decision-makers in industry and academia when they decide the direction for future research and innovation programs.
Since we used a program in the mining process, it became easy to calculate metrics that would have been difficult to obtain without this kind of support. Examples of such metrics are the growth factor and the average NCS per research direction and geographic region.
All keywords that we used were defined as keywords by authors in the research area, i.e., we do not perform any general text analysis when identifying keywords. Therefore, no weighting, such as TF-IDF (Term Frequency—Inverse Document Frequency [64]), was needed in order to find relevant keywords. Instead, we benefited from the authors’ intellectual work when they defined their keywords. When searching for potential keywords in general text, one needs to use techniques such as Inverse Document Frequency to filter out common words that do not carry any interesting information. We used the blacklist for this purpose.

6. Conclusions and Future Work

By using research area experts and a computer program, we defined a taxonomy for research in ML and evaluated trends in research productivity and citations in the different research directions defined by that taxonomy. The first conclusion is that ML is a very active research area that grew rapidly during the period of 2013 to 2022. Our results also show that the two largest research directions in ML are Algorithms and Applications. The fastest-growing subdirection in Algorithms is CNN, and the fastest-growing application area in the research direction Applications is IoT.
Most directions and subdirections in ML grew monotonously during the period of 2013 to 2022. However, the number of documents that contain “reinforcement learning” in the title, abstract, or author-defined list of keywords actually peaked in 2019. The reason for this is probably related to the remarkable success of the use of reinforcement learning in games such as Go and Chess during that period.
When looking at citations, we see that there is a positive correlation between the number of citations to documents in a research direction and the rate with which the research direction is growing; the Spearman correlation coefficient was 0.67. For instance, the fast-growing research direction CNN has a Normalized Citation Score of 1.39, whereas the application area NLP only has an NCS value of 0.81; NLP grows relatively slowly compared with other directions and subdirections in ML.
ML is an active research area in all parts of the world. We considered four regions/groups of countries: North America (USA and Canada), Europe, BRICS (Brazil, Russia, India, China, and South Africa), and The Rest of the World. It turns out that the growth rate is highest in the BRICS countries and lowest in Europe and North America. However, the citation rate of papers from North America is the highest, and the citation rate for papers from the BRICS countries is the lowest. In fact, there are, on average, 54% more citations of documents from North America compared with those of documents from BRICS.
When considering important authors and document sources related to ML research, it is clear that ML research is a large area that is not dominated by a small set of authors. Moreover, the spread of sources of ML documents seems to have increased during the last few years, which is reasonable since ML has worked its way into new areas, resulting in a wider range of publication sources.
In this study, we considered the Scopus database. However, the methodology could be applied also to other databases. Some parts of the code for the mining program could be reused. Obviously, the interface to the document database would have to be replaced if our approach should be used for databases other than Scopus.
The tool (program) and method presented here are not specific to ML. We expect that it would be possible to use the same method to identify research directions and trends in other large and dynamic research areas with a relatively limited effort. Due to the support of the program and the design of the mining process, we only needed 30–40 h of the experts’ time in this study.
As discussed in Section 2.2, keyword graphs (i.e., graphs with keywords as nodes) produced using visualization tools such as VOSviewer and CiteSpace become hard to read and interpret when applied to large research areas, such as ML. However, these kinds of graphs could probably also be useful to visualize the connections between different expert-defined research directions, i.e., putting the expert-defined research directions as the nodes and letting the edges indicate the overlap between two directions in terms of number of shared documents between the two directions. However, more research is needed regarding how these kinds of graphs can visualize interesting relationships in large and complex areas with hierarchical taxonomies. This is something that will be investigated in future studies.

Author Contributions

Conceptualization, L.L.; methodology, L.L.; software, L.L.; validation, L.L., M.B., A.B. and H.G.; formal analysis, L.L.; investigation, L.L., M.B., A.B. and H.G.; resources, L.L.; data curation, L.L.; writing—original draft preparation, L.L., M.B., A.B. and H.G.; writing—review and editing, L.L.; visualization, L.L.; supervision, L.L.; project administration, L.L.; funding acquisition, not applicable. All authors have read and agreed to the published version of the manuscript.

Funding

This research was funded in part by the Knowledge Foundation in Sweden through the project “Green Clouds—Load prediction and optimization in private cloud systems” (grant 20220215).

Institutional Review Board Statement

Not applicable.

Informed Consent Statement

The only humans involved in this research are the authors.

Data Availability Statement

The data presented in this article are available on https://github.com/Lars-Lundberg-bth/bibliometric-ml (accessed on 10 January 2024).

Conflicts of Interest

The authors declare no conflicts of interest.

Appendix A. Expert Competence

PositionProfessor, Since 2007
Age 57 years
Year Ph.D. degree1995
Years working in the AI/ML domain2011–2023
Total number of publicationsTwo book chapters, 32 journal articles, 68 peer-reviewed conference papers, and 20 peer-reviewed international workshop papers
Number of citations (Google scholar)2461
H-index (Google scholar)23
i10-index (Google scholar)47
Number of AI/ML publications2 book chapters, 10 journal articles, 40 peer-reviewed conference and workshop papers
Program committees, AI/ML conferences17 in AI/ML since 2015, including, e.g., AAAI, IJCAI-ECAI, UAI, AISTATS, GreenDataMining, etc. In total, 59 PC memberships
Reviewing, AI/ML conferencesRegular (annually) reviewer since 2016 for NeurIPS, AISTATS, ICLR, ICML, IJCAI, etc.
PositionAssociate Professor, Since 2019
Age46 years
Year Ph.D. degree2010
Years working in the AI/ML domain2008–2023
Total number of publications19 journal articles, 17 peer-reviewed conference papers, and 8 peer-reviewed workshop papers
Number of citations (Google Scholar)1268
H-index (Google Scholar)16
i10-index (Google Scholar)24
Number of AI/ML publications12 journal articles, 19 peer-reviewed conference and workshop papers
Program committees, AI/ML conferencesEuropean Intelligence and Security Informatics Conference (EISIC) 2018; Swedish Artificial Intelligence Society Workshop (SAIS 2023)
Reviewing, AI/ML conferencesHave reviewed submissions for a number of AI/ML conferences and journals, e.g., AAAI, NIPS, AISTATS, UAI, LOD.
PositionAssociate Professor, Since 2023
Age (?)37 years
Year Ph.D. degree2014
Years working in the AI/ML domain2009–2023
Total number of publications12 journal articles, 17 peer-reviewed conference papers, and 2 peer-reviewed international workshop papers
Number of citations (Google Scholar)555
H-index (Google Scholar)12
i10-index (Google Scholar)13
Number of AI/ML publications12 journal articles, 19 peer-reviewed conference and workshop papers
Program committees, AI/ML conferencesEuropean Intelligence and Security Informatics Conference (EISIC) 2018; Swedish Artificial Intelligence Society Workshop (SAIS 2023)
Reviewing, AI/ML conferencesRegular reviewer for the European Intelligence and Security Informatics Conference (EISIC), Swedish Artificial Intelligence Society Workshop (SAIS), The International Conference on Machine Learning, Optimization, and Data Science (LOD), European Network Intelligence Conference (ENIC), The International Conference on Complex Networks and their Applications (COMPLEX NETWORKS)
PositionProfessor, Since 1999
Age 61 years
Year Ph.D. degree1993
Years working in the AI/ML domain2015–2023
Total number of publications4 book chapters, 53 journal articles, 100 peer-reviewed conference papers, and 32 peer-reviewed international workshop papers
Number of citations (Google Scholar)3070
H-index (Google Scholar)27
i10-index (Google Scholar)71
Number of AI/ML publications5 journal articles, 10 peer-reviewed conference and workshop papers
Program committees, AI/ML conferences12 in AI/ML since 2014

Appendix B. Blacklist and Thesaurus

Blacklist
[‘machine learning’, ‘ml’, ‘machine learning ml’, ‘artificial intelligence’, ‘ai’,
‘artificial intelligence ai’, ‘classification’, ‘prediction’, ‘modeling’, ‘algorithms’,
‘prognosis’, ‘accuracy’, ‘optimization’, ‘performance’, ‘machine-learning’, ‘detection’, ‘learning’,
‘machine’, ‘and machine learning’, ‘data’, ‘analysis’, ‘machine learning techniques’,
‘machine learning methods’, ‘network’, ‘machine learning models’, ‘networks’,
‘model’, ‘models’, ‘machine learning approach’, ‘classification’,
‘machine learning algorithms’,
‘machine learning algorithm’, ‘learning algorithms’]
 
Thesaurus
‘Data processing’ = [‘feature selection’, ‘feature extraction’,
‘principal component analysis’,
‘dimensionality reduction’, ‘data augmentation’, ‘feature engineering’, ‘pca’,
‘representation learning’, ‘imbalanced data’, ‘data fusion’, ‘class imbalance’, ‘smote’]
 
‘Learning paradigms’ = [‘reinforcement learning’, ‘supervised learning’,
‘unsupervised learning’, ‘deep reinforcement learning’, ‘transfer learning’,
‘semi-supervised learning’, ‘federated learning’, ‘supervised machine learning’,
‘active learning’, ‘unsupervised machine learning’, ‘explainable ai’, ‘interpretability’,
‘adversarial machine learning’, ‘online learning’, ‘domain adaptation’,
‘interpretable machine learning’, ‘explainable artificial intelligence’, ‘q-learning’,
‘explainability’]
 
‘System and hardware’ = [‘cloud computing’, ‘gpu’, ‘tensorflow’, ‘smartphone’, ‘fpga’,
‘android’, ‘python’, ‘cloud’, ‘fog computing’, ‘mapreduce’, ‘spark’, ‘edge computing’,
‘energy efficiency’, ‘5 g’]
 
# Algorithms
 
‘Ensemble’ = [‘random forest’, ‘random forests’, ‘random forests’, ‘adaboost’,
‘ensemble learning’, ‘xgboost’, ‘ensemble’, ‘gradient boosting’, ‘bagging’, ‘boosting’]
 
‘Linear’ = [‘logistic regression’, ‘linear regression’]
 
‘Nearest neighbor’ = [‘knn’, ‘k-nn’,’k-nearest neighbor’, ‘k-nearest neighbors’]
 
‘Kernel based’ = [‘support vector machine’, ‘svm’, ‘support vector machines’,
‘support vector machine svm’, ‘support vector regression’,
‘support vector machines’,
‘support vector’]
 
‘Tree based’ = [‘decision tree’, ‘decision trees’]
 
‘Clustering’ = [‘clustering’, ‘k-means’, ‘k-means clustering’, ‘cluster analysis’]
 
‘Statistical’ = [‘naive bayes’, ‘naïve bayes’, ‘gaussian process regression’,
‘bayesian optimization’]
 
‘Other algorithms’ = [‘genetic algorithm’, ‘particle swarm optimization’, ‘fuzzy logic’,
‘genetic programming’]
 
‘CNN’ = [‘convolutional neural network’, ‘convolutional neural networks’, ‘cnn’,
‘convolutional neural network cnn’, ‘convolution neural network’]
 
‘RNN’ = [‘lstm’, ‘recurrent neural network’, ‘rnn’, ‘long short-term memory’,
‘recurrent neural networks’]
 
‘Other neural network algorithms’ = [‘neural networks’, ‘neural network’,
‘artificial neural network’, ‘artificial neural networks’, ‘ann’,
‘artificial neural network ann’,
‘deep learning’, ‘deep neural networks’, ‘deep neural network’, ‘deep learning dl’,
‘extreme learning machine’, ‘autoencoder’, ‘generative adversarial networks’,
‘attention mechanism’, ‘multilayer perceptron’, ‘generative adversarial network’]
 
# Applications
 
‘Internet of things’ = [‘internet of things’, ‘iot’, ‘internet of things iot’, ‘sensors’,
‘smart grid’, ‘wearable sensors’]
 
‘Natural language processing’ = [‘natural language processing’, ‘nlp’,
‘sentiment analysis’,
‘text classification’, ‘opinion mining’, ‘bert’, ‘topic modeling’, ‘word embedding’]
 
‘Image processing and computer vision’ = [‘image processing’, ‘image classification’,
‘computer vision’, ‘image recognition’, ‘machine vision’, ‘image analysis’,
‘segmentation’,
‘object detection’, ‘image segmentation’, ‘face recognition’, ‘semantic segmentation’]
 
‘Security’ = [‘anomaly detection’, ‘security’, ‘malware’, ‘intrusion detection’,
‘privacy’,
‘cybersecurity’, ‘malware detection’, ‘intrusion detection system’, ‘network security’,
‘blockchain’, ‘cyber security’, ‘risk assessment’, ‘fraud detection’]
 
‘Social media’ = [‘social media’, ‘twitter’, ‘social networks’, ‘fake news’]
 
‘Healthcare’ = [‘covid-19’, ‘healthcare’, ‘alzheimer s disease’, ‘alzheimer’s disease’, ‘radiomics’,
‘breast cancer’, ‘bioinformatics’, ‘cancer’, ‘precision medicine’, ‘eeg’, ‘biomarkers’, ‘lung cancer’,
‘stroke’, ‘mental health’, ‘parkinson s disease’, ‘sars-cov-2’, ‘biomarker’, ‘diabetes’,
‘electronic health records’, ‘magnetic resonance imaging’, ‘mri’, ‘activity recognition’,
‘depression’, ‘emotion recognition’, ‘drug discovery’, ‘human activity recognition’, ‘epilepsy’,
‘electroencephalography’, ‘computer-aided diagnosis’, ‘computed tomography’,
‘affective computing’, ‘gene expression’, ‘condition monitoring’, ‘medical imaging’,
‘ecg’, ‘neuroimaging’, ‘schizophrenia’, ‘heart disease’]
 
‘Data mining’ = [‘data mining’, ‘big data’, ‘data science’, ‘text mining’,
‘big data analytics’,
‘data analytics’, ‘pattern recognition’, ‘data analysis’, ‘information retrieval’,
‘information extraction’]
 
‘Other applications’ = [‘fault diagnosis’, ‘industry 4 0’, ‘predictive maintenance’,
‘fault detection’, ‘agriculture’, ‘climate change’, ‘robotics’, ‘virtual reality’, ‘uav’,
‘recommender systems’, ‘decision making’, ‘digital twin’, ‘gis’, ‘smart city’]

References

  1. Rosenblatt, F. Two Theorems of Statistical Separability in the Perceptron. In Proceedings of the Symposium on the Mechanisation of Thought Processes, London, UK, 24–27 November 1958; H.M. Stationary Office: London, UK; Volume I. [Google Scholar]
  2. Rosenblatt, F. Perceptron Simulation Experiments. Proc. Inst. Radio Eng. 1960, 18, 301–309. [Google Scholar] [CrossRef]
  3. Mitchell, T. Machine Learning; McGraw Hill: New York, NY, USA, 1997. [Google Scholar]
  4. Speretta, M.; Gauch, S.; Lakkaraju, P. Using CiteSeer to analyze trends in the ACM’s computing classification system. In Proceedings of the 3rd International Conference on Human System Interaction, Rzeszow, Poland, 13–15 May 2010. [Google Scholar] [CrossRef]
  5. Dong, Y. NLP-Based Detection of Mathematics Subject Classification. In Mathematical Software—ICMS 2018; Lecture Notes in Computer, Science; Davenport, J., Kauers, M., Labahn, G., Urban, J., Eds.; Springer: Cham, Switzerland, 2018; Volume 10931. [Google Scholar] [CrossRef]
  6. Biju, A.K.V.N.; AThomas, S.; Thasneem, J. Examining the research taxonomy of artificial intelligence, deep learning & machine learning in the financial sphere—A bibliometric analysis. Qual. Quant. 2023, 1–30, Online ahead of print. [Google Scholar]
  7. Ajibade, S.M.; Bekun, F.V.; Adedoyin, F.F.; Gyamfi, B.A.; Adediran, A.O. Machine Learning Applications in Renewable Energy (MLARE) Research: A Publication Trend and Bibliometric Analysis Study (2012–2021). Clean Technol. 2023, 5, 497–517. [Google Scholar] [CrossRef]
  8. Zhang, J.Z.; Srivastava, P.R.; Sharma, D.; Eachempati, P. Big data analytics and machine learning: A retrospective overview and bibliometric analysis. Expert Syst. Appl. 2021, 184, 115561. [Google Scholar] [CrossRef]
  9. Diéguez-Santana, K.; González-Díaz, H. Machine learning in antibacterial discovery and development: A bibliometric and network analysis of research hotspots and trends. Comput. Biol. Med. 2023, 155, 106638. [Google Scholar] [CrossRef]
  10. Xu, Z.; Yu, D.; Wang, X. A bibliometric overview of International Journal of Machine Learning and Cybernetics between 2010 and 2017. Int. J. Mach. Learn. Cybern. 2019, 10, 2375–2387. [Google Scholar] [CrossRef]
  11. Kitchenham, B.; Brereton, O.P.; Budgen, D.; Turner, M.; Bailey, J.; Linkman, S. Systematic literature reviews in software engineering—A systematic literature review. Inf. Softw. Technol. 2009, 51, 7–15. [Google Scholar] [CrossRef]
  12. Lundberg, L. Bibliometric mining of research directions and trends for big data. J. Big Data 2023, 10, 112–127. [Google Scholar] [CrossRef]
  13. Ajibade, S.M.; Zaidi, A.; Al Luhayb, A.S.M.; Adediran, A.O.; Voumik, L.C.; Rabbi, F. New Insights into the Emerging Trends Research of Machine and Deep Learning Applications in Energy Storage: A Bibliometric Analysis and Publication Trends. Int. J. Energy Econ. Policy 2023, 13, 303–314. [Google Scholar] [CrossRef]
  14. Su, M.; Peng, H.; Li, S. A visualized bibliometric analysis of mapping research trends of machine learning in engineering (MLE). Expert Syst. Appl. 2021, 186, 115728. [Google Scholar] [CrossRef]
  15. García-Pineda, V.; Valencia-Arias, A.; Patiño-Vanegas, J.C.; Flores Cueto, J.J.; Arango-Botero, D.; Rojas Coronel, A.M.; Rodríguez-Correa, P.A. Research Trends in the Use of Machine Learning Applied in Mobile Networks: A Bibliometric Approach and Research Agenda. Informatics 2023, 10, 73. [Google Scholar] [CrossRef]
  16. Baminiwatta, A. Global trends of machine learning applications in psychiatric research over 30 years: A bibliometric analysis. Asian J. Psychiatry 2022, 69, 102986. [Google Scholar] [CrossRef] [PubMed]
  17. Dindorf, C.; Bartaguiz, E.; Gassmann, F.; Fröhlich, M. Conceptual Structure and Current Trends in Artificial Intelligence, Machine Learning, and Deep Learning Research in Sports: A Bibliometric Review. Int. J. Environ. Res. Public Health 2022, 20, 173. [Google Scholar] [CrossRef] [PubMed]
  18. Zhang, J.; Zhu, H.; Wang, J.; Chen, Y.; Li, Y.; Chen, X.; Liu, W. Machine learning in non-small cell lung cancer radiotherapy: A bibliometric analysis. Front. Oncol. 2023, 13, 1082423. [Google Scholar] [CrossRef] [PubMed]
  19. El-Alfy, E.M.; Mohammed, S.A. A review of machine learning for big data analytics: Bibliometric approach. Technol. Anal. Strateg. Manag. 2020, 32, 984–1005. [Google Scholar] [CrossRef]
  20. Ahmed, S.; Alshater, M.M.; El Ammari, A.; Hammami, H. Artificial intelligence and machine learning in finance: A bibliometric review. Res. Int. Bus. Financ. 2022, 61, 101646. [Google Scholar] [CrossRef]
  21. Goodell, J.W.; Kumar, S.; Lim, W.M.; Pattnaik, D. Artificial intelligence and machine learning in finance: Identifying foundations, themes, and research clusters from bibliometric analysis. J. Behav. Exp. Financ. 2021, 32, 100577. [Google Scholar] [CrossRef]
  22. Jain, S.; Kaur, N.; Verma, S.; Kavita Hosen, A.S.; Sehgal, S.S. Use of Machine Learning in Air Pollution Research: A Bibliographic Perspective. Electronics 2022, 11, 3621. [Google Scholar] [CrossRef]
  23. Angarita-Zapata, J.S.; Maestre-Gongora, G.; Calderín, J.F. A bibliometric analysis and benchmark of machine learning and automl in crash severity prediction: The case study of three colombian cities. Sensors 2021, 21, 8401. [Google Scholar] [CrossRef]
  24. Bidwe, R.V.; Mishra, S.; Patil, S.; Shaw, K.; Vora, D.R.; Kotecha, K.; Zope, B. Deep Learning Approaches for Video Compression: A Bibliometric Analysis. Big Data Cogn. Comput. 2022, 6, 44. [Google Scholar] [CrossRef]
  25. Zhang, B.; Fan, T. Knowledge structure and emerging trends in the application of deep learning in genetics research: A bibliometric analysis [2000–2021]. Front. Genet. 2022, 13, 951939. [Google Scholar] [CrossRef] [PubMed]
  26. Chen, K.; Zhai, X.; Wang, S.; Li, X.; Lu, Z.; Xia, D.; Li, M. Emerging trends and research foci of deep learning in spine: Bibliometric and visualization study. Neurosurg. Rev. 2023, 46, 81. [Google Scholar] [CrossRef] [PubMed]
  27. Feng, C.; Zhou, X.; Wang, H.; He, Y.; Li, Z.; Tu, C. Research hotspots and emerging trends of deep learning applications in orthopedics: A bibliometric and visualized study. Front. Public Health 2022, 10, 949366. [Google Scholar] [CrossRef] [PubMed]
  28. Zhang, K.; Fan, Y.; Long, K.; Lan, Y.; Gao, P. Research Hotspots and Trends of Deep Learning in Critical Care Medicine: A Bibliometric and Visualized Study. J. Multidiscip. Healthc. 2023, 16, 2155–2166. [Google Scholar] [CrossRef] [PubMed]
  29. Khairi, S.S.M.; Bakar MA, A.; Alias, M.A.; Bakar, S.A.; Liong, C.Y.; Rosli, N.; Farid, M. Deep Learning on Histopathology Images for Breast Cancer Classification: A Bibliometric Analysis. Healthcare 2021, 10, 10. [Google Scholar] [CrossRef] [PubMed]
  30. Bai, Y.; Sun, X.; Ji, Y.; Huang, J.; Fu, W.; Shi, H. Bibliometric and visualized analysis of deep learning in remote sensing. Int. J. Remote Sens. 2022, 43, 5534–5571. [Google Scholar] [CrossRef]
  31. Li, Y.; Xu, Z.; Wang, X.; Wang, X. A bibliometric analysis on deep learning during 2007–2019. Int. J. Mach. Learn. Cybern. 2020, 11, 2807–2826. [Google Scholar] [CrossRef]
  32. Keramatfar, A.; Rafiee, M.; Amirkhani, H. Graph Neural Networks: A bibliometrics overview. Mach. Learn. Appl. 2022, 10, 100401. [Google Scholar] [CrossRef]
  33. Kenger, Ö.N.; Özceylan, E. Fuzzy min–max neural networks: A bibliometric and social network analysis. Neural Comput. Appl. 2023, 35, 5081–5111. [Google Scholar] [CrossRef]
  34. Pande, M.; Mulay, P. Bibliometric Survey of Quantum Machine Learning. Sci. Technol. Libr. 2020, 39, 369–382. [Google Scholar] [CrossRef]
  35. Lou, T.; Hung, W. Revival of Classical Algorithms: A Bibliometric Study on the Trends of Neural Networks and Genetic Algorithms. Symmetry 2023, 15, 325. [Google Scholar] [CrossRef]
  36. Yu, D.; Xu, Z.; Wang, X. Bibliometric analysis of support vector machines research trend: A case study in China. Int. J. Mach. Learn. Cybern. 2020, 11, 715–728. [Google Scholar] [CrossRef]
  37. Gupta, B.M.; Dhawan, S.M. Indian Research on Artificial Neural Networks: A Bibliometric Assessment of Publications Output during 1999–2018. Int. J. Knowl. Content Dev. Technol. 2020, 10, 29–46. [Google Scholar]
  38. Ezugwu, A.E.; Oyelade, O.N.; Ikotun, A.M.; Agushaka, J.O.; Ho, Y.S. Machine Learning Research Trends in Africa: A 30 Years Overview with Bibliometric Analysis Review. Arch. Comput. Methods Eng. 2023, 30, 4177–4207. [Google Scholar] [CrossRef] [PubMed]
  39. Herrera-Viedma, E.; Martinez, M.A.; Herrera, M. Bibliometric tools for discovering information in database. In Lecture Notes in Computer Science (Including Subseries Lecture Notes in Artificial Intelligence and Lecture Notes in Bioinformatics); Fujita, H., Ed.; Springer International Publishing: Cham, Switzerland, 2016; pp. 193–203. [Google Scholar]
  40. Gutiérrez-Salcedo, M.; Martínez M, Á.; Moral-Munoz, J.A.; Herrera-Viedma, E.; Cobo, M.J. Some bibliometric procedures for analyzing and evaluating research fields. Appl. Intell. 2018, 48, 1275–1287. [Google Scholar] [CrossRef]
  41. Jappe, A. Professional standards in bibliometric research evaluation? A meta-evaluation of European assessment practice 2005–2019. PLoS ONE 2020, 15, e0231735. [Google Scholar] [CrossRef]
  42. Sharma, B.; Boet, S.; Grantcharov, T.; Shin, E.; Barrowman, N.J.; Bould, M.D. The h-index outperforms other bibliometrics in the assessment of research performance in general surgery: A province-wide study. Surgery 2013, 153, 493–501. [Google Scholar] [CrossRef]
  43. Mazov, N.A.; Gureev, V.N.; Glinskikh, V.N. The Methodological Basis of Defining Research Trends and Fronts. Sci. Tech. Inf. Process. 2020, 47, 221–231. [Google Scholar] [CrossRef]
  44. Clarivate Analytics. Research Fronts 2021. 2022. Available online: https://discover.clarivate.com/ResearchFronts2021_EN (accessed on 29 April 2023).
  45. Van Eck, N.J.; Waltman, L. Visualizing bibliometric networks. In Measuring Scholarly Impact; Springer International Publishing: Cham, Switzerland, 2014; pp. 285–320. [Google Scholar]
  46. Amjad, T.; Shahid, N.; Daud, A.; Khatoon, A. Citation burst prediction in a bibliometric network. Scientometrics 2022, 127, 2773–2790. [Google Scholar] [CrossRef]
  47. Zhang, Y.; Zhang, G.; Zhu, D.; Lu, J. Scientific evolutionary pathways: Identifying and visualizing relationships for scientific topics. J. Assoc. Inf. Sci. Technol. 2017, 68, 1925–1939. [Google Scholar] [CrossRef]
  48. Boyack, K.W.; Newman, D.; Duhon, R.J.; Klavans, R.; Patek, M.; Biberstine, J.R.; Schijvenaars, B.; Skupin, A.; Ma, N.; Börner, K. Clustering more than two million biomedical publications: Comparing the accuracies of nine text-based similarity approaches. PLoS ONE 2011, 6, e18029. [Google Scholar] [CrossRef]
  49. Sánchez, M.V.G. “Chen, C. CiteSpace: A Practical Guide for Mapping Scientific Literature [CiteSpace: Una Guía Práctica para el Mapeo de la Literatura Científica]; Hauppauge, N.Y., Ed.; Nova Science: Hauppauge, NY, USA, 2016; 169p; ISBN 978-1-53610-280-2; eBook: 978-1-53610-295-6”. Investig. Bibl. 2017, 31, 293–295. [Google Scholar]
  50. Wong, D. VOSviewer. Tech. Serv. Q. 2018, 35, 219–220. [Google Scholar] [CrossRef]
  51. Van Eck, N.J.; Waltman, L. Text mining and visualization using VOSviewer. arXiv 2011, arXiv:1109.2058. [Google Scholar]
  52. Markscheffel, B.; Schröter, F. Comparison of two science mapping tools based on software technical evaluation and bibliometric case studies. Collnet J. Scientometr. Inf. Manag. 2021, 15, 365–396. [Google Scholar] [CrossRef]
  53. Flach, P. Machine Learning: The Art and Science of Algorithms That Make Sense of Data; Cambridge University Press: Cambridge, MA, USA, 2012. [Google Scholar]
  54. Norvig, P.R. Intelligence SA. A Modern Approach; Rani, M., Nayak, R., Vyas, O.P., Eds.; Prentice Hall: Upper Saddle River, NJ, USA, 2015. [Google Scholar]
  55. Rani, M.; Nayak, R.; Vyas, O.P. An ontology-based adaptive personalized e-learning system, assisted by software agents on cloud storage. Knowl. Based Syst. 2002, 90, 33–48. [Google Scholar] [CrossRef]
  56. Von Rueden, L.; Mayer, S.; Beckh, K.; Georgiev, B.; Giesselbach, S.; Heese, R.; Kirsch, B.; Pfrommer, J.; Pick, A.; Ramamurthy, R.; et al. Informed machine learning—A taxonomy and survey of integrating prior knowledge into learning systems. IEEE Trans. Knowl. Data Eng. 2021, 35, 614–633. [Google Scholar] [CrossRef]
  57. Shyam, R.; Singh, R. A taxonomy of machine learning techniques. J. Adv. Robot. 2021, 8, 18–25. [Google Scholar]
  58. Sammet, J.E.; Ralston, A. The new (1982) computing reviews classification system—Final version. Commun. ACM 1982, 25, 13–25. [Google Scholar] [CrossRef]
  59. Pedregosa, F.; Varoquaux, G.; Gramfort, A.; Michel, V.; Thirion, B.; Grisel, O.; Blondel, M.; Prettenhofer, P.; Weiss, R.; Dubourg, V.; et al. Scikit-learn: Machine learning in Python. J. Mach. Learn. Res. 2011, 12, 2825–2830. [Google Scholar]
  60. Rose, M.E.; Kitchin, J.R. Pybliometrics: Scriptable bibliometrics using a Python interface to Scopus. Softwarex 2019, 10, 100263. [Google Scholar] [CrossRef]
  61. Corder, G.W.; Foreman, D.I. Nonparametric Statistics: A Step-by-Step Approach, 2nd ed.; John Wiley & Sons: Hoboken, NJ, USA, 2014. [Google Scholar]
  62. Wan, Z.; Liu, C.; Zhang, M.; Fu, J.; Wang, B.; Cheng, S.; Ma, L.; Quilodrán-Casas, C.; Arcucci, R. Med-UniC: Unifying Cross-Lingual Medical Vision-Language Pre-Training by Diminishing Bias. In Proceedings of the 37th Conference on Neural Information Processing Systems (NeurIPS 2023), New Orleans, LA, USA, 10–16 December 2023. [Google Scholar]
  63. Delbrouck, J.-B.; Saab, K.; Varma, M.; Eyuboglu, S.; Chambon, P.; Dunnmon, J.; Zambrano, Z.; Chaudhari, A.; Langlotz, C. ViLMedic: A framework for research at the intersection of vision and language in medical AI. In Proceedings of the 60th Annual Meeting of the Association for Computational Linguistics System Demonstrations, Dublin, Ireland, 22–27 May 2022; pp. 23–34. [Google Scholar]
  64. Robertson, S. Understanding inverse document frequency: On theoretical arguments for IDF. J. Doc. 2004, 60, 503–520. [Google Scholar] [CrossRef]
Figure 1. Overview of the mining process.
Ai 05 00012 g001
Figure 2. The number of classified documents (i.e., documents present in at least one research direction defined by the thesaurus) as a function of the number of keywords in the thesaurus.
Ai 05 00012 g002
Figure 3. The expert-defined hierarchical taxonomy with the research directions considered.
Ai 05 00012 g003
Figure 4. Total number of documents per year in ML for the period of 2013 to 2022.
Ai 05 00012 g004
Figure 5. The relative proportion of the total number of documents for the five top-level research directions in ML for the period of 2013 to 2022.
Ai 05 00012 g005
Figure 6. Growth factor per year for the five top-level research directions in ML.
Ai 05 00012 g006
Figure 7. The number of documents containing the keyword “reinforcement learning” in the title, abstract, or author-defined list of keywords.
Ai 05 00012 g007
Figure 8. The average Normalized Citation Score (NCS) for the five top-level research directions in ML.
Ai 05 00012 g008
Figure 9. The relative proportion of the total number of documents for the two research directions Neural Networks and Other Algorithms Than Neural Networks for the period 2013 to 2022.
Ai 05 00012 g009
Figure 10. Growth factor per year for the two research directions Neural Networks and Other Algorithms Than Neural Networks.
Ai 05 00012 g010
Figure 11. The average Normalized Citation Score (NCS) for the two research directions Neural Networks and Other Algorithms Than Neural Networks.
Ai 05 00012 g011
Figure 12. The relative proportion of the total number of documents for the three research directions CNN, RNN, and Other Neural Network Algorithms for the period 2013 to 2022.
Ai 05 00012 g012
Figure 13. Growth factor per year for the three research directions CNN, RNN, and Other Neural Network Algorithms.
Ai 05 00012 g013
Figure 14. The average Normalized Citation Score (NCS) for the three research directions CNN, RNN, and Other Neural Network Algorithms.
Ai 05 00012 g014
Figure 15. The relative proportion of the total number of documents for the research directions related to Algorithms Other Than Neural Networks for the period of 2013 to 2022.
Ai 05 00012 g015
Figure 16. Growth factor per year for the research directions related to Algorithms Other Than Neural Networks.
Ai 05 00012 g016
Figure 17. The average Normalized Citation Score (NCS) for the research directions related to Algorithms Other Than Neural Networks.
Ai 05 00012 g017
Figure 18. The relative proportion of the total number of documents for the research directions related to Applications for the period 2013 to 2022.
Ai 05 00012 g018
Figure 19. Growth factor per year for the research directions related to Applications.
Ai 05 00012 g019
Figure 20. Growth factor per year for the research directions related to Applications, except for IoT.
Ai 05 00012 g020
Figure 21. The average Normalized Citation Score (NCS) for the research directions related to Applications.
Ai 05 00012 g021
Figure 22. The relative proportion of the total number of documents for the four geographic regions considered.
Ai 05 00012 g022
Figure 23. Growth factor per year for the four geographic regions considered.
Ai 05 00012 g023
Figure 24. The average Normalized Citation Score (NCS) for the four geographic regions considered.
Ai 05 00012 g024
Figure 25. The 10 most productive authors in ML during the period of 2013 to 2022.
Ai 05 00012 g025
Figure 26. The number of documents per year for the five most productive authors in ML.
Ai 05 00012 g026
Figure 27. The 10 largest sources of ML documents during the period 2013 to 2022.
Ai 05 00012 g027
Figure 28. The number of documents per year for the five largest sources of ML documents.
Ai 05 00012 g028
Table 1. Bibliometric studies for ML in different application areas.
Ref.#DocsDatabasesTools/GraphsParameters AnalyzedYearsAppl. Area
[13]969ScopusVOSviewer, line, pie and bar chartsproductivity, citations, subject areas, journals, authors, geographic distribution, keywords2012–2022Energy storage
[7]1218ScopusVOSviewer, line, pie and bar chartsproductivity, citations, subject areas, document type, journals, authors, geographic distribution, funding, keywords2012–2021Renewable energy
[14]3057WoS Core CollectionVOSviewer, line and bar chartsproductivity, geographic distribution, authors, journals, citations, keywords2000–2019Engineering
[15]260Scopus and WoSline and bar charts, point and network plotsproductivity, citations, geographic distribution, journals, authors, keywords2006–2022Mobile networks
[9]1596ScopusVOSviewer, line and bar charts, word cloud, point plotsproductivity, geographic distribution, authors, keywords, trends2006–2022Antibacterial discovery & development
[16]1671WoSVOSviewer, CiteSpace, line chartproductivity, research directions, citations.1991–2020Psychiatry
[17]1215ScopusVOSviewer, line and bar charts, word cloudproductivity, citations, journals, geographic distribution, authors, keywords, trends.1988–2022Sports
[18]197WoS Core CollectionVOSviewer, Bibliometrix, line and bar chartsproductivity, citations, journals, authors, keywords, 2000–2022Lung cancer radiotherapy
[19]1587WoSVOSviewer, line, pie and bar chartsproductivity, citations, research area, journals, geographic distribution, keywords1998–2018Big data analytics
[20]348ScopusVOSviewer, line and bar chartsproductivity, citations, geographic distribution, journals, authors, keywords2011–2021Finance
[21]283Scopusbar charts, network plotsproductivity, citations, influential topics1986–2021Finance
[6]723WoSVOSviewer, bar charts, treemap, point plotsproductivity, citations, geographic distribution, authors, keywords 1993–2022Finance
[22]924WoSVOSviewer, Bibliometrix, line and pie chartsproductivity, document type, research areas, keywords, authors, journals, geographic distribution, 1990–2022Air pollution
[23]2318Scopus and IEEEVOSviewer, line and bar charts productivity, citations, geographic distribution, keywords2010–2020Traffic accidents
[24]86Scopus and WoSVOSviewer, bar and pie charts, alluvial diagram, treemapproductivity, citations, document type, geographic distribution, authors, keywords2011–2021Video compression
[25]1754Science Citation Ind. Exp.VOSviewer, CiteSpace, line and bar chartsproductivity, citations, geographic distribution, journals, keywords2000–2021Genetics research
[26]273WoSVOSviewer, CiteSpace, bar chart.productivity, citations, geographic distribution, journals2016–2022Spine research
[27]822WoS Core CollectionCiteSpace, line and bar chartsproductivity, geographic distribution, authors, journals, keywords2015–2021Orthopedics
[28]1708WoSVOSviewer, CiteSpace, Bibliometrix, line and bar chartsproductivity, citations, geographic distribution, authors, journals, keywords2012–2022Critical care medicine
[29]373ScopusVOSviewer, Bibliometrix, productivity, citations, geographic distribution, authors, journals, keywords2014–2021Breast cancer research
[30]2467WoS Core CollectionCiteSpace, line chartsproductivity, citations, journals, authors, geographic distribution, keywords2014–2020Remote sensing
Table 2. Other bibliometric studies in ML.
Ref.#DocsDatabasesTools/GraphsParameters AnalyzedYearsFocus
[31]5722WoSVOSviewer, CiteSpace, bar charts, treemap, productivity, citations, geographic distribution, authors2007–2019Deep learning
[8]2160ScopusVOSviewer, Bibliometrix, Gephi, line, pie and bar charts, network plots, word cloudproductivity, citations, geographic distribution, emerging topics, keywords2006–2020Big data analytics and machine learning
[32]1280ScopusVOSviewer, Bibexcel, line and bar charts, treemap, word cloudsproductivity, citations, document type, subject categories, geographic distribution, authors, keywords2004–2020Graph neural networks
[33]262Scopus and WoSVOSviewer, line, pie and bar charts, treemap, productivity, citations, document type, geographic distribution, authors, application areas, journals, keywords1992–2022Fuzzy min-max neural networks
[34]430Scopus and WoSline, pie and bar charts, treemapproductivity, research area, authors, journals2006–2019Quantum machine learning
[35]1829Social Science Citation IndexLine chartsproductivity, citations, geographic distribution, document type, research area, journal, authors2002–2021Neural networks and genetic alg.
[10]544International journal of machine learning and cyberneticsVOSviewerCitations, geographic distribution, authors, keywords, 2010–2017International journal of machine learning and cybernetics
[36]13,224Science Citation Index Expanded and Social Science Citation IndexVOSviewer, bar and line charts. Productivity, citations, trends, geographic distribution, authors, journals, keywords2000–2018Support vector machines and China
[37]8260ScopusLine and bar charts, productivity, citations, application areas, geographic distribution, journals, authors1999–2018Artificial neural networks and India
[38]2761Science Citation Index ExpandedLine and bar charts,productivity, citations, application areas, geographic distribution1993–2021Africa
Table 3. The major contributing countries in ML for the period 2013 to 2022.
CountryNumber of DocumentsCountryNumber of Documents
United States of America95,912South Korea11,807
China73,829Spain10,895
India48,818Brazil7604
United Kingdom26,415Netherlands6998
Germany22,689Saudi Arabia6866
Canada15,766Switzerland6606
Italy14,286Russian Federation6527
Australia12,491Turkey6010
Japan12,457Malaysia5660
France12,172Taiwan5591
Disclaimer/Publisher’s Note: The statements, opinions and data contained in all publications are solely those of the individual author(s) and contributor(s) and not of MDPI and/or the editor(s). MDPI and/or the editor(s) disclaim responsibility for any injury to people or property resulting from any ideas, methods, instructions or products referred to in the content.

