1. Introduction
Automatic Text Summarization (ATS) has recently gained importance in helping the capture of enormous amounts of information in multiple modalities, especially as the internet presents an (almost) endless source of data in terms of audio–visual information as well as textual samples. In this paper, we focus on text data, usually enriched with an abundance of details, offering information beyond our needs and sometimes increasing the effort required to identify the most relevant snippets [
1]. Fortunately, (intelligent) search algorithms help to identify interesting data since millions of documents are generally available. Even specific search requests usually result in at least thousands of hits, nevertheless, longing to collect the particularly important aspects within the text. Further, a huge amount of text-based information is generated every day, making it difficult for individuals and organizations to manage, understand, and utilize these details. This discussion can be easily extended to collections of texts [
2].
In general, not just considering the internet, where algorithms (somehow) assist the users [
3], manual selection of important information from a large volume of data, perhaps spread across multiple sources, is very challenging for human beings. Consequently, text summarization has become an important component of every text analysis tool, assisting users to identify and navigate large pieces of content quickly by providing short and coherent summaries of key ideas. In this sense, ATS extracts or rewrites the most important information from an authentic text document. The main goal of ATS is to minimize the size of the source text while maintaining all important aspects. The authors of [
4] highlight four main reasons behind why ATS tools are beneficial:
Summaries minimize reading time and effort.
Summaries make document selection easier when researching.
Automatic text summarization enhances indexing efficiency.
Automatic text summarization techniques are less biased compared to human indexing.
An important element of ATS is the evaluation of the generated output. Initially, automatically produced summaries were evaluated manually by human judges, who were entrusted with determining the quality of the results. Although this procedure presents multiple challenges, there are at least two of them that should be kept in mind:
Human judges may have their own biases, preferences, and opinions that influence their evaluations [
5]. These aspects can impact the assessment of summary quality and thus, make the results less objective.
Human evaluations can also often be time- and resource-consuming, particularly when it comes to difficult text summarization tasks [
6].
Research, for instance in [
5,
7], already shows the effectiveness of human scoring as the primary metric for evaluating text summaries and discusses the reliability and challenges associated with human evaluation.
However, to reduce manual effort, increase objectivity, and allow scalability, multiple evaluation methodologies were already introduced, for instance, Recall-Oriented Understudy for Gisting Evaluation (ROUGE) [
8], Text Generation Evaluating with Contextualized Embeddings and Earth Mover Distance (MoverScore) [
9], etc. Nevertheless, these state-of-the-art evaluation metrics also bear some drawbacks and limitations, which are described in
Section 2. Therefore, ideally, an advanced summarization metric is needed to evaluate machine-generated summaries tackling the challenges additionally stated in
Section 2.
This metric should be constructed in the following way: While evaluating and measuring the quality of summaries, this metric considers factors like coherence, informativeness, redundancy, and bias avoidance. Additionally, specific focus might be placed on tasks where a reference summary is not available or is being created with enormous effort. Thus, the creation of proper evaluation methods is important for guiding the development of efficient summarization models.
In this manuscript, we propose a novel metric that avoids the necessity for reference summaries. Instead, we use the original text as a reference, supposing it already represents all essential details. For this, the suggested metric (cf.
Section 3) is based on four important factors, showing high relevance in the following domains, Semantic Similarity, Redundancy, Relevance, and Bias Avoidance Analysis. Details on the metric’s composition are introduced and discussed in
Section 3. Besides theoretical concepts, we also tested our approach on several data sets from multiple content domains (cf.
Section 4.1). The respective results and discussions are presented in
Section 4. Before we present the novel metric in more depth, we recapitulate the current state-of-the-art and derive respective research questions throughout the next sections.
2. Related Work and Motivation
Natural Language Processing (NLP) has made great progress in general, specifically in the domain of evaluating text summarization techniques. We already see a lot of effort to estimate the quality of (automatic) text generation approaches as well as related summaries, in order to fulfill the requirements for accurate and comprehensive assessments. These approaches allow us to analyze the summary quality on both a quantitative and qualitative level, supporting in a technical perspective the creation and improvement of summarization models. However, considering the assessment of automatically generated summaries, we still see no specific evaluation approaches, focusing only on this domain. Existing work is mainly transferred from other domains to estimate the summary’s quality. The current approaches will be sketched in the following, highlighting the particular use in the domain of automatic text summarization.
Regarding the current literature, we identified several automatic evaluation metrics, selecting the most prominent approaches: ROUGE [
8], Bilingual Evaluation Understudy (BLEU) [
10], and Metric for Evaluation of Translation with Explicit Ordering (METEOR) [
11]. These metrics mainly focus on content overlap, n-gram matching, and linguistic features to gauge the fidelity of generated summaries. In the field of text summarization, ROUGE is by far the most popular and widely used metric. It offers a comprehensive evaluation of the effectiveness of summarization by evaluating several factors such as precision, recall, and F1-score, making it a possible option for summarization evaluation (cf. [
8]). However, it faces limitations when it comes to capturing word order and semantic meaning. Also, it is quite sensitive to even small changes in reference summaries, and thus, often generates inconsistent results [
8]. ROUGE typically involves the comparison of generated summaries to human-generated references. The authors applied Pearson’s correlations to understand how well the ROUGE scores (automatic evaluation metric) align with human-assigned scores for content coverage. However, in our case, where human reference summaries are not available, but the original content is used as a reference, Pearson’s correlation may not be applicable.
The BLEU algorithm was initially developed to evaluate machine translation tasks. However, an adaptation towards the evaluation of text summarization tasks could be achieved [
10]. In this sense, BLEU measures the precision of n-grams in the machine-generated summary, concerning the human reference summaries, providing a clear and understandable score. However, since BLEU favors short summaries, being the metric’s major drawback, it might not accurately reflect the quality of longer descriptions as BLEU is more precision-oriented. The longer sentences tend to have lower precision because there are more opportunities for mismatches. It also fails to identify the semantic meaning of a word [
10].
METEOR is another metric that was originally designed for machine translation tasks. Both machine translation and summarization involve natural language generation from a source text. So, it is possible to use METEOR to evaluate the quality of text summaries in a similar manner as it evaluates machine translation. One of METEOR’s key features is that it considers a variety of linguistic concepts, including stemming and synonym matching. It can therefore handle paraphrased texts better than BLEU and ROUGE [
11]. However, METEOR can lead to inaccuracies when evaluating domain-specific or seldom-encountered words as it uses a generic synonym dictionary (e.g., WordNet) and a stemming algorithm (e.g., Porter Stemmer). Also, METEOR results can be changed based on the tunable parameters such as penalty values [
11]. If these parameters are not appropriately set, METEOR may produce unreliable evaluation scores.
Character n-gram F-score (CHRF) [
12] evaluates summaries at the character level, capturing content overlap and penalizing slight differences. This approach encounters difficulties where semantic understanding and fluency matter more than achieving an exact match. CHRF mitigates the sensitivity of n-gram metrics to synonym and paraphrase usage. Although CHRF is similar to ROUGE and BLEU (evaluate text by measuring the overlap of n-grams). However, the advantages of CHRF include its simplicity and resistance to changes in word order. Nevertheless, it has also a limited semantic understanding [
12].
The aforementioned measurements offer useful insights into lexical alignment and fluency but may ignore details linked to coherence and contextual understanding. In response, additional techniques like MoverScore [
9] and ROUGE with Word Embeddings (ROUGE-WE) [
13] have been developed that use word embeddings and semantic metrics to capture more in-depth content preservation and semantic similarity. Their particular characteristics will be briefly discussed.
MoverScore uses word embeddings to measure semantic similarity between words in the human reference and machine-generated summaries. This creates robustness to capture semantic relationships, which is one of the key aspects of evaluating the quality of summaries. However, MoverScore requires pre-trained word embeddings. Therefore, the metric’s assessment is influenced by the particular models being used for word embedding [
9].
The ROUGE-WE metric solved the problem of the traditional ROUGE approach. However, the performance of ROUGE-WE still depends on external resources like different word embedding models and human-generated references.
In [
14], the authors sketched a metric, utilizing a pre-trained masked language model for evaluating summarization and data-to-text generation. However, they do not elaborate further details on an evaluation method for scenarios where human reference summaries are absent.
The authors of [
15] discuss the use of Latent Dirichlet Allocation to improve the comprehension of scientific articles. Instead of reading the whole article, they concentrate on studying abstracts. The authors claim that this approach is quite helpful in understanding the text. This approach links to the evaluation of summaries because it extracts the main topics from different texts (like machine-generated and human-generated summaries), allowing a comparison to see how well a summary captures the main information. In our approach, we tackle this aspect using Latent Semantic Analysis (LSA) (cf.
Section 3.1.1)
In our proposed method, we relied on LSA and Cosine Similarity (CS) to identify matches and relations within texts (cf.
Section 3.1). This combination is a well-known setting for this task. However, the authors of [
16] suggest another way to retrieve information from data sets and find relations using divided spaces. From this perspective, the method in [
16] could be used in future work to access corresponding entities and relations faster.
In general, for a detailed explanation of each measure, we refer to the particular references. Nevertheless,
Table 1 summarizes the main characteristics of each approach. All methods share one common aspect: each metric depends on (human-generated) reference summaries. Therefore, from our point of view, it is necessary to develop a novel approach that is able to evaluate the quality of a text summary in the absence of a reference.
In the following, we conclude the discussion from the introduction and related work to consolidate the motivation of the current manuscript.
As we already discussed in
Section 1, the evaluation of results in tasks like text summarization can be very challenging. Especially for summarization tasks, multiple correct answers are usually possible, depending on several factors and circumstances, for instance, the purpose of the original text or summary, the length of the summary, and the person or system generating the summary. Currently, the community relies on reference summaries (generated by human professionals) and model summaries (generated by algorithms) in order to apply the existing evaluation methods (cf.
Section 2), achieving an assessment of quality for the automatically created summarization. However, the collection of reference summaries sometimes might be difficult and require much effort.
Therefore, our goal is to establish a novel metric for the evaluation of text summarization, reducing or ideally avoiding current drawbacks (cf. related measures in
Section 2 and
Table 1), working in a reference-free manner. Given this goal, we address the following research questions in the remaining manuscript:
- RQ1:
Is it possible to evaluate the quality of a machine-generated summary if we do not have a reference summary?
- RQ2:
Under which circumstances does the technique of using the original content as a point of reference yield the maximum level of effectiveness?
- RQ3:
Can the process of evaluating machine-generated summaries utilizing original input data be more trustworthy and accurate than conventional methods?
- RQ4:
What are important factors to rely on in reference-free metrics?
3. Proposed Approach and Methodology
Our main objective is to evaluate summaries produced by machines without requiring a (human-generated) reference summary. We use the original content as the reference text in the novel metric, called Summary Score without Reference (SUSWIR). In general, the approach is constructed as presented in Equation (
1):
In this sense, is the weighted combination of four factors that assess the quality of the summary Y in relation to the original document X, where X and Y represent raw texts, respectively. Every factor is given a weight, represented by , , which indicates its relative importance of each factor. In particular, we consider the following four factors, which will be further introduced and discussed separately in the respective sections:
Semantic Similarity Factor (SSF): This factor evaluates how well the content of summaries matches the underlying semantic meaning of the original text. In order to maintain the overall concepts and ideas, a good summary must capture the core semantics of the original content. The high semantic similarity suggests that the summary accurately represents the original’s content, enhancing the quality and informativeness of the summary.
Relevance Factor (RLF): This factor quantifies how well the summary conveys the important details from the original content. It examines how closely the summary follows the key ideas of the original content or text. An effective summary highlights the important points and skips unnecessary details.
Redundancy Factor (RDF): This factor measures the amount of redundant information in the summary. Overly redundant summaries normally represent less information, and thus, do not help readers. The evaluation of redundancy ensures that the summary conveys diverse and distinct information, resulting in a concise and useful document.
Bias Avoidance Analysis (BAA): This factor checks for the introduction of subjective opinions or biases in the summary that were not in the original content.
These factors directly impact the effectiveness and comprehensibility of (automatically) generated summaries. A machine-generated summary is more accurate, concise, relevant, and fair when these factors appear together because they contribute to its overall quality.
The total score for SUSWIR is calculated by summing up these different factors. This process allows for a comprehensive assessment of the summary’s quality, taking into account various dimensions. In this sense, SUSWIR has a range from 0 to 1, with higher scores suggesting that the summary covers key information from the original content. Although the proposed metric generates an overall score for the summary assessment, the individual factors are still important. In the evaluation process, each factor offers additional insights into the processed data, providing the option to focus on particular aspects of the assessment. In this sense, the weights
allow to influence each factor. For instance, low values in BAA indicate that the summarizer is likely to make biases. In fact, we highly recommend observing the four factors to become aware (early) of unwanted effects in the automatic summarization. However, a fine-tuning of individual weights is suggested to adapt SUSWIR to the particular needs and characteristics of the task and dataset. In the current proof-of-concept, we do not apply any fine-tuning to the weights or factors (cf.
Section 4.3).
3.1. Semantic Similarity Factor
SSF aims to quantify the level of semantic relatedness or similarity between the original content and its summary. This evaluation provides a measure to determine how the summary captures the main ideas and meaning of the original content. This is important to assess the informativeness and quality of text summaries.
To calculate the SSF between the original content and its associated summary, LSA is used, followed by the calculation of CS. This strategy captures complex text relationships by understanding word meanings and tapping this for tasks like document similarity. This goes beyond basic word matching and reveals the context and ideas within the text. In particular, CS, described in
Section 3.1.2, is the backbone of SSF. We used the LSA-transformed vector for SSF to improve our evaluation. The LSA concept is presented in
Section 3.1.1. The decision to use LSA along with CS rather than using direct CS is supported by (at least) two arguments:
When working with diverse text corpora, direct CS struggles to capture the relationships between words and documents. Additionally, it cannot properly handle synonyms or polysemous words and is sensitive to noisy data.
LSA simplifies text analysis by finding hidden meanings and reducing the complexity of the data. It also helps to filter out noise from the original data, making similarity measures more effective and robust. In order to deal with synonyms, LSA also has the ability to group related words together [
17].
We consider an example: Given two text documents that show following information:
- T1:
“The stock market experienced a significant plunge”.
- T2:
“Share prices in the financial market plummeted sharply”.
If we just use direct CS, there will be a high chance that almost no similarity is found between T1 and T2, because the words in the two documents are quite different. CS is not able to capture the semantic meaning of the text properly. In contrast, a combination of LSA and CS, will at first identify a semantic representation of the two statements and recognizes that “stock market” and “financial market” have almost the same meaning; in a second step, the similarity is calculated afterward. Therefore, LSA helps us to focus on what the words actually mean by simplifying things. For this, computing “similarity” in this manner, the sub-metric recognizes the shared meaning and provides a higher score.
In the following, we introduce the combined concepts of LSA and CS in a theoretical sense and thus, explain how SSF has been calculated.
Given the original content
X and the respective summary
Y, at first, we created a list
D which contains both, the original content and the summary, according to Equation (
2). In a simplified way,
D represents a list of documents.
Based on this listing, vectorization is applied. In our approach, we used the “TF-IDF” vectorizer [
18] to create a document-term matrix (TF-IDF matrix) for documents in
D, resulting in the matrix (numerical representation of texts) given in Equation (
3).
where
is the TF-IDF matrix of the list of text ,
represents the function that generates the TF-IDF vectors,
is the input of the function ,
are the TF-IDF scores of each terms in original content relative to the list of texts or documents in ,
are the TF-IDF scores of each terms in summary relative to the list of texts or documents in .
LSA is applied to the vectorized documents
, resulting in Equation (
4):
where
gives us a
shaped matrix and
represents the function that generates the new matrix using the vectorized documents
.
R (number of rows in the LSA matrix) represents the number of documents, in our case documents are the original content and the summary. Each document is represented as a vector in the TF-IDF matrix.
N represents the number of latent topics or dimensions. LSA allows us to choose how many latent topics or dimensions we want to retain. If we choose to retain
N dimensions, then
N is the number of columns in the LSA matrix.
For this, we can derive the CS components as follows:
where
or shows the first row of matrix which represents the LSA-transformed vector corresponding to the original content. indicates the importance score between the original content and each latent topic () based on LSA.
or shows the second row of matrix which represents the LSA-transformed vector corresponding to the summary. indicates the importance score between the summary and each latent topic () based on LSA.
Finally, SSF (cf. Equation (
7)) represents the similarity of
and
based on those vectors generated in Equations (
5) and (
6).
3.1.1. Latent Semantic Analysis
LSA is a method that reduces the number of dimensions and finds hidden patterns in a group of text documents. It is often used to capture the semantic meaning and relationships between words and documents [
19]. LSA can be generally divided into three different phases:
Document-word frequency matrix: In this phase a document-word matrix of shape is created, where m represents the number of documents and n represents the number of unique words having scores. There are many ways to create a document-word frequency matrix, including methods like Bag-of-Words and TF-IDF. In the current manuscript, we used the TF-IDF approach.
Singular Value Decomposition (SVD): After calculating the document-word frequency matrix, the SVD technique is applied to reduce the dimensionality of this matrix [
20]. The reason is that the initial matrix might be very sparse, noisy, and redundant across its many dimensions.
Topic encoded data: After applying SVD to the document-word frequency matrix, topic-encoded data is produced by preserving the first few columns of the U (document-topic matrix) and V (term-topic matrix) matrices corresponding to the most important singular values. It means that in SVD, the singular values represent the importance of different patterns or dimensions in the original data. These values are ordered from most significant (dominant) to least significant. By preserving the columns associated with the dominant singular values, we effectively capture the most meaningful information and relationships in the data while reducing its dimensionality. This process helps to distill the essential semantic relationships between words and documents, making the data more manageable and informative.
Given these steps, a decomposition of the input matrix can be achieved according to Equation (
8)
Let be the document-term matrix obtained from TF-IDF vectors of the original content and summary. The LSA process decomposes into three matrices:
(document-topic matrix): This represents information about the relationships between documents and topics.
(singular values matrix): This is a diagonal matrix with the singular values denoting each topic’s significance on it.
(term-topic matrix): This represents information about the relationships between words and topics.
3.1.2. Cosine Similarity
CS is a metric that measures the cosine of the angle between two vectors. It is commonly used in text analysis to calculate the similarity between two documents based on their word frequency distributions. It is established through a mathematical definition, involving the dot product of two vectors divided by their respective magnitudes [
21]. Therefore, the similarity between vectors
a and
b is calculated as follows (cf. Equation (
9)):
where
is the angle between the vectors; the greater the angle, the less similar they are.
The dot product of a and b is denoted by a · b.
The vector’s L2 norm or magnitude is represented by .
3.2. Relevance Factor
The main goal of the relevance factor is to measure how well the summary captures the key points and ideas present in the original content. It, therefore, evaluates the semantic alignment between both documents.
In this context, the METEOR method is selected to gauge the quality and relevance of a summary in relation to the original content. We skip using methods like BERT [
22], SBERT [
23] etc., for calculating relevance scores as well as for other linguistic aspects because those methods demand a lot of computing power, memory, and a massive amount of training data. To keep our approach less dependent on external resources (e.g., in terms of computational power; cf.
Section 4.2), we opted for the METEOR method. We employed METEOR in the SUSWIR approach due to its linguistic features, such as stemming and synonym matching, making it particularly well-suited for calculating relevance scores. Both, machine translation (original domain of METEOR) and summarization, involve generating coherent natural language from source texts, forming a basis for METEOR’s application. METEOR’s “Chunk Penalty” is particularly valuable as it assesses the original order and structure of the content, aiding in evaluating summary fluency. Hence, we have chosen METEOR to compute relevance scores for our proposed approach. While METEOR has known limitations (as discussed in
Section 2), we have addressed these concerns by incorporating additional factors into the SUSWIR approach.
For a better understanding of the manuscript’s approach, we briefly introduce the main concepts of METEOR and adapt them with respect to the assessment of summary quality. Details of the particular methods can be found in [
11]. METEOR computes a score that represents the semantic alignment and similarity between the so-called reference (original content) and the candidate (summary) sentences. For this, it takes into account both, exact word matches and similar word changes, that preserve the same meaning. Therefore, the measure provides a detailed evaluation, which is beyond mere overlaps of (basic) words, allowing to check the relevance of the summary.
In the following, we address the steps to achieve a METEOR-based assessment, derived from [
11]. The overall measure is based on the penalized version of the F-score. In this sense, recall
R (Equation (
10)) and precision
P (Equation (
11)) are introduced.
According to [
11], the F-score
F (cf. Equation (
12)) is specifically defined as follows, combining both, precision and recall, into one value.
Additionally, METEOR uses a term called Chunk Penalty (
, cf. Equation (
13)), which is calculated based on the number of contiguous words that are matched between the original content and summary sentences [
11]. This helps to assess the quality of machine-generated summaries by checking whether the summarized content retains its original order and structure. This is important because it ensures that the summary makes sense and flows well, much like how a human would summarize a document.
where
represents the Chunk Penalty.
C represents the number of chunks in the machine-generated summary.
represents the number of unigrams in a machine-generated summary.
is a parameter that adjusts the impact of the chunk penalty; often set to a low number (e.g., 0.25).
Given the aforementioned statements and equations, finally the Relevance Factor (
; Equation (
14)) can be calculated. It is worth noting that in the current implementation of SUSWIR, it is equivalent to the METEOR score.
3.3. Redundancy
For the assessment of redundancy, we rely only on the information included in the summary itself. Redundancy frequently occurs when many phrases express the same idea, leading to needless repetition.
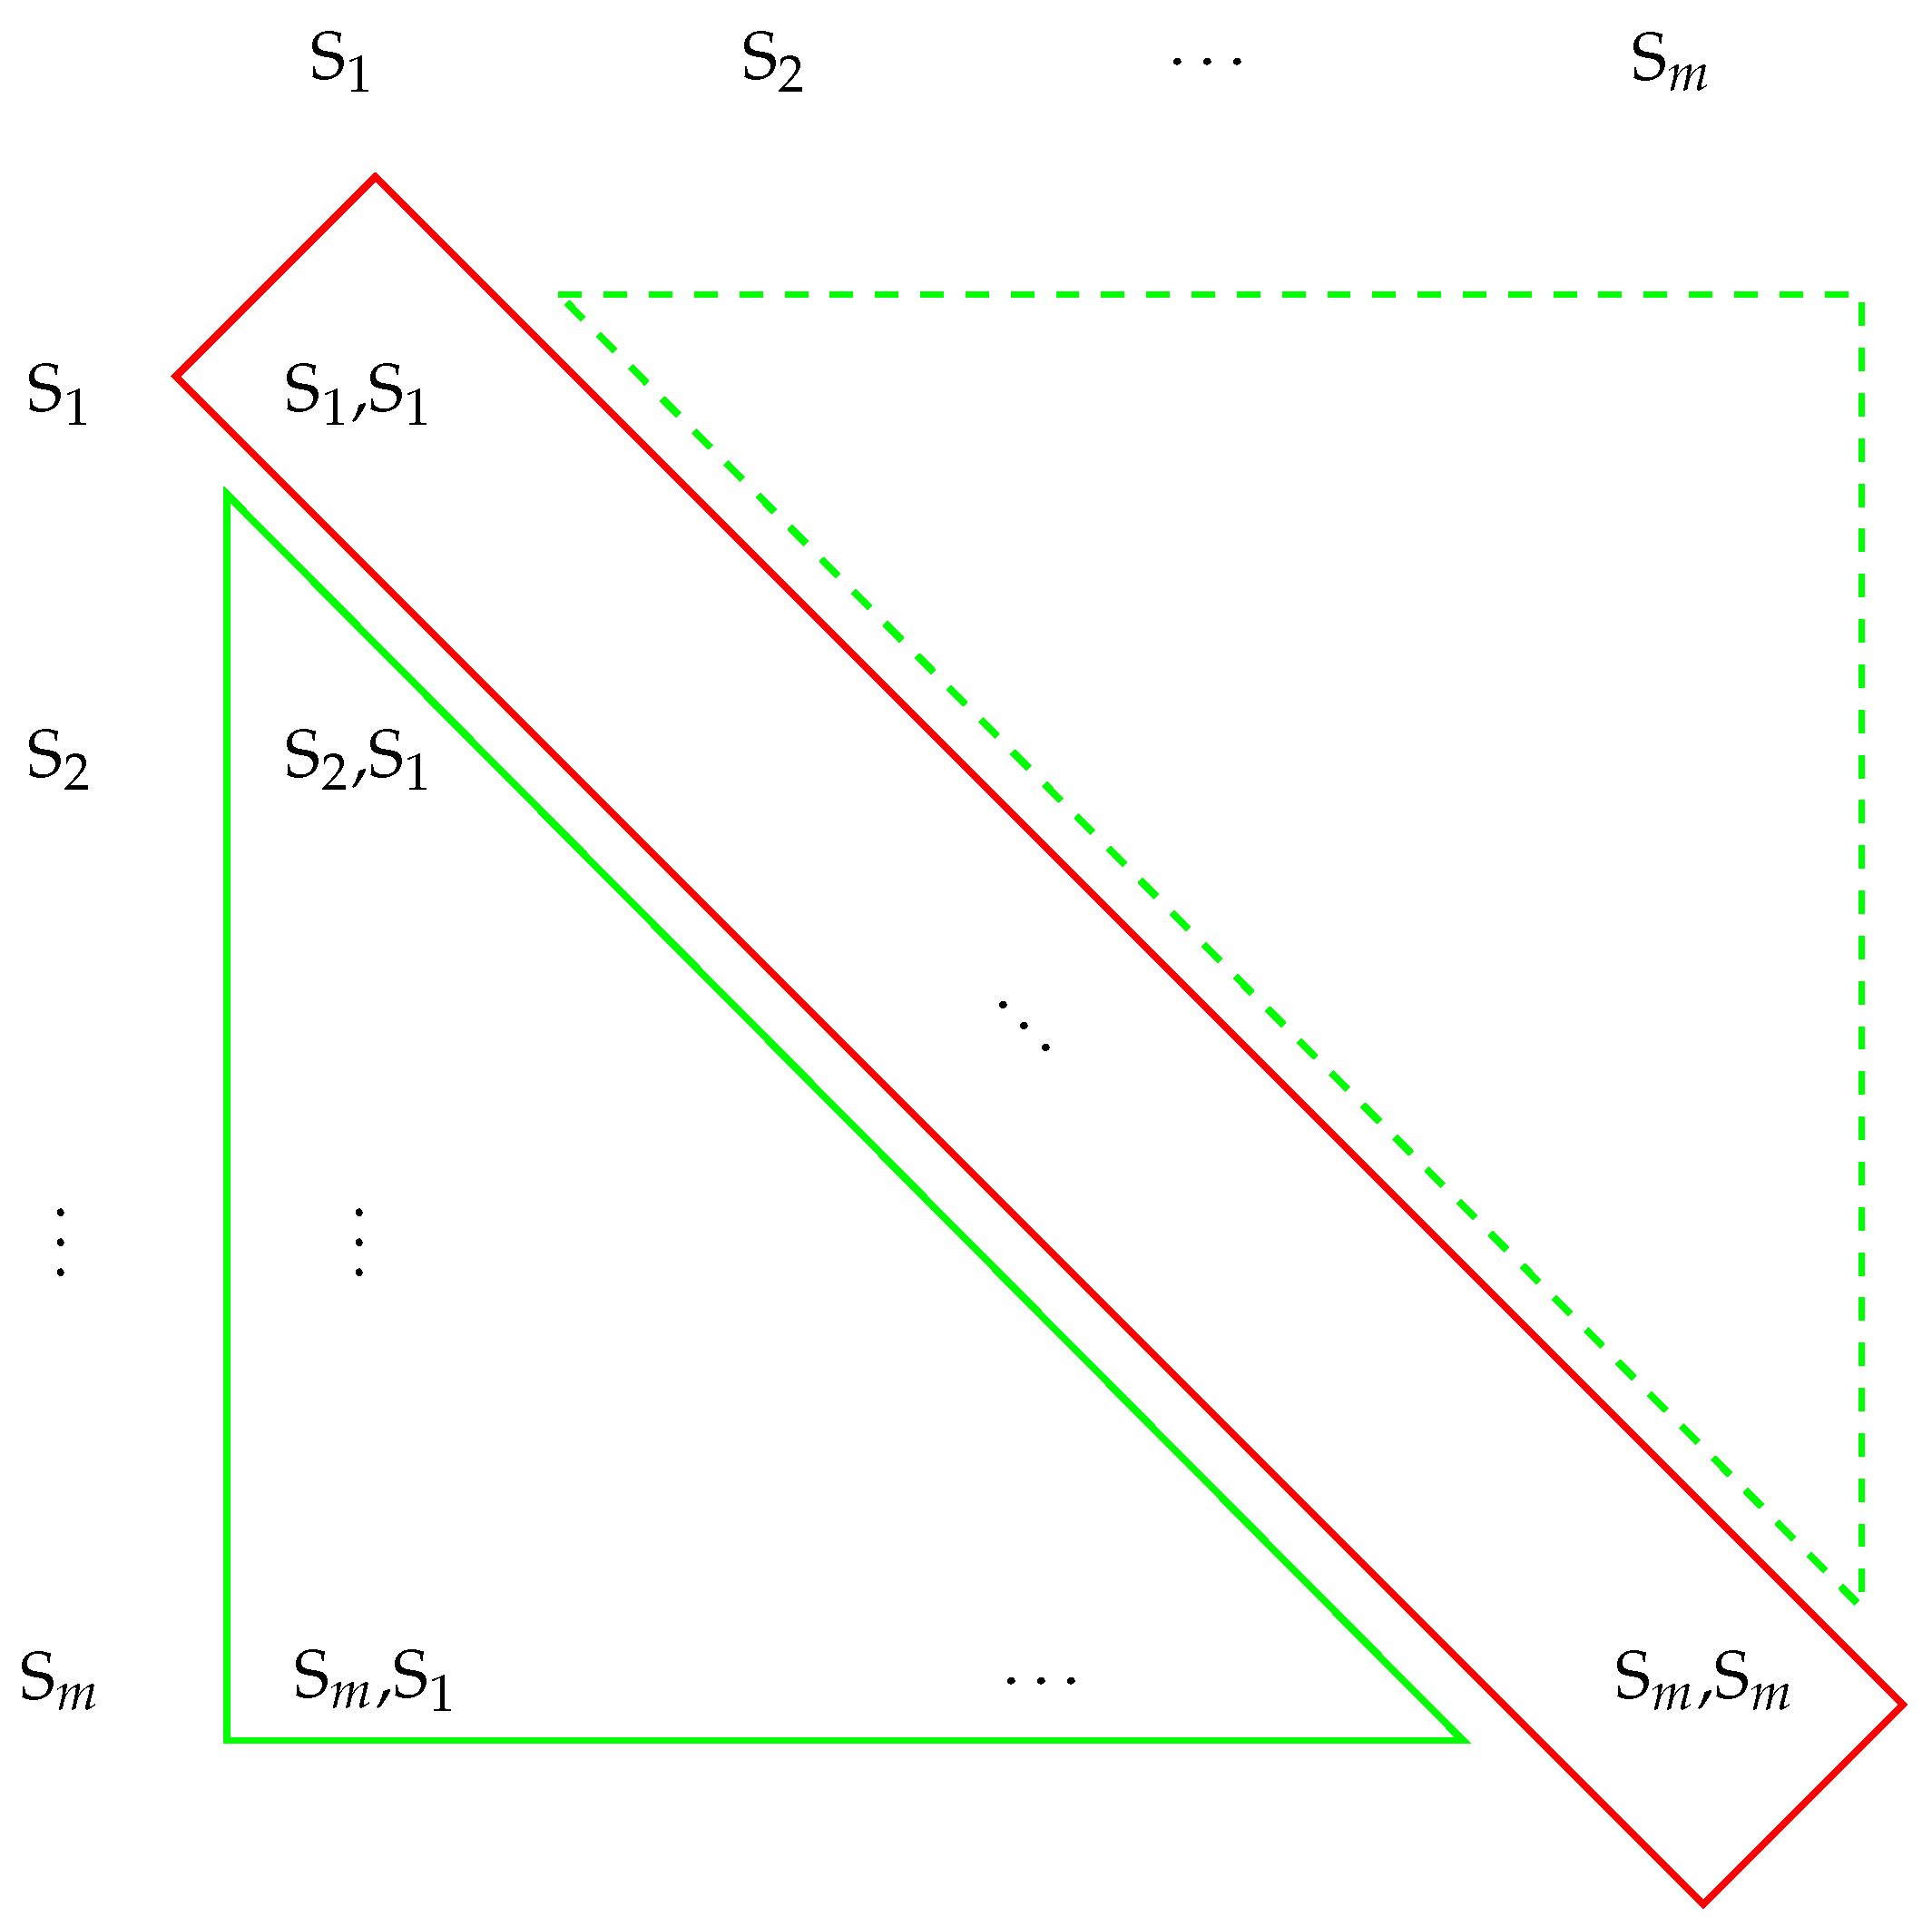
Figure 1 shows the visual representation of how we calculate redundancy in a summary. In the example, the summary contains
m sentences, represented by
, which might provide redundant details.
First, we consider each sentence as an individual piece of information. We calculate the CS between each pair of sentences, neglecting self-comparisons (highlighted in red in
Figure 1), in order to determine the degree of repetition. Self-comparisons are skipped as they always result in a similarity of one, and thus do not provide valuable input to redundancy. The lower and upper triangular in
Figure 1 (highlighted in green) visualize unique pairs of sentences, appearing maybe in permuted order.
Second, we use a predetermined threshold (usually set at 0.5) to evaluate the CS scores. Pairs with scores below this threshold are marked as less redundant, simultaneously accumulating the number of pairs being marked as providing redundant information. We choose the threshold of 0.5 to measure sentence redundancy because it balances sensitivity and specificity. Sensitivity ensures that genuinely redundant sentences are detected, while specificity minimizes the risk of falsely categorizing unrelated sentences as redundant. In text summarization, it is common to expect some level of redundancy to improve the coherence and readability of the summary. A threshold of 0.5, therefore, allows moderate redundancy while ensuring that highly similar sentences are captured. Setting the threshold too low (e.g., below 0.2) might lead to the inclusion of dissimilar sentences, potentially affecting the summary’s quality. Conversely, setting it too high (e.g., above 0.8) might result in the exclusion of genuinely redundant but slightly different sentences.
Finally, we obtain the redundancy score RDF by dividing the number of less redundant sentence pairs by the total number of unique sentence pairs (cf. Equation (
16)). RDF has a scale from 0 to 1, with higher scores suggesting that the summary is less redundant.
We developed the algorithm (cf. Algorithm 1) that calculates the redundancy of a summary text.
| Algorithm 1 Redundancy Analysis |
| Require: Summary |
| Ensure: Redundancy Score |
| 1: | Tokenize the summary into sentences |
| 2: | if number of sentences (n) = 1 then |
| 3: | Set Redundancy Score (redundancy_score) to 1 |
| 4: | else |
| 5: | Apply TF-IDF vectorization to sentences |
| 6: | Set similarity threshold to 0.5 |
| 7: | Initialize less_redundant_count to 0 |
| 8: | for to number of sentences do |
| 9: | for to number of sentences do |
| 10: | Calculate cosine similarity score similarity_score between sentence i and sentence j |
| 11: | if similarity_score < similarity threshold then |
| 12: | Increment less_redundant_count |
| 13: | end if |
| 14: | end for |
| 15: | end for |
| 16: | Calculate total possible pairs: total_pairs |
| 17: | Calculate Redundancy Score: redundancy_score |
| 18: | end if |
| 19: | return redundancy_score |
The entire procedure comprises the following steps:
Extracting Sentences: The first step in the procedure is to break down the summary into individual sentences. Every sentence is considered as an independent piece of information.
Calculating Cosine Similarity: We use CS to obtain the semantic similarity of sentences, represented as vectorized embeddings.
Identifying Redundant Pairs: We determine the cosine similarity score for each pair of sentences in the summary. For this, we classify these sentences as less redundant, providing a score lower than a particular threshold (e.g., 0.5).
Counting Less Redundant Pairs: Based on CS, Algorithm 1 calculates how many pairs of sentences are marked as less redundant.
Total Possible Pairs: The number of total possible pairs of sentences is calculated, using Equation (
15).
where
n represents the total number of sentences in the summary. Note: In cases where the summary consists of just one sentence (n = 1), the redundancy score is set to 1.
Calculating the Redundancy Score: The number of less redundant sentence pairs is divided by the total number of sentence pairs to obtain the redundancy score. The RDF is presented in Equation (
16).
3.4. Bias Avoidance Analysis
BAA shows whether the summary introduces any subjective ideas, opinions, or partiality that are not yet present in the original content. It is important to keep a summary objective and neutral, refraining from introducing any bias. To estimate the possible influence of biases, we rely on Named Entity Recognition (NER) [
24] and Jaccard Similarity (JS) [
25] to evaluate the similarity of named entities between the original content and the summary.
For instance, let us consider an example where the original content comprises named entities such as “food”, “sport”, and “person”. Now, in the summary text, if NER identifies additional entities like “food”, “location”, “person”, and “company”, it indicates that the summary has introduced some bias, for instance “location” and “company”. This means that the summary has incorporated information or entities not found in the original content, potentially leading to a biased representation. BAA helps to ensure that summaries faithfully reflect the source material without undue influence or subjective elements.
In general, NER is used to extract named entities, for instance, names of people, organizations, locations, etc., from a given text. For an overview of recent techniques in the particular field, we refer interested readers to [
26,
27,
28]. A brief introduction is given also in
Section 3.4.1. In our approach, we utilized NER to extract named entities simultaneously from both, the original document and the summary. This provides us with a collection of entities (i.e., one list per text) being present in both texts, which needs to be compared to identify biases.
For this, JS is used, comparing the sets of named entities from the original material and the summary. This similarity score indicates how well the summary represents the named entities present in the original content. The main idea of the concept is introduced in
Section 3.4.2.
Basically, the concept of JS is the backbone of the BAA assessment. Given this observation, the BAA score between the named entity sets
and
can be calculated according to Equation (
17)
where
is the set of named entities taken from the original content,
is the set of named entities taken from the summary,
∩ represents the intersection of sets,
∪ represents the union of sets.
In the following, we consider two examples (with and without bias), discussing the characteristics of BAA.
Example 1 (with bias):
Original Content: “The new restaurant in town offers delicious Italian cuisine”.
Summary: “The amazing new restaurant in town offers mouthwatering Italian cuisine that will leave you craving for more”.
In this example, the summary introduces bias by using subjective terms like “amazing” and “mouthwatering”, which were not present in the original content.
Example 2 (without bias):
In the second example, the summary refrains from introducing any bias and maintains a neutral tone. The terms used in the summary are similar to those in the original content, and there are no subjective opinions or embellishments.
A high BAA score shows that the summary successfully avoids bias, which means that it correctly reflects the named entities found in the original content (cf. Example 2). In other words, a higher score indicates a closer match between the specified entities in the summary and those in the original content. The BAA factor works better in extractive summarization than in abstractive summarization because abstractive summaries tend to contain more unique words. To overcome this limitation of the BAA factor, we can utilize additionally the SSF (cf.
Section 3.1) as a kind of “counterpart”.
3.4.1. Named Entity Recognition
NER is a NLP technique to process natural language that involves finding and categorizing important objects within a given text document, for instance, names of people, companies, places, and dates [
24]. Understanding and extracting structured information from unstructured text data is a crucial function of NER. There are several applications that benefit from NER such as text summarization, information retrieval, and question-answering. Especially for the assessment of possible biases within a text, this method provides a powerful approach. To achieve the relations, NER involves the application of part-of-speech tagging and syntactic analysis, identifying and classifying sequences of words that correspond to specific named entity categories.
The process can be explained as follows: We consider a given text document D, containing a sequence of words,
where
n is the total number of words. Based on D the following steps are processed:
Part-of-Speech Tagging (POS): This method assigns a grammatical category to each word in a text, such as a noun, verb, or adjective. In order to figure out the grammatical role of a word within a sentence, POS is really important.
Syntactic Analysis: Syntactic analysis is a method of analyzing sentence structure to find word connections and phrases. This helps in the identification of multi-word entities like “New York” (a place) and “John Smith” (a person).
Named Entity Classification: NER classifies the recognized phrases into specified groups of named entities after POS tagging and syntactic analysis. These categories include a wide range of elements, including names of people and organizations, as well as places and dates.
3.4.2. Jaccard Similarity
In JS, the intersection of two nominal attributes is divided by their union to determine the similarity between them [
29,
30]. It is a widely used method to assess how similar two objects are, for instance, two text documents [
25]. The basic equation is stated in Equation (
19).
where
and represent the two sets being compared,
represents the number of elements that are common to both sets (the intersection of sets),
represents the total number of unique elements in both sets (the union of sets).
The JS score ranges from 0 to 1, with higher scores suggesting that the identified entities in the original content and the summary are more comparable.
5. Conclusions
In this manuscript, we demonstrated an approach to evaluate the quality of machine-generated summaries in scenarios where reference summaries are unavailable. We used the original content as the reference text to evaluate summaries as it contains more information. Our proposed SUSWIR approach (introduced in
Section 3) effectively addresses the limitations inherent in widely used summarization metrics such as ROUGE or METEOR. This approach employs four factors to check the quality of the summary. To evaluate our approach, we compared it experimentally to ROUGE and METEOR on five datasets (cf.
Section 4.1). The empirical results of our study reveal the more reliable and superior performance of the SUSWIR approach in comparison to initial metrics (cf.
Table 4 and
Section 4.4), when human reference summaries are unavailable. Across the analysis of results from five datasets (cf.
Table 4), the SUSWIR approach consistently surpasses both raw (RD) and pre-processed clean data (CD) in other evaluation metrics. In our experimental findings (see
Table 4), the BBC Articles dataset stands out with impressive evaluations across all metrics, notably yielding a top-tier ROUGE (especially ROUGE-1 and ROUGE-L) score of 0.663. SUSWIR closely aligns with the performance of ROUGE on this dataset. Considering other datasets, SUSWIR consistently achieves notable results, including 0.482 on the BillSum dataset, 0.491 on the DialogSum dataset, 0.510 on the SAMSum dataset, and 0.427 on the CNN/DailyMail dataset. In contrast, the other two metrics struggle to generate reliable scores in these instances. SUSWIR also gives dependable results (0.460) when evaluating real machine-generated summaries created with the T5 summarization model [
46], unlike ROUGE and METEOR metrics (cf.
Table 5). These findings suggest that SUSWIR provides a better approach to analyze and assess machine-generated summaries, consistently providing reliable scores compared to ROUGE and METEOR. Similar results can be seen in exemplary testing of automatically generated summaries (cf.
Table 5). This innovative method not only offers a valuable alternative for evaluating machine-generated summaries but also highlights the importance of using varied and informative reference texts when assessing summaries.
In future research, we extend our work to consider SUSWIR in raw data settings, where no data pre-processing is applied, and run respective adaptations, if necessary. This increases the flexibility and spectrum of usage of the developed metric.


