
A General Machine Learning Model for Assessing Fruit Quality Using Deep Image Features


Abstract
:1. Introduction
- We present a general ML model for determining the quality of various fruit based on their visual appearance;
- This general model performs better or equal to dedicated per-fruit models;
- Comparisons with the State-of-the-Art architectures reveal the superiority of ViTs in fruit quality assessment.
2. Related Work
3. Materials and Methods
3.1. Deep Learning Framework
3.1.1. Convolutional Neural Networks (CNNs)
3.1.2. Transformers
3.1.3. ViT Model
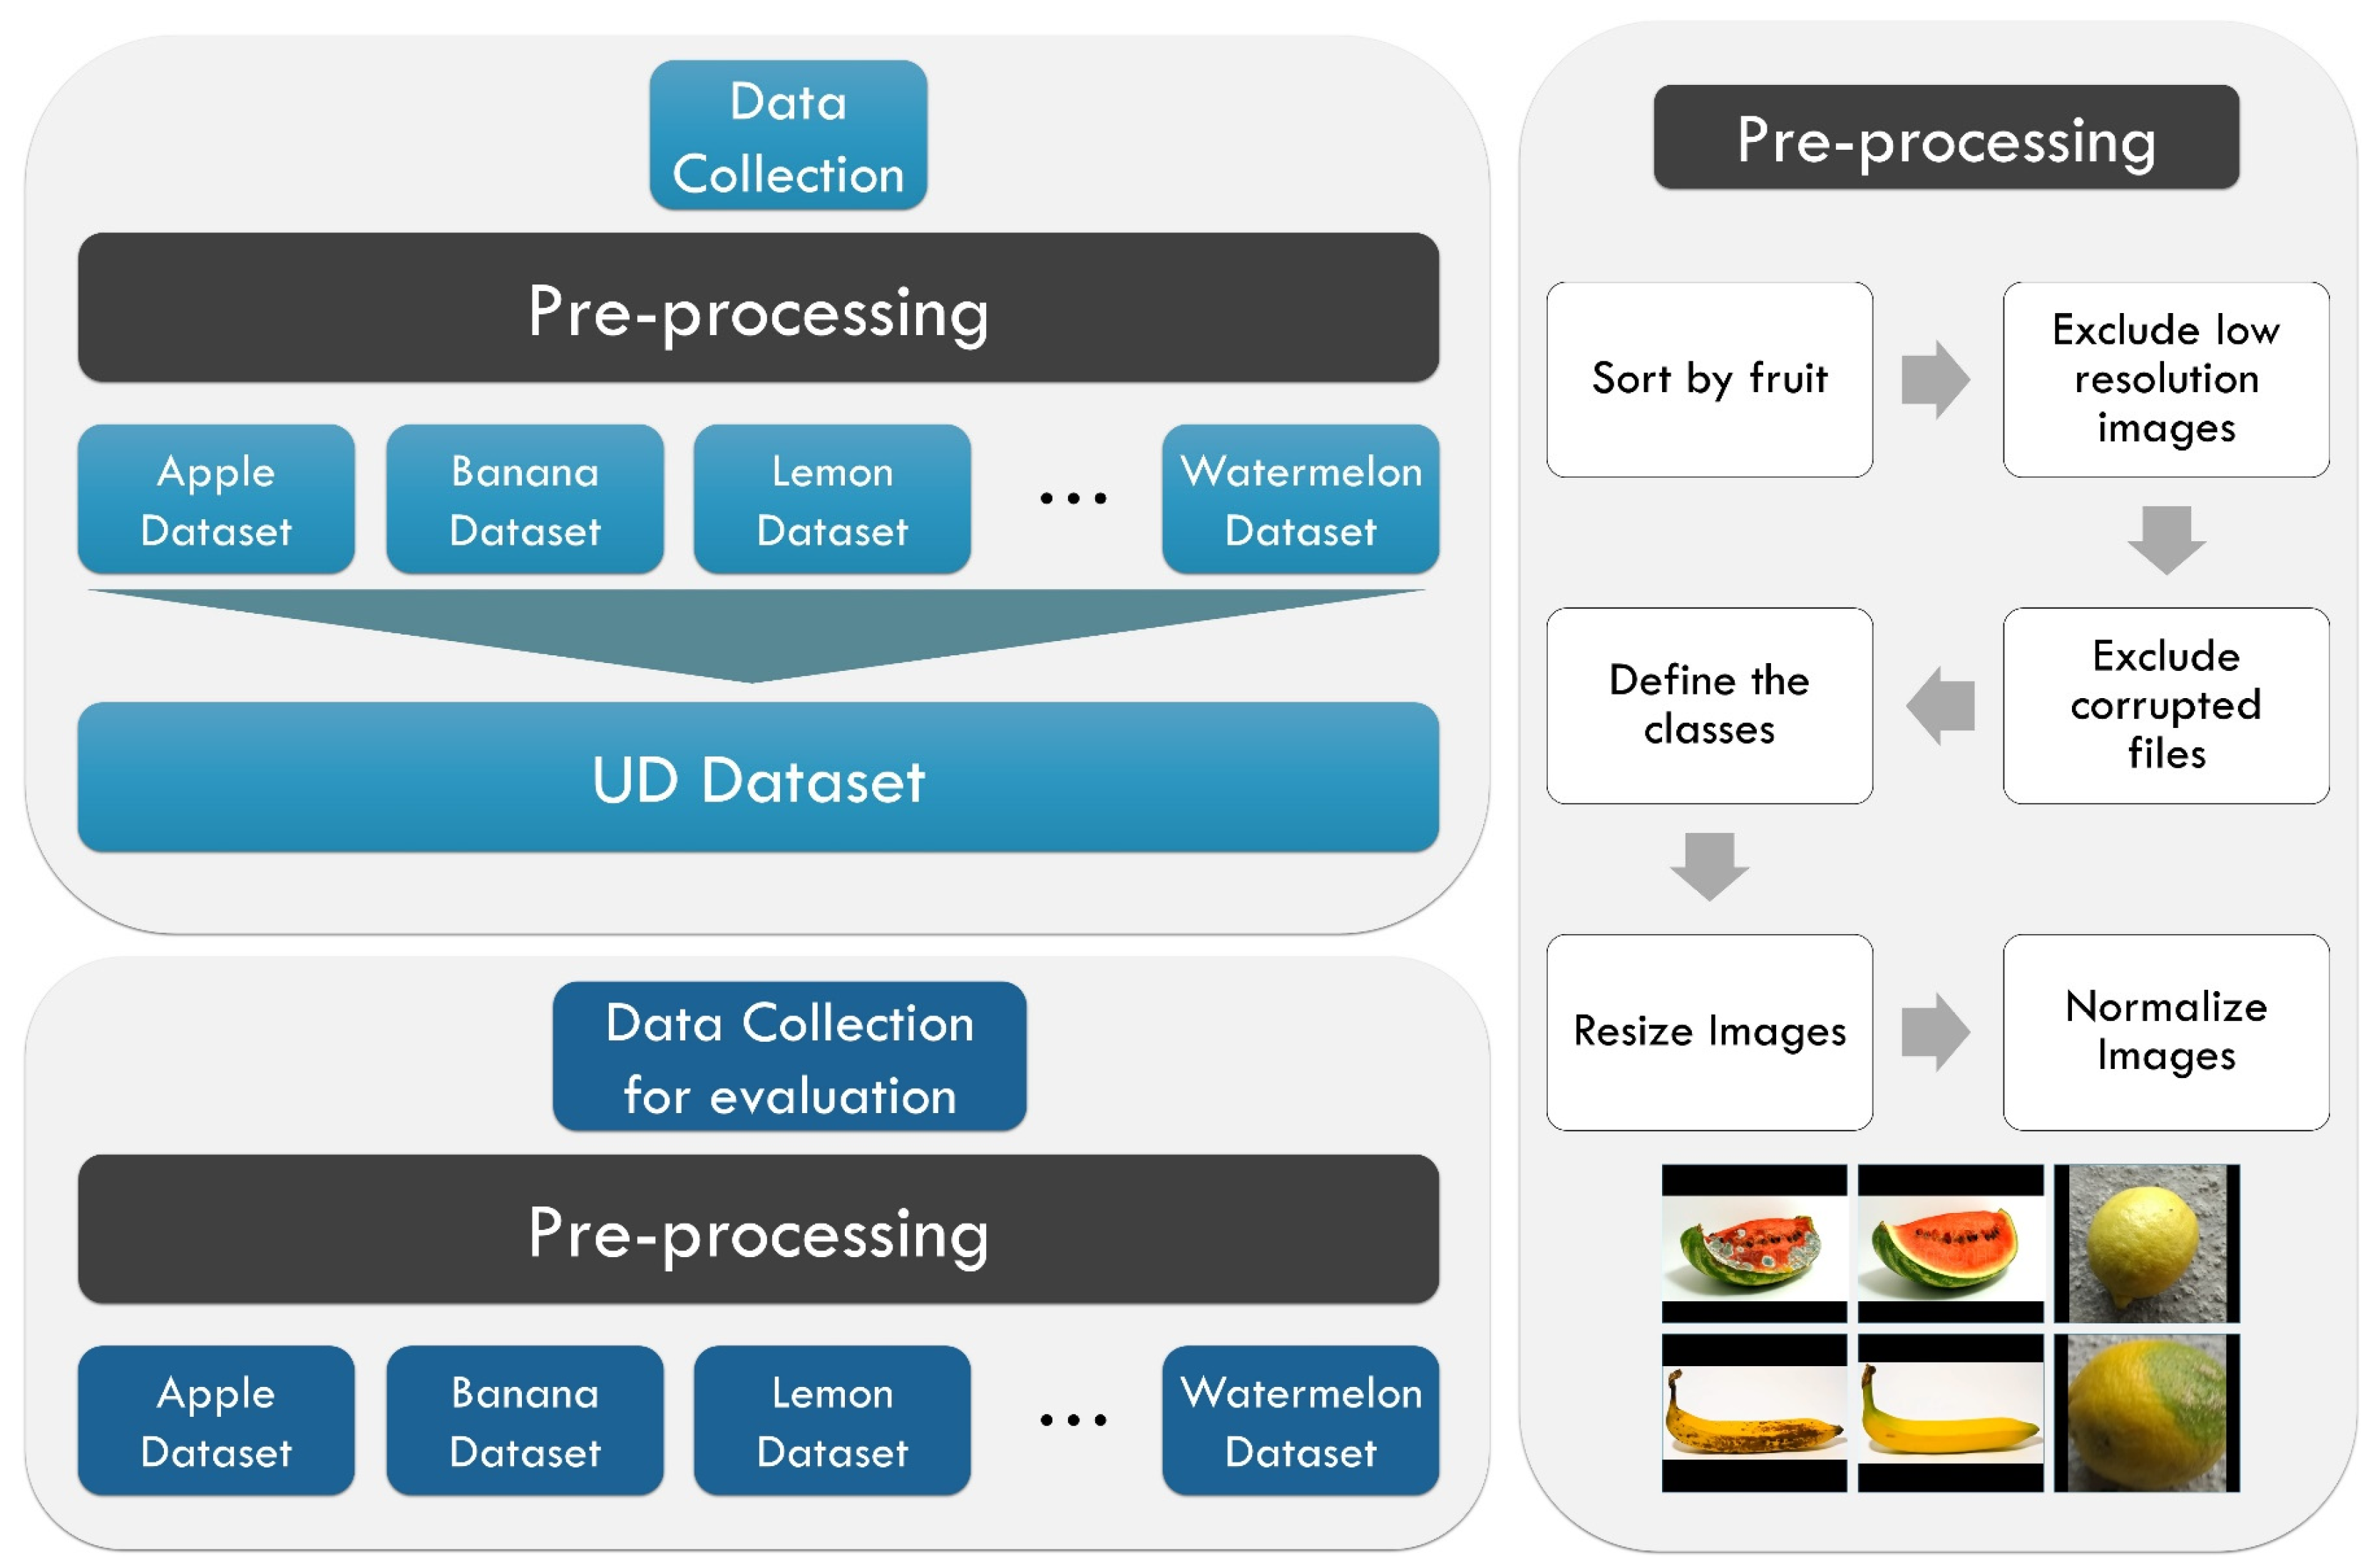
3.2. Datasets
3.2.1. Sources
- FruitNet: Indian fruits dataset with quality: https://www.kaggle.com/datasets/shashwatwork/fruitnet-indian-fruits-dataset-with-quality (accessed on 2 February 2023);
- FruitQ dataset: https://www.kaggle.com/datasets/sholzz/fruitq-dataset (accessed on 2 February 2023);
- Lemon quality dataset: https://www.kaggle.com/datasets/yusufemir/lemon-quality-dataset (accessed on 2 February 2023);
- Mango varieties classification and grading: https://www.kaggle.com/datasets/saurabhshahane/mango-varieties-classification (accessed on 2 February 2023).
3.2.2. Characteristics and Preprocessing
- Step 1.
- Download all files from each source.
- Step 2.
- Create the initial list of examined fruit types.
- Step 3.
- For each dataset, validate the availability of each fruit in the list.
- Step 4.
- For each dataset, exclude corrupted and low-resolution images.
- Step 5.
- Create a large-scale dataset that contains all available fruit types.
- Step 6.
- Exclude fruits that are not labelled.
- Step 7.
- Define the two classes: good quality (GQ) and bad quality (BQ).
- Step 8.
- Exclude fruit types that include less than 50 images per class.
- Width shift: We randomly shifted the image horizontally, changing the position of the fruit within the frame. This helps the model learn to recognize the same fruit from different viewpoints.
- Height shift: similar to width shift, we randomly shifted the image vertically to introduce variations in the fruit’s vertical position within the frame.
- Rotation: We applied random rotations to the images to simulate different orientations of the fruits. This helps the model become more invariant to rotation.
- Gaussian noise: we added Gaussian noise to the images to simulate variations in lighting conditions and improved the model’s robustness to noise.
- Sheer: sheer transformations were applied to deform the image, introducing slight distortions that mimic real-world deformations in fruit appearance.
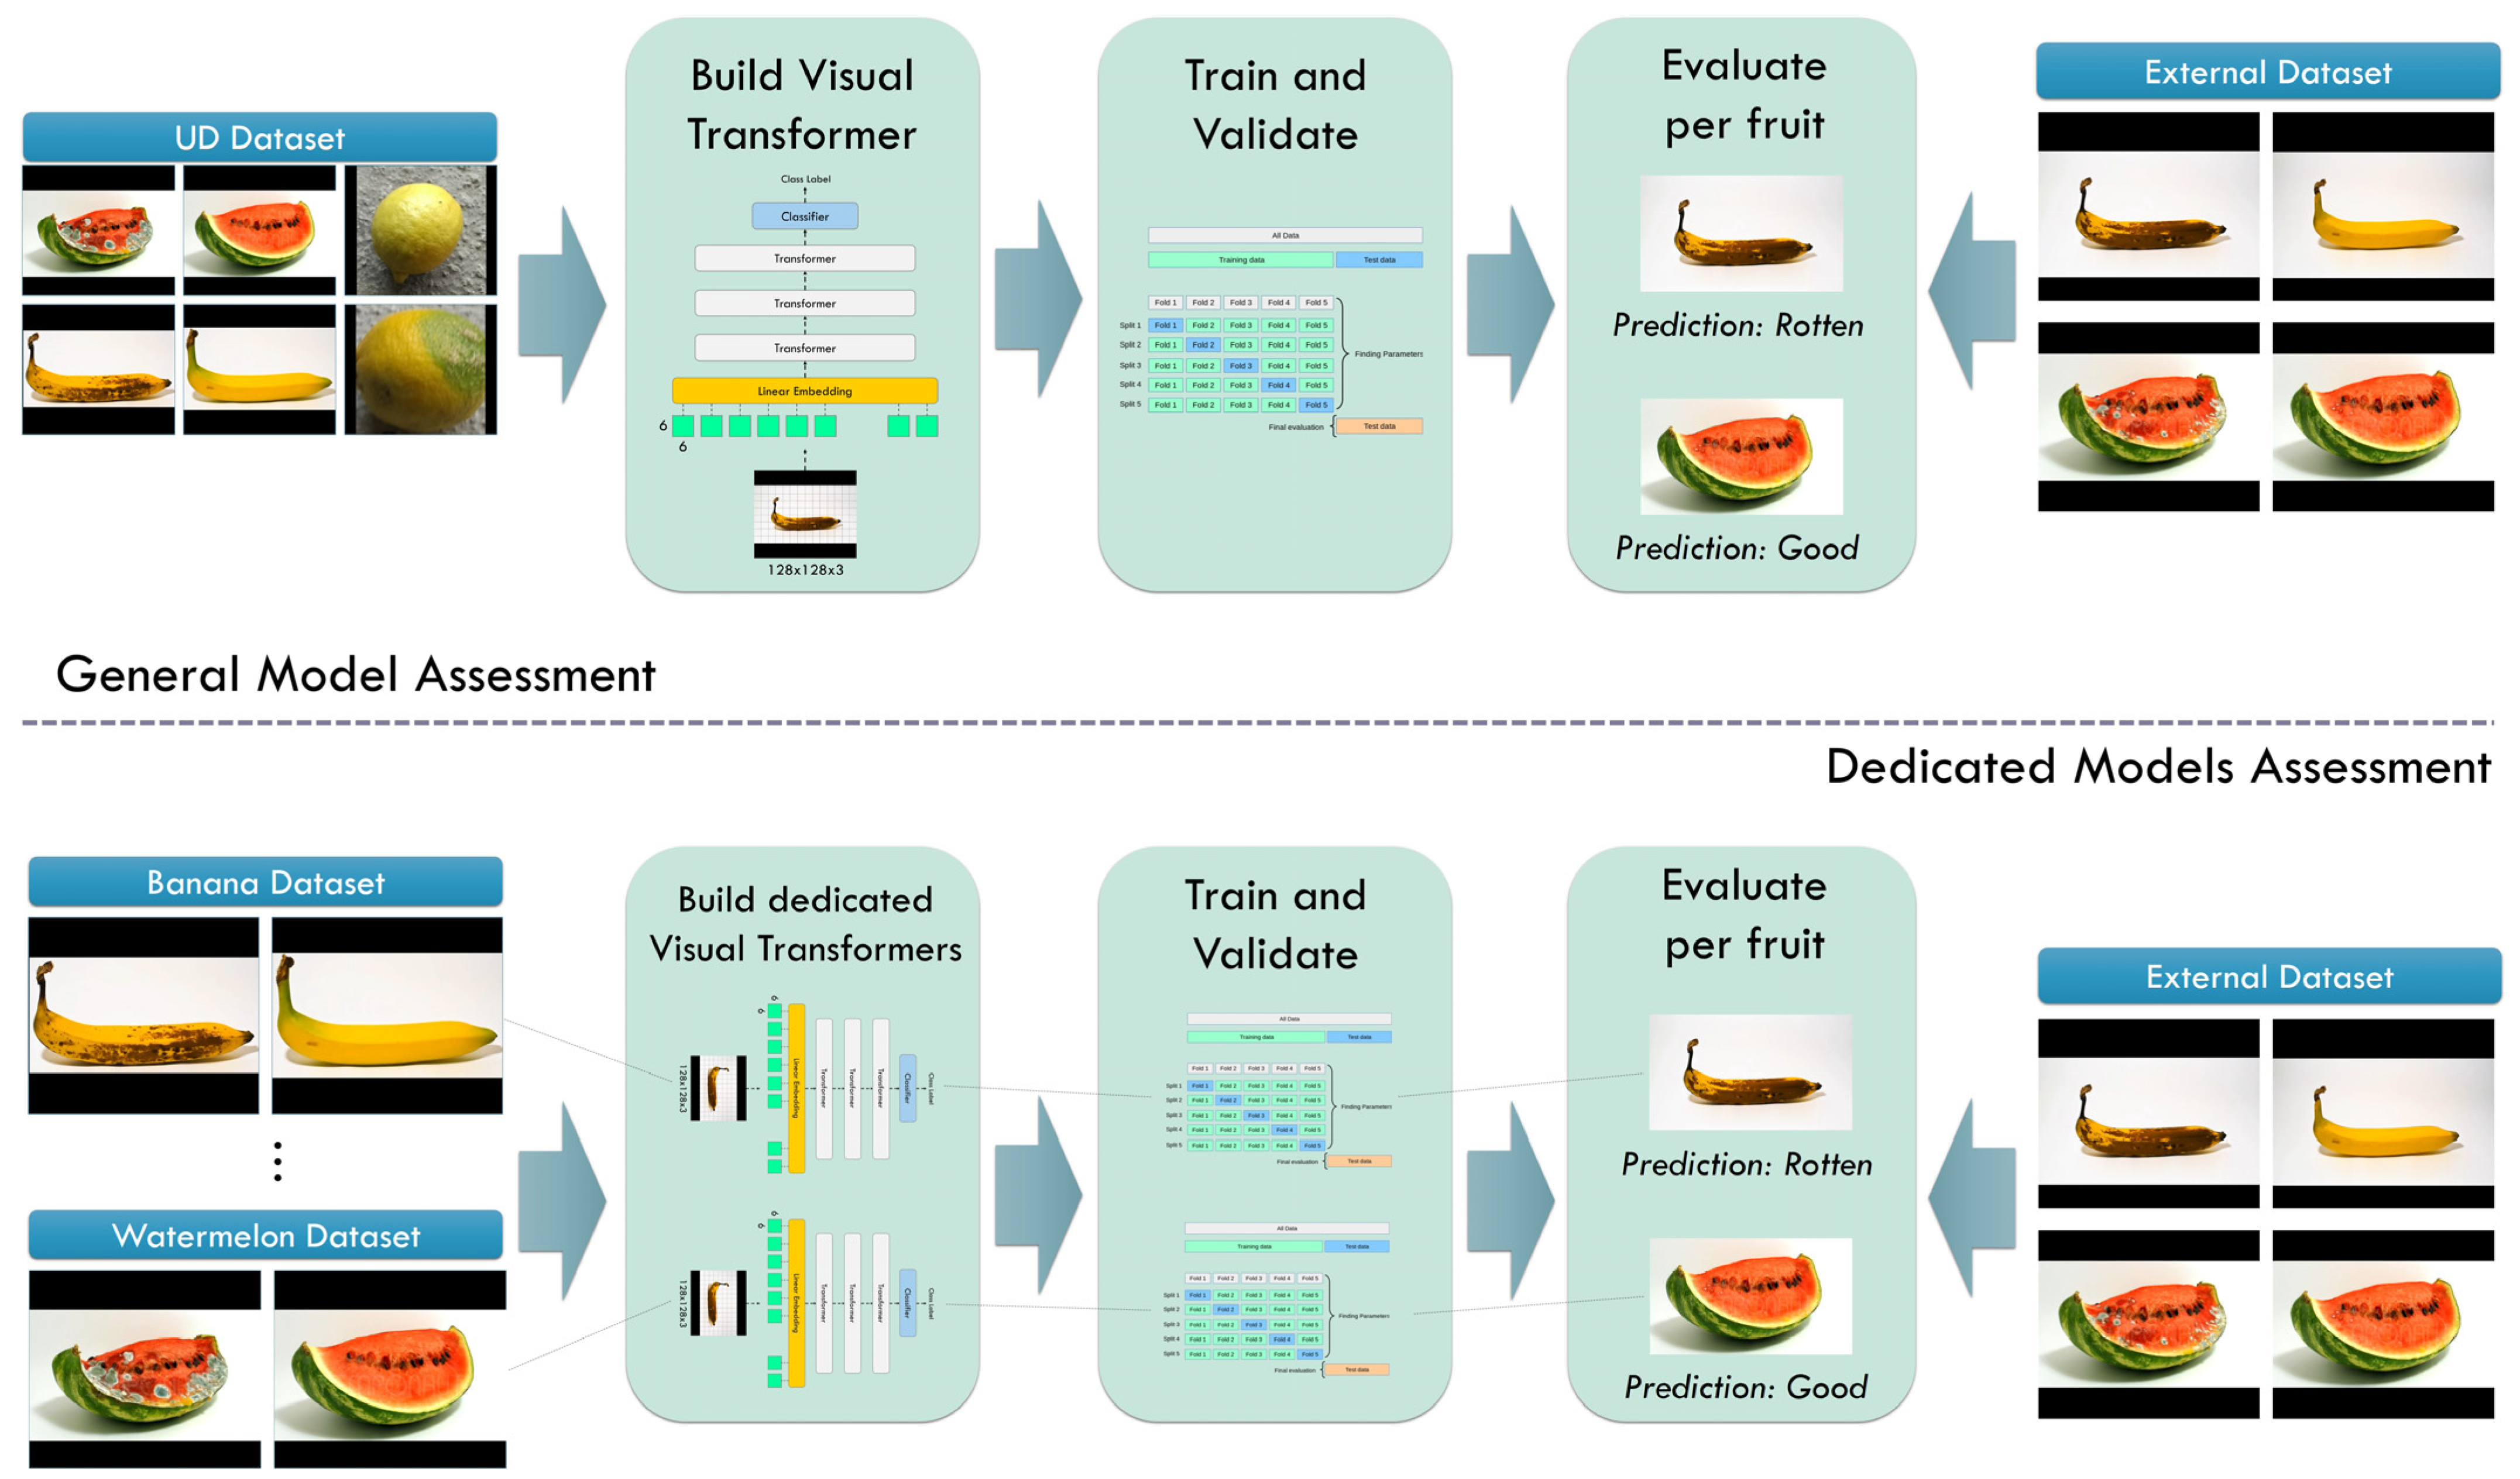
3.3. Experiment Design
- Build a ViT network and perform a 10-fold cross-validation procedure using the UD dataset.
- Evaluate the model’s per-fruit performance in detecting rotten- and good-quality fruits.
- Build ViT models for each fruit and perform a 10-fold cross-validation procedure using data from the specific fruit.
- Evaluate the models’ performance in detecting rotten- and good-quality fruits.
4. Results
4.1. General Model
4.1.1. Training and Validation Performance
4.1.2. External Per-Fruit Evaluation
4.2. Dedicated Models
4.2.1. Training and Validation Performance
4.2.2. External Per-Fruit Evaluation
4.3. Comparison with State-of-the-Art Models under a 10-Fold Cross-Validation Procedure on the UD Dataset
4.4. Comparison with Classic Machine Learning Models
4.5. Comparison with the Literature
5. Discussion
6. Conclusions
Author Contributions
Funding
Institutional Review Board Statement
Informed Consent Statement
Data Availability Statement
Conflicts of Interest
References
- Prasad, K.; Jacob, S.; Siddiqui, M.W. Fruit maturity, harvesting, and quality standards. In Preharvest Modulation of Postharvest Fruit and Vegetable Quality; Elsevier: Amsterdam, The Netherlands, 2018; pp. 41–69. [Google Scholar] [CrossRef]
- Pathmanaban, P.; Gnanavel, B.; Anandan, S.S. Recent application of imaging techniques for fruit quality assessment. Trends Food Sci. Technol. 2019, 94, 32–42. [Google Scholar] [CrossRef]
- Mowat, A.; Collins, R. Consumer behaviour and fruit quality: Supply chain management in an emerging industry. Supply Chain Manag. Int. J. 2000, 5, 45–54. [Google Scholar] [CrossRef]
- Zhou, L.; Zhang, C.; Liu, F.; Qiu, Z.; He, Y. Application of Deep Learning in Food: A Review. Compr. Rev. Food Sci. Food Saf. 2019, 18, 1793–1811. [Google Scholar] [CrossRef] [PubMed]
- Melesse, T.Y.; Bollo, M.; Di Pasquale, V.; Centro, F.; Riemma, S. Machine Learning-Based Digital Twin for Monitoring Fruit Quality Evolution. Procedia Comput. Sci. 2022, 200, 13–20. [Google Scholar] [CrossRef]
- Hemamalini, V.; Rajarajeswari, S.; Nachiyappan, S.; Sambath, M.; Devi, T.; Singh, B.K.; Raghuvanshi, A. Food Quality Inspection and Grading Using Efficient Image Segmentation and Machine Learning-Based System. J. Food Qual. 2022, 2022, 5262294. [Google Scholar] [CrossRef]
- Han, J.; Li, T.; He, Y.; Gao, Q. Using Machine Learning Approaches for Food Quality Detection. Math. Probl. Eng. 2022, 2022, 6852022. [Google Scholar] [CrossRef]
- Dhiman, B.; Kumar, Y.; Kumar, M. Fruit quality evaluation using machine learning techniques: Review, motivation and future perspectives. Multimedia Tools Appl. 2022, 81, 16255–16277. [Google Scholar] [CrossRef]
- Bhargava, A.; Bansal, A.; Goyal, V. Machine Learning–Based Detection and Sorting of Multiple Vegetables and Fruits. Food Anal. Methods 2022, 15, 228–242. [Google Scholar] [CrossRef]
- Cheng, S.; Jin, Y.; Harrison, S.P.; Quilodrán-Casas, C.; Prentice, I.C.; Guo, Y.-K.; Arcucci, R. Parameter Flexible Wildfire Prediction Using Machine Learning Techniques: Forward and Inverse Modelling. Remote Sens. 2022, 14, 3228. [Google Scholar] [CrossRef]
- Aherwadi, N.; Mittal, U.; Singla, J.; Jhanjhi, N.Z.; Yassine, A.; Hossain, M.S. Prediction of Fruit Maturity, Quality, and Its Life Using Deep Learning Algorithms. Electronics 2022, 11, 4100. [Google Scholar] [CrossRef]
- Liu, Y.; Pu, H.; Sun, D.-W. Efficient extraction of deep image features using convolutional neural network (CNN) for applications in detecting and analysing complex food matrices. Trends Food Sci. Technol. 2021, 113, 193–204. [Google Scholar] [CrossRef]
- Zimmerman, N.; Presto, A.A.; Kumar, S.P.N.; Gu, J.; Hauryliuk, A.; Robinson, E.S.; Robinson, A.L.; Subramanian, R. A machine learning calibration model using random forests to improve sensor performance for lower-cost air quality monitoring. Atmospheric Meas. Tech. 2018, 11, 291–313. [Google Scholar] [CrossRef]
- Kroll, A.; Ranjan, S.; Engqvist, M.K.M.; Lercher, M.J. A general model to predict small molecule substrates of enzymes based on machine and deep learning. Nat. Commun. 2023, 14, 2787. [Google Scholar] [CrossRef]
- Chi, H.; Zhang, Y.; Tang, T.L.E.; Mirabella, L.; Dalloro, L.; Song, L.; Paulino, G.H. Universal machine learning for topology optimization. Comput. Methods Appl. Mech. Eng. 2020, 375, 112739. [Google Scholar] [CrossRef]
- d’Ascoli, S.; Touvron, H.; Leavitt, M.; Morcos, A.; Biroli, G.; Sagun, L. Convit: Improving vision transformers with soft convolutional inductive biases. arXiv 2021, arXiv:2103.10697. [Google Scholar] [CrossRef]
- Tian, C.; Xu, Y.; Li, Z.; Zuo, W.; Fei, L.; Liu, H. Attention-guided CNN for image denoising. Neural Netw. 2020, 124, 117–129. [Google Scholar] [CrossRef]
- LeCun, Y.; Kavukcuoglu, K.; Farabet, C. Convolutional networks and applications in vision. In Proceedings of the 2010 IEEE International Symposium on Circuits and Systems, Paris, France, 30 May–2 June 2010; IEEE: Piscataway, NJ, USA, 2010; pp. 253–256. [Google Scholar]
- Rodríguez, F.J.; García, A.; Pardo, P.J.; Chávez, F.; Luque-Baena, R.M. Study and classification of plum varieties using image analysis and deep learning techniques. Prog. Artif. Intell. 2017, 7, 119–127. [Google Scholar] [CrossRef]
- Azizah, L.M.; Umayah, S.F.; Riyadi, S.; Damarjati, C.; Utama, N.A. Deep learning implementation using convolutional neural network in mangosteen surface defect detection. In Proceedings of the 2017 7th IEEE International Conference on Control System, Computing and Engineering (ICCSCE), Penang, Malaysia, 24–26 November 2017; pp. 242–246. [Google Scholar] [CrossRef]
- Tan, W.; Zhao, C.; Wu, H. Intelligent alerting for fruit-melon lesion image based on momentum deep learning. Multimedia Tools Appl. 2016, 75, 16741–16761. [Google Scholar] [CrossRef]
- Mithun, B.S.; Sujit, S.; Karan, B.; Arijit, C.; Shalini, M.; Kavya, G.; Brojeshwar, B.; and Sanjay, K. Non-destructive method to detect artificially ripened banana using hyperspectral sensing and RGB imaging. In Proceedings of the SPIE 10665, Sensing for Agriculture and Food Quality and Safety X, 106650T, Orlando, FL, USA, 15 May 2018. [Google Scholar] [CrossRef]
- Sun, Y.; Wei, K.; Liu, Q.; Pan, L.; Tu, K. Classification and Discrimination of Different Fungal Diseases of Three Infection Levels on Peaches Using Hyperspectral Reflectance Imaging Analysis. Sensors 2018, 18, 1295. [Google Scholar] [CrossRef]
- Kumar, A.; Joshi, R.C.; Dutta, M.K.; Jonak, M.; Burget, R. Fruit-CNN: An Efficient Deep learning-based Fruit Classification and Quality Assessment for Precision Agriculture. In Proceedings of the 2021 13th International Congress on Ultra Modern Telecommunications and Control Systems and Workshops (ICUMT), Brno, Czech Republic, 25–27 October 2021; pp. 60–65. [Google Scholar] [CrossRef]
- Bobde, S.; Jaiswal, S.; Kulkarni, P.; Patil, O.; Khode, P.; Jha, R. Fruit Quality Recognition using Deep Learning Algorithm. In Proceedings of the 2021 International Conference on Smart Generation Computing, Communication and Networking (SMART GENCON), Pune, India, 29–30 October 2021; pp. 1–5. [Google Scholar] [CrossRef]
- Chakraborty, S.; Shamrat, F.J.M.; Billah, M.; Jubair, A.; Alauddin; Ranjan, R. Implementation of Deep Learning Methods to Identify Rotten Fruits. In Proceedings of the 2021 5th International Conference on Trends in Electronics and Informatics (ICOEI), Tirunelveli, India, 3–5 June 2021; pp. 1207–1212. [Google Scholar]
- Howard, A.G.; Zhu, M.; Chen, B.; Kalenichenko, D.; Wang, W.; Weyand, T.; Andreetto, M.; Adam, H. Mobilenets: Efficient convolutional neural networks for mobile vision applications. arXiv 2017, arXiv:1704.04861. [Google Scholar]
- Behera, S.K.; Rath, A.K.; Sethy, P.K. Maturity status classification of papaya fruits based on machine learning and transfer learning approach. Inf. Process Agric. 2021, 8, 244–250. [Google Scholar] [CrossRef]
- Simonyan, K.; Zisserman, A. Very Deep Convolutional Networks for Large-Scale Image Recognition. arXiv 2015, arXiv:14091556. [Google Scholar]
- Goodfellow, I.; Bengio, Y.; Courville, A.; Bengio, Y. Deep Learning; MIT Press: Cambridge, MA, USA, 2016; Volume 1. [Google Scholar]
- Sinha, R.S.; Hwang, S.-H. Comparison of CNN Applications for RSSI-Based Fingerprint Indoor Localization. Electronics 2019, 8, 989. [Google Scholar] [CrossRef]
- Mou, L.; Zhu, X.X. Learning to Pay Attention on Spectral Domain: A Spectral Attention Module-Based Convolutional Network for Hyperspectral Image Classification. IEEE Trans. Geosci. Remote Sens. 2020, 58, 110–122. [Google Scholar] [CrossRef]
- Lee-Thorp, J.; Ainslie, J.; Eckstein, I.; Ontanon, S. FNet: Mixing Tokens with Fourier Transforms. arXiv 2022, arXiv:2105.03824. [Google Scholar] [CrossRef]
- Chollet, F. Xception: Deep learning with depthwise separable convolutions. In Proceedings of the 2017 IEEE Conference on Computer Vision and Pattern Recognition (CVPR), Honolulu, HI, USA, 21–26 July 2017. [Google Scholar]
- He, K.; Zhang, X.; Ren, S.; Sun, J. Deep residual learning for image recognition. In Proceedings of the IEEE Computer Society Conference on Computer Vision and Pattern Recognition (CVPR), Las Vegas, NV, USA, 27–30 June 2016; pp. 770–778. [Google Scholar] [CrossRef]
- Szegedy, C.; Liu, W.; Jia, Y.; Sermanet, P.; Reed, S.; Anguelov, D.; Erhan, D.; Vanhoucke, V.; Rabinovich, A.; Liu, W.; et al. Going deeper with convolutions. In Proceedings of the 2015 IEEE Conference on Computer Vision and Pattern Recognition (CVPR), Boston, MA, USA, 7–12 June 2015; pp. 1–9. [Google Scholar] [CrossRef]
- Huang, G.; Liu, Z.; van der Maaten, L.; Weinberger, K.Q. Densely Connected Convolutional Networks. arXiv 2018, arXiv:160806993. [Google Scholar]
- Zoph, B.; Vasudevan, V.; Shlens, J.; Le, Q.V. Learning Transferable Architectures for Scalable Image Recognition. arXiv 2018, arXiv:170707012. [Google Scholar]
- Zhang, L.; Shen, H.; Luo, Y.; Cao, X.; Pan, L.; Wang, T.; Feng, Q. Efficient CNN Architecture Design Guided by Visualization. arXiv 2022, arXiv:2207.10318. [Google Scholar] [CrossRef]
- Liu, Z.; Mao, H.; Wu, C.-Y.; Feichtenhofer, C.; Darrell, T.; Xie, S. A ConvNet for the 2020s. arXiv 2022, arXiv:2201.03545. [Google Scholar] [CrossRef]
- Liu, Z.; Lin, Y.; Cao, Y.; Hu, H.; Wei, Y.; Zhang, Z.; Lin, S.; Guo, B. Swin Transformer: Hierarchical Vision Transformer using Shifted Windows. arXiv 2021, arXiv:2103.14030. [Google Scholar] [CrossRef]
- Jaegle, A.; Gimeno, F.; Brock, A.; Zisserman, A.; Vinyals, O.; Carreira, J. Perceiver: General Perception with Iterative Attention. arXiv 2021, arXiv:2103.03206. [Google Scholar] [CrossRef]
- Li, D.; Hu, J.; Wang, C.; Li, X.; She, Q.; Zhu, L.; Zhang, T.; Chen, Q. Involution: Inverting the Inherence of Convolution for Visual Recognition. arXiv 2021, arXiv:2103.06255. [Google Scholar] [CrossRef]
- Dai, Z.; Liu, H.; Le, Q.V.; Tan, M. CoAtNet: Marrying Convolution and Attention for All Data Sizes. arXiv 2021, arXiv:2106.04803. [Google Scholar] [CrossRef]
- Hassani, A.; Walton, S.; Shah, N.; Abuduweili, A.; Li, J.; Shi, H. Escaping the Big Data Paradigm with Compact Transformers. arXiv 2021, arXiv:2104.05704. [Google Scholar] [CrossRef]
- Tolstikhin, I.; Houlsby, N.; Kolesnikov, A.; Beyer, L.; Zhai, X.; Unterthiner, T.; Yung, J.; Steiner, A.; Keysers, D.; Uszkoreit, J.; et al. MLP-Mixer: An all-MLP Architecture for Vision. arXiv 2021, arXiv:2105.01601. [Google Scholar] [CrossRef]
- Guo, M.-H.; Liu, Z.-N.; Mu, T.-J.; Hu, S.-M. Beyond Self-attention: External Attention using Two Linear Layers for Visual Tasks. arXiv 2021, arXiv:2105.02358. [Google Scholar] [CrossRef]
- Liu, H.; Dai, Z.; So, D.R.; Le, Q.V. Pay Attention to MLPs. arXiv 2021, arXiv:2105.08050. [Google Scholar]
- Apostolopoulos, I.D.; Aznaouridis, S.; Tzani, M. An Attention-Based Deep Convolutional Neural Network for Brain Tumor and Disorder Classification and Grading in Magnetic Resonance Imaging. Information 2023, 14, 174. [Google Scholar] [CrossRef]
- Mureşan, H.; Oltean, M. Fruit recognition from images using deep learning. Acta Univ. Sapientiae Inform. 2018, 10, 26–42. [Google Scholar] [CrossRef]
- Pujari, J.D.; Yakkundimath, R.; Byadgi, A.S. Recognition and classification of Produce affected by identically looking Powdery Mildew disease. Acta Technol. Agric. 2014, 17, 29–34. [Google Scholar] [CrossRef]
- Khan, M.A.; Akram, T.; Sharif, M.; Awais, M.; Javed, K.; Ali, H.; Saba, T. CCDF: Automatic system for segmentation and recognition of fruit crops diseases based on correlation coefficient and deep CNN features. Comput. Electron. Agric. 2018, 155, 220–236. [Google Scholar] [CrossRef]


| Datasets | Number of Images Representing Good Quality Fruit | Number of Images Representing Bad Quality Fruit | Total | Format | Image Size (Height, Width) |
|---|---|---|---|---|---|
| Apple | 1149 | 1141 | 2290 | PNG | (192, 256) |
| Banana | 1292 | 1520 | 2812 | PNG | (720, 1280) |
| Cucumber | 250 | 461 | 711 | PNG | (720, 1280) |
| Grape | 227 | 482 | 709 | PNG | (720, 1280) |
| Guava | 1152 | 1129 | 2281 | JPEG | (256, 256) |
| Kaki | 545 | 566 | 1111 | PNG | (720, 1280) |
| Lemon | 1125 | 951 | 2076 | PNG | (300, 300) |
| Lime | 1094 | 1085 | 2179 | JPEG | (192, 256) |
| Mango | 200 | 200 | 400 | JPEG | (424, 752) |
| Orange | 1216 | 1159 | 2375 | PNG | (256, 256) |
| Papaya | 130 | 663 | 793 | PNG | (720, 1280) |
| Peach | 425 | 720 | 1145 | PNG | (720, 1280) |
| Pear | 504 | 593 | 1097 | JPEG | (720, 1280) |
| Pomegranate | 5940 | 1187 | 7127 | JPEG | (256, 256) |
| Tomato | 600 | 1255 | 1855 | PNG | (720, 1280) |
| Watermelon | 51 | 203 | 254 | PNG | (720, 1280) |
| Total (UD dataset) | 15,900 | 13,315 | 29,215 | - | - |
| External Dataset | Number of Images Representing Good Quality Fruit | Number of Images Representing Bad Quality Fruit | Total | Format | Image Size (Height, Width) |
|---|---|---|---|---|---|
| Apple | 100 | 100 | 200 | JPEG | (192, 256) |
| Banana | 100 | 100 | 200 | JPEG | (720, 1280) |
| Cucumber | 100 | 100 | 200 | JPEG | (256, 256) |
| Grape | 100 | 100 | 200 | PNG | (256, 256) |
| Guava | 100 | 100 | 200 | JPEG | (256, 256) |
| Kaki | 100 | 100 | 200 | PNG | (720, 1280) |
| Lemon | 100 | 100 | 200 | PNG | (300, 300) |
| Lime | 100 | 100 | 200 | JPEG | (192, 256) |
| Mango | 100 | 100 | 200 | JPEG | (424, 752) |
| Orange | 100 | 100 | 200 | JPEG | (256, 256) |
| Papaya | 100 | 100 | 200 | PNG | (256, 256) |
| Peach | 100 | 100 | 200 | JPEG | (256, 256) |
| Pear | 100 | 100 | 200 | JPEG | (720, 1280) |
| Pomegranate | 100 | 100 | 200 | JPEG | (256, 256) |
| Tomato | 100 | 100 | 200 | PNG | (256, 256) |
| Watermelon | 100 | 100 | 200 | JPEG | (720, 1280) |
| Training Data | Testing Data | Accuracy | Precision | Recall | F1 |
|---|---|---|---|---|---|
| UD | UD | 0.9794 | 0.9886 | 0.9733 | 0.9809 |
| Training Data | Testing Fruit | Accuracy | Precision | Recall | F1 |
|---|---|---|---|---|---|
| UD | Apple | 0.9950 | 1.0000 | 0.9900 | 0.9950 |
| UD | Banana | 0.9800 | 0.9615 | 1.0000 | 0.9804 |
| UD | Cucumber | 0.9900 | 0.9804 | 1.0000 | 0.9901 |
| UD | Grape | 1.0000 | 1.0000 | 1.0000 | 1.0000 |
| UD | Guava | 0.9700 | 0.9796 | 0.9600 | 0.9697 |
| UD | Kaki | 0.9950 | 0.9901 | 1.0000 | 0.9950 |
| UD | Lemon | 0.9700 | 0.9608 | 0.9800 | 0.9703 |
| UD | Lime | 0.9750 | 0.9798 | 0.9700 | 0.9749 |
| UD | Mango | 0.9750 | 0.9897 | 0.9600 | 0.9746 |
| UD | Orange | 0.9950 | 0.9901 | 1.0000 | 0.9950 |
| UD | Papaya | 0.9800 | 0.9898 | 0.9700 | 0.9798 |
| UD | Peach | 0.9800 | 0.9706 | 0.9900 | 0.9802 |
| UD | Pear | 0.9700 | 0.9796 | 0.9600 | 0.9697 |
| UD | Pomegranate | 0.9700 | 0.9796 | 0.9600 | 0.9697 |
| UD | Tomato | 0.9950 | 0.9901 | 1.0000 | 0.9950 |
| UD | Watermelon | 0.9800 | 0.9706 | 0.9900 | 0.9802 |
| Training Data (UD) | Testing Fruit | Accuracy | Precision | Recall | F1 |
|---|---|---|---|---|---|
| Apple | Apple | 0.9948 | 0.9974 | 0.9922 | 0.9948 |
| Banana | Banana | 0.9904 | 0.9854 | 0.9938 | 0.9896 |
| Cucumber | Cucumber | 0.9887 | 0.9764 | 0.9920 | 0.9841 |
| Grape | Grape | 0.9661 | 0.9511 | 0.9427 | 0.9469 |
| Guava | Guava | 0.9965 | 0.9974 | 0.9957 | 0.9965 |
| Kaki | Kaki | 0.9928 | 0.9873 | 0.9982 | 0.9927 |
| Lemon | Lemon | 0.9981 | 1.0000 | 0.9964 | 0.9982 |
| Lime | Lime | 0.9991 | 0.9982 | 1.0000 | 0.9991 |
| Mango | Mango | 0.9625 | 0.9793 | 0.9450 | 0.9618 |
| Orange | Orange | 0.9971 | 0.9984 | 0.9959 | 0.9971 |
| Papaya | Papaya | 0.9546 | 0.7831 | 1.0000 | 0.8784 |
| Peach | Peach | 0.9965 | 0.9953 | 0.9953 | 0.9953 |
| Pear | Pear | 0.9909 | 0.9940 | 0.9861 | 0.9900 |
| Pomegranate | Pomegranate | 0.9964 | 0.9975 | 0.9981 | 0.9978 |
| Tomato | Tomato | 0.9957 | 0.9933 | 0.9933 | 0.9933 |
| Watermelon | Watermelon | 0.9055 | 0.6800 | 1.0000 | 0.8095 |
| Training Data | Testing Fruit | Accuracy | Precision | Recall | F1 |
|---|---|---|---|---|---|
| Apple | Apple | 0.9950 | 1.0000 | 0.9900 | 0.9950 |
| Banana | Banana | 0.9950 | 0.9901 | 1.0000 | 0.9950 |
| Cucumber | Cucumber | 0.9850 | 0.9899 | 0.9800 | 0.9849 |
| Grape | Grape | 0.9900 | 0.9900 | 0.9900 | 0.9900 |
| Guava | Guava | 0.9850 | 0.9709 | 1.0000 | 0.9852 |
| Kaki | Kaki | 0.9900 | 1.0000 | 0.9800 | 0.9899 |
| Lemon | Lemon | 0.9950 | 1.0000 | 0.9900 | 0.9950 |
| Lime | Lime | 0.9800 | 0.9898 | 0.9700 | 0.9798 |
| Mango | Mango | 0.9500 | 0.9412 | 0.9600 | 0.9505 |
| Orange | Orange | 0.9950 | 1.0000 | 0.9900 | 0.9950 |
| Papaya | Papaya | 0.9500 | 0.9688 | 0.9300 | 0.9490 |
| Peach | Peach | 0.9800 | 0.9706 | 0.9900 | 0.9802 |
| Pear | Pear | 0.9650 | 0.9697 | 0.9600 | 0.9648 |
| Pomegranate | Pomegranate | 0.9950 | 0.9901 | 1.0000 | 0.9950 |
| Tomato | Tomato | 0.9800 | 0.9800 | 0.9800 | 0.9800 |
| Watermelon | Watermelon | 0.9550 | 0.9505 | 0.9600 | 0.9552 |
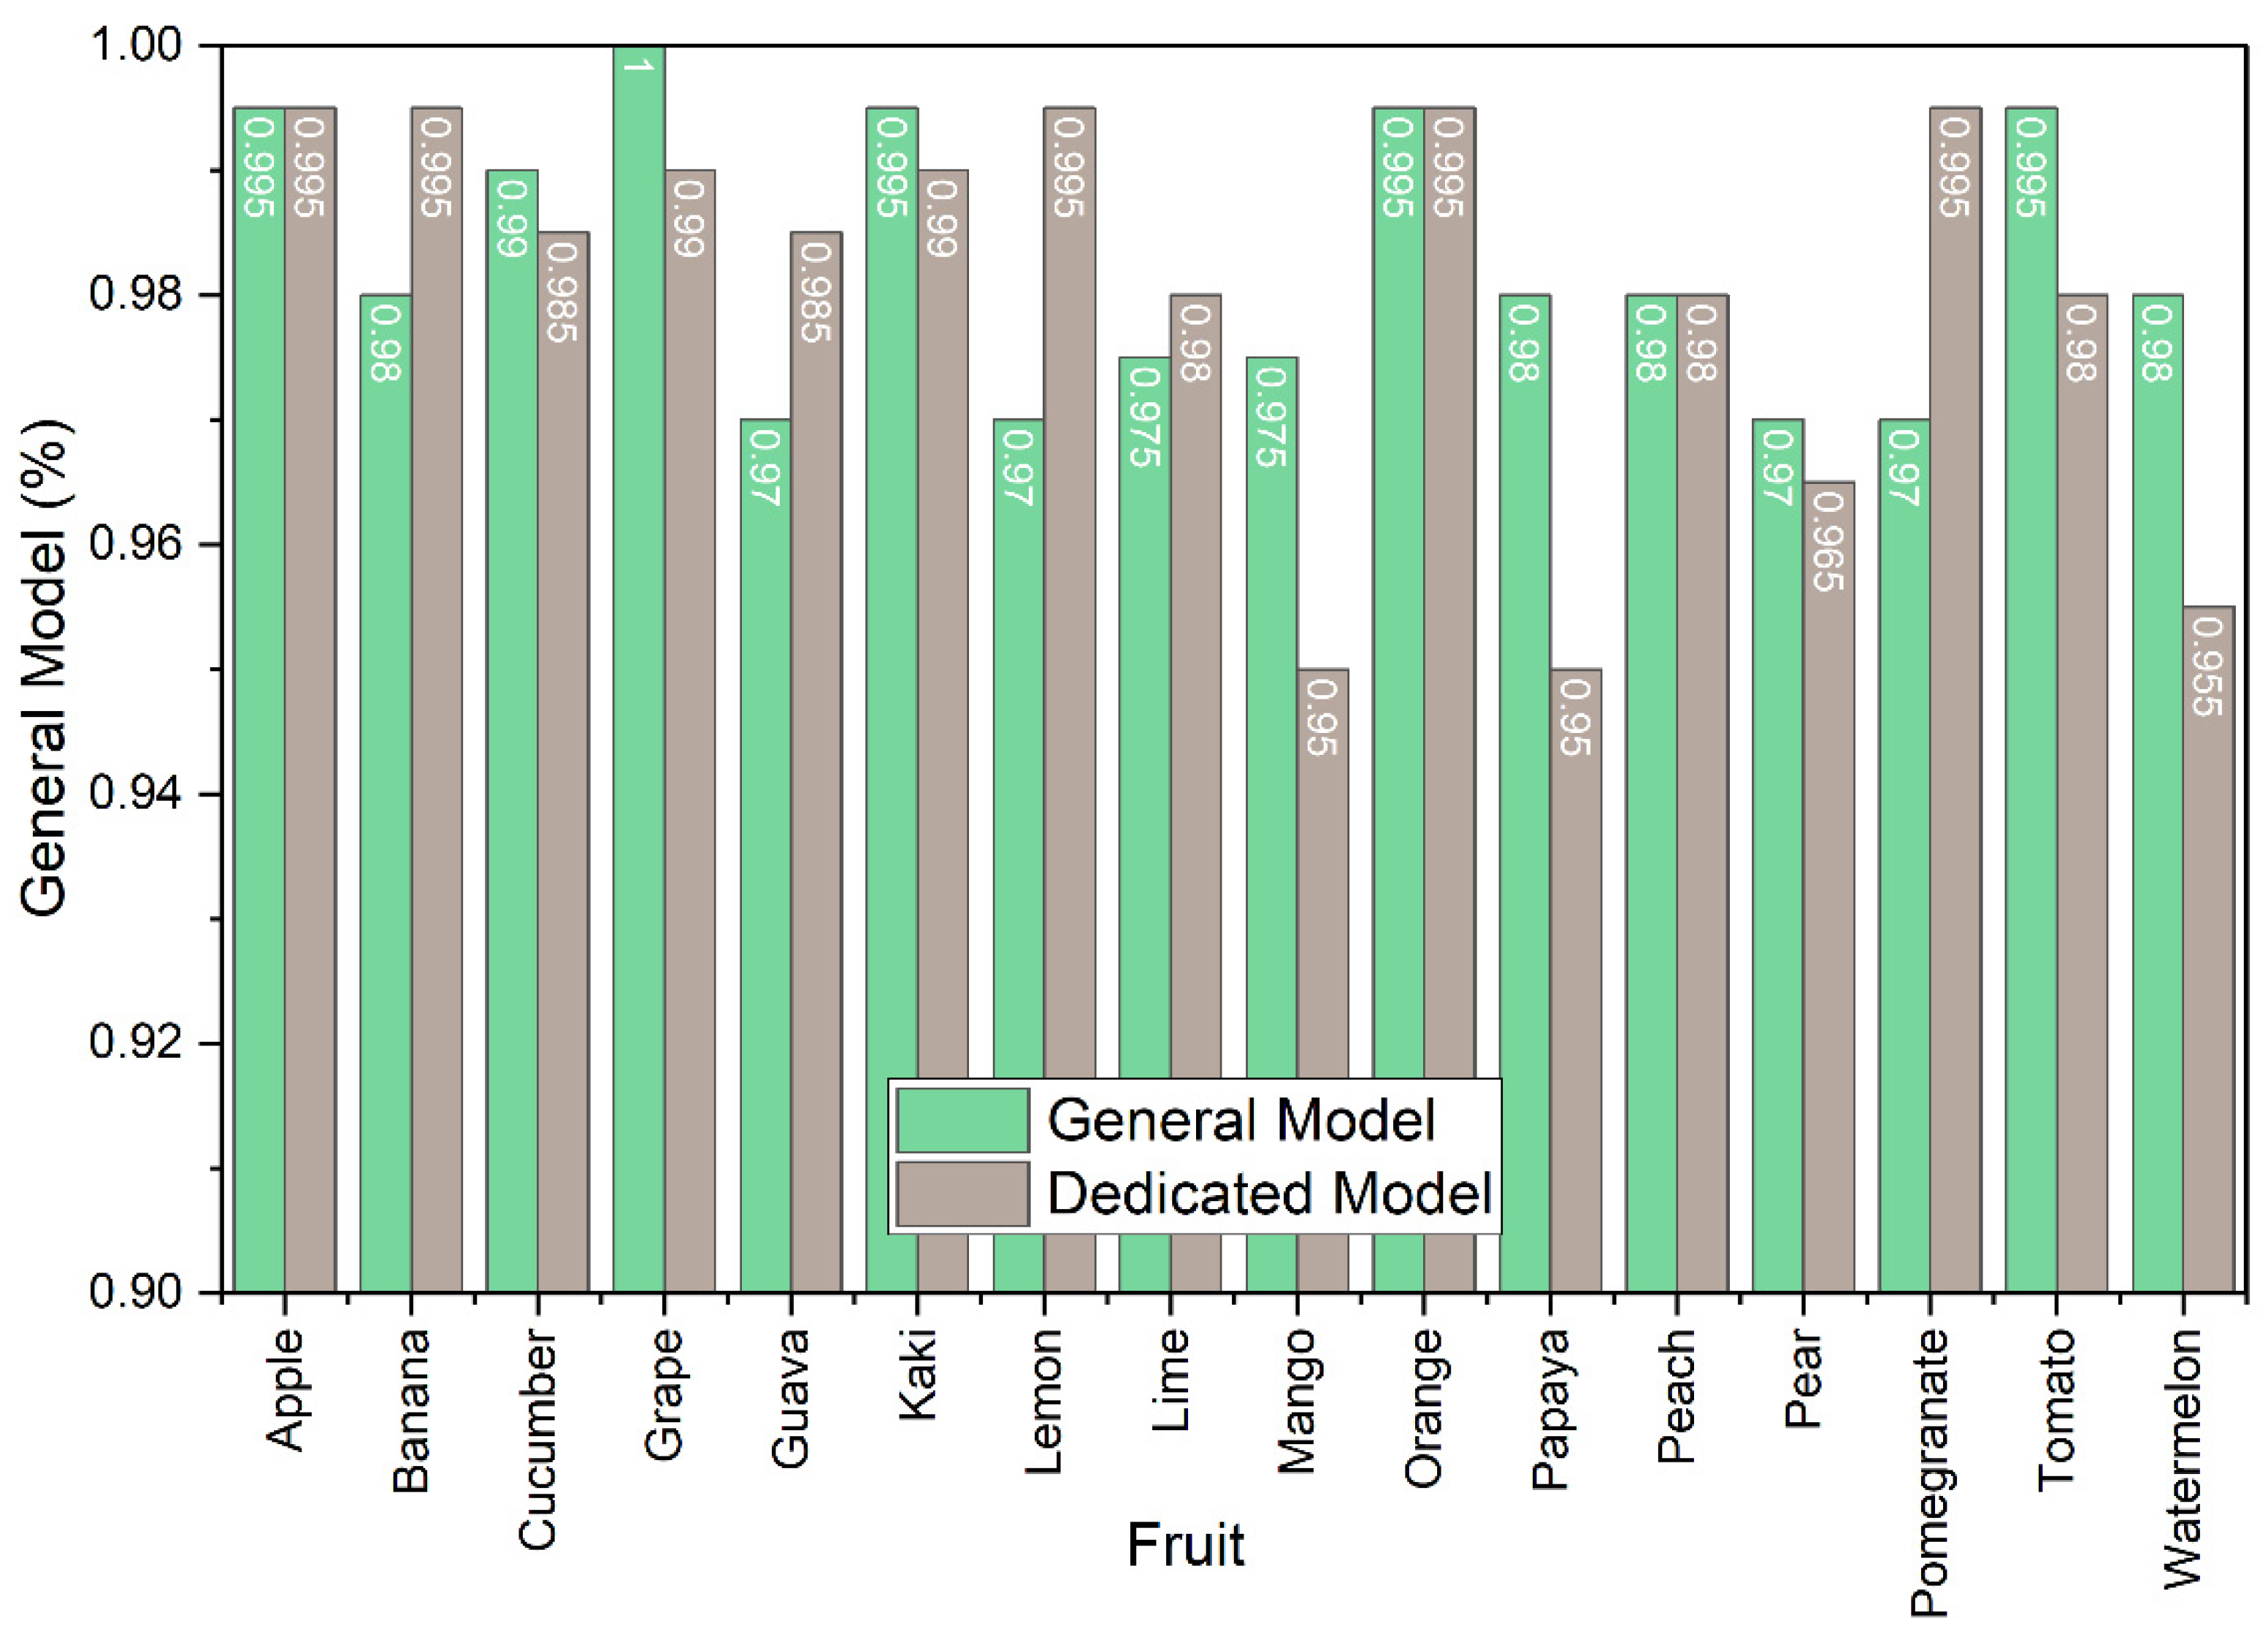
| Fruit | Dedicated Model | General Model |
|---|---|---|
| Apple | 0.9950 | 0.9950 |
| Banana | 0.9950 | 0.9800 |
| Cucumber | 0.9850 | 0.9900 |
| Grape | 0.9900 | 1.0000 |
| Guava | 0.9850 | 0.9700 |
| Kaki | 0.9900 | 0.9950 |
| Lemon | 0.9950 | 0.9700 |
| Lime | 0.9800 | 0.9750 |
| Mango | 0.9500 | 0.9750 |
| Orange | 0.9950 | 0.9950 |
| Papaya | 0.9500 | 0.9800 |
| Peach | 0.9800 | 0.9800 |
| Pear | 0.9650 | 0.9700 |
| Pomegranate | 0.9950 | 0.9700 |
| Tomato | 0.9800 | 0.9950 |
| Watermelon | 0.9550 | 0.9800 |
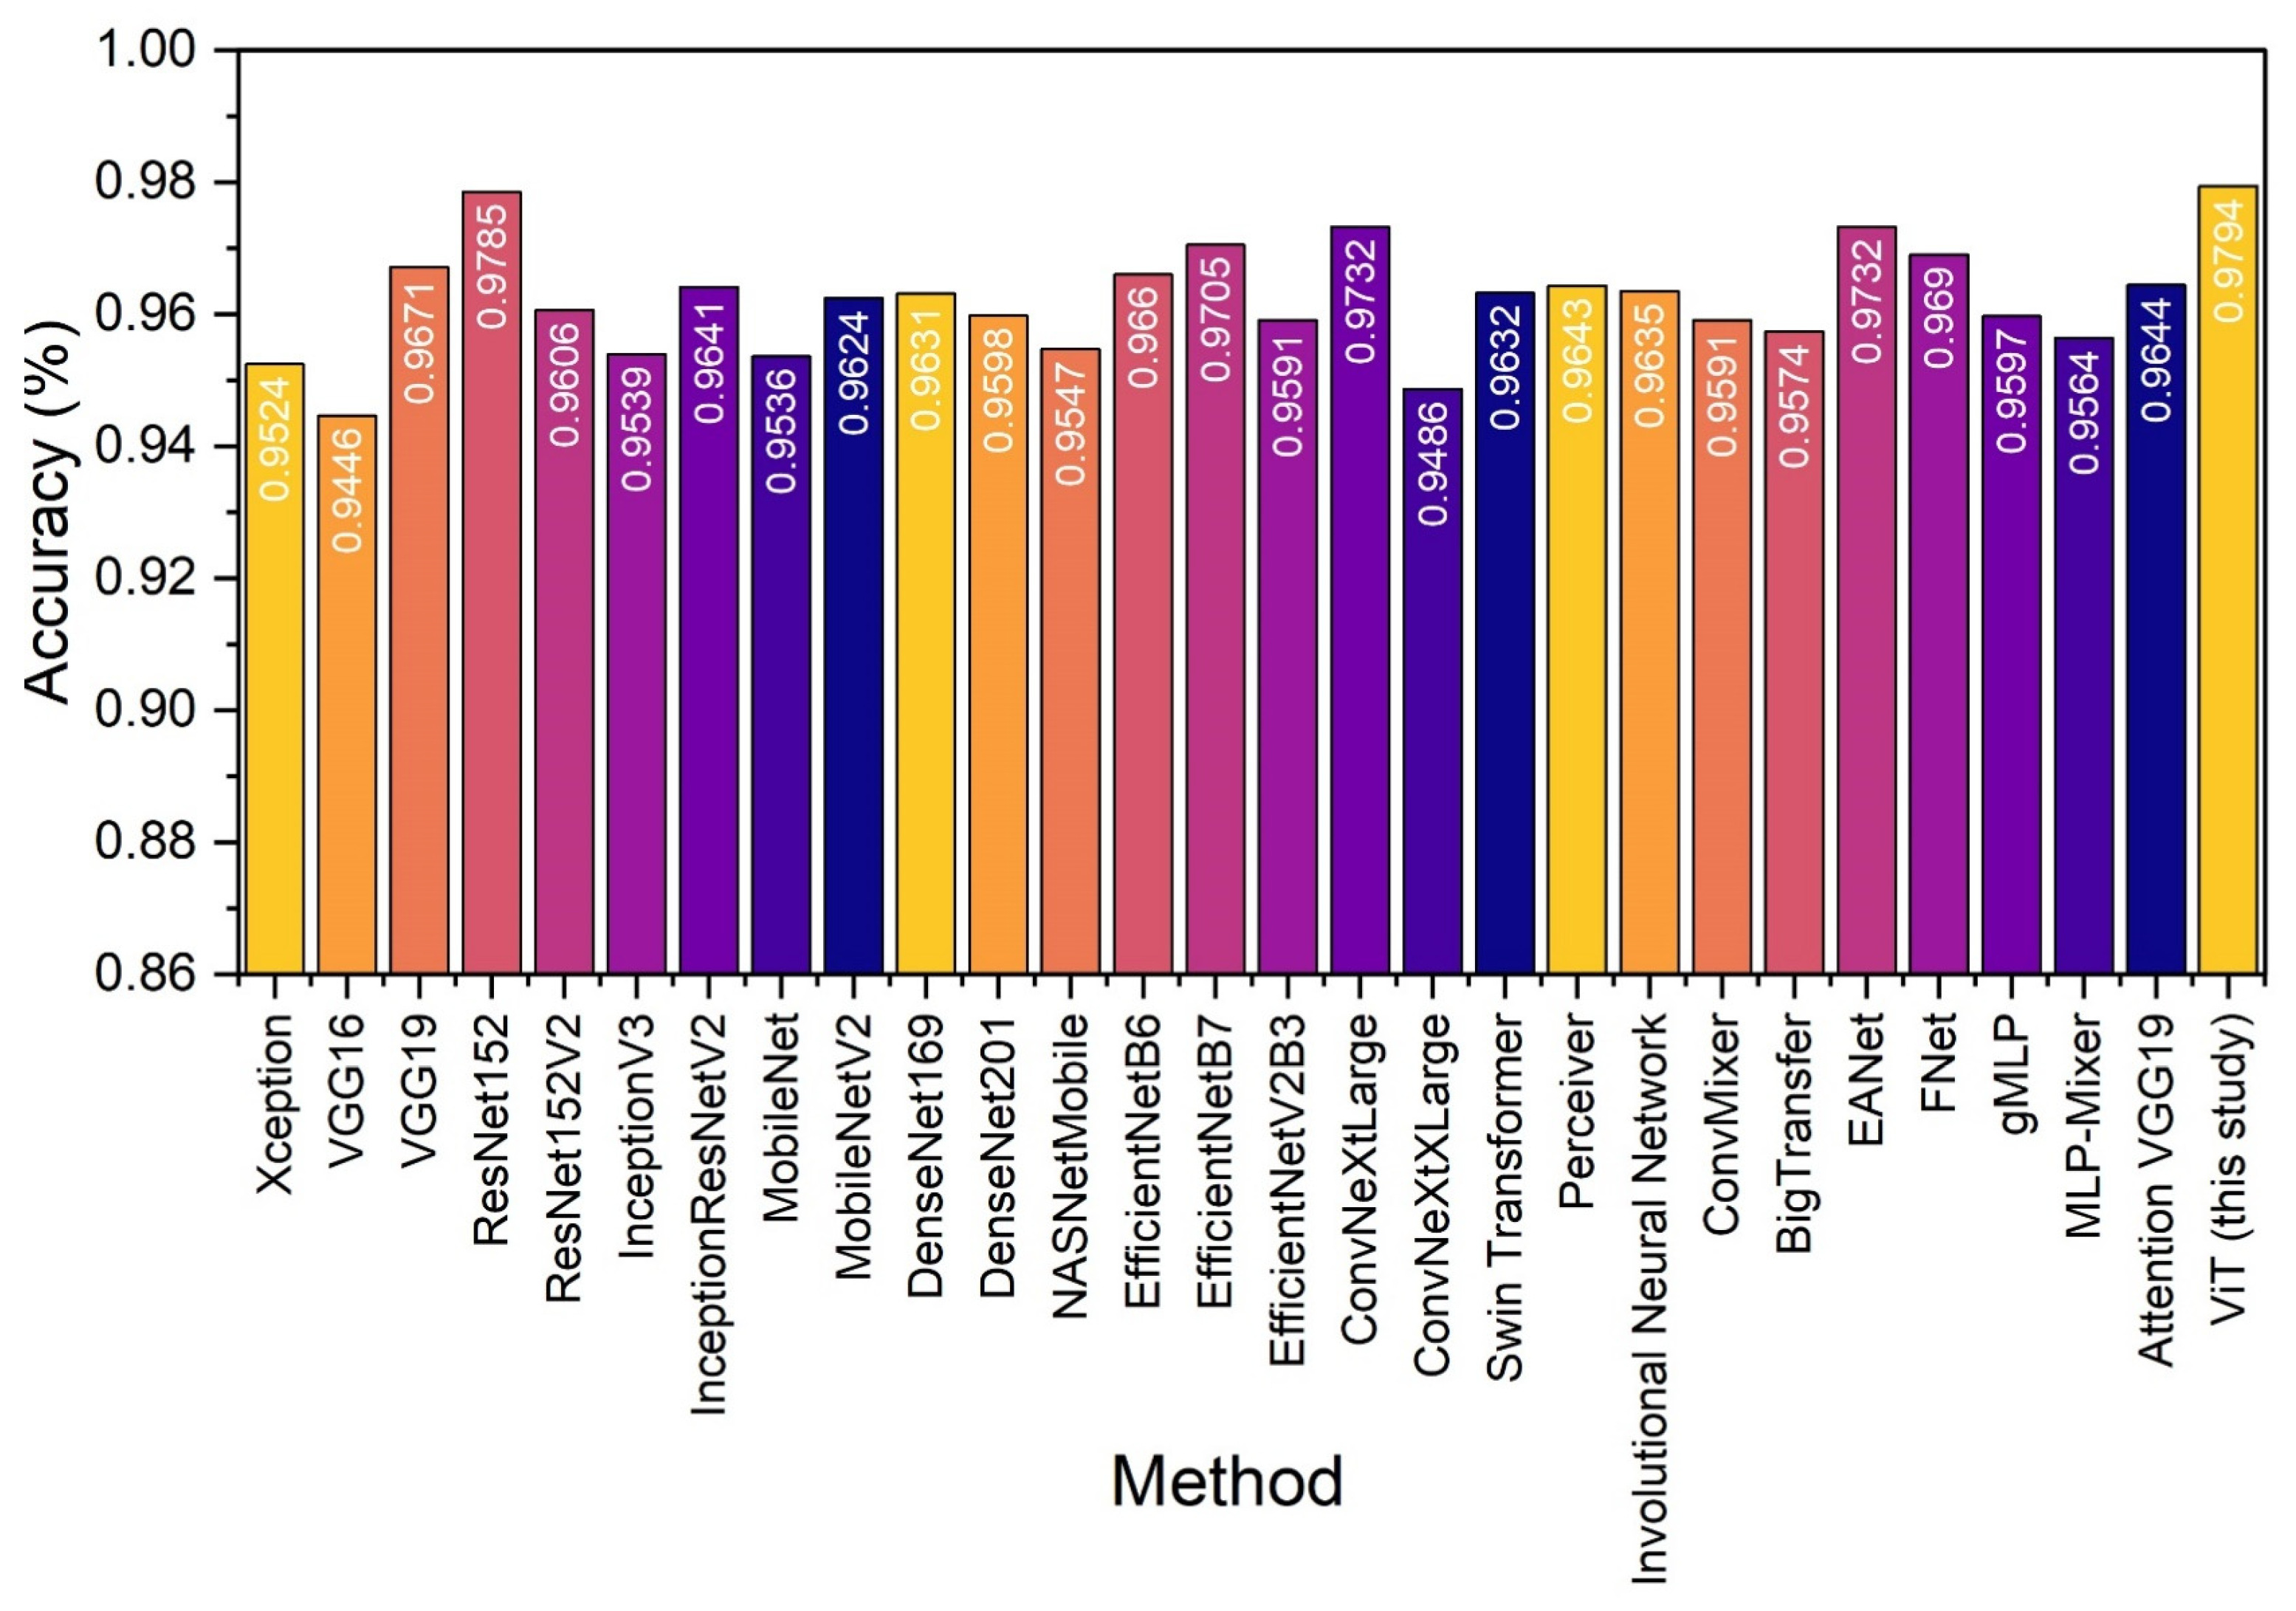
| Model | Accuracy | Precision | Recall | F1 |
|---|---|---|---|---|
| Xception [34] | 0.9524 | 0.9726 | 0.9390 | 0.9555 |
| VGG16 [29] | 0.9446 | 0.9647 | 0.9323 | 0.9482 |
| VGG19 [29] | 0.9671 | 0.9875 | 0.9516 | 0.9693 |
| ResNet152 [35] | 0.9785 | 0.9887 | 0.9716 | 0.9800 |
| ResNet152V2 [35] | 0.9606 | 0.9861 | 0.9409 | 0.9630 |
| InceptionV3 [36] | 0.9539 | 0.9711 | 0.9433 | 0.9570 |
| InceptionResNetV2 [36] | 0.9641 | 0.9796 | 0.9539 | 0.9666 |
| MobileNet [27] | 0.9536 | 0.9820 | 0.9319 | 0.9563 |
| MobileNetV2 [27] | 0.9624 | 0.9805 | 0.9499 | 0.9649 |
| DenseNet169 [37] | 0.9631 | 0.9669 | 0.9652 | 0.9660 |
| DenseNet201 [37] | 0.9598 | 0.9736 | 0.9519 | 0.9627 |
| NASNetMobile [38] | 0.9547 | 0.9819 | 0.9340 | 0.9574 |
| EfficientNetB6 [39] | 0.9660 | 0.9718 | 0.9655 | 0.9686 |
| EfficientNetB7 [39] | 0.9705 | 0.9842 | 0.9611 | 0.9725 |
| EfficientNetV2B3 [39] | 0.9591 | 0.9716 | 0.9526 | 0.9620 |
| ConvNeXtLarge [40] | 0.9732 | 0.9870 | 0.9634 | 0.9750 |
| ConvNeXtXLarge [40] | 0.9486 | 0.9651 | 0.9396 | 0.9522 |
| Swin Transformer [41] | 0.9632 | 0.9874 | 0.9445 | 0.9654 |
| Perceiver Network [42] | 0.9643 | 0.9711 | 0.9631 | 0.9671 |
| Involutional Neural Network [43] | 0.9635 | 0.9725 | 0.9601 | 0.9663 |
| ConvMixer [16,44,45] | 0.9591 | 0.9715 | 0.9529 | 0.9621 |
| BigTransfer [46] | 0.9574 | 0.9659 | 0.9555 | 0.9606 |
| EANet [47] | 0.9732 | 0.9874 | 0.9630 | 0.9750 |
| FNet [33] | 0.9690 | 0.9709 | 0.9722 | 0.9716 |
| gMLP [48] | 0.9597 | 0.9818 | 0.9435 | 0.9623 |
| MLP-Mixer [46] | 0.9564 | 0.9656 | 0.9539 | 0.9597 |
| Attention VGG19 [49] | 0.9644 | 0.9852 | 0.9489 | 0.9667 |
| Vision Transformer (this study) | 0.9794 | 0.9886 | 0.9733 | 0.9809 |
| Model | Accuracy | Precision | Recall | F1 |
|---|---|---|---|---|
| random forest | 0.9343 | 0.9693 | 0.9081 | 0.9377 |
| XGBoost | 0.9343 | 0.9635 | 0.9140 | 0.9381 |
| K-Nearest Neighbours | 0.9213 | 0.9767 | 0.8764 | 0.9238 |
| Support Vector Machine | 0.9159 | 0.9773 | 0.8655 | 0.9180 |
| Naive Bayes | 0.8733 | 0.9615 | 0.7991 | 0.8728 |
| Neural Network | 0.8732 | 0.9752 | 0.7870 | 0.8710 |
| Vision Transformer (this study) | 0.9794 | 0.9886 | 0.9733 | 0.9809 |
| Fruit | Study | Objective | Method(s) | Accuracy |
|---|---|---|---|---|
| Plum | [19] | Determination of plum maturity from images | Deep CNN | 91–97% |
| Mangosteen | [20] | Quality assurance in mangosteen export | Deep CNN | 97% |
| Apple | [21] | Apple lesions identification | Deep CNN | 97.5% |
| Banana | [22] | Differentiation between naturally and artificially ripened bananas | Neural Network | 98.74% |
| Peach | [23] | Peach disease identification | Deep Belief Network | 82.5–100% |
| Multiple (6) | [24] | Quality Assessment | Deep CNN | 99.6% |
| Multiple (3) | [25] | Quality Assessment | Deep CNN | 95% |
| Banana | [11] | Quality Assessment | Deep CNN | 81.75–98.25% |
| Multiple (3) | [26] | Quality Assessment | Deep CNN | 99.61% |
| Papaya | [28] | Quality Assessment | Deep CNN | 100% |
| Pomegranate | [50] | Quality Assessment | Recurrent Neural Network | 95% |
| Grapes | [51] | Quality Assessment | Artificial Neural Network | 87.8% |
| Mango | [52] | Quality Assessment | SVM | 98.6% |
| Apple | [52] | Quality Assessment | Deep CNN | 98.6% |
Disclaimer/Publisher’s Note: The statements, opinions and data contained in all publications are solely those of the individual author(s) and contributor(s) and not of MDPI and/or the editor(s). MDPI and/or the editor(s) disclaim responsibility for any injury to people or property resulting from any ideas, methods, instructions or products referred to in the content. |
© 2023 by the authors. Licensee MDPI, Basel, Switzerland. This article is an open access article distributed under the terms and conditions of the Creative Commons Attribution (CC BY) license (https://creativecommons.org/licenses/by/4.0/).
Share and Cite
Apostolopoulos, I.D.; Tzani, M.; Aznaouridis, S.I. A General Machine Learning Model for Assessing Fruit Quality Using Deep Image Features. AI 2023, 4, 812-830. https://doi.org/10.3390/ai4040041
Apostolopoulos ID, Tzani M, Aznaouridis SI. A General Machine Learning Model for Assessing Fruit Quality Using Deep Image Features. AI. 2023; 4(4):812-830. https://doi.org/10.3390/ai4040041
Chicago/Turabian StyleApostolopoulos, Ioannis D., Mpesi Tzani, and Sokratis I. Aznaouridis. 2023. "A General Machine Learning Model for Assessing Fruit Quality Using Deep Image Features" AI 4, no. 4: 812-830. https://doi.org/10.3390/ai4040041
APA StyleApostolopoulos, I. D., Tzani, M., & Aznaouridis, S. I. (2023). A General Machine Learning Model for Assessing Fruit Quality Using Deep Image Features. AI, 4(4), 812-830. https://doi.org/10.3390/ai4040041