Article

A Deep Learning Enabled Multi-Class Plant Disease Detection Model Based on Computer Vision

by
Arunabha M. Roy
1,2,* and
Jayabrata Bhaduri
2
1
Aerospace Engineering Department, University of Michigan, Ann Arbor, MI 48109, USA
2
Deep Learning & Data Science Division, Capacloud AI, Kolkata 711103, India
*
Author to whom correspondence should be addressed.
AI 2021, 2(3), 413-428; https://doi.org/10.3390/ai2030026
Submission received: 15 July 2021 / Revised: 19 August 2021 / Accepted: 24 August 2021 / Published: 26 August 2021

Abstract

:
In this paper, a deep learning enabled object detection model for multi-class plant disease has been proposed based on a state-of-the-art computer vision algorithm. While most existing models are limited to disease detection on a large scale, the current model addresses the accurate detection of fine-grained, multi-scale early disease detection. The proposed model has been improved to optimize for both detection speed and accuracy and applied to multi-class apple plant disease detection in the real environment. The mean average precision (mAP) and F1-score of the detection model reached up to 91.2 % and 95.9 % , respectively, at a detection rate of 56.9 FPS. The overall detection result demonstrates that the current algorithm significantly outperforms the state-of-the-art detection model with a 9.05 % increase in precision and 7.6 % increase in F1-score. The proposed model can be employed as an effective and efficient method to detect different apple plant diseases under complex orchard scenarios.

1. Introduction

Plant diseases and pests cause significant ecological and agricultural losses. Thus, early detection and prevention of various plant diseases is a key strategy in agriculture technology for commercial farms and orchards. Generally, traditional manual visual observation for disease diagnosis methods are inefficient and time-consuming and significantly increase overhead costs [1,2,3,4,5,6]. Recently, with the modern advancement of computer vision in precision agriculture technology, disease detection protocol has become an integral part of collecting information regarding crop health monitoring, which substantially improves the efficiency of disease detection and output of the crop production [7,8,9,10,11].
Early identification and prevention of plant diseases are the important aspects of crop harvesting since they can effectively reduce any growth disorders, and thus minimize pesticide application for pollution-free crop production. In this regard, automated plant disease detection utilizing different machine learning (ML) algorithms have become an efficient approach for precision agriculture [12,13,14,15,16,17,18]. Different ML approaches such as K-means clustering [14] and support vector machine (SVM) [16,17,18] have been employed for plant and disease classification and detection. However, due to complex image preprocessing and feature extraction steps, such methods have lower performance and speed in real-time disease detection. Additionally, one of the main drawbacks of traditional ML approaches is that they are not suitable for real-life detection scenarios with non-uniform complex backgrounds. In this regard, recently, deep learning has made a significant breakthrough in the realm of computer vision with various applications [19,20,21]. It has also been employed in automated agricultural technology [22], including crop and fruit classification [23,24,25], image segmentation [26,27], and crop detection [28]. Consequently, convolution neural network (CNN)-based models have gained significant popularity by demonstrating higher accuracy in object detection [29,30]. CNNs can avoid complex preprocessing by automatically extracting features directly from the input images. Thus, they have created major breakthroughs in crop disease detection in recent advancements [31,32,33,34,35,36,37,38]. CNN-based object detection models have been developed that can be classified into two classes: two-stage and one-stage detectors [39]. One of the popular two-stage detectors is the region convolution neural network (RCNN), which includes fast/ faster-RCNN [40,41] and mask-RCNN [42]. These models have had a significant impact on crop and fruit detection, yield, growth evaluation, and automated agricultural management [43,44,45]. However, Faster R-CNN consists of region proposal networks (RPN) and classification networks, which leads to a significant drop in detection time, and these models cannot perform real-time detection for high-resolution images. More recently, the You Only Look Once (YOLO) algorithm [46,47,48,49] has been proposed, which unifies target classification and localization into a regression problem. Since YOLO does not have RPN, it can directly perform regression to detect targets in the image, which leads to significant improvement in the detection speed. The state-of-art YOLOv4 not only has high detection speed but also performs with high precision and accuracy for different real-time object detection applications.
The current study focuses on plant disease detection in the apple, which has significant commercial value due to its vast dietary and nutritional qualities. However, during the growth stage, apple plants are vulnerable to various diseases including two serious and common fungus diseases: scab (caused by Venturia inaequalis) and rust (caused by Gymnosporangium juniperi-virginianae), which can drastically reduce yield and fruit quality. Thus, it is a critical aspect in autonomous agriculture production to detect the early phase of disease spots in apple plants to employ disease prevention and curing more efficiently. However, the real-time early disease detection of apple leaf remain challenging due to fine-grained multi-scale distribution, the similarity of color texture between diseases and background, diversity of diseases’ morphology, and occurrence of multiple diseases in the same leaf. Additionally, a complex background, including overlapping leaves and soil, variability of light in a real environment, and several other factors, leads to the difficult task of detecting diseases in apple leaves with high precision. In addition, existing disease detection models have a trade-off between accuracy and real-time detection speed. Thus, there is a significant gap between the existing model and the real-time detection of diseases in fields based on mobile computing devices.
In order to address the aforementioned challenges and shortcomings, an multi-scale disease detection model has been proposed based on improved version of the state-of-art YOLOv4 algorithm [49] and applied to real-time apple plant disease identification in real environment. In the proposed model, CSPDarkNet53 has been modified to be Dense-CSPDarkNet53 by introducing DenseNet blocks to improve feature transfer and reuse for small-target detection. To optimize redundancy and reduce computing cost, the number of network layers has been reduced by modifying the convolution blocks. Furthermore, a modified path aggregation network (PANet) has been utilized to preserve fine-grain localization information and enhance feature fusion of multi-scale semantic information. In addition, the integration of a spatial pyramid pooling (SPP) block in the proposed model enhances the receptive field. Implementing Mish [50] as a primary activation function in both neck and backbone, the current model improves the feature learning ability and increases the accuracy of detection procedures substantially. In order to prevent overfitting and increase robustness during the training process, a data augmentation procedure has been employed. The proposed model can automatically detect the discriminating features of each disease of different sizes as well as the coexistence of multiple diseases within the same image with high accuracy under a complex orchard environment. The overall detection result demonstrates that the current method outperforms the original YOLOv4 model. Current work can be employed as an effective and efficient method of detecting different plant diseases in apple with accurate detection performance under complex orchard scenarios.

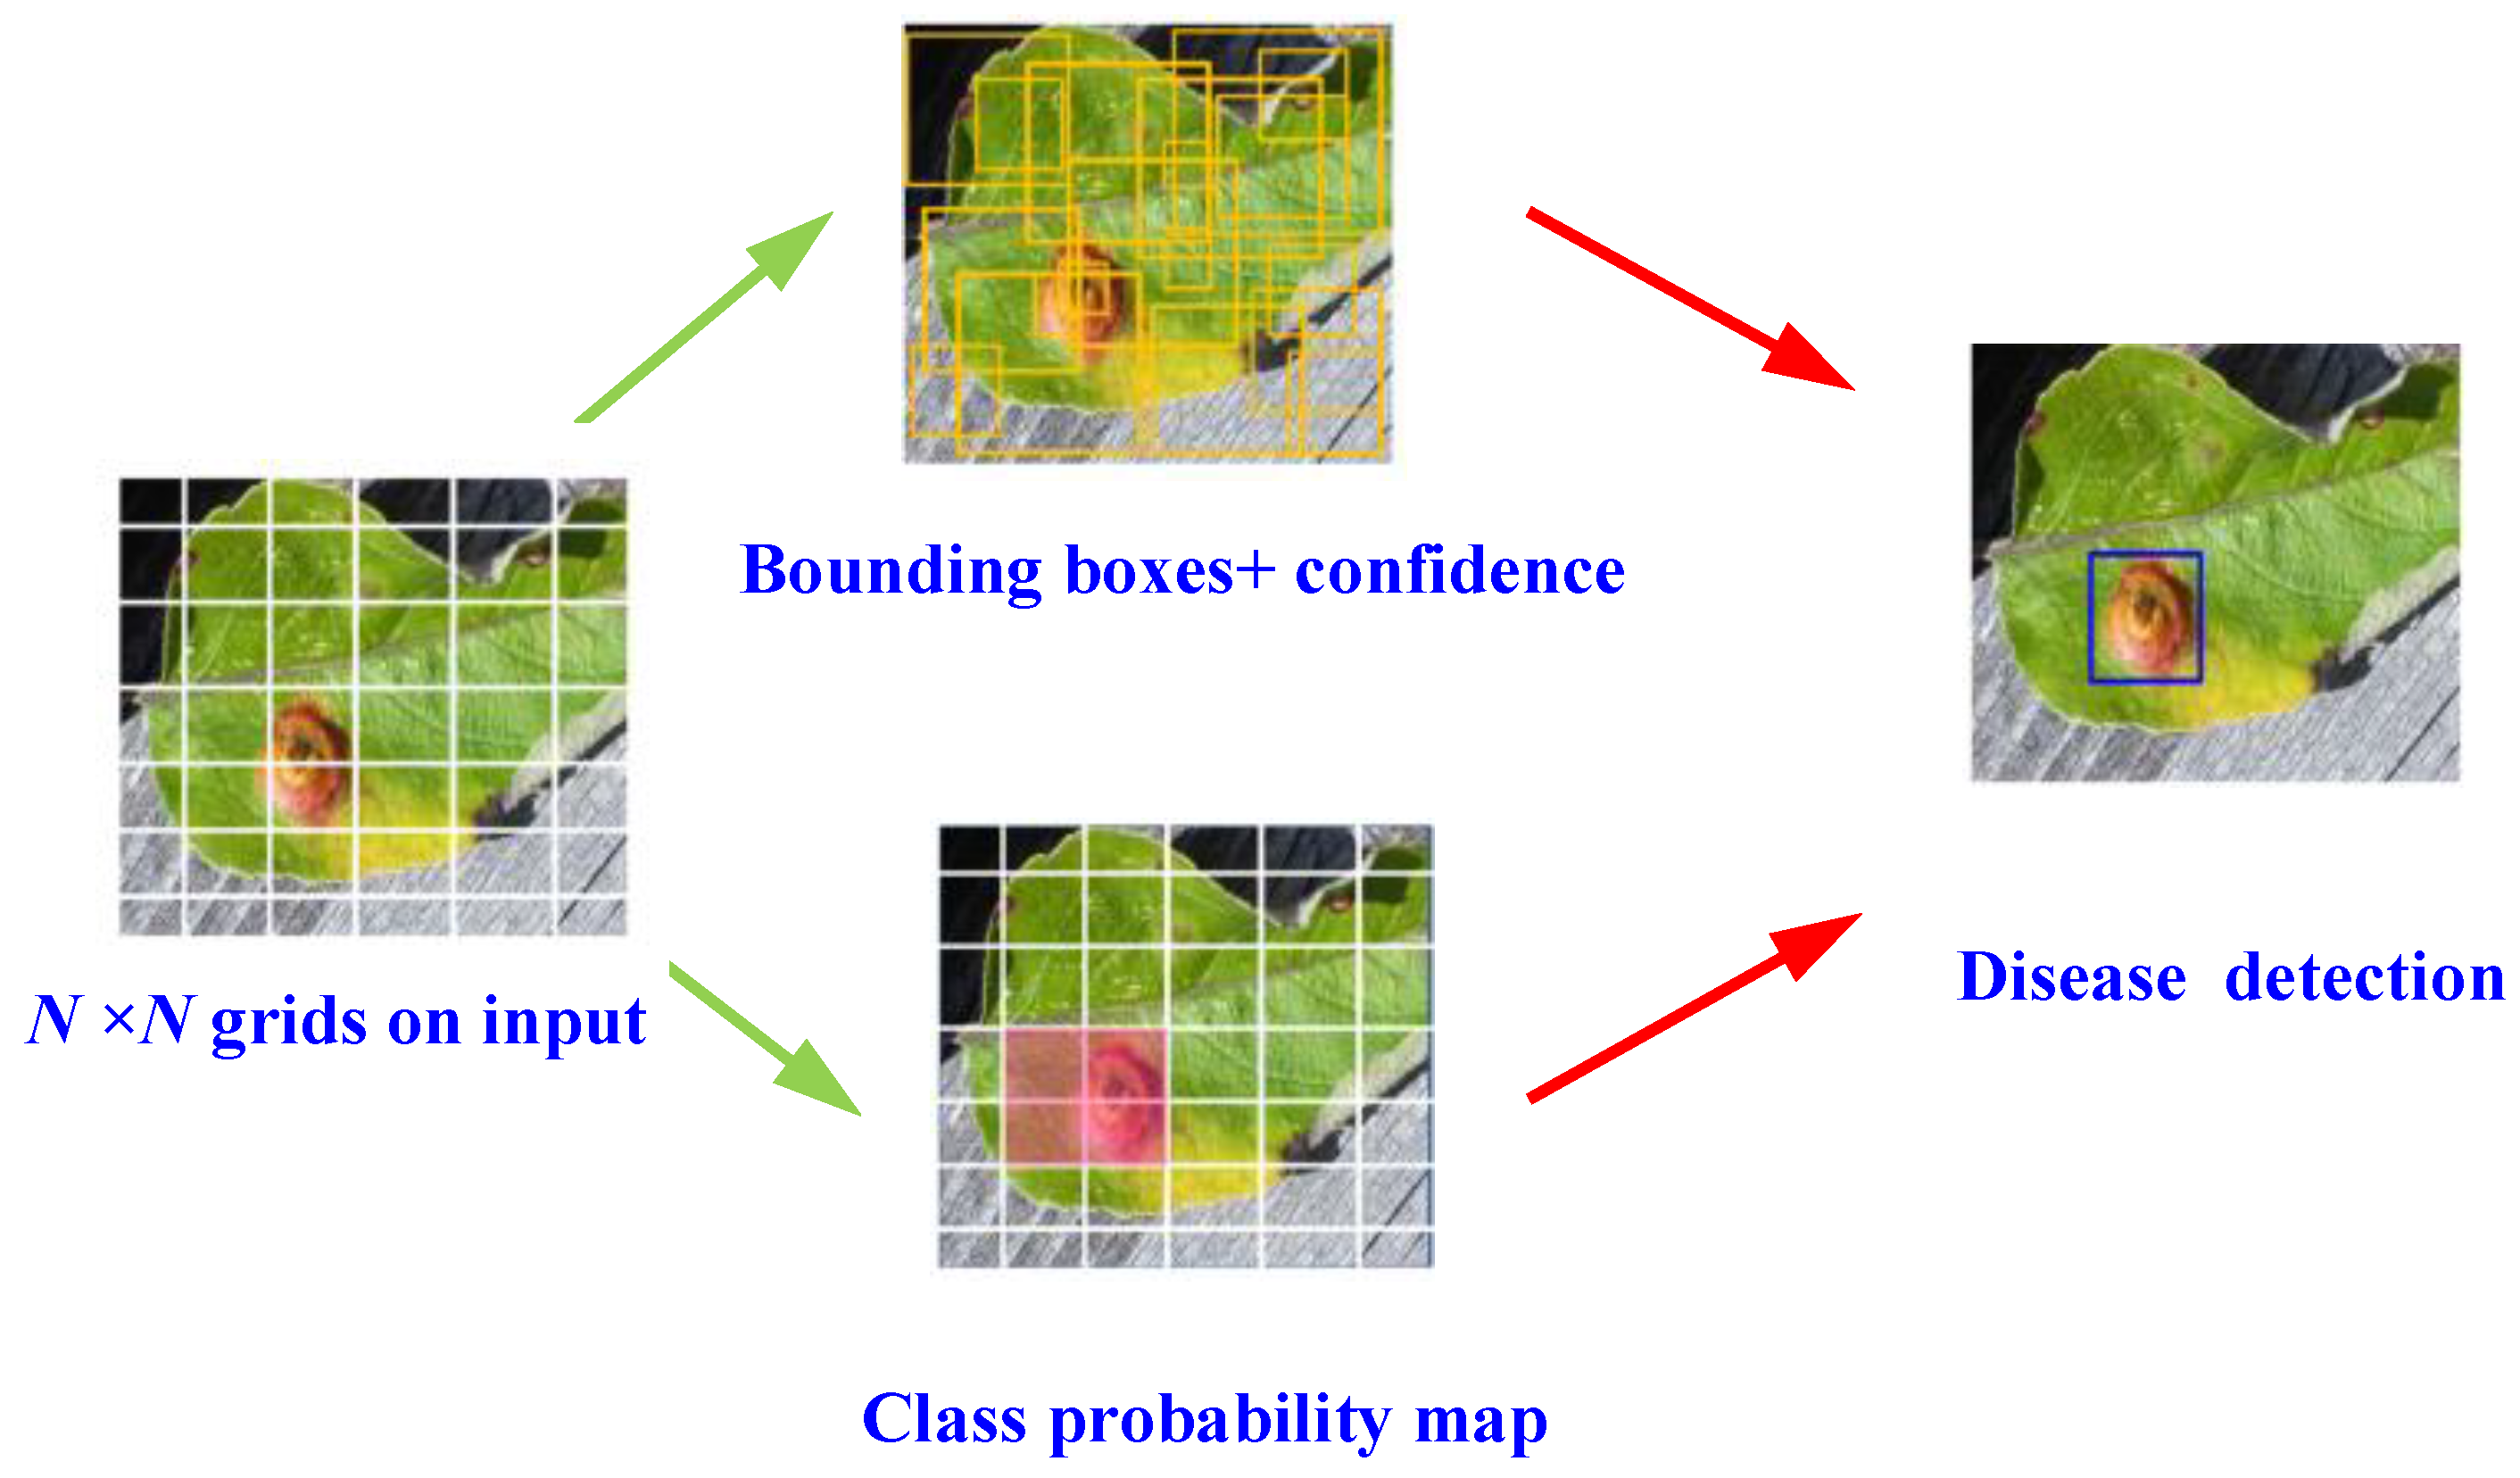
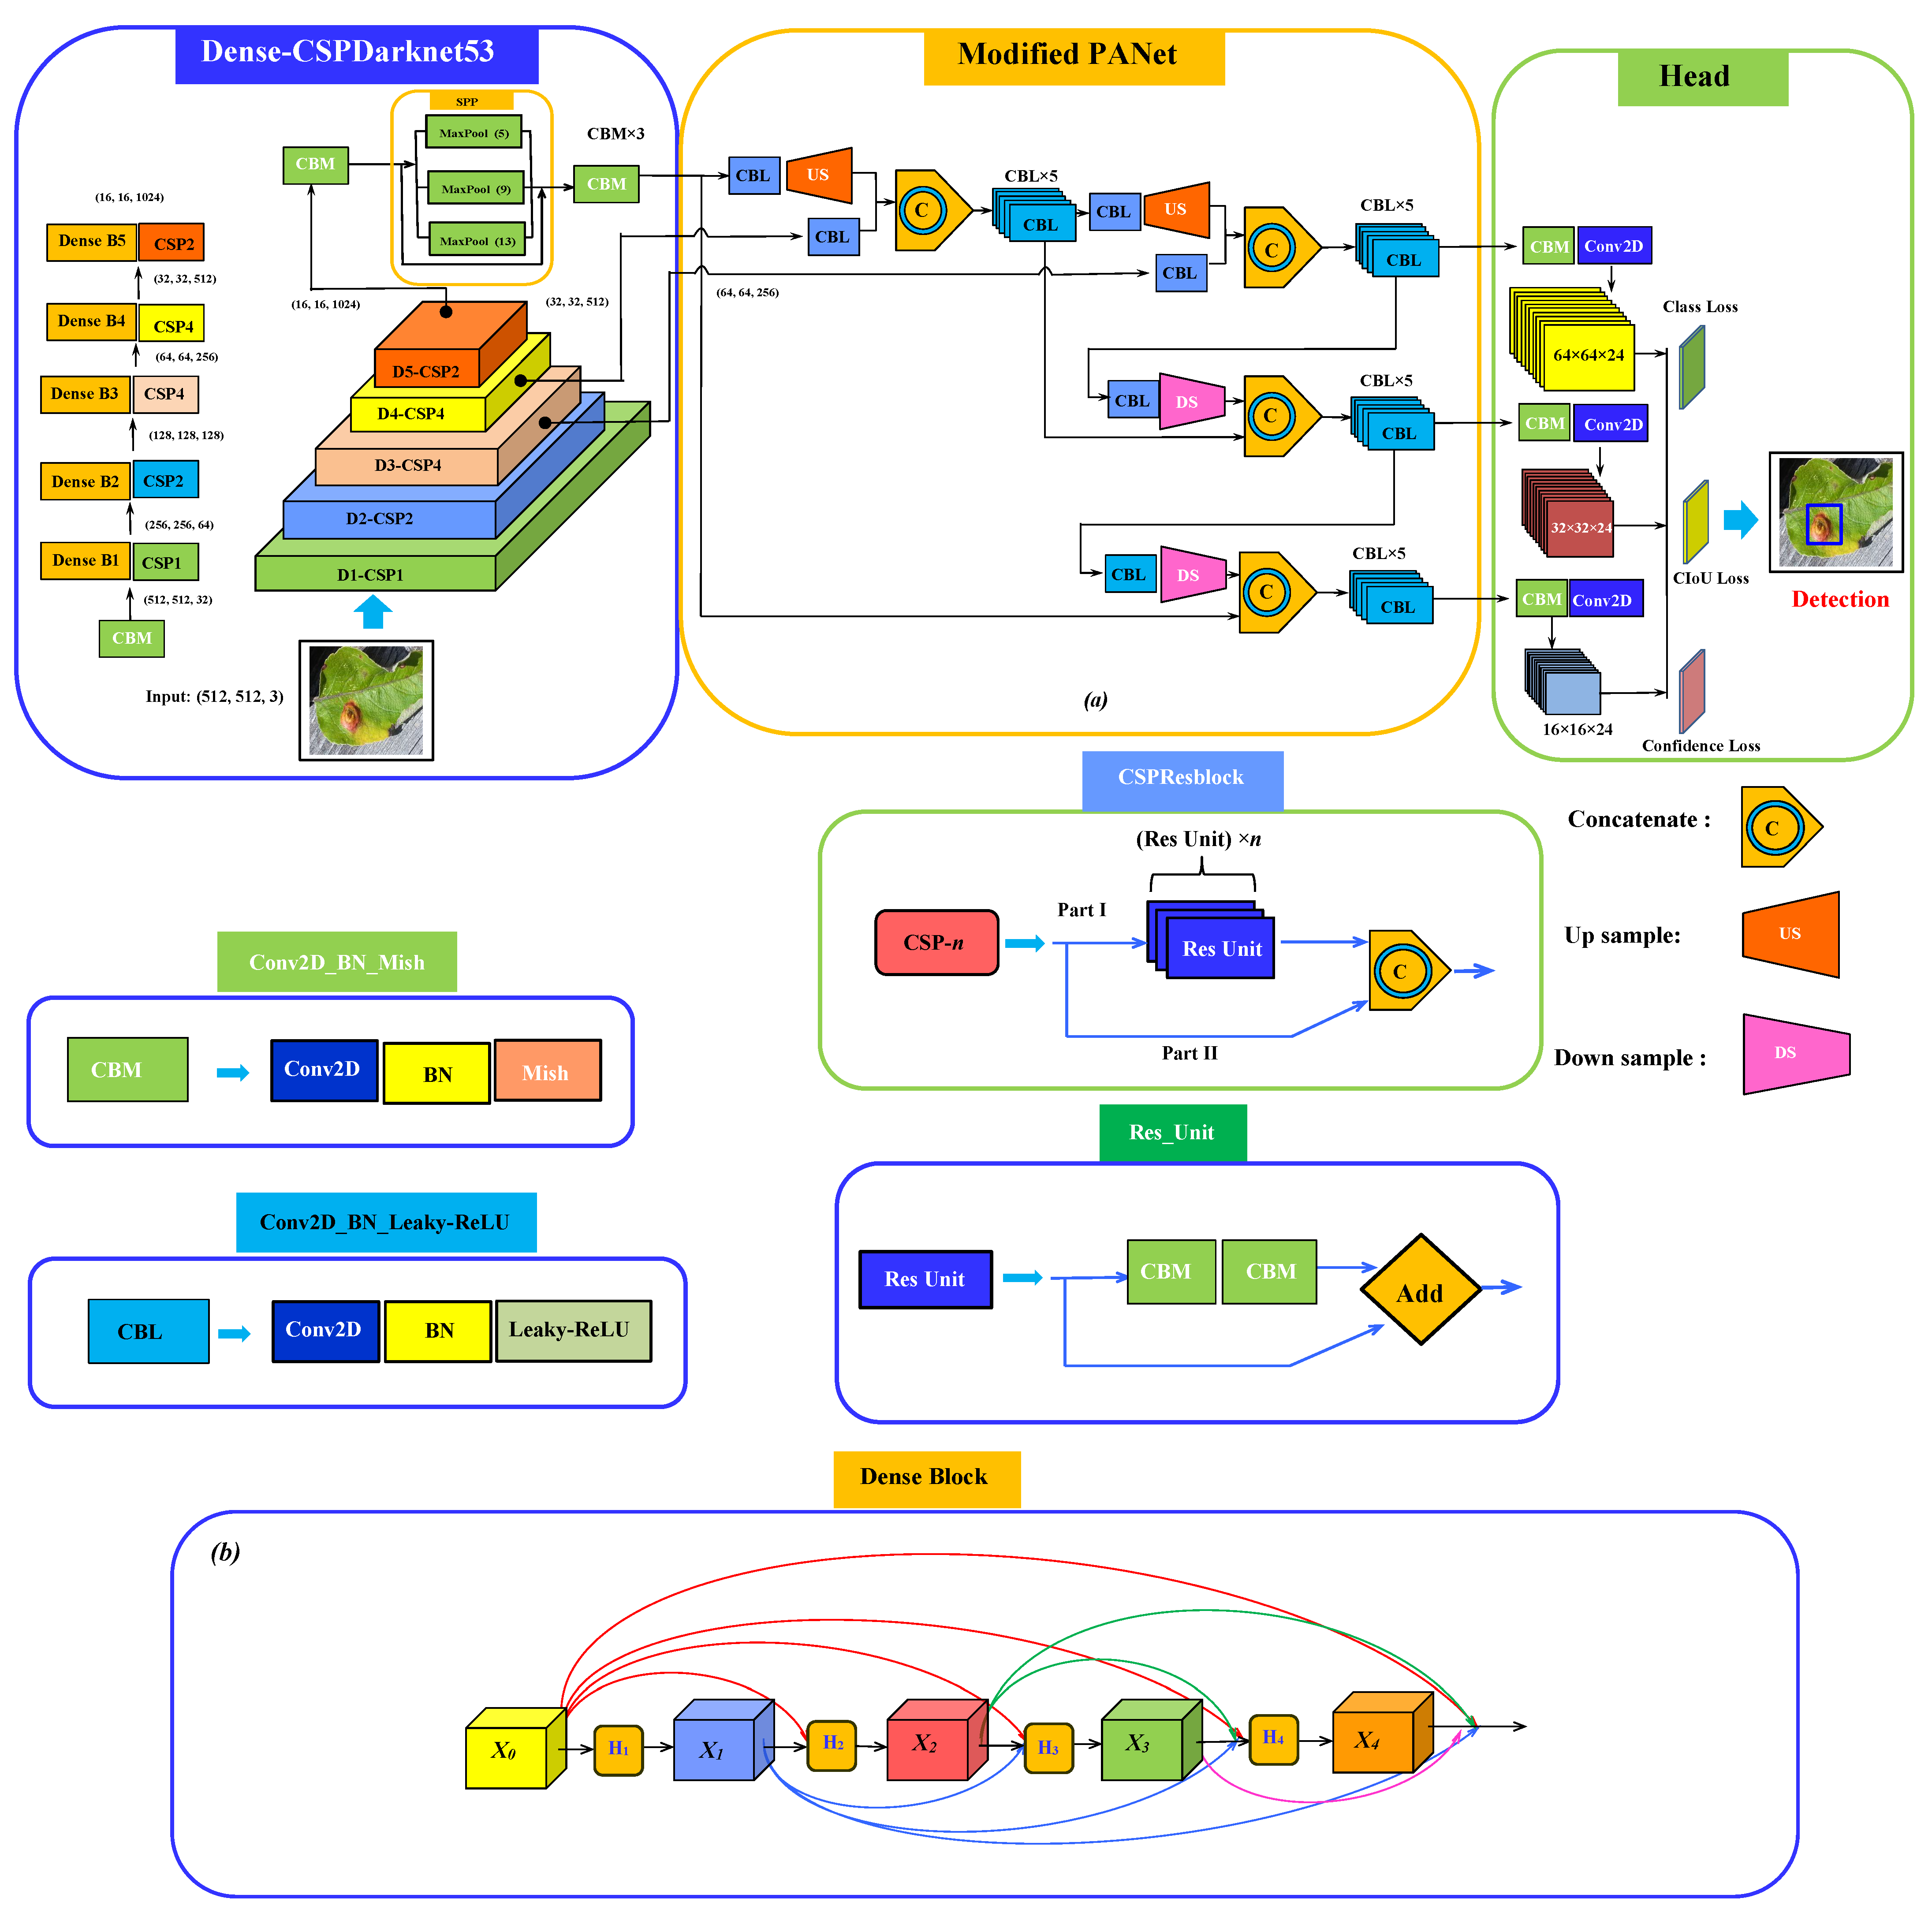
2. The Proposed Network Structure of the Detection Model

In the current work, an improved model based on the start-of-the-art YOLOV4 algorithm [49] has been utilized for disease detection.
YOLOv4 is a high-precision one-stage object detection model that transforms the object detection task into a regression problem by generating bounding box coordinates and corresponding probabilities of each class. During object detection, the inputted image is divided into N × N uniformly equal grids. The model generates B predictive bounding boxes and a corresponding confidence score if the target falls inside the grid. When the center of the target-class ground truth falls inside a specified grid, it detects the target for a particular object class. Each grid predicts B bounding boxes with the confidence scores and corresponding C class conditional probabilities for the each target-class. The confidence scores can be expressed as
c o n f i d e n c e = p r ( o b j e c t ) × I o U p r e d t r u t h p r ( o b j e c t ) 0 , 1
When the target class falls inside the YOLO grid, p r ( o b j e c t ) = 1 is prescribed; otherwise, p r ( o b j e c t ) = 0 . The coincidence between the reference and the predicted bounding box is described by I o U p r e d t r u t h . Here, I o U is the intersection over union. The value of p r ( o b j e c t ) indicates the accuracy of bounding box prediction when the target class is detected inside the grid. Finally, the best bounding box prediction from each of these scales has been filtered by non-maximum suppression (NMS) [41] algorithm before the final bounding box can be obtained. The detection process is shown in Figure 1.
However, when detecting different diseases in the apple plant in the original YOLOv4 model, there are several issues, in particular, densely populated fine-grained and multi-scale distribution, irregular geometric morphology of the infected areas, the occurrence of multiple diseases in the same leaf, and complex background, which significantly hinder detection accuracy and leads to a high number of missed detection as well as false object prediction. In order to resolve the aforementioned issues, in the present work, an improved and optimized version of the state-of-the-art YOLOv4 algorithm has been proposed based on the characteristics and complexities of the disease dataset to achieve better efficiency and accuracy of detecting different apple plant diseases with a real-time detection speed in a complex environment. The complete schematic of the model network architecture has been shown in Figure 2, which consists of three parts: backbone for the feature extraction, neck for semantic representation of extracted features, and head for the prediction.
During object detection, the YOLOv4 algorithm reduces the feature maps in the neural network. In order to preserve important feature maps and reuse the critical feature information more efficiently, the DenseNet framework [51] has been implemented in the proposed model, where each layer has been connected to other layers in feed-forward mode. The main advantage of the DenseNet block is that the n-th layer is able to receive the required feature information X n from all the previous layers X 0 , X 1 , . . . , X n 1 inputs, which can be expressed as X n = H n [ X 0 , X 1 , . . . , X n 1 ] , where H n is the spliced feature map function for layer n; [ X 0 , X 1 , . . . , X n 1 ] is the feature map of layers X 0 , X 1 , . . . , X n 1 . Due to the complexity of the image dataset, it is found out that the dense blocks facilitate better feature transfer and gradients throughout the proposed neural network. Additionally, it may mitigate over-fitting to some degree. Thus, in the proposed model, the Cross-Stage Partial (CSP) networks convolution blocks CSP1, CSP2, CSP8, CSP8, and CSP4 in original CSPDarknet53 have been modified to D1-CSP1, D2-CSP2, D3-CSP4, D4-CSP4, and D5-CSP2 by adding dense connection blocks to enhance feature propagation and reducing convolution blocks to reduce the number of redundant feature operations and improve the computational speed. The schematic of the proposed dense block network structure has been shown in Figure 2b.
One of the important aspects of the object detection model is to select proper activation function for a specific problem to enhance the accuracy and performance of the neural network [52]. In order to enhance stabilization of the network gradient flow and help learning more expressive features in the detection model, the proposed model uses Mish activation function [50], which can be expressed as: f ( x ) = x . t a n h ( s o f t p l u s ( x ) ) = x . t a n h ( I n ( 1 + e x ) ) . Additionally, due to Mish’s unique property of unboundedness and bounded below, it helps to remove the saturation problem of the output neurons and improve network regularization. Additionally, it is unbiased towards the initialization of weights and learning rate due to the smoothness property. Thus, using Mish as a primary activation function replacing Leaky Rectified Linear Unit (Leaky-ReLU) [53] in the proposed model has demonstrated a significant gain in accuracy in our custom model dataset.
To enhance the receptive field and separate important context features during object detection, an SPP block [54] was tightly integrated with the last residual block (D5-CSP2) as shown in Figure 2. In the proposed model, the SPP was modified to retain the output spatial dimension, with a maximum pool applied to a sliding kernel of size 5 × 5 , 9 × 9 , and 13 × 13 , considering stride equal to 1. A relatively large 13 × 13 max-pooling effectively increases the receptive field of the backbone. Furthermore, to preserve fine-grain localize information, a modified PANet [55] has been used in the neck part of the proposed network model which shortens the path of high and low fusion for multi-scale feature pyramid map as shown in Figure 2. Additionally, drop block regularization [56] for learning spatially discriminating features and class label smoothing [49] for better generalization of a dataset was employed. The original YOLOv3 head was utilized as the detection head. With the inputted image size of 512 × 512 × 3 , the proposed model can predict bounding boxes at the detection head in three different scales: 64 × 64 × 24 , 32 × 32 × 24 , and 16 × 16 × 24 . The data augmentation procedure (i.e., rotation, mirror projection, color balancing, brightness transformation, blur processing) was employed (as shown in Figure 3) to increase the variability of inputted images obtained from different environments, which enhances the robustness of the detection model.

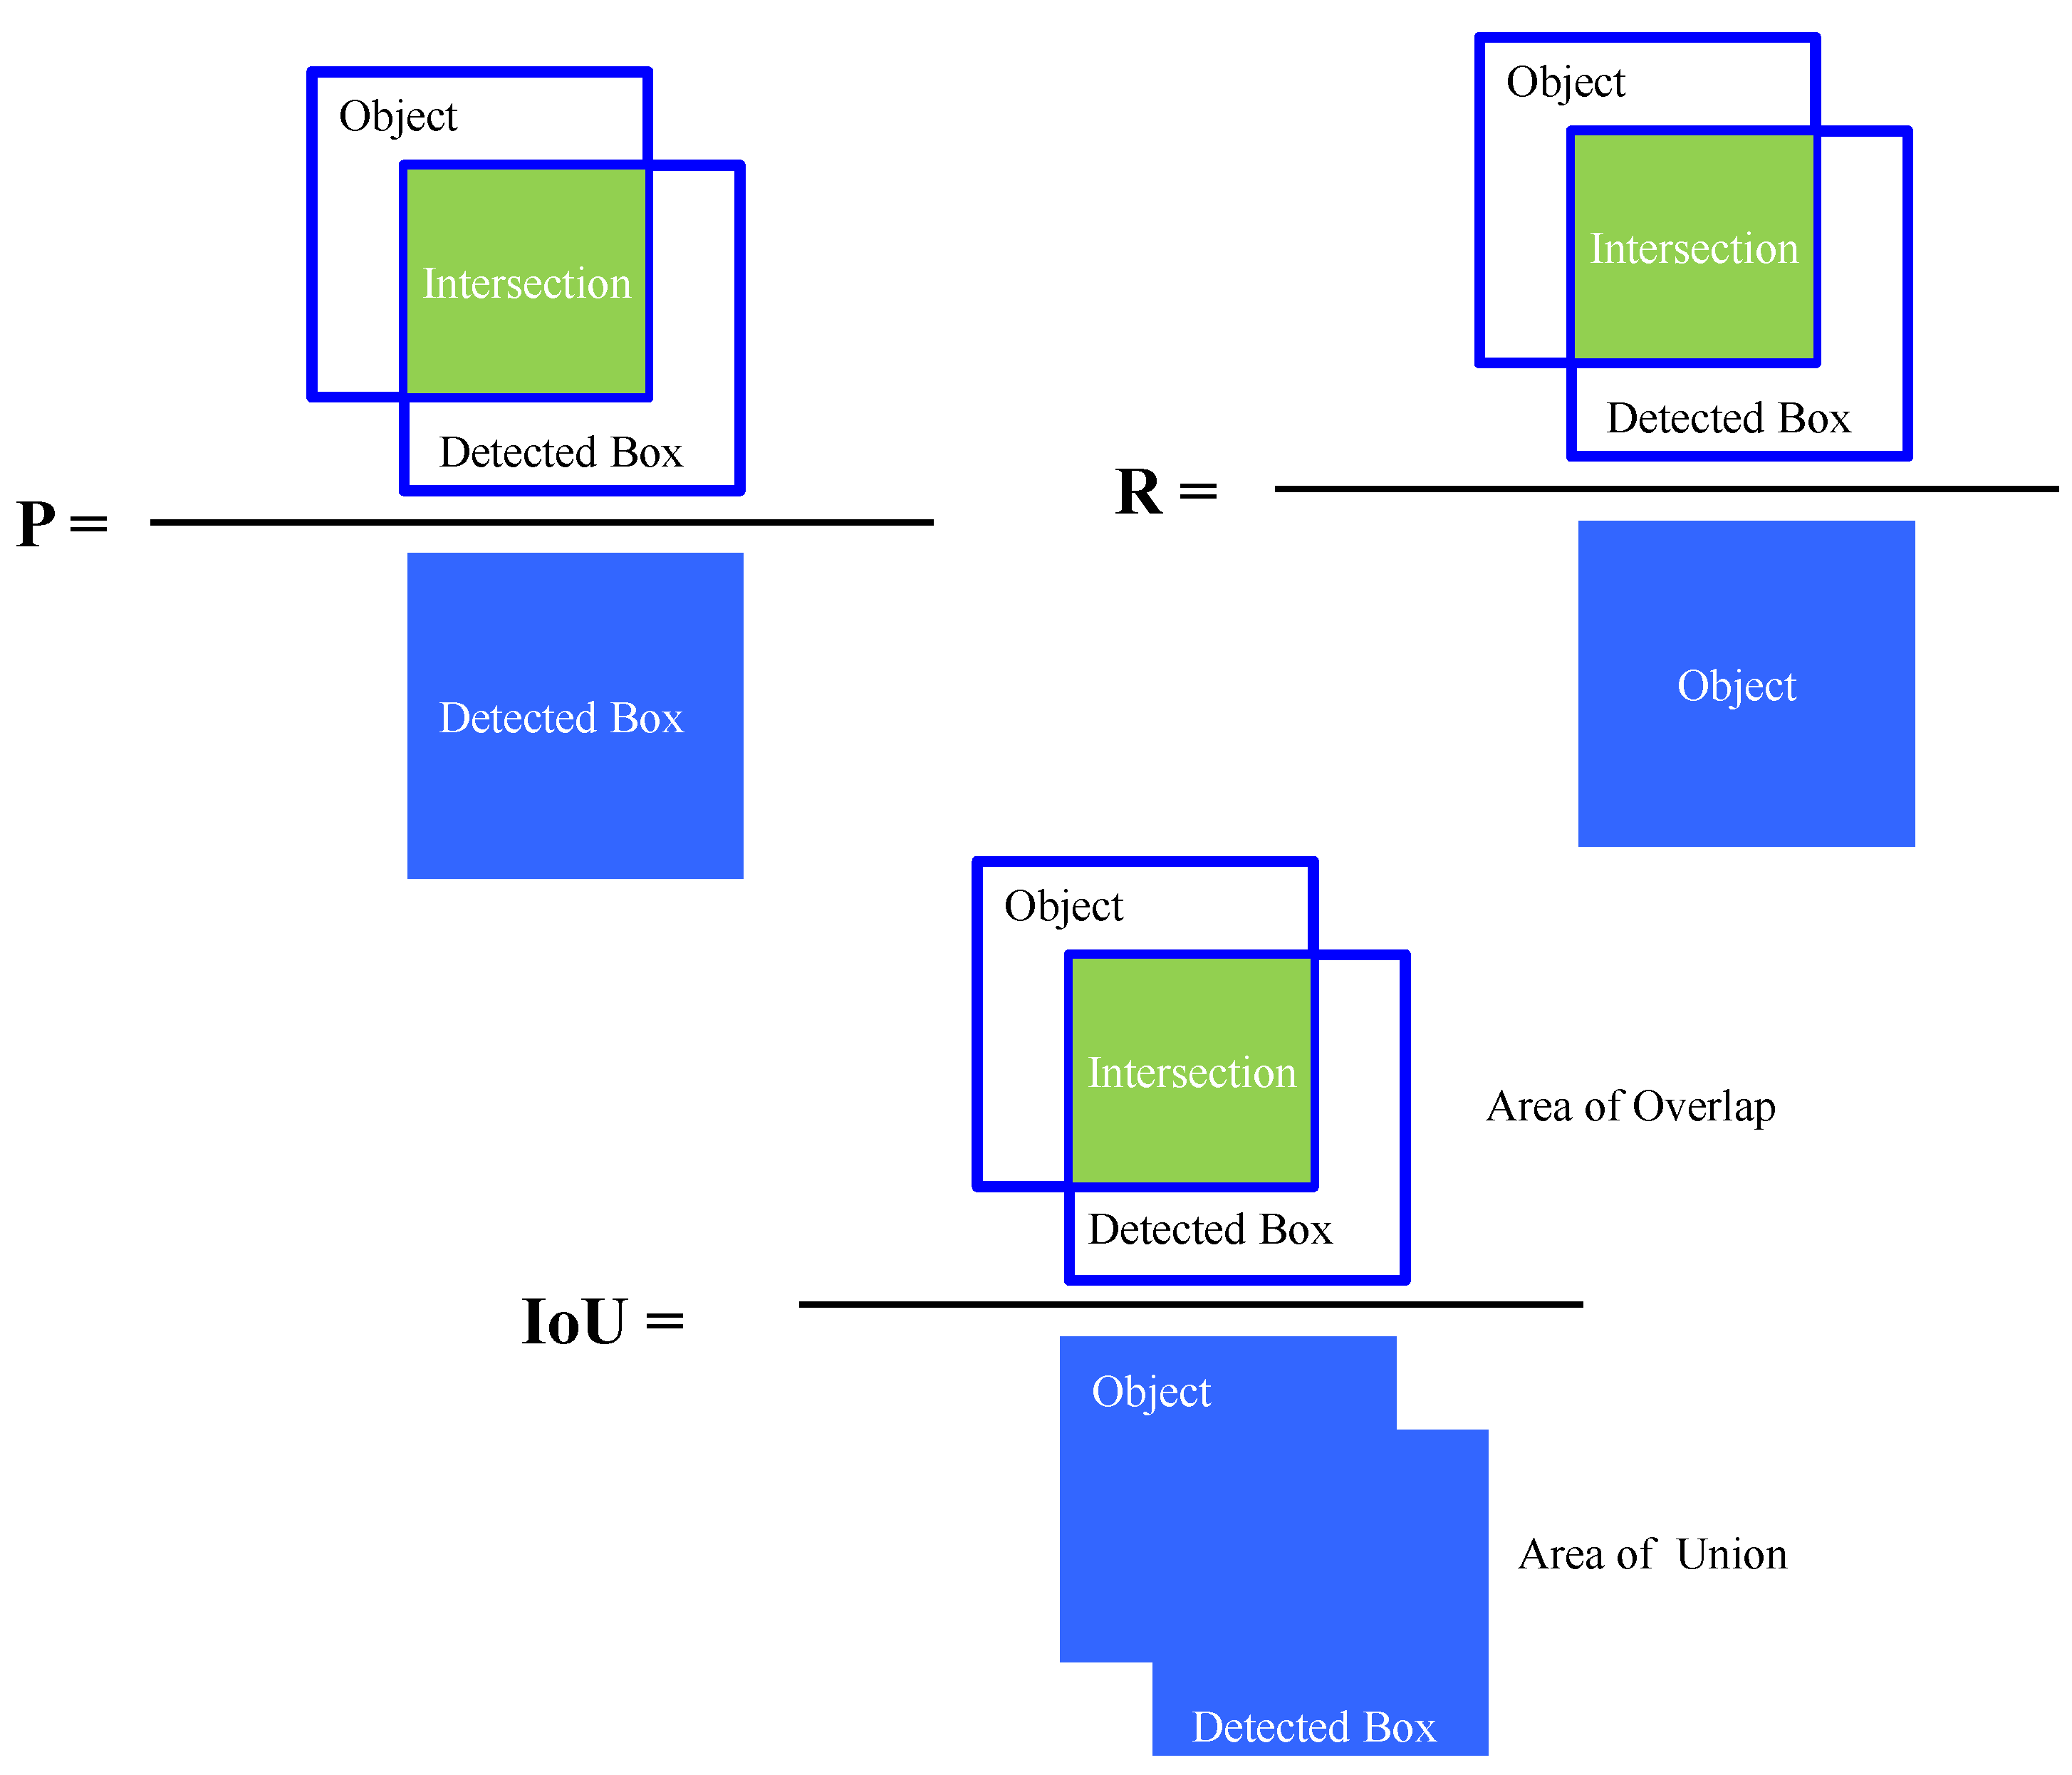
3. Performance Matrices of the Detection Model

In deep learning-based object detection models, some important statistical measures of matrices, including intersection over union ( I o U ), precision (P) recall (R), F-1 score, average precision (AP), and mean average precision (mAP), are generally used to evaluate the performance of the model. In YOLOv4, a scale-invariant evaluation metric I o U is a standard measure to define the accuracy of target object detection. I o U calculates the efficiency and performance of the given model by measuring the overlap area ratio between the bounding box prediction from the model and the true bounding area of the object, which can be expressed as
I o U = A o v e r l a p A u n i o n
where A o v e r l a p is defined as the intersection area between the bounding box prediction from the model and true bounding box of the object as shown in Figure 4. However, A u n i o n is the union area of aforementioned bounding boxes. For binary classification, if I o U is greater than 0.5, the classified object class can be defined as true positive (TP). For I o U below 0.5, corresponding class can be labeled as false positive (FP). From the definition of TP, FP, and FN, the performance parameters P and R can be expressed as follows
P = T P ( T P + F P ) ; R = T P ( T P + F N )
From Equation (3), one can conclude that higher P represents stronger capability of models to distinguish negative datasets, whereas higher R refers to stronger detection capability for positive datasets. In order to obtain the degree of precision of the test accuracy, F1 score can be defined from Equation (3) as follows:
F 1 = 2 P R ( P + R ) .
The F1 score is an evaluated indicator to integrate the mean of the precision and the recall, which could reconcile the precision and recall of the model. A higher F1 score indicates that the model is more robust. In a general sense, AP is equal to the area under a P R -curve, which can be expressed as
A P = 0 1 P ( R ) d R .
A higher AP corresponds to a larger area under the PR curve, indicating better accuracy of predicting a object class, whereas mAP is the average of all APs, which can be expressed as
m A P = 1 N i = 1 N A P i .
In the dense object detection models, bounding box regression is a popular approach to predict the localization boxes on the input images. In the proposed model, complete IoU (CIoU) [57] has been utilized to achieve better accuracy and speed of convergency for the target bounding box prediction process. CIoU loss has been formulated incorporating consistency of aspect ratio parameter v and a positive trade off parameter α , which can be expressed as:
L C I o U = 1 I o U + ρ 2 ( b , b gt ) c 2 + α v .
v = 4 π 2 t a n 1 w g t h g t t a n 1 w h 2 ; α = v ( 1 I o U ) + v
where w g t , w and h g t , h are the widths and heights of ground truth bounding box and prediction bounding box, respectively, as shown in Figure 5.

4. Result and Discussion

In order to develop a real-time high-performance disease detection model on a single GPU, an improved version of state-of-art YOLOv4 algorithm has been considered. Initially, a total of 600 original images consisting of 200 images from each of the two apple diseases (i.e., scab and rust) and 200 images containing both scab and rust have been collected from the publicly available Kaggle PlantPathology Apple Dataset [58] to construct the single dataset. Utilizing different image augmentation procedures, the single dataset has been expanded tenfold to obtain the custom dataset for this study (see Table 1). For image annotation of target classes in the custom dataset, a Python-based open-source script LabelImg [59] has been used, which saves the annotations as XML files and organizes them into PASCAL VOC format. Each XML contains the information of the target class and corresponding bounding coordinate during annotation for images in the training dataset.
From the custom dataset, a total of 3600, 1200, and 1200 were randomly selected for constructing training, validation, and test sets, respectively. The experiments were performed on the local system. The local computing resources and deep neural network (DNN) environment specifications are detailed in Table 2. To obtain better accuracy of the proposed detection model for different growth phases of apple, inputted dataset images of size 512 × 512 were considered. The initial configuration parameters (i.e., initial learning rate, number of channels, momentum value, decay regularization, etc.) were kept the same as the original parameters in the YOLOV4 model. The primary initial configuration parameters corresponding to the improved YOLOV4 model are presented in Table 3.

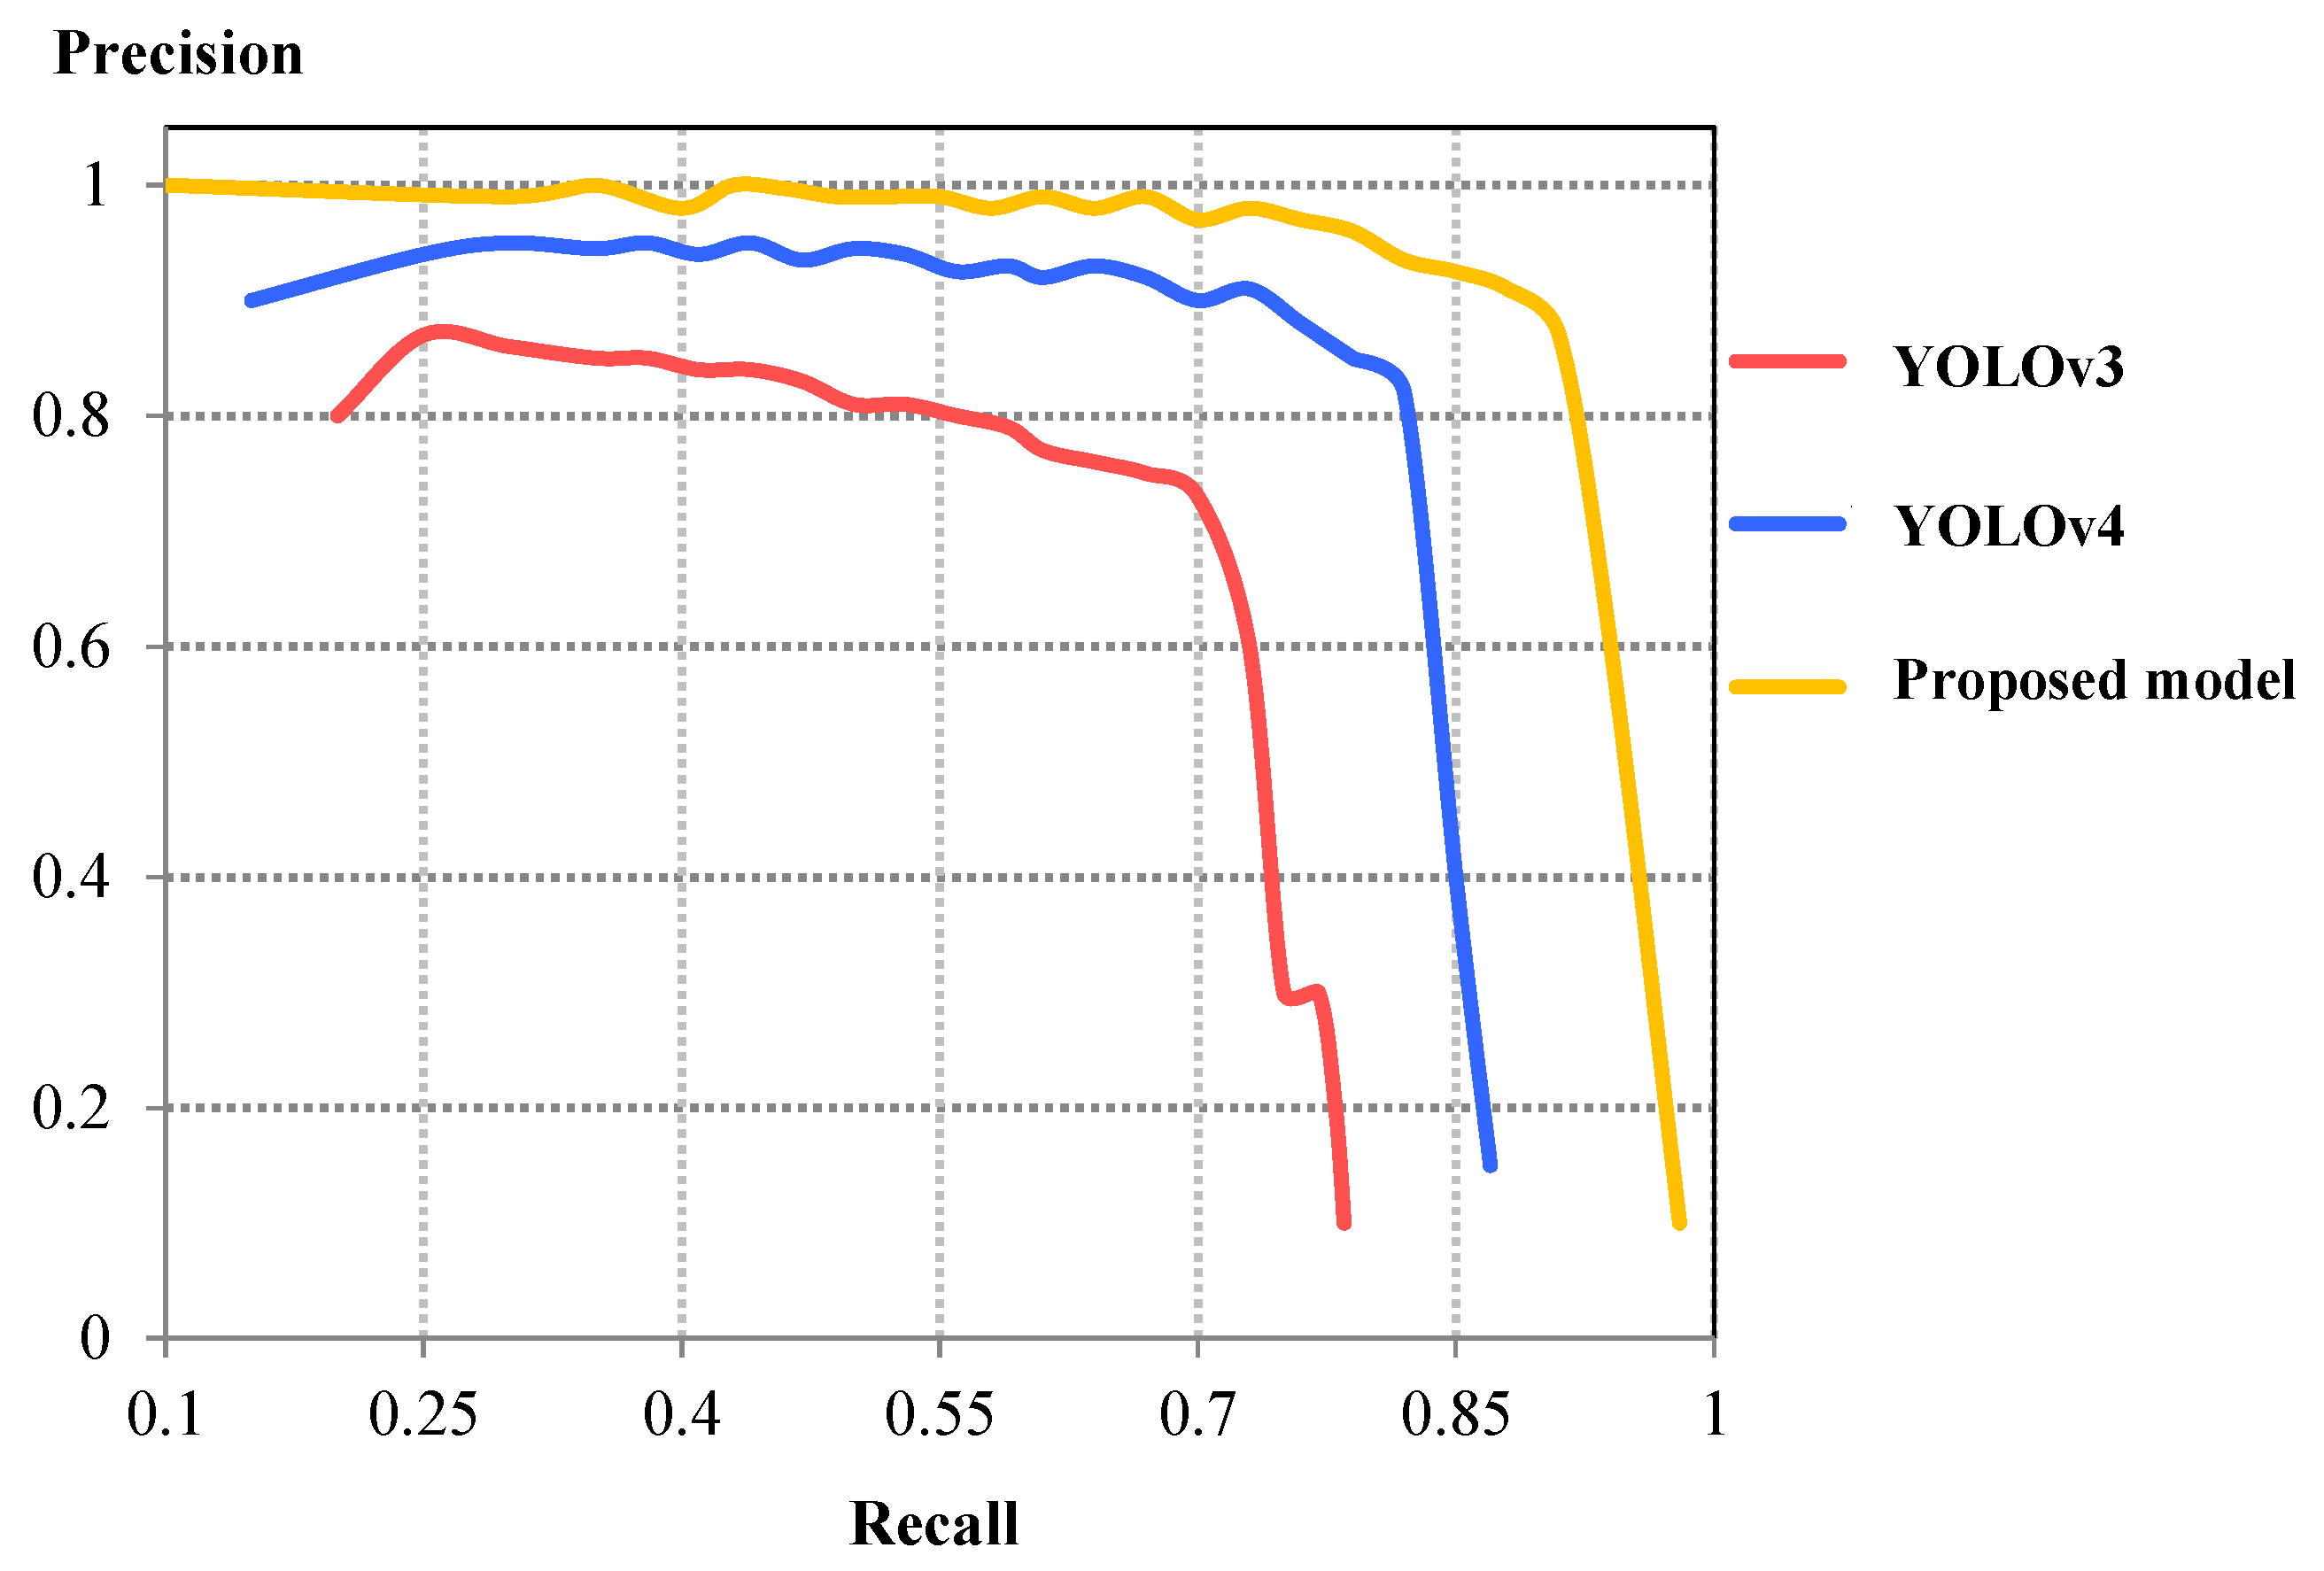
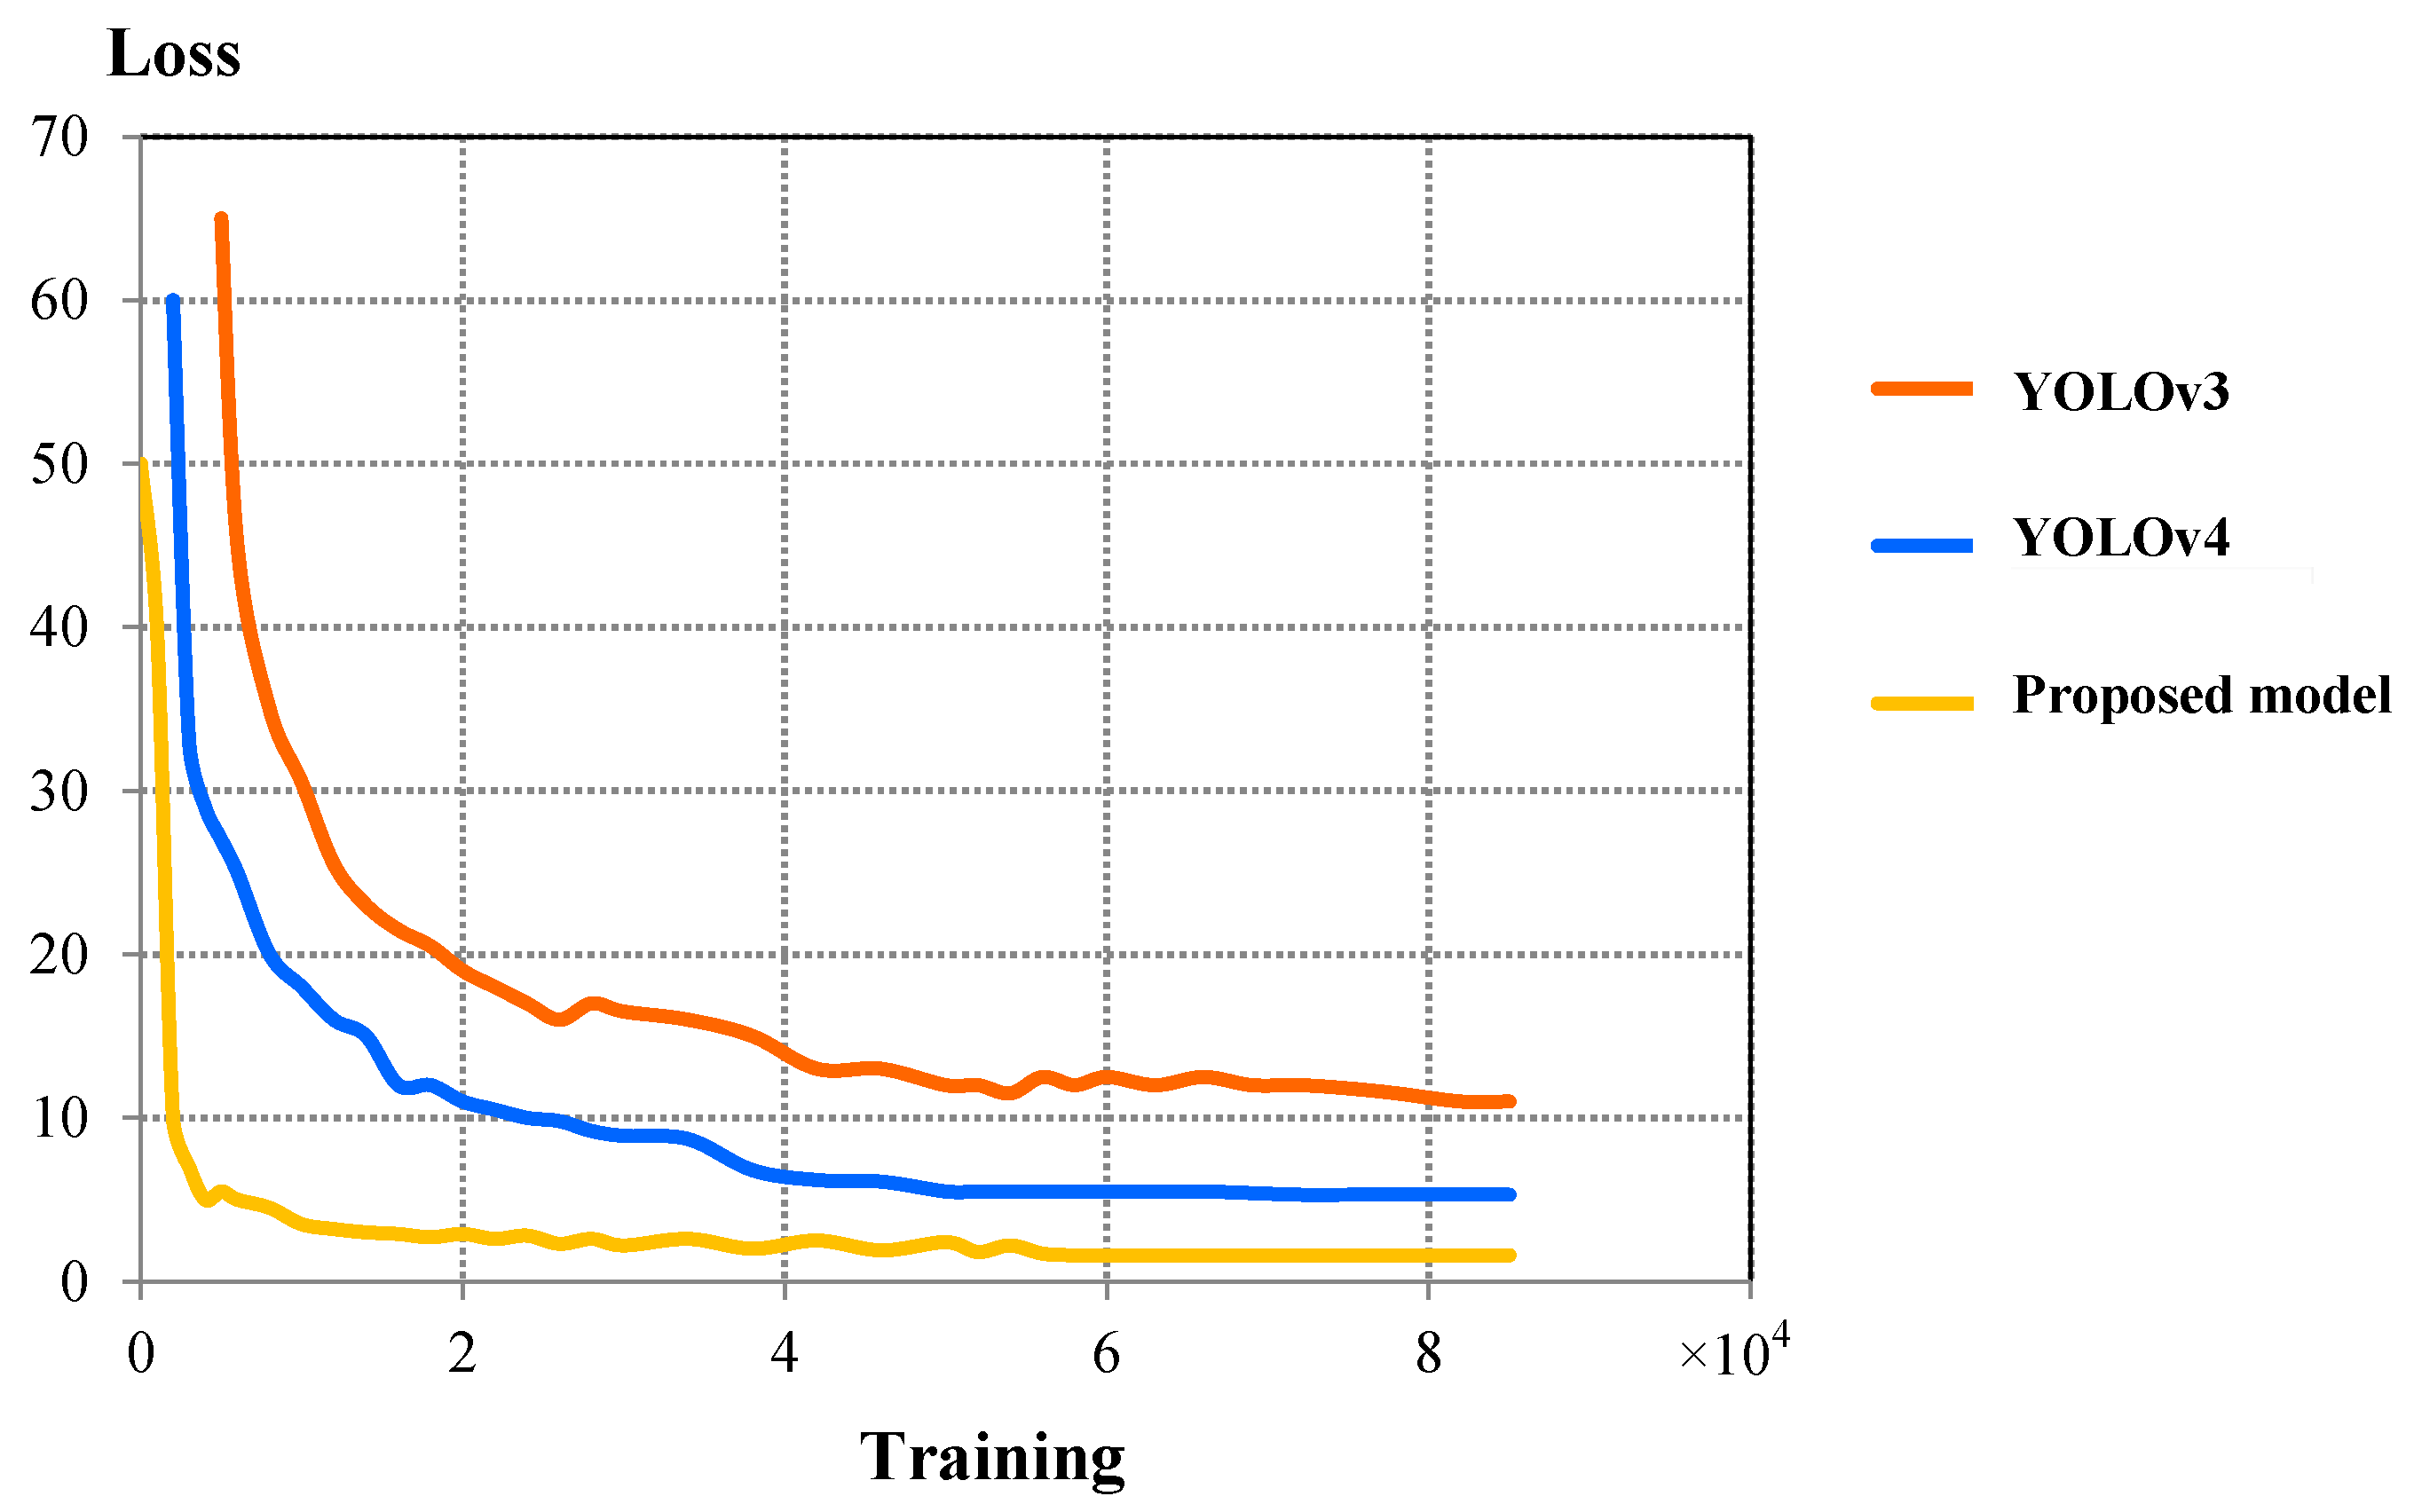
4.1. Overall Performance of the Proposed Detection Model

In order to compare the overall performances of the proposed detection model, the values of IoU, F1-score, mAP, final validation loss, and average detection time were compared with YOLOv3 and YOLOv4 as shown in Table 4. Comparing IoU, it was found that the proposed model attained the highest IoU value of 0.922, which is 6.1 % over the original YOLOv4 model. Thus, the proposed detection model has better accuracy of detecting bounding boxes compared to the other two models. The model demonstrated better efficiency and accuracy in detection performance with an F1 score of 0.959 and mAP of 0.912, which are 7.6 % and 7.3 % improvement from YOLOv4.
Furthermore, the average detection time has been compared between these three models, which indicates that the YOLOv4 has the lowest detection time of 15.301 ms (or speed of 65.22 FPS). The detection time of the proposed model was found to be higher than the YOLOv4 model with a detection time of 17.577 ms (or 56.89 FPS). Nevertheless, it can still provide the real-time detection of high-resolution images with better accuracy and confidence compared to the other two models.
The comparison of precision–recall (PR) curves between these three models is shown in Figure 6. By comparing the characteristics of PR curves, one can conclude that the precision value from the proposed model is higher for a particular recall when the area under the PR curve is the highest between all three models. This indicates that the current model demonstrates better detection accuracy compared to YOLOv3 and YOLOv4.
Figure 7 compares the validation loss curves between three models. At the initial phase, the loss began to decrease significantly after approximately 20,000 training steps in YOLOv4, whereas, for the proposed model, the loss reduction occurred after approximately 5000 training steps, indicating better convergence characteristics compared to YOLOv4. After exhibiting several cycles of fluctuation in the loss curve, loss began to saturate after approximately 60000 training steps with a final loss value of 1.65, whereas the final loss valuess in the YOLOv3 and YOLOv4 were 11.12 and 4.31, respectively, as shown in Table 4. Clearly, the proposed model has a faster convergence rate and better convergence characteristics compared to the original YOLOV4 model, which indicates superior performance and detection accuracy in the proposed model. Detailed detection results containing TP, FP, and FN for each class and corresponding precision, recall, and F-1 score are presented in Table 5. The proposed model has demonstrated relatively higher precision and recall in rust, namely 94.37 % and 98.41 % , respectively. Overall, the proposed model attained 93.91 % precision and 98.14 % recall, which are increased by 9.05 % and 5.91 % from the original YOLOv4, respectively. In comparison to other models, one can see that the proposed model maximizes the TP value, while FP and FN reach minimum compared to YOLOv3 and YOLOv4 for all classes. For example, TP increases from 2944 to 3272; FP and FN decrease from 525 to 212 and 248 to 62, respectively, from YOLOv4, as shown in Table 5. Thus, the proposed model significantly improves the overall precision, recall, and F-1 score of the test dataset compared to YOLOv3 and YOLOv4 detection models. Thus, it is evident from the aforementioned comparison that the proposed object detection model can significantly outperform YOLOv3 and YOLOv4 in terms of precision and accuracy, slightly compromising the detection speed. Thus, it can be concluded that the performance and the accuracy of the proposed model have been significantly improved.

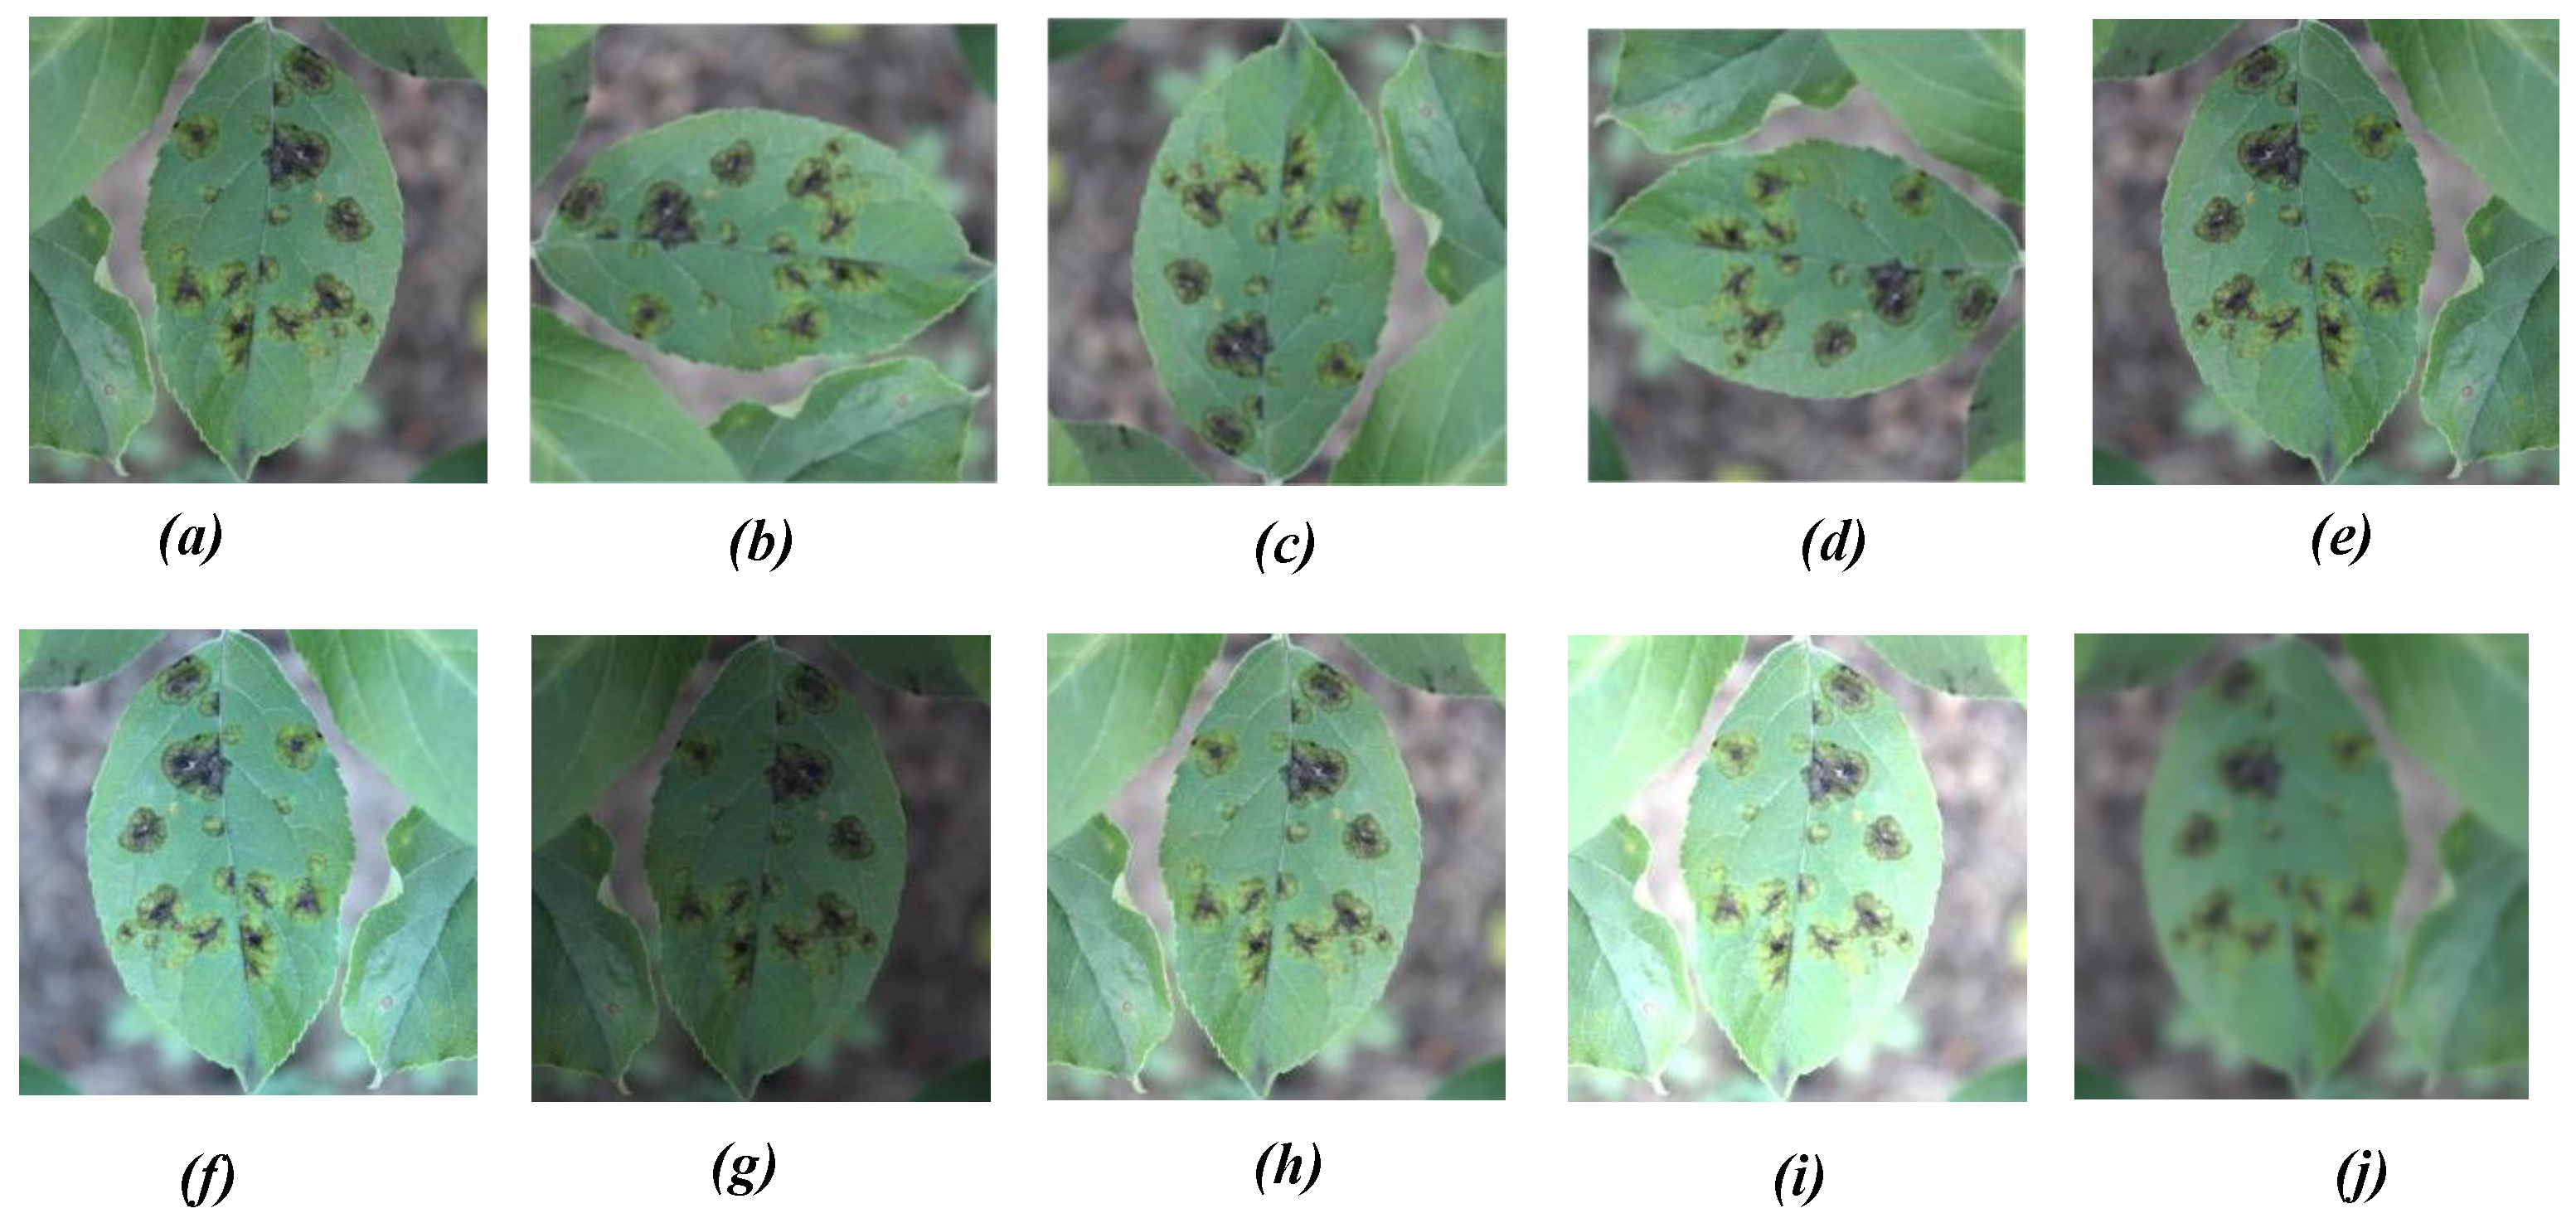
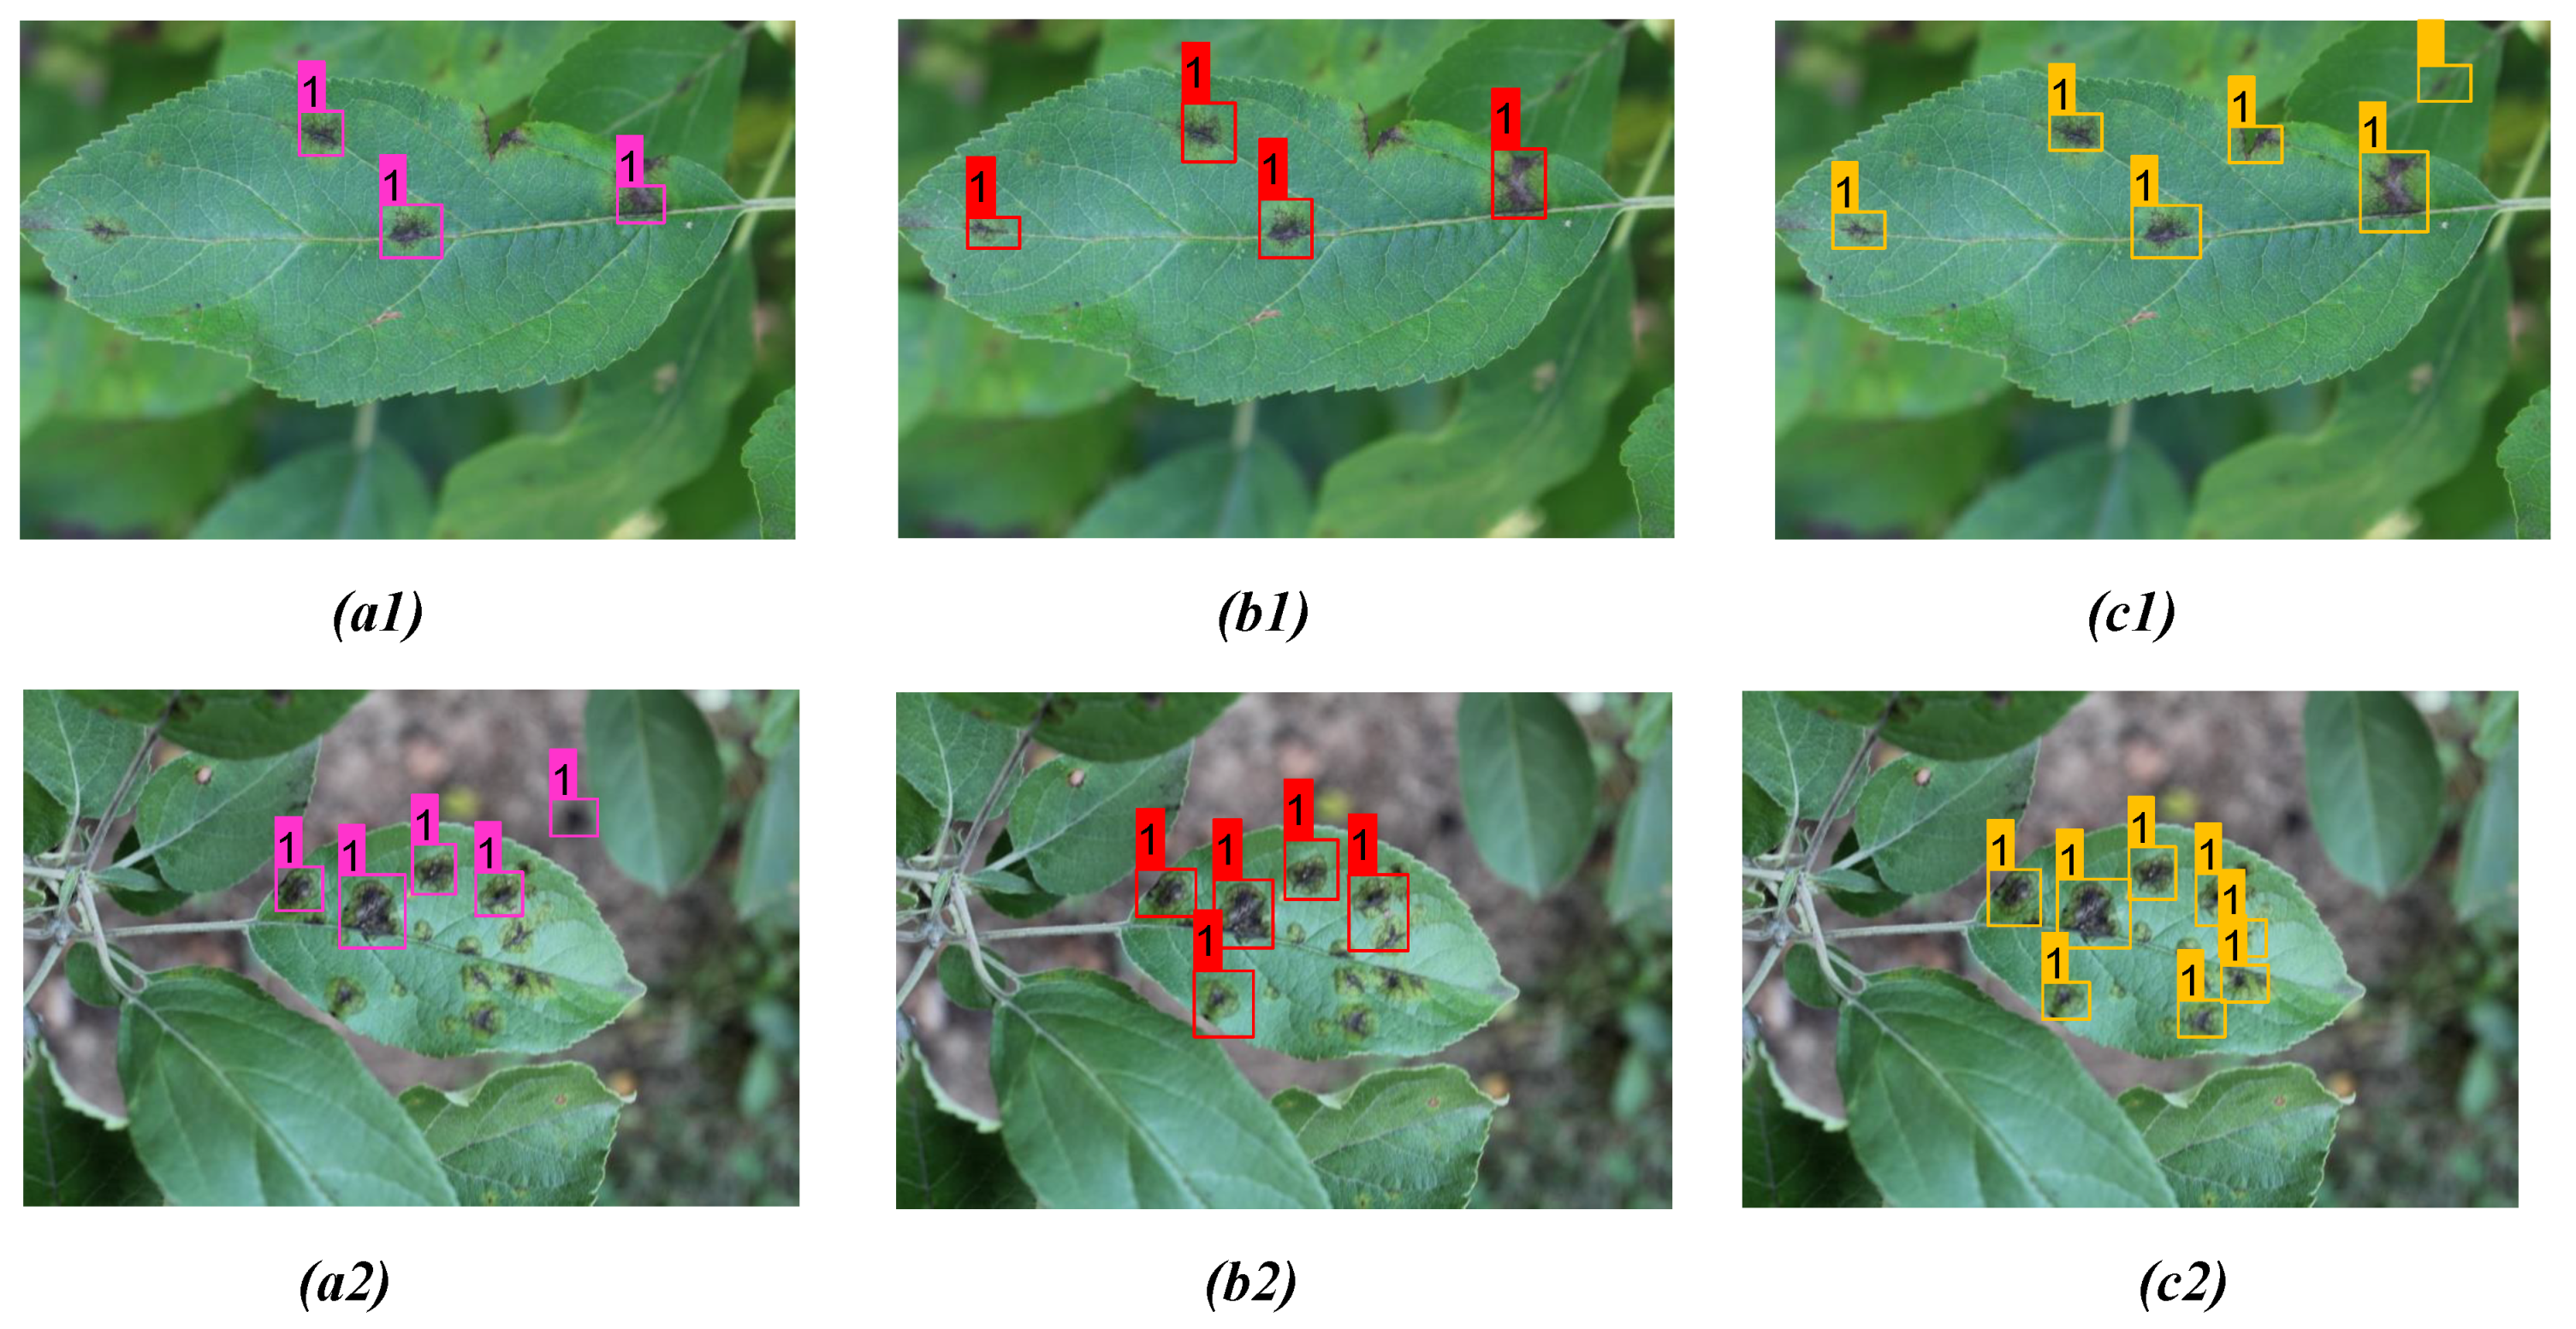
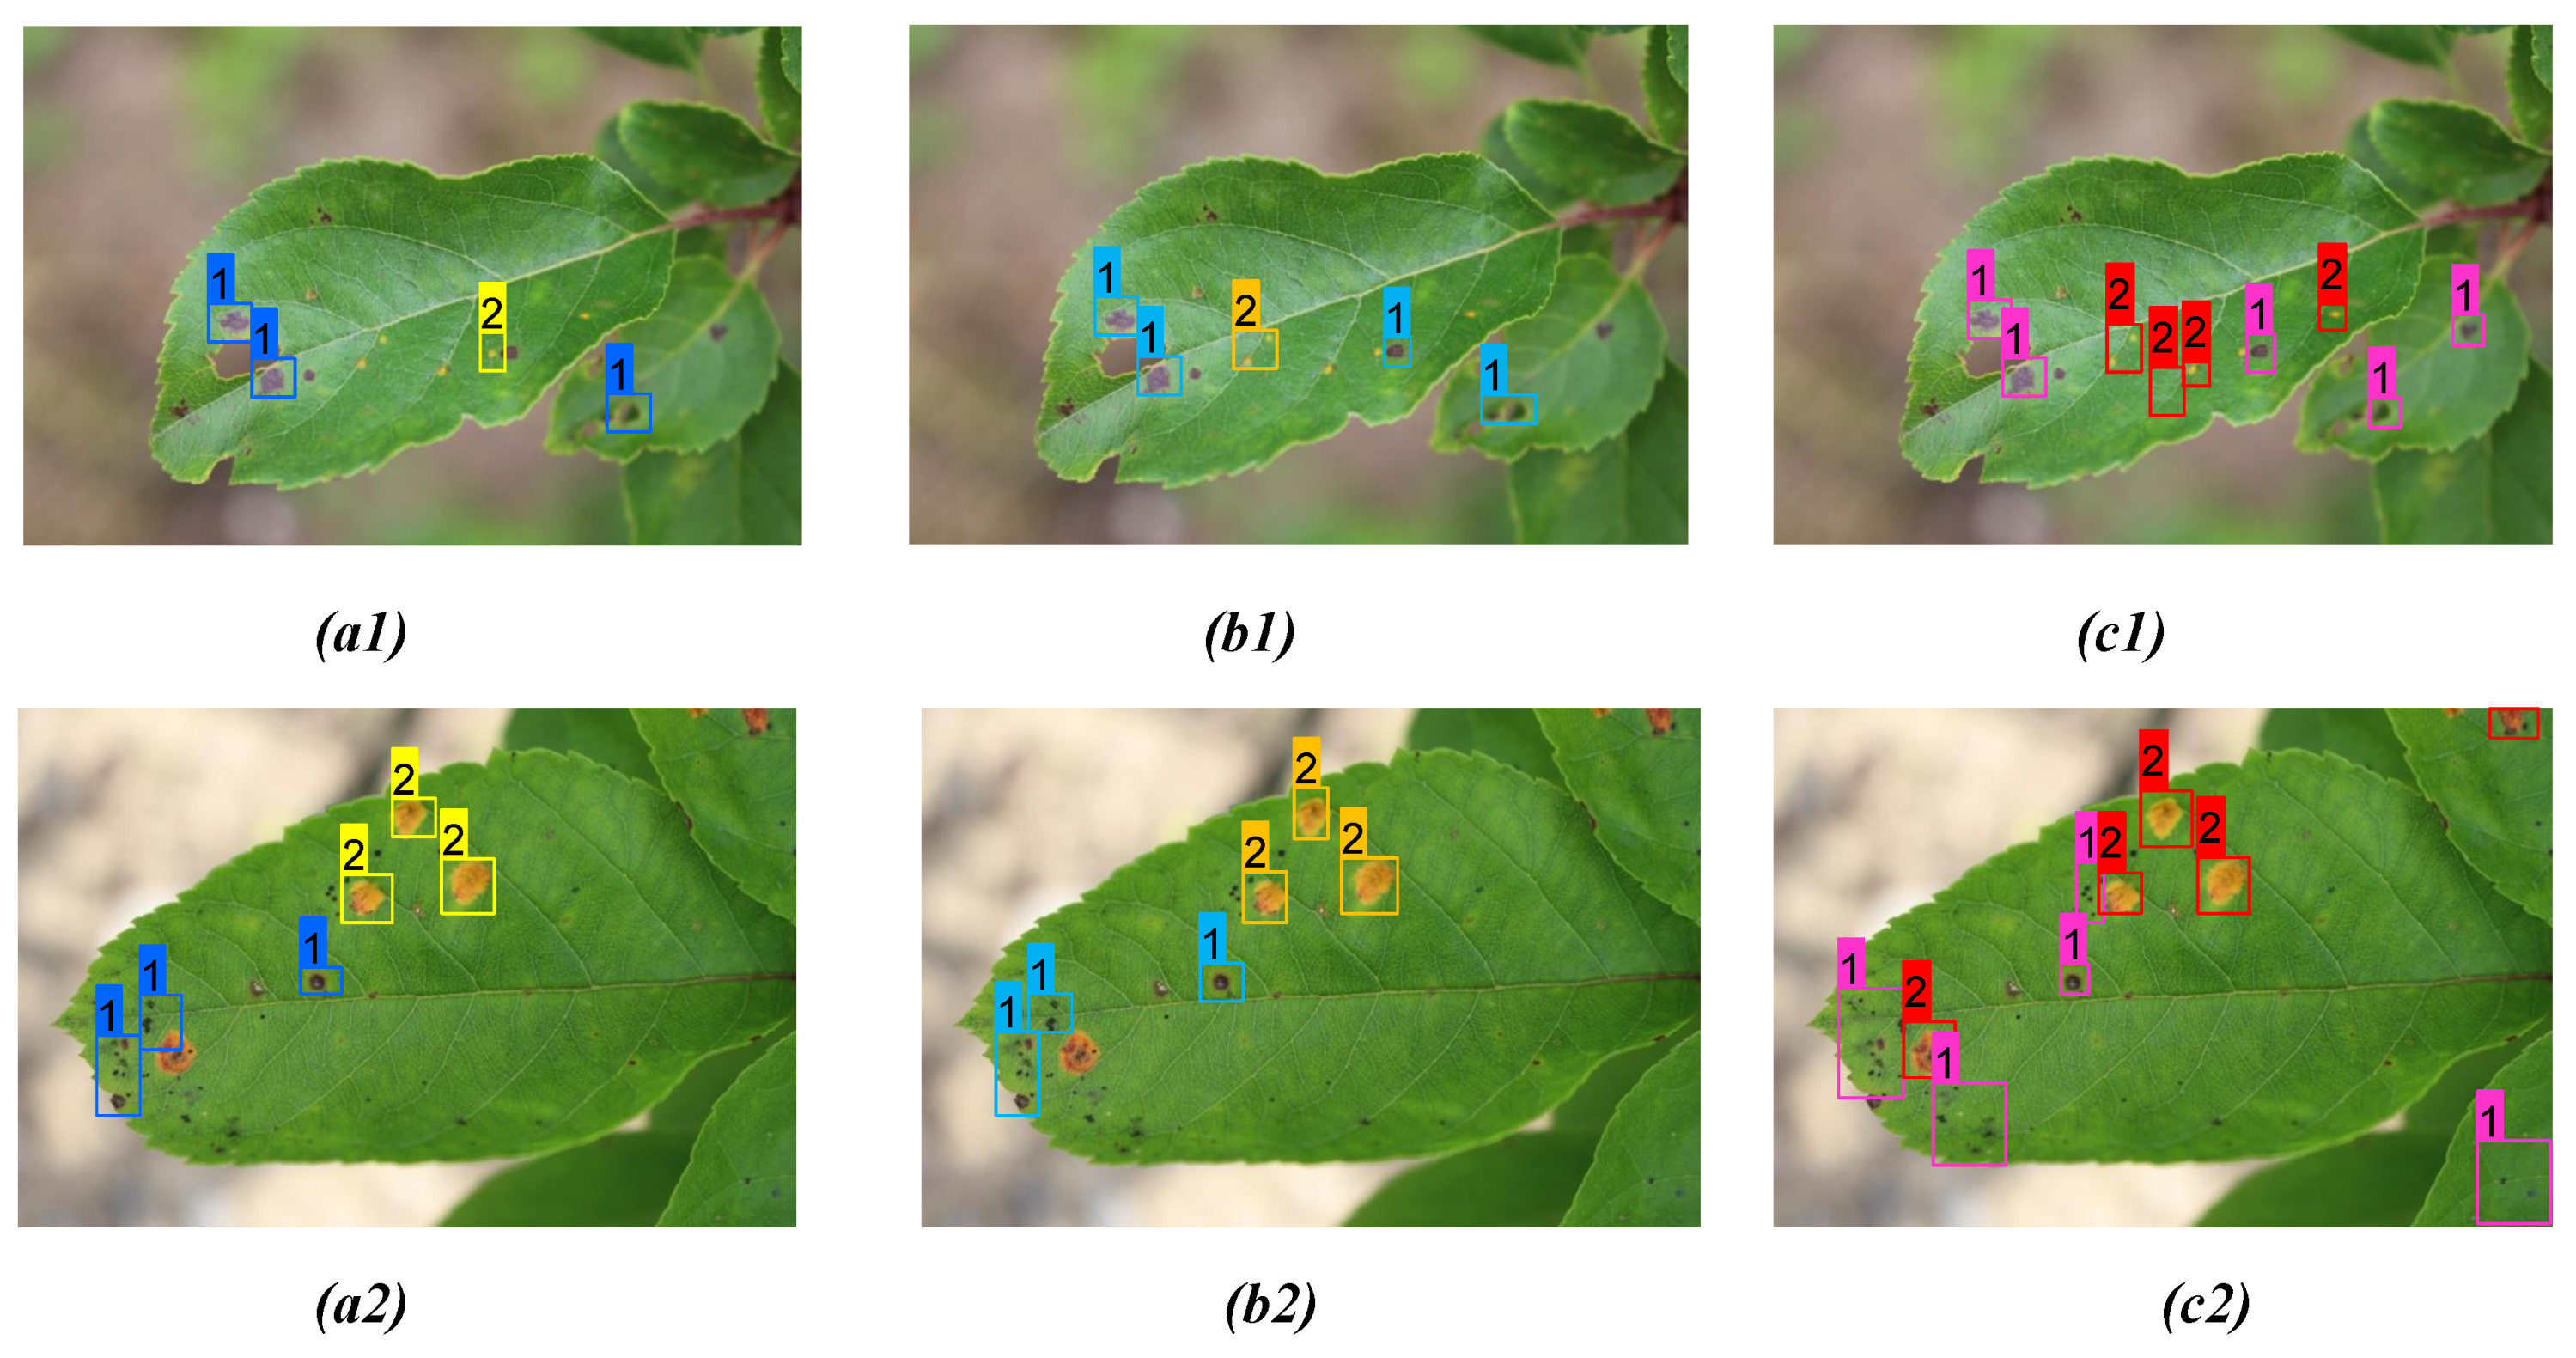
4.2. Detection Results for Different Plant Disease Class

The detection results from the proposed model for two distinct diseases in the apple plant considering two different infected leaves belonging to each of the disease classes were considered and compared with YOLOv3 and YOLOv4 models, as shown in Figure 8 and Figure 9. For better clarity of the bounding boxes, two different diseases, scab and rust, were marked with corresponding bounding box class identifiers: 1 and 2, respectively. Corresponding detection results consisting of detected (detec.), undetected (undetec.), and missdetected (misdetc.) diseases for each of the leaves are detailed and compared between these three models in Table 6, Table 7 and Table 8. From the detection result, one can see that the bounding box prediction from the proposed model is more accurate compared to YOLOv3 and YOLOv4 detection models for all disease classes.
Scab detection: Scab lesions in leaves are roughly elliptical with feathery edges and have an olive green-to-black color. They are preferably distributed as the discreet form of patches, as shown in Figure 8. Due to erratic growth patterns and often high aspect ratio of the patch size, it is a challenging task to detect each of the spots individually. In the first test case, a relatively less dense discreet distribution of scab has been considered. For such a case, all three models work relatively well; however, the proposed model showed superior performance by correctly identifying all scab spots, while YOLOv3 and YOLOv4 had three and two undetected spots, respectively, as shown in Figure 8(a1–c1). For a more challenging case, a highly dense scab-infected sample was considered with a complex background of soil and leaves; the detection results from the proposed model indicate a significant improvement of detection accuracy and reduction of several undetected disease spots compared to the other two models, as shown in Figure 8(a2–c2). Overall, the proposed model demonstrates a reduced number of undetected scab spots compared to YOLOv3 and YOLOv4 as shown in Table 6.
Rust detection: The infections with rust usually first appear as small pale yellow spots on the upper surfaces of the leaf. They can rapidly extend to the whole surface of the leaf with dense distribution of spots. Due to the fine-grained nature and similarity of texture with the complex background, it is often hard to detect each of these affected areas precisely. In the first test case, a relatively less dense, fine-grained discreet distribution of rust has been considered. While the detection results from YOLOv3 and YOLOv4 indicate several missed detections for the fine-grained diseases spots, the proposed model demonstrated superior performance, in particular, by identifying fine-grained infected zones without any undetected spots, as shown in Figure 9(a1–c1), whereas there are five and three undetected rust spots from YOLOv3 and YOLOv4, respectively, as shown in Table 7. In a more challenging scenario with the densely populated distribution of infected areas, there are several missed detections from YOLOv3 and YOLOv4, as shown in Figure 9(a2,b2). In such a critical scenario, the proposed model demonstrated better multiscale disease detection capability compared to the other two models with higher confidence scores in bounding box prediction and a significant reduction in missed detection (see Table 7).
Multi-class disease detection: In this section, the proposed model has been tested for multi-class diseases detection where both scab and rust are present in the image. At first, we have considered a challenging case for the early disease phase where both diseases are of fine-grain nature. One can see that the proposed model has better accuracy of detecting multi-class fine-grained diseases spots compared to YOLOv3 and YOLOv4, as shown in Figure 10(a1–c1). In our second case, we have considered a multi-scale disease detection problem where the size of rust is relatively larger than the scab as shown in Figure 10(a2–c2). In such a challenging scenario, the proposed model demonstrated superior detection results and reduced missed detections to a great extent, as shown in Figure 10(c2). Moreover, it has higher confidence scores in bounding box prediction compared to the other two models, as shown in Table 8.
It can be concluded from our results that the proposed detection model has better capability and higher adaptability of disease detection in various environments compared to YOLOv3 and YOLOv4. The detection results demonstrate that the proposed detection model can provide high classification accuracy for multi-scale disease spot detection. Overall, it has a higher accuracy of detecting an object and can effectively avoid the problem of false detection and missing detection compared to the YOLOv3 and YOLOv4 models. The proposed model can be employed in real-life complex orchard scenarios for disease detection under various environmental conditions.

5. Conclusions

To summarize, in this study, a real-time object detection framework has been developed based on an improved YOLOv4 algorithm and applied to various plant disease detections in apple. The proposed model has been modified to optimize for accuracy and verified by detecting diseases under complex orchard scenarios. At a detection rate of 56.9 FPS, the proposed algorithm reached a mean average precision (mAP) value of 91.2 % , F1-score of 95.9 % . Compared to the original YOLOv4 model, the proposed model acquires 9.05 % increase in precision and 7.6 % increase in F1-score, indicating the potential of superior inspection performance in the real-time in-field application. The current work provides an effective and efficient method of detecting different plant diseases under complex scenarios and can be extended to different fruit and crop detection, generic disease detection, and automated agricultural detection processes.

Author Contributions

A.M.R.—Conceptualization; Data curation; Formal analysis; Investigation; Methodology; Software; Validation; Visualization; Roles/Writing—original draft. J.B.—Data collection; Data curation; Investigation; Writing—review, and editing; Funding acquisition; Project Administration. All authors have read and agreed to the published version of the manuscript.

Funding

This research was funded by Capacloud AI (Grant No. CC-0963E) and the APC was funded by MDPI AG.

Institutional Review Board Statement

Not applicable.

Informed Consent Statement

Not applicable.

Data Availability Statement

The data that support the findings of this study are available from from J. Bhaduri ([email protected]) upon reasonable request.

Acknowledgments

The support of Capacloud AI for providing computational resources is gratefully acknowledged.

Conflicts of Interest

The authors declare no competing interests.

References

  1. Tyagi, A.C. Towards a second green revolution. Irrig. Drain. 2016, 65, 388–389. [Google Scholar] [CrossRef]
  2. Vougioukas, S.G. Agricultural robotics. Annu. Rev. Control Robot. Auton. Syst. 2019, 2, 365–392. [Google Scholar] [CrossRef]
  3. Wang, Q.; Nuske, S.; Bergerman, M.; Singh, S. Automated crop yield estimation for apple orchards. Exp. Robot. 2013, 88, 745–758. [Google Scholar]
  4. Basnet, B.; Bang, J. The state-of-the-art of knowledge-intensive agriculture: A review on applied sensing systems and data analytics. J. Sens. 2018, 2018, 3528296. [Google Scholar]
  5. Fu, L.; Gao, F.; Wu, J.; Li, R.; Karkee, M.; Zhang, Q. Application of consumer RGB-D cameras for fruit detection and localization in field: A critical review. Comput. Electron. Agric. 2020, 177, 105687. [Google Scholar] [CrossRef]
  6. SepuLveda, D.; Fernández, R.; Navas, E.; Armada, M.; González-De-Santos, P. Robotic aubergine harvesting using dual-arm manipulation. IEEE Access 2020, 8, 121889–121904. [Google Scholar] [CrossRef]
  7. Peltoniemi, J.I.; Gritsevich, M.; Puttonen, E. Reflectance and polarization characteristics of various vegetation types. In Light Scattering Reviews; Springer: Berlin/Heidelberg, Germany, 2015; Volume 9, pp. 257–294. [Google Scholar]
  8. Zhao, Y.; Gong, L.; Huang, Y.; Liu, C. A review of key techniques of vision-based control for harvesting robot. Comput. Electron. Agric. 2016, 127, 311–323. [Google Scholar] [CrossRef]
  9. Shamshiri, R.; Redmond, C.W.; Hameed, I.A.; Yule, I.J.; Grift, T.E.; Balasundram, S.K.; Pitonakova, L.; Ahmad, D.; Chowdhary, G. Research and development in agricultural robotics: A perspective of digital farming. Int. J. Agric. Biol. Eng. 2018, 11, 1–14. [Google Scholar] [CrossRef]
  10. Tang, Y.C.; Wang, C.; Luo, L.; Zou, X. Recognition and localization methods for vision-based fruit picking robots: A review. Front. Plant Sci. 2020, 11, 510. [Google Scholar] [CrossRef]
  11. Ling, X.; Zhao, Y.; Gong, L.; Liu, C.; Wang, T. Dual-arm cooperation and implementing for robotic harvesting tomato using binocular vision. Robot. Auton. Syst. 2019, 114, 134–143. [Google Scholar] [CrossRef]
  12. Qin, F.; Liu, D.; Sun, B.; Ruan, L.; Ma, Z.; Wang, H. Identification of alfalfa leaf diseases using image recognition technology. PLoS ONE 2016, 11, e0168274. [Google Scholar] [CrossRef] [Green Version]
  13. Chuanlei, Z.; Shanwen, Z.; Jucheng, Y.; Yancui, S.; Jia, C. Apple leaf disease identification using genetic algorithm and correlation based feature selection method. Int. J. Agric. Biol. Eng. 2017, 10, 74–83. [Google Scholar]
  14. Al Bashish, D.; Braik, M.; Bani-Ahmad, S. Detection and classification of leaf diseases using k-means-based segmentation and neural networks-based classification. Inf. Technol. J. 2011, 10, 267–275. [Google Scholar] [CrossRef] [Green Version]
  15. Dhaygude, S.B.; Kumbhar, N.P. Agricultural plant leaf disease detection using image processing. Int. J. Adv. Res. Elect. 2013, 2, 599–602. [Google Scholar]
  16. Rajan, P.; Radhakrishnan, B.; Suresh, L.P. Detection and classification of pests from crop images using support vector machine. In Proceedings of the 2016 International Conference on Emerging Technological Trends (ICETT), Kollam, India, 21–22 October 2016; pp. 1–6. [Google Scholar]
  17. Rumpf, T.; Mahlein, A.-K.; Steiner, U.; Oerke, E.-C.; Dehne, H.-W.; Plümer, L. Early detection and classification of plant diseases with support vector machines based on hyperspectral rectance. Comput. Electron. Agric. 2010, 74, 91–99. [Google Scholar] [CrossRef]
  18. Islam, M.; Dinh, A.; Wahid, K.; Bhowmik, P. Detection of potato diseases using image segmentation and multiclass support vector machine. In Proceedings of the 2017 IEEE 30th Canadian Conference on Electrical and Computer Engineering (CCECE), Windsor, ON, Canada, 30 April–3 May 2017; pp. 1–4. [Google Scholar]
  19. Wu, C.; Luo, C.; Xiong, N.; Zhang, W.; Kim, T. A greedy deep learning method for medical disease analysis. IEEE Access 2018, 6, 20021–20030. [Google Scholar] [CrossRef]
  20. Lu, H.; Li, Y.; Chen, M.; Kim, H.; Serikawa, S. Brain intelligence: Go beyond artificial intelligence. Mob. Netw. Appl. 2018, 23, 368–375. [Google Scholar] [CrossRef] [Green Version]
  21. Li, J.; Wang, N.; Wang, Z.-H.; Li, H.; Chang, C.-C.; Wang, H. New secret sharing scheme based on faster R-CNNs image retrieval. IEEE Access 2018, 6, 49348–49357. [Google Scholar] [CrossRef]
  22. Kamilaris, A.; Prenafeta-Boldú, F.X. Deep learning in agriculture: A survey. Comput. Electron. Agric. 2018, 147, 70–90. [Google Scholar] [CrossRef] [Green Version]
  23. Lee, S.H.; Chan, C.S.; Mayo, S.J.; Remagnino, P. How deep learning extracts and learns leaf features for plant classification. Pattern Recogn. 2017, 71, 1–13. [Google Scholar] [CrossRef] [Green Version]
  24. Zhang, Y.D.; Dong, Z.; Chen, X.; Jia, W.; Du, S.; Muhammad, K.; Wang, S.H. Image based fruit category classification by 13-layer deep convolutional neural network and data augmentation. Multimed. Tools Appl. 2017, 78, 3613–3632. [Google Scholar] [CrossRef]
  25. Tang, J.L.; Wang, D.; Zhang, Z.G.; He, L.J.; Xin, J.; Xu, Y. Weed identification based on K-means feature learning combined with convolutional neural network. Comput. Electron. Agric. 2017, 135, 63–70. [Google Scholar] [CrossRef]
  26. Arribas, J.I.; Sánchez-Ferrero, G.V.; Ruiz-Ruiz, G.; Gómez-Gil, J. Leaf classification in sunflower crops by computer vision and neural networks. Comput. Electron. Agric. 2011, 78, 9–18. [Google Scholar] [CrossRef]
  27. Dias, P.A.; Tabb, A.; Medeiros, H. Apple flower detection using deep convolutional networks. Comput. Ind. 2018, 99, 17–28. [Google Scholar] [CrossRef] [Green Version]
  28. Yamamoto, K.; Guo, W.; Yoshioka, Y.; Ninomiya, S. On plant detection of intact tomato fruits using image analysis and machine learning methods. Sensors 2014, 14, 12191–12206. [Google Scholar] [CrossRef] [Green Version]
  29. Caglayan, A.; Can, A.B. Volumetric object recognition using 3-D CNNs on depth data. IEEE Access 2018, 6, 20058–20066. [Google Scholar] [CrossRef]
  30. Lu, H.; Li, Y.; Uemura, T.; Kim, H.; Serikawa, S. Low illumination underwater light field images reconstruction using deep convolutional neural networks. Future Gener. Comput. Syst. 2018, 82, 142–148. [Google Scholar] [CrossRef]
  31. Fuentes, A.; Yoon, S.; Kim, S.C.; Park, D.S. A robust deep-learning-based detector for real-time tomato plant diseases and pests recognition. Sensors 2017, 17, 2022. [Google Scholar] [CrossRef] [Green Version]
  32. Fuentes, A.F.; Yoon, S.; Lee, J.; Park, D.S. High-performance deep neural network-based tomato plant diseases and pests diagnosis system with refinement filter bank. Front. Plant Sci. 2018, 9, 1162. [Google Scholar] [CrossRef] [Green Version]
  33. Fuentes, A.F.; Yoon, S.; Park, D.S. Deep learning-based phenotyping system with glocal description of plant anomalies and symptoms. Front. Plant Sci. 2019, 10, 1321. [Google Scholar] [CrossRef]
  34. Mohanty, S.P.; Hughes, D.P.; Salathé, M. Using deep learning for image-based plant disease detection. Front. Plant Sci. 2016, 7, 1419. [Google Scholar] [CrossRef] [PubMed] [Green Version]
  35. Lu, J.; Hu, J.; Zhao, G.; Mei, F.; Zhang, C. An in-field automatic wheat disease diagnosis system. Comput. Electron. Agric. 2017, 142, 369–379. [Google Scholar] [CrossRef] [Green Version]
  36. Lu, Y.; Yi, S.; Zeng, N.; Liu, Y.; Zhang, Y. Identification of Rice diseases using deep convolutional neural networks. Neurocomputing 2017, 267, 378–384. [Google Scholar] [CrossRef]
  37. Liu, B.; Zhang, Y.; He, D.J.; Li, Y. Identification of apple leaf diseases based on deep convolutional neural networks. Symmetry 2017, 10, 11. [Google Scholar] [CrossRef] [Green Version]
  38. Zhang, X.; Qiao, Y.; Meng, F.; Fan, C.; Zhang, M. Identification of maize leaf diseases using improved deep convolutional neural networks. IEEE Access 2018, 6, 30370–30377. [Google Scholar] [CrossRef]
  39. Lin, T.-Y.; Goyal, P.; Girshick, R.; He, K.; Dollár, P. Focal loss for dense object detection. In Proceedings of the IEEE International Conference on Computer Vision, Venice, Italy, 22–29 October 2017; pp. 2980–2988. [Google Scholar]
  40. Ross, G. Fast r-cnn. In Proceedings of the IEEE international Conference on Computer Vision, Santiago, Chile, 7–13 December 2015; pp. 1440–1448. [Google Scholar]
  41. Ren, S.; He, K.; Girshick, R.; Sun, J. Faster R-CNN: Towards Real-Time Object Detection with Region Proposal Networks. IEEE Trans. Pattern Anal. Mach. Intell. 2015, 39, 1137–1149. [Google Scholar] [CrossRef] [Green Version]
  42. Kaiming, H.; Georgia, G.; Piotr, D.; Ross, G. Mask r-cnn. In Proceedings of the IEEE International Conference on Computer Vision, Venice, Italy, 22–29 October 2017; pp. 2961–2969. [Google Scholar]
  43. Bargoti, S.; Underwood, J. Deep fruit detection in orchards. In Proceedings of the 2017 IEEE International Conference on Robotics and Automation (ICRA), Singapore, 29 May–3 June 2017; pp. 1–8. [Google Scholar]
  44. Inkyu, S.; Ge, Z.; Feras, D.; Ben, U.; Tristan, P.; Chris, M.C. DeepFruits: A fruit detection system using deep neural networks. Sensors 2016, 16, 1222. [Google Scholar]
  45. Simonyan, K.; Zisserman, A. Very deep convolutional networks for large-scale image recognition. arXiv 2014, arXiv:1409.1556. [Google Scholar]
  46. Redmon, J.; Divvala, S.; Girshick, R.; Farhadi, A. You only look once: Unified, realtime object detection. In Proceedings of the IEEE Conference on Computer Vision and Pattern Recognition, Las Vegas, NV, USA, 27–30 June 2016; pp. 779–788. [Google Scholar]
  47. Redmon, J.; Farhadi, A. YOLO9000: Better, faster, stronger. In Proceedings of the IEEE Conference on Computer Vision and Pattern Recognition, Honolulu, HI, USA, 21–26 July 2017; pp. 6517–6525. [Google Scholar]
  48. Redmon, J.; Farhadi, A. YOLOv3: An incremental improvement. In Proceedings of the IEEE Conference on Computer Vision and Pattern Recognition, Salt Lake City, UT, USA, 18–22 June 2018. [Google Scholar]
  49. Bochkovskiy, A.; Wang, C.Y.; Liao, H.Y.M. YOLOv4: Optimal Speed and Accuracy of Object Detection. arXiv 2020, arXiv:2004.10934. [Google Scholar]
  50. Misra, D. Mish: A self regularized non-monotonic neural activation function. arXiv 2019, arXiv:1908.08681. [Google Scholar]
  51. Huang, G.; Liu, Z.; Laurens, V.D.M.; Weinberger, K.Q. Densely connected convolutional networks. In Proceedings of the IEEE Conference on Computer Vision and Pattern Recognition, Honolulu, HI, USA, 21–26 July 2017; pp. 2261–2269. [Google Scholar]
  52. Ramachandran, P.; Zoph, B.; Le, Q.V. Searching for activation functions. arXiv 2017, arXiv:1710.05941. [Google Scholar]
  53. Maas, A.L.; Hannun, A.Y.; Ng, A.Y. Rectifier nonlinearities improve neural network acoustic models. In Proceedings of the ICML 2013, Atlanta, GA, USA, 16–21 June 2013. [Google Scholar]
  54. He, K.; Zhang, X.; Ren, S.; Sun, J. Spatial pyramid pooling in deep convolutional networks for visual recognition. IEEE Trans. Pattern Anal. Mach. Intell. (TPAMI) 2015, 37, 1904–1916. [Google Scholar] [CrossRef] [Green Version]
  55. Liu, S.; Qi, L.; Qin, H.F.; Shi, J.P.; Jia, J.Y. Path Aggregation Network for Instance Segmentation. In Proceedings of the IEEE Conference on Computer Vision and Pattern Recognition, Salt Lake City, UT, USA, 18–22 June 2018; pp. 8759–8768. [Google Scholar]
  56. Ghiasi, G.; Lin, T.-Y.; Le, Q.V. Dropblock: A regularization method for convolutional networks. In Proceedings of the Advances in Neural Information Processing Systems, Montréal, QC, USA, 3–8 December 2018; pp. 10727–10737. Available online: https://arxiv.org/pdf/1810.12890.pdf (accessed on 11 December 2020).
  57. Zheng, Z.; Wang, P.; Liu, W.; Li, J.; Ye, R.; Ren, D. Distance-IoU loss: Faster and better learning for bounding box regression. In Proceedings of the AAAI Conference on Artificial Intelligence, New York, NY, USA, 7–11 February 2020; Volume 34, No. 7. pp. 12993–13000. [Google Scholar]
  58. Kaggle PlantPathology Apple Dataset 2020. Available online: https://www.kaggle.com/piantic/plantpathology-apple-dataset (accessed on 9 March 2021).
  59. LabelImg 2021. Available online: https://github.com/tzutalin/labelImg (accessed on 24 March 2021).
Figure 1. Schematic of YOLOv4 object detection algorithm for disease detection.
Ai 02 00026 g001
Figure 2. Schematic of (a) the proposed network architecture for plant disease detection consisting of Dense-CSPDarknet53 integrating SPP as the backbone, modified PANet as a neck with a regular YOLOv3 head; (b) dense block structure.
Ai 02 00026 g002
Figure 3. Different image augmentation methods: (a) original image, (b) 90 ACW rotation, (c) 180 ACW rotation, (d) 270 ACW rotation, (e) horizontal mirror projection, (f) color balancing, (gi) brightness transformation, and (j) blur processing.
Ai 02 00026 g003
Figure 4. Schematic definition of precesion (P), recall (R) and intersection over union ( I o U ) during object detection.
Ai 02 00026 g004
Figure 5. Schematic of offset regression for target bounding box prediction process during CIoU loss in bounding box regression for proposed object detection algorithm.
Ai 02 00026 g005
Figure 6. Comparison of P-R curves between YOLOv3, YOLOv4, and proposed detection model.
Ai 02 00026 g006
Figure 7. Comparison of validation loss curves between YOLOv3, YOLOv4, and proposed detection model.
Ai 02 00026 g007
Figure 8. Comparison of detection result for apple scab on two distinct apple leaves from three models: (a1,a2) YOLOv3; (b1,b2) YOLOv4; (c1,c2) proposed model.
Ai 02 00026 g008
Figure 9. Comparison of detection result for apple rust on two distinct apple leaves from three models: (a1,a2) YOLOv3; (b1,b2) YOLOv4; (c1,c2) proposed model.
Ai 02 00026 g009
Figure 10. Comparison of detection result for both apple scab and rust on two distinct apple leaves from three models: (a1,a2) YOLOv3; (b1,b2) YOLOv4; (c1,c2) proposed model.
Ai 02 00026 g010
Table 1. Different diseases in apple plant and corresponding class identifier with original number of images and images produced by augmentation method for the custom dataset.
Object ClassScabRustMix (Scab and Rust)
Class identifier121, 2
Original images200200200
Rotation800800800
Color balancing200200200
Brightness transform600600600
Blur processing200200200
Total number of images/class200020002000
Table 2. Local computing resources and DNN environments.
Testing EnvironmentConfiguration Parameter
OSWindows 10 Pro 64
CPUIntel Core i5-10210U
RAM8 GB DDR4
GPUNVIDIA GeForce RTX 2080
GPU acceleration env.CUDA 10.2.89
GPU acclerated DNN lib.cuDNN 10.2 v7.6.5
Int. development env.Visual Studio comm. v15.9 (2017)
Comp. Vision lib.OpenCV 4.5.1-vc14
Table 3. Initial configuration parameters of improved YOLOv4 model.
Input Size of ImageBatchSubdivisionChannelsMomentum
512 × 512 16430.9
Initial Learning RateDecayClassesFiltersTraining Steps
0.0010.00542785,000
Table 4. Comparison of IoU, F1 Score, final loss, detection speed, and average detection time between YOLOv3, YOLOv4, and the proposed model.
Detection ModelIoUF1-ScoremAPValidation LossDetection Time (ms)Detection Speed (FPS)
YOLOv30.7870.8220.78111.1216.25461.52
YOLOv40.8610.8830.8394.3115.30165.22
Proposed model0.9220.9590.9121.6517.57756.89
Table 5. Comparison of detection results between YOLOv3, YOLOv4, and proposed model on the test dataset.
ModelClassObjectsTPFPFNP (%)R (%)F1-Score
YOLOv3All3517268875040878.1886.8282.27
Scab1975150139818779.0488.9283.69
Rust1542118735222177.1284.3080.56
YOLOv4All3517294452524884.8692.2388.39
Scab1975164328613785.1792.3088.59
Rust1542130123911184.4892.1388.14
Proposed ModelAll351732722126293.9198.1495.98
Scab197518451273993.5597.9395.69
Rust15421427852394.3798.4196.35
Table 6. Comparison of detection results between YOLOv3, YOLOv4, and the proposed model for apple scab detection as shown in Figure 8. Bold highlights the best result obtained from corresponding model prediction.
Figs. NoModelDetc.Undetc.Misdetc.Confidence Scores
Figure 8(a1)YOLOv33300.84, 0.93, 0.98
Figure 8(b1)YOLOv44200.94, 1.00, 1.00, 0.98
Figure 8(c1)Proposed model6000.98, 1.00, 1.00, 0.97, 1.00, 1.00
Figure 8(a2)YOLOv33510.81, 0.94, 0.77
Figure 8(b2)YOLOv44410.97, 0.81, 1.00, 0.78
Figure 8(c2)Proposed model8101.00, 1.00, 0.92, 1.00
1.00, 1.00, 1.00, 0.97
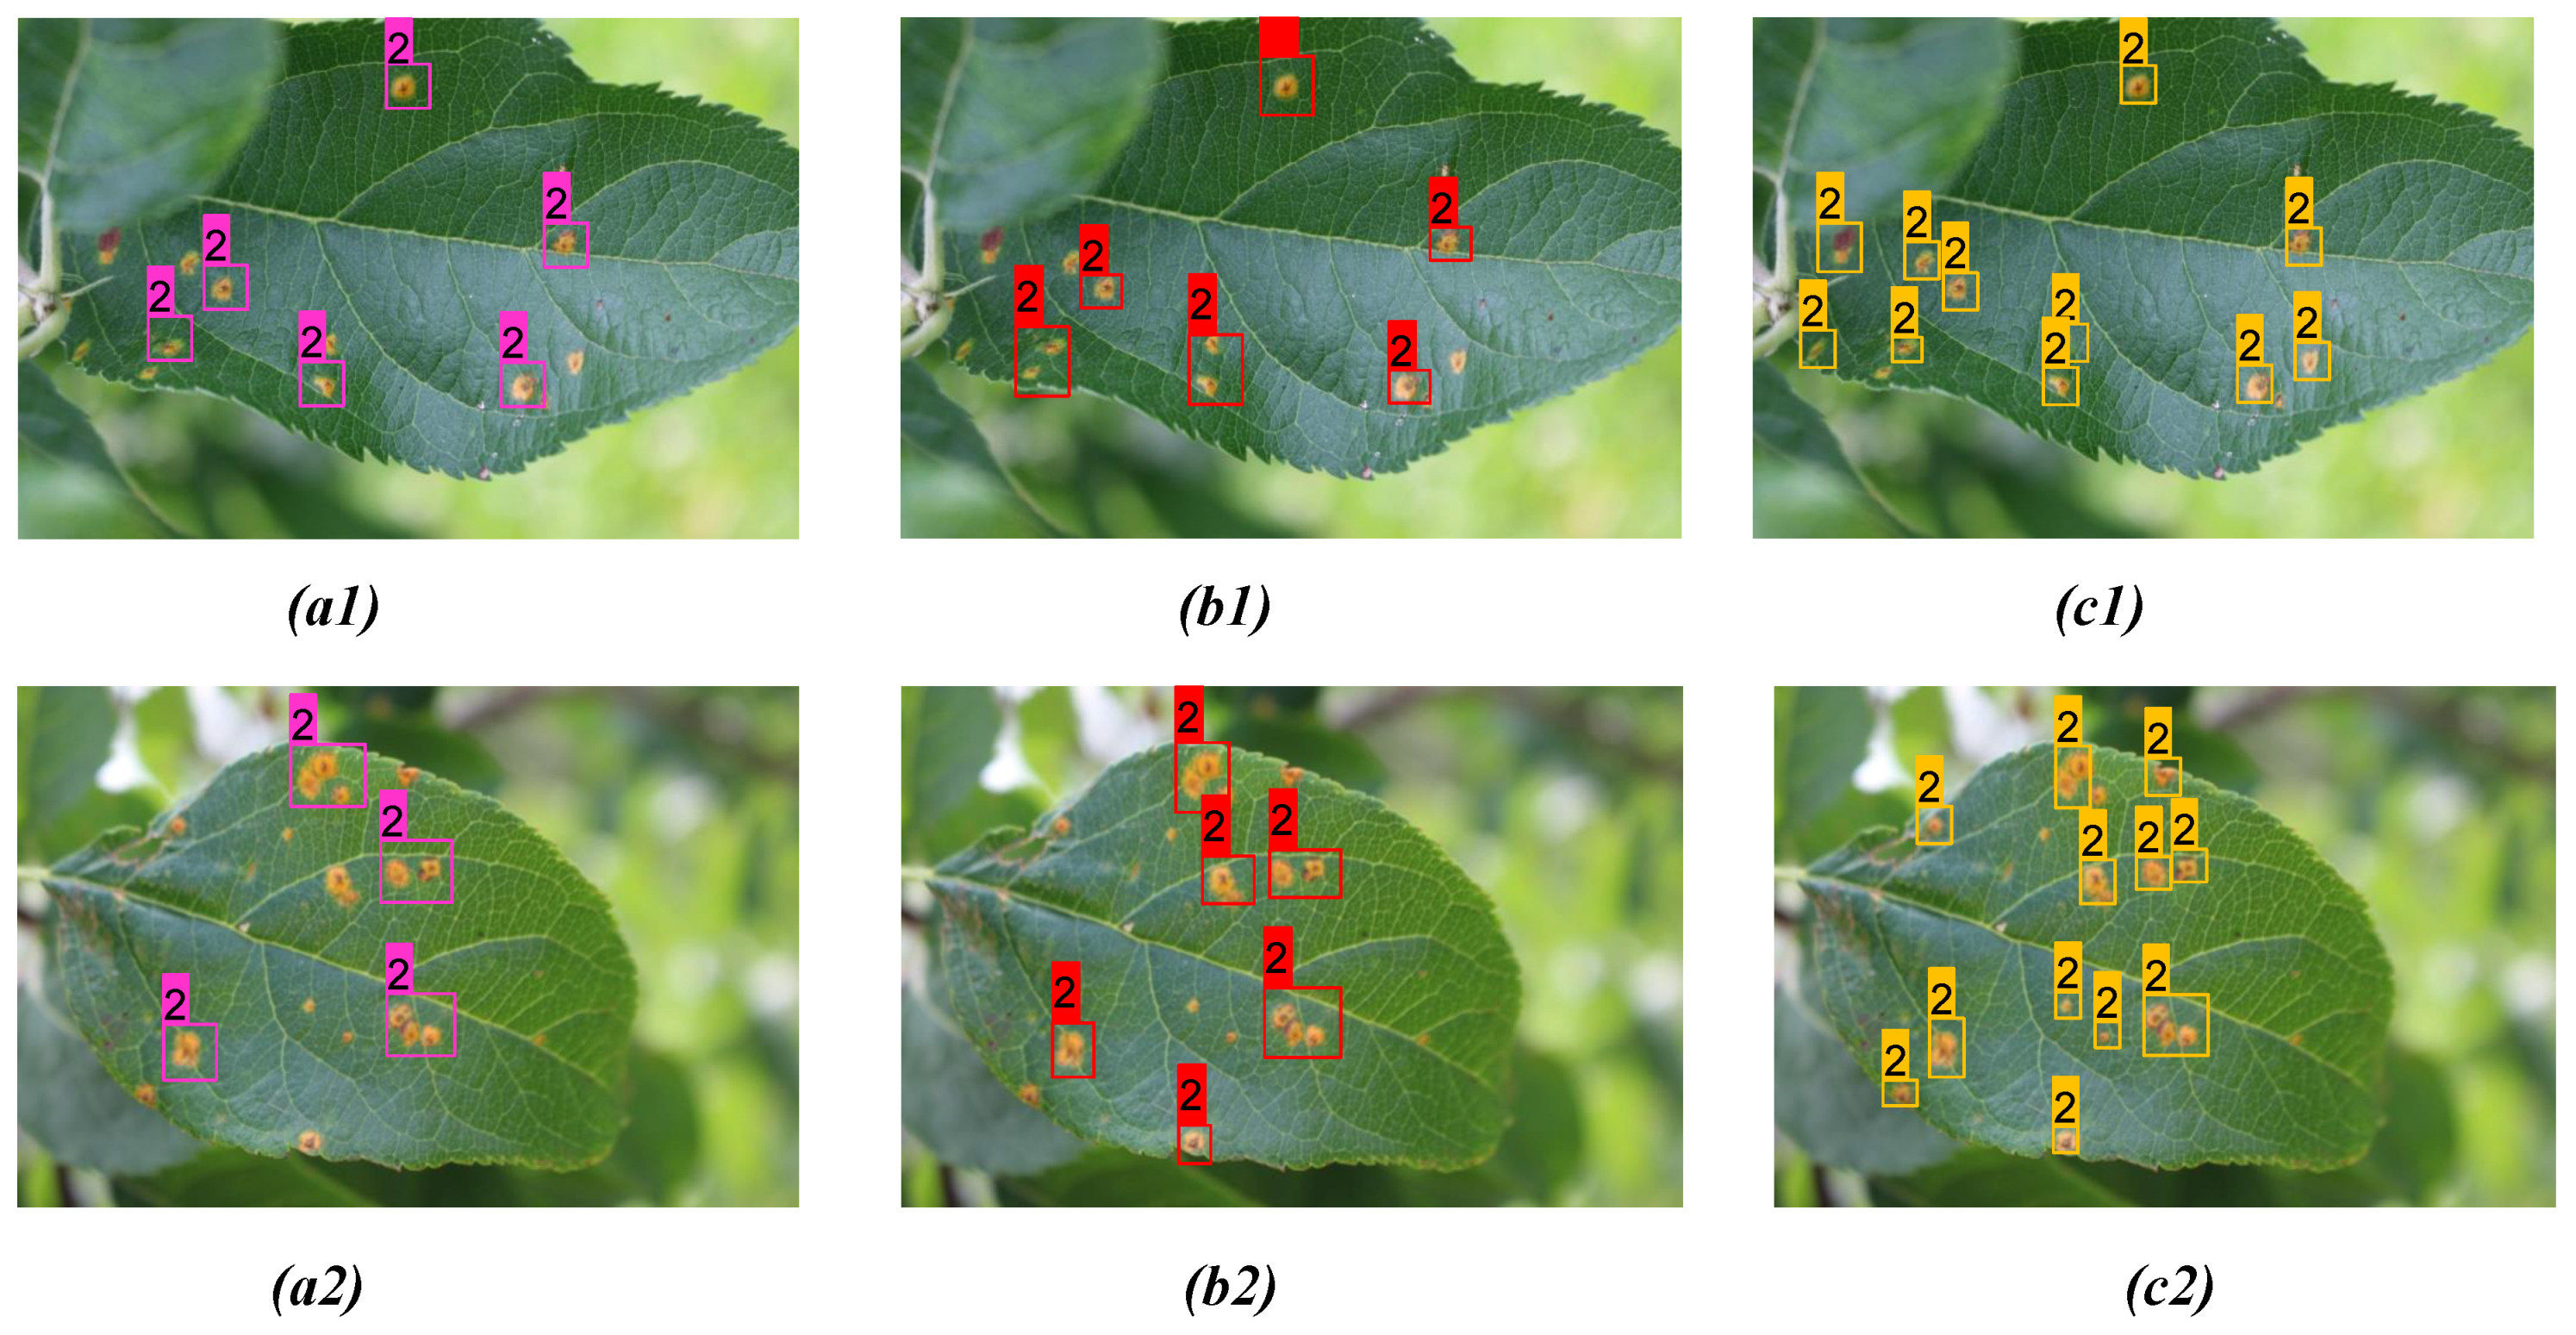
Table 7. Comparison of detection results between YOLOv3, YOLOv4, and proposed model for apple rust detection as shown in Figure 9. Bold highlights the best result obtained from corresponding model prediction.
Figs. NoModelDetc.Undetc.Misdetc.Confidence Scores
Figure 9(a1)YOLOv36500.84, 0.93, 0.79, 0.93, 0.89, 0.94
Figure 9(b1)YOLOv48300.88, 0.91, 0.87, 0.91, 0.78, 0.83
0.99, 0.89
Figure 9(c1)Proposed model11000.96, 0.91, 1.00, 1.00, 0.92, 1.00
1.00, 1.00, 0.98, 1.00, 0.97
Figure 9(a2)YOLOv37710.91, 0.78, 0.98, 0.76, 0.79, 0.92, 0.86
Figure 9(b2)YOLOv48610.92, 0.91, 0.83, 1.00, 0.92, 0.87
0.91, 0.83
Figure 9(c2)Proposed model12200.95, 0.99, 0.87, 1.00, 0.92, 1.00
0.94, 1.00, 0.98, 1.00, 0.83, 0.97
Table 8. Comparison of detection results between YOLOv3, YOLOv4, and proposed model for both apple scab and rust as shown in Figure 10. Bold highlights the best result obtained from corresponding model prediction.
Figs. NoModelDetc.Undetc.Misdetc.Confidence Scores
Figure 10(a1)YOLOv36500.84, 0.88, 0.76, 0.79, 1.00, 0.98
Figure 10(b1)YOLOv47400.82, 0.77, 1.00, 0.93, 1.00
0.83, 0.94
Figure 10(c1)Proposed model10100.90, 0.87, 1.00, 0.92, 1.00
0.94, 1.00, 1.00, 0.83, 0.97
Figure 10(a2)YOLOv36610.91, 0.67, 0.81 0.94, 0.77, 0.79
Figure 10(b2)YOLOv46610.97, 0.86, 1.00, 0.77, 0.85, 0.67
Figure 10(c2)Proposed model9300.72, 0.90, 1.00, 0.92, 1.00
0.83, 0.95, 0.94, 0.99
Publisher’s Note: MDPI stays neutral with regard to jurisdictional claims in published maps and institutional affiliations.

