
Year-Independent Prediction of Food Insecurity Using Classical and Neural Network Machine Learning Methods


Abstract
1. Introduction
2. Background
3. Methods
3.1. Data Preparation
- A large number of NaN values observed in the FEWS Integrated Phase Classification column and those rows were dropped. This resulted in a significant reduction to approximately 30,000 datapoints.
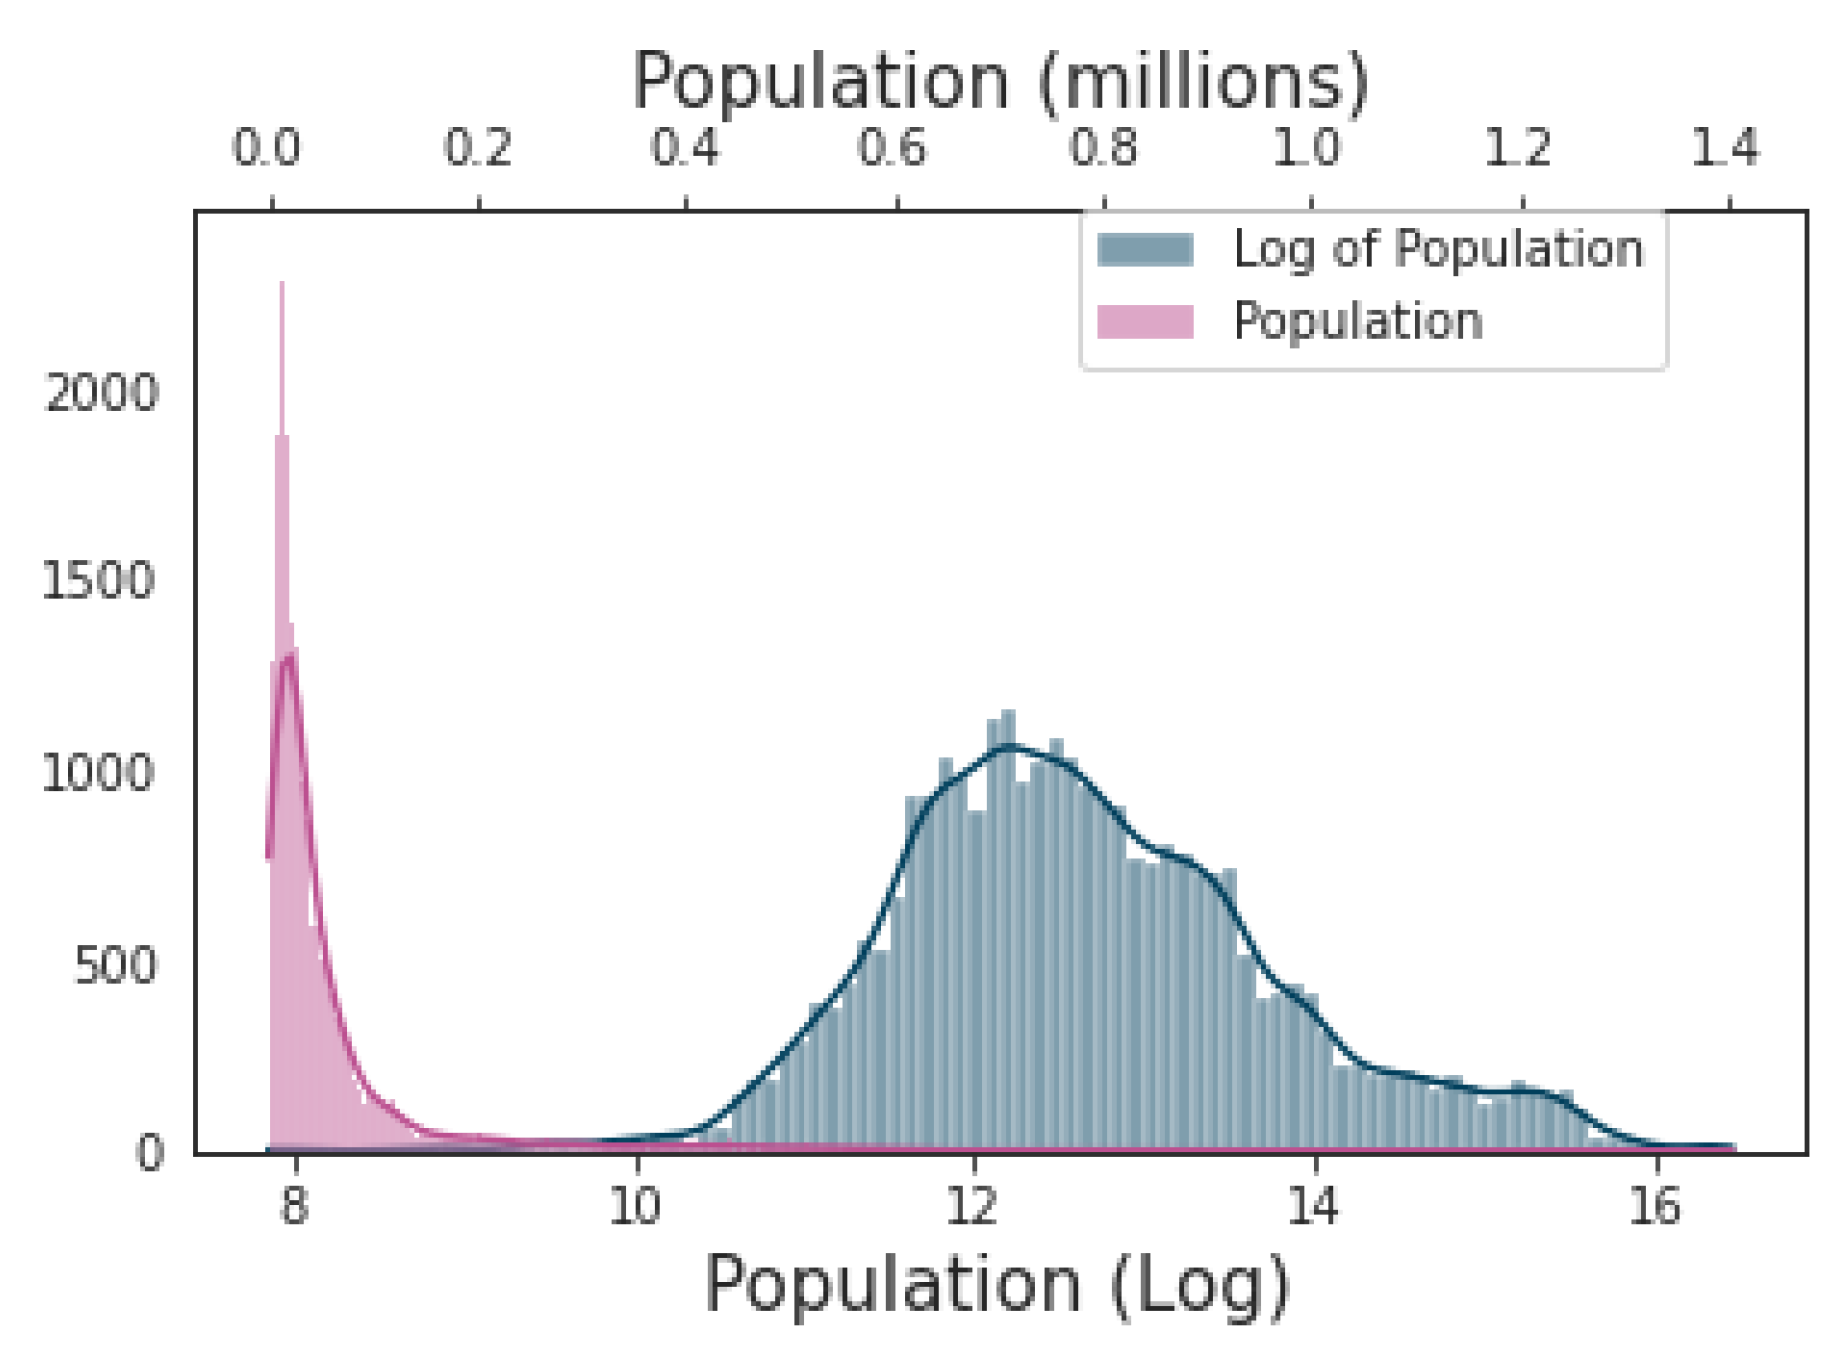
- Log transformations were conducted on the population and the ruggedness index as their histograms indicated they have chi-square distributions. An example showing the impact of the log transformation on the population feature is shown in Figure 4. The untransformed variables were retained in the dataset to capture linear trends.
- All features were normalized in order to increase the learning rate of the machine learning algorithms, with the exception of the country and district categorical variables.
- The month was numerically encoded with January represented as 1 and December represented as 12.
3.2. Metrics
3.3. Classical Modeling
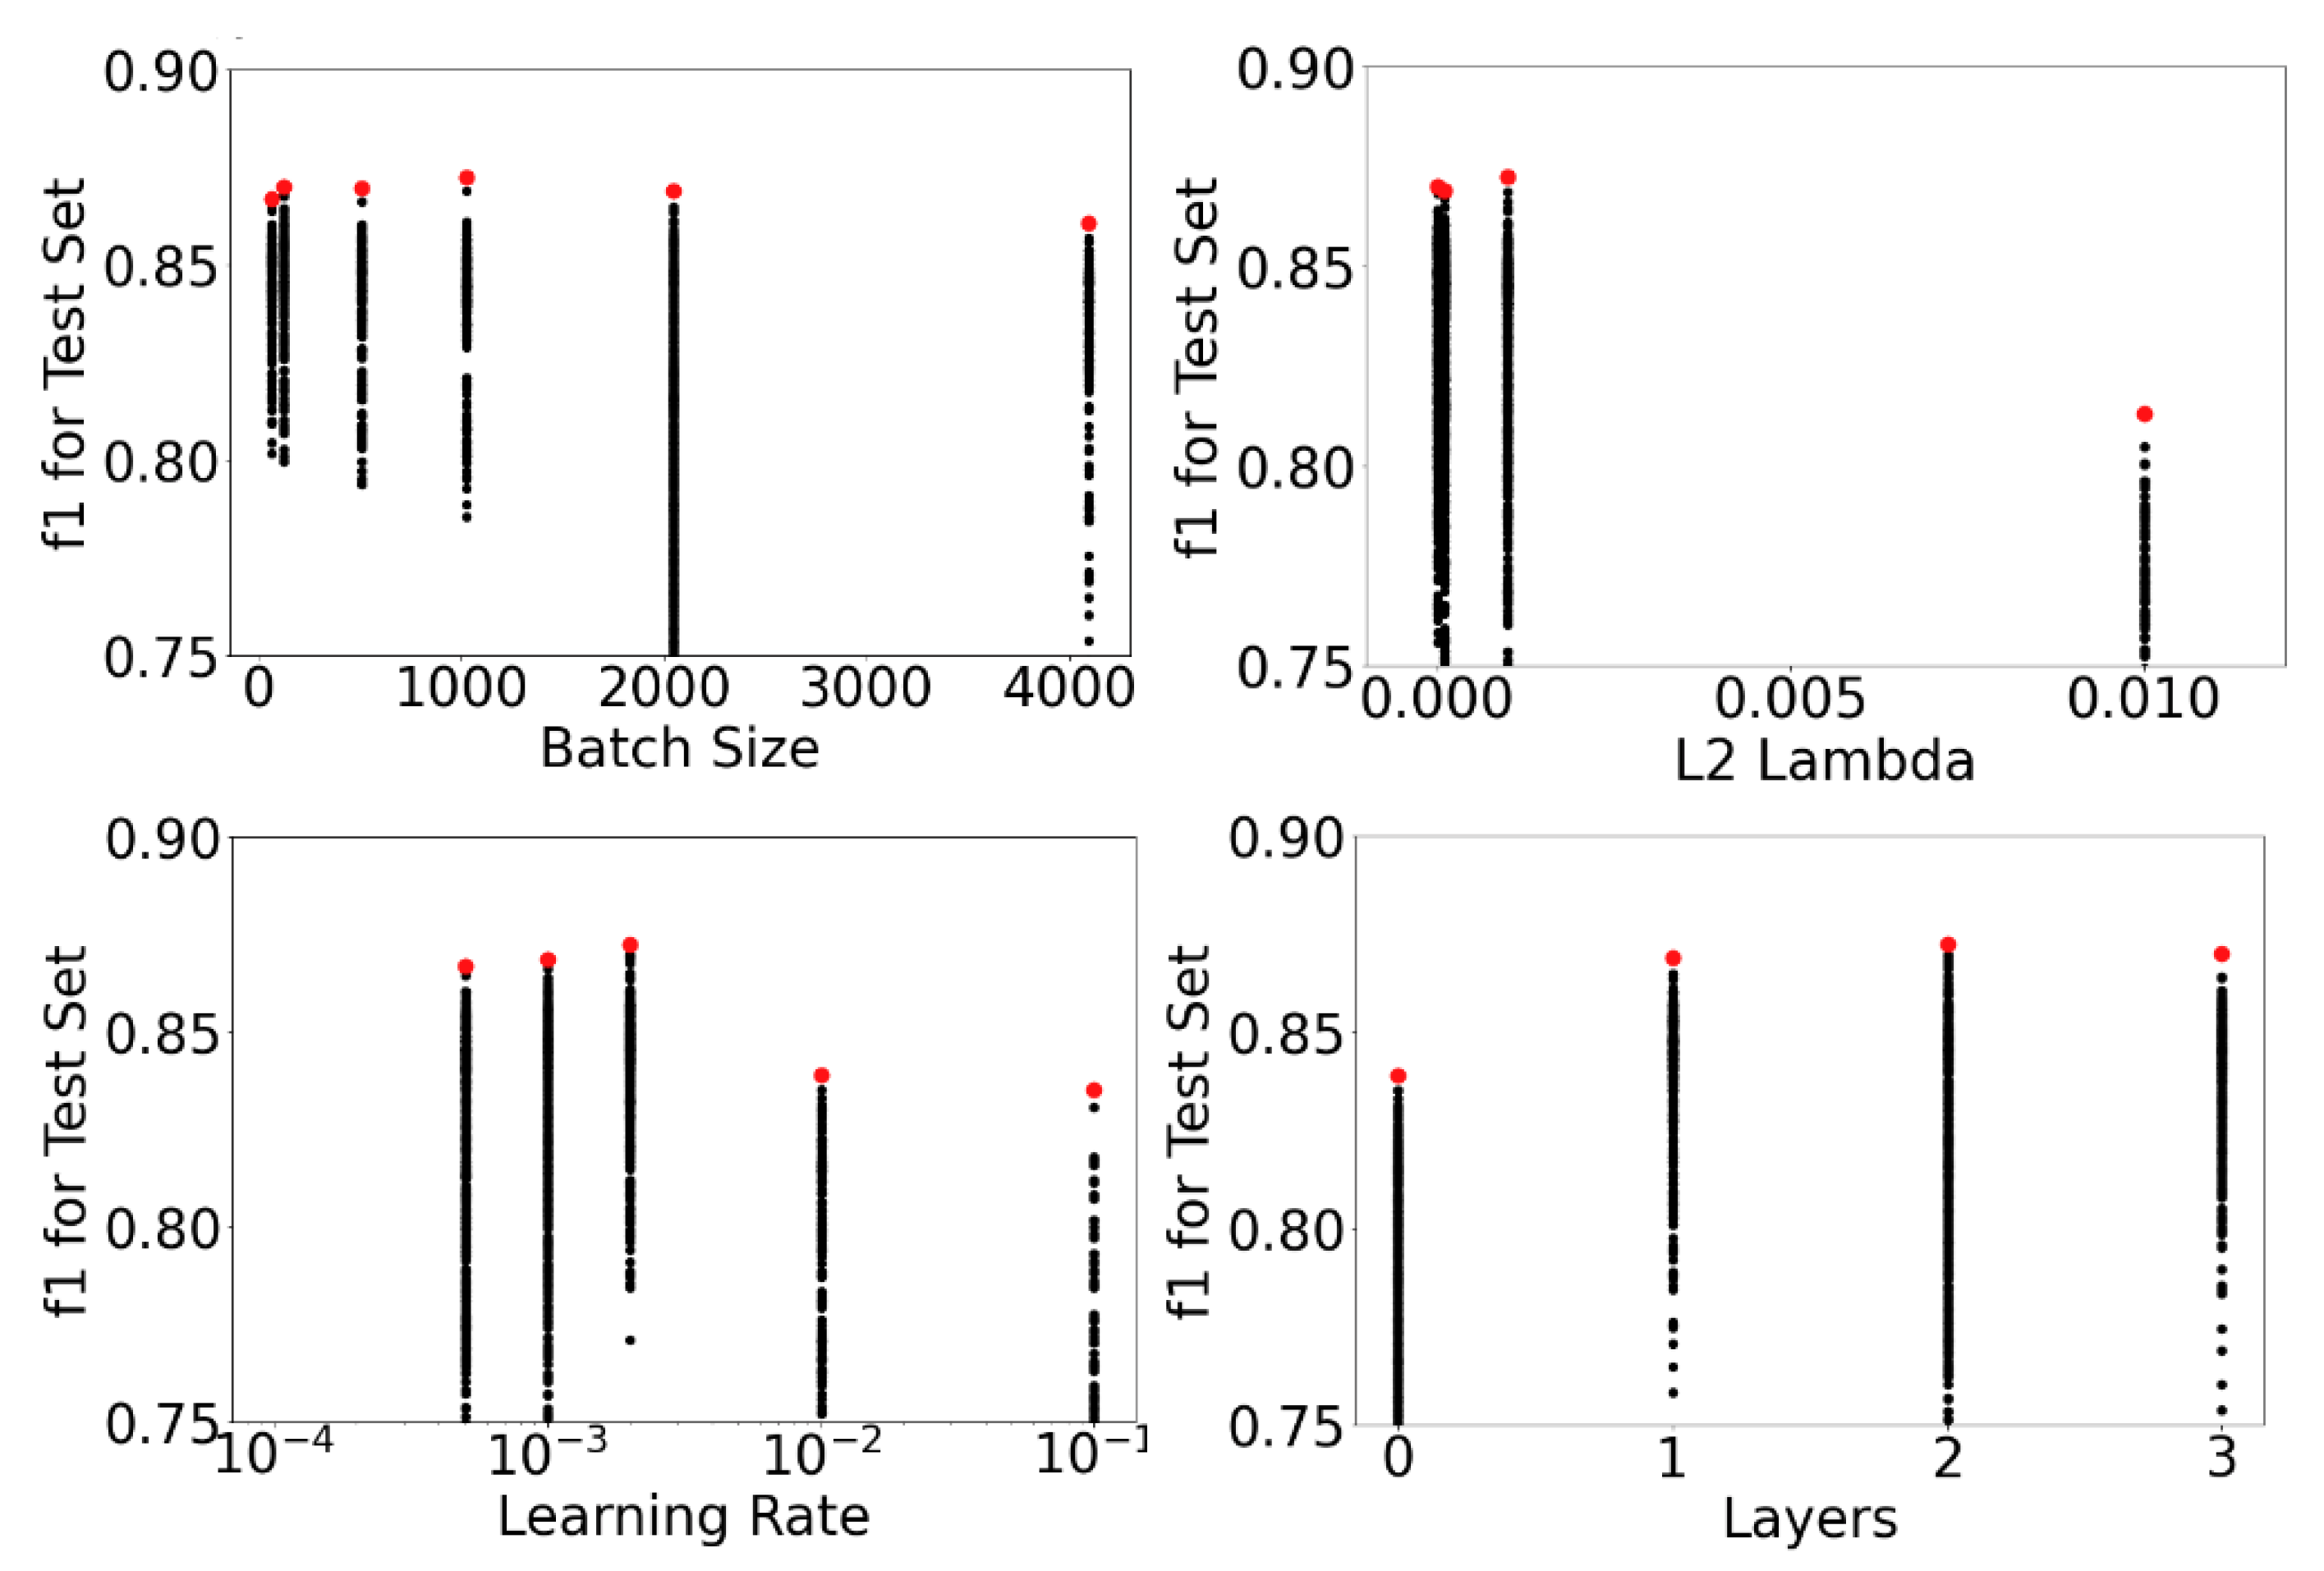
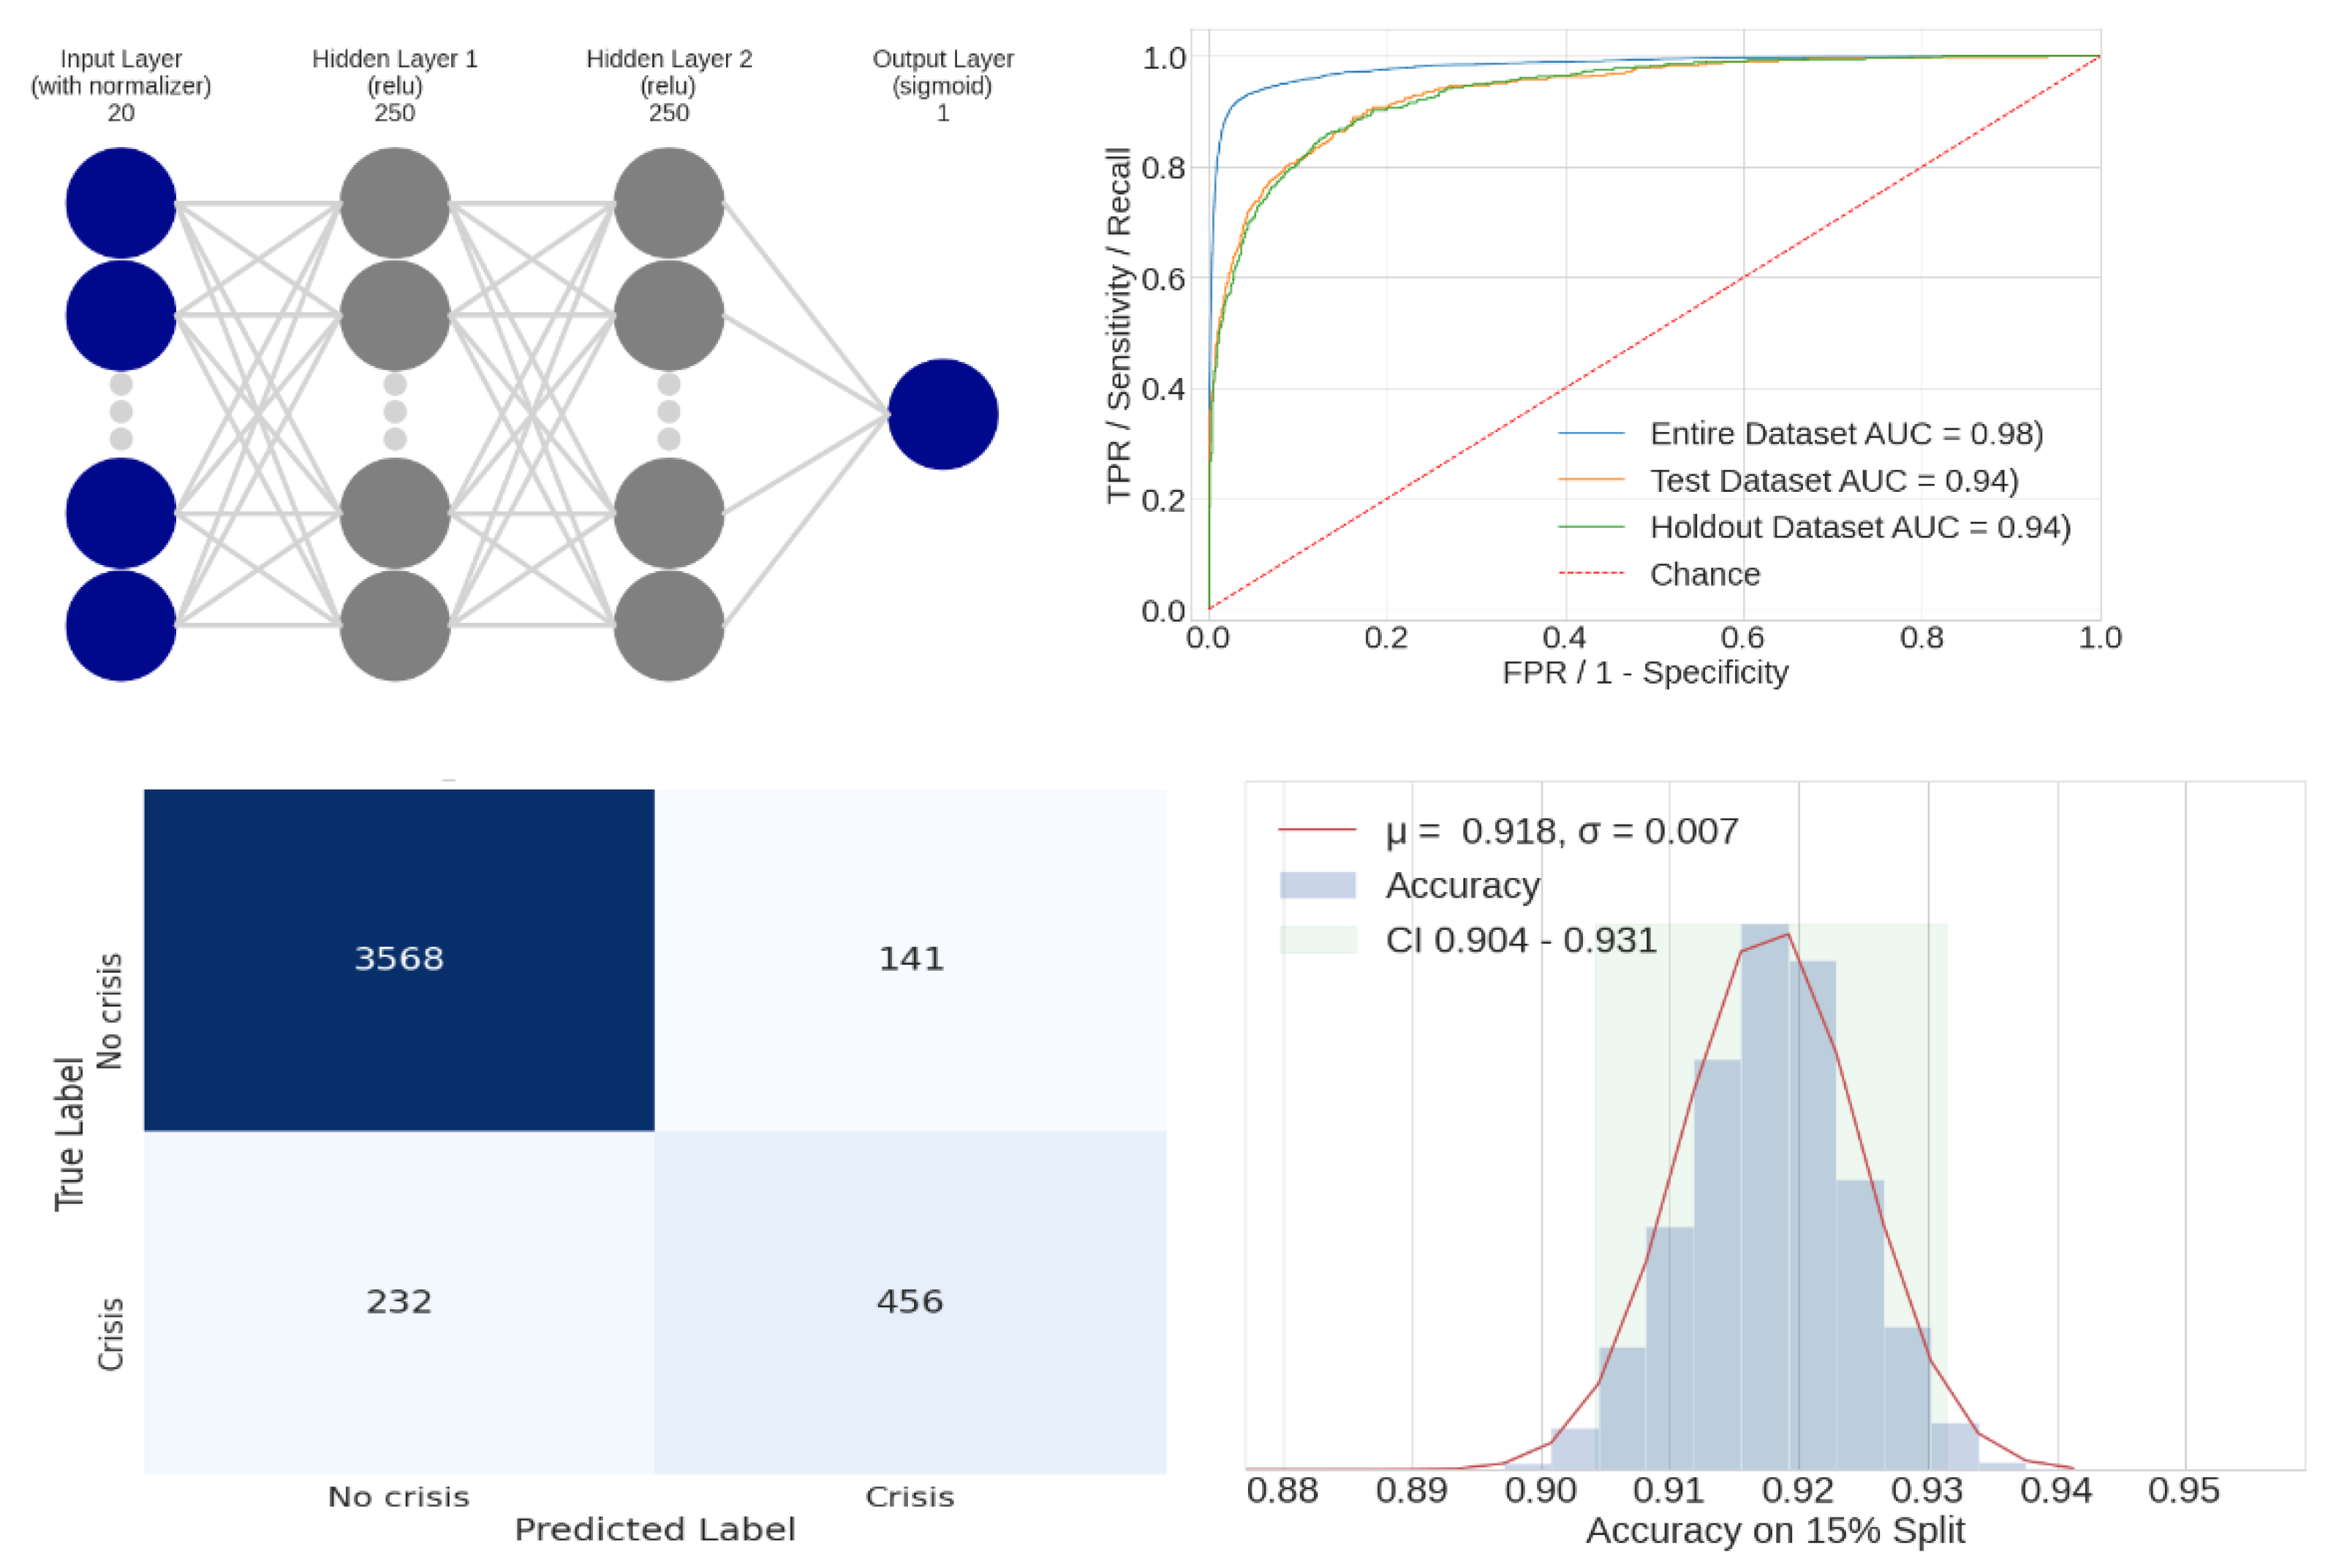
3.4. Neural Network Modeling
4. Results
4.1. Logistic Regression Model
- Chance: metrics that result if the model predicts randomly.
- Always predicts crisis: a model that always predicts the minority class or food crisis.
- Never predicts crisis: a model that always predicts the majority class or no food crisis. This is also known as the no information rate (NIR).
- Goal/prior work: the performance metrics from the model developed by World Bank researchers (Andree, Chamorro, Kraay, Spencer, and Wang, Predicting Food Crises. Policy Research Working Paper; no 9412, 2020).
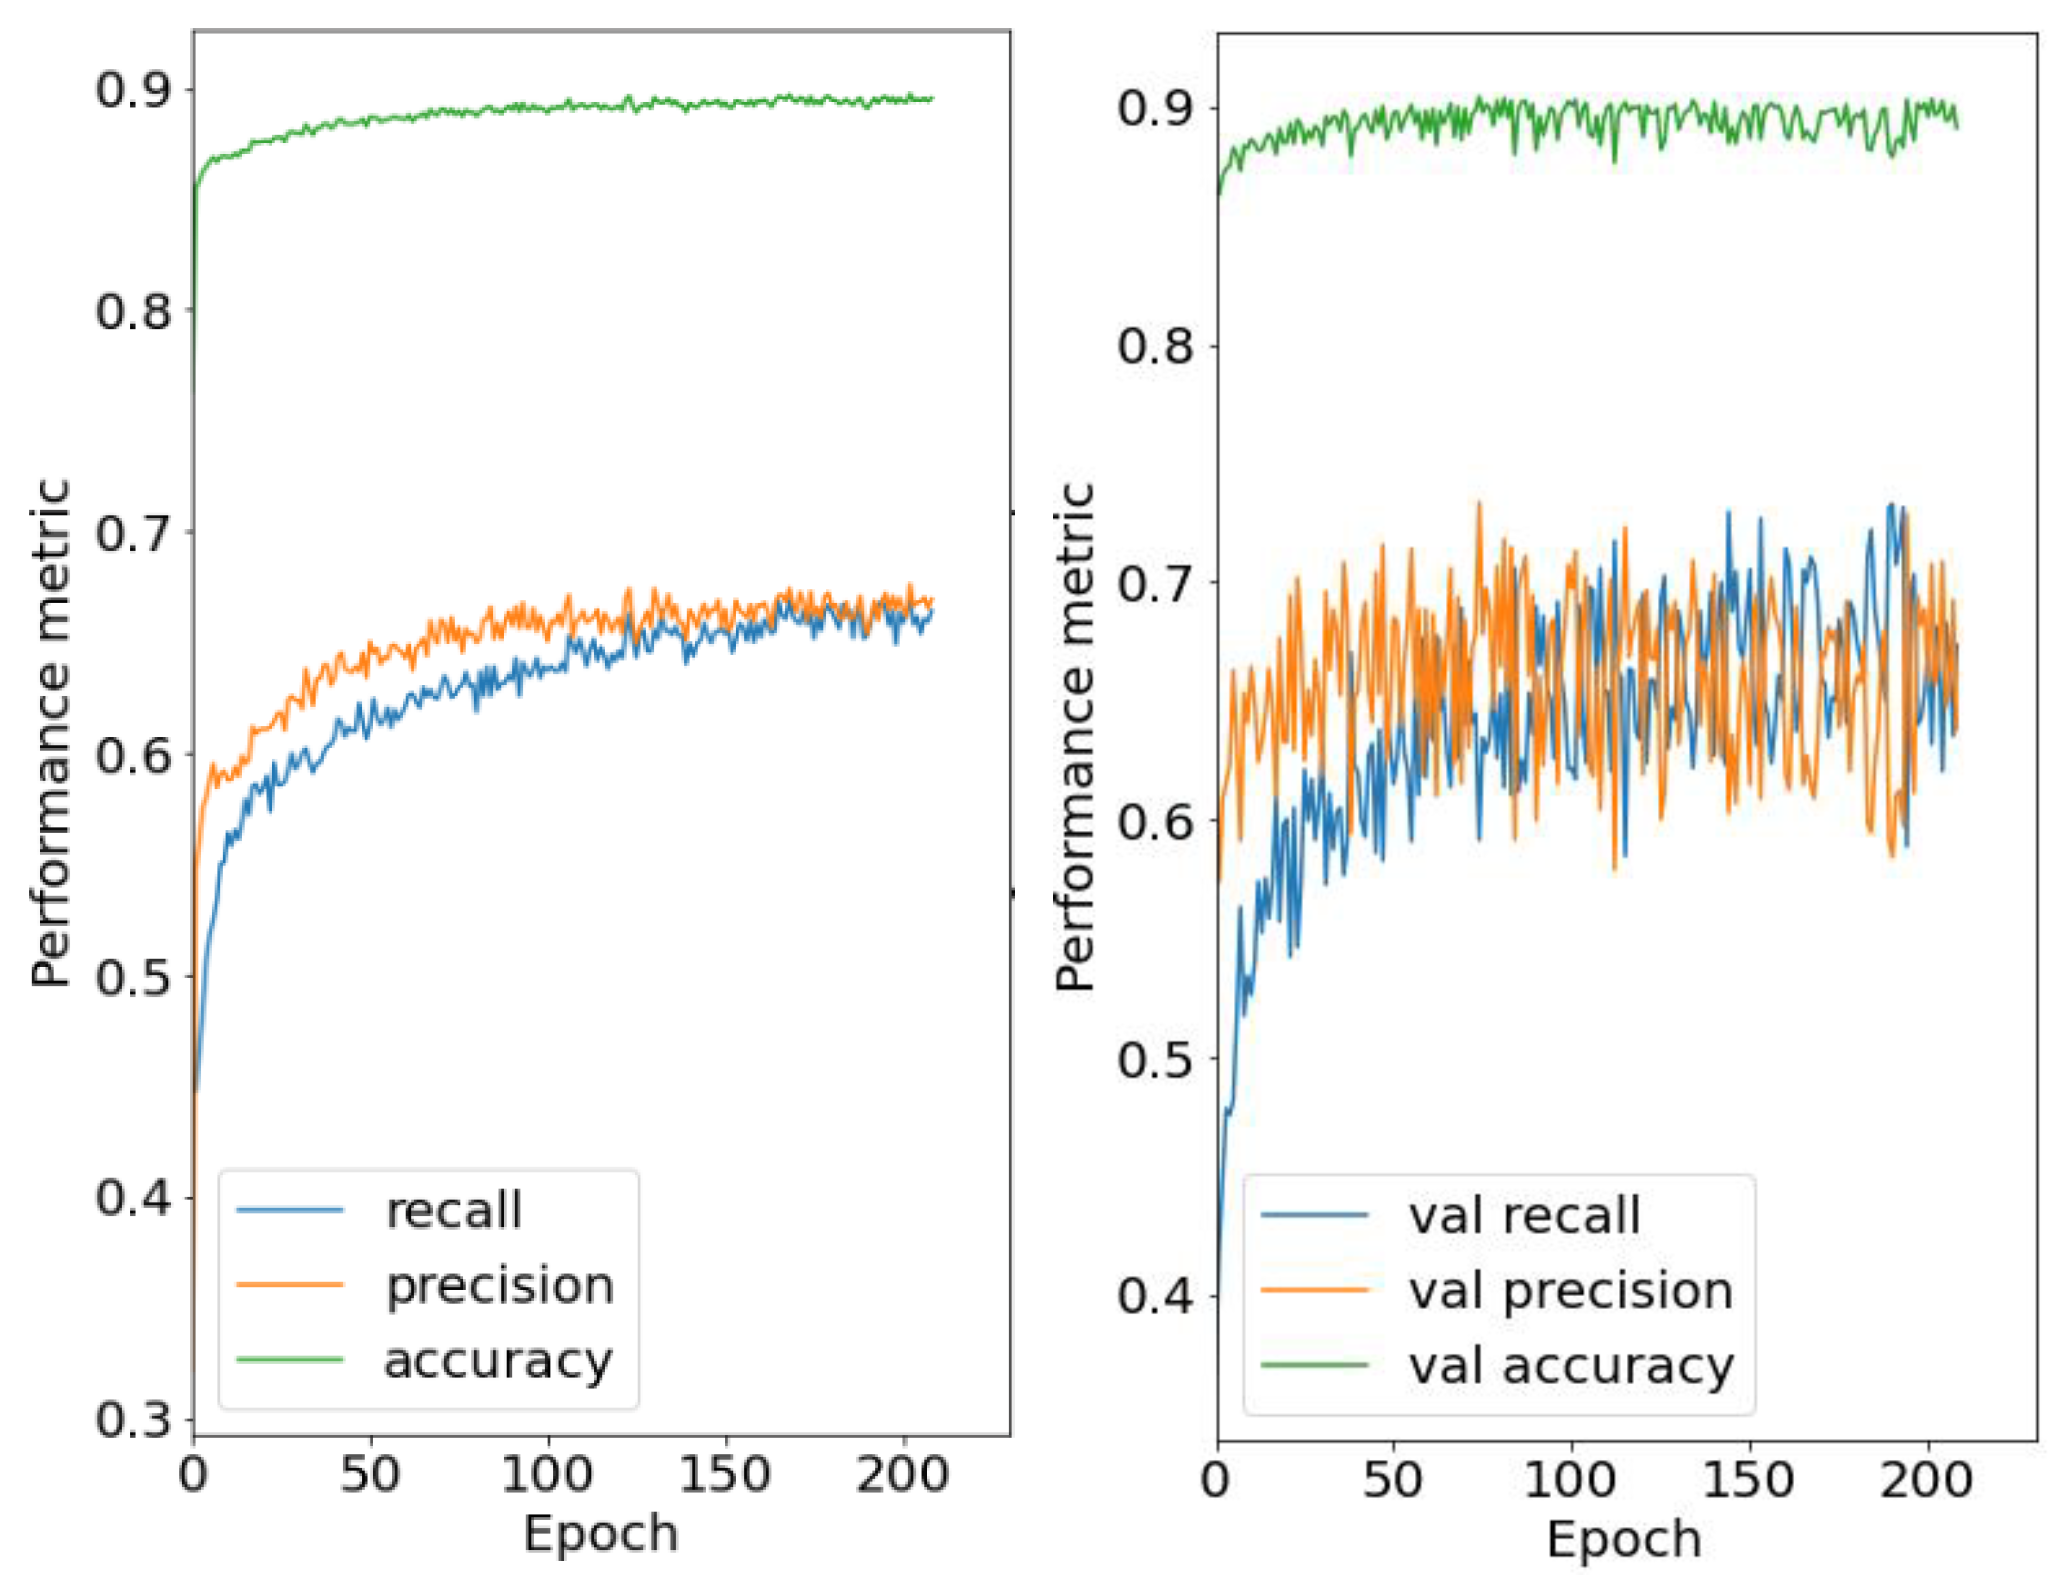
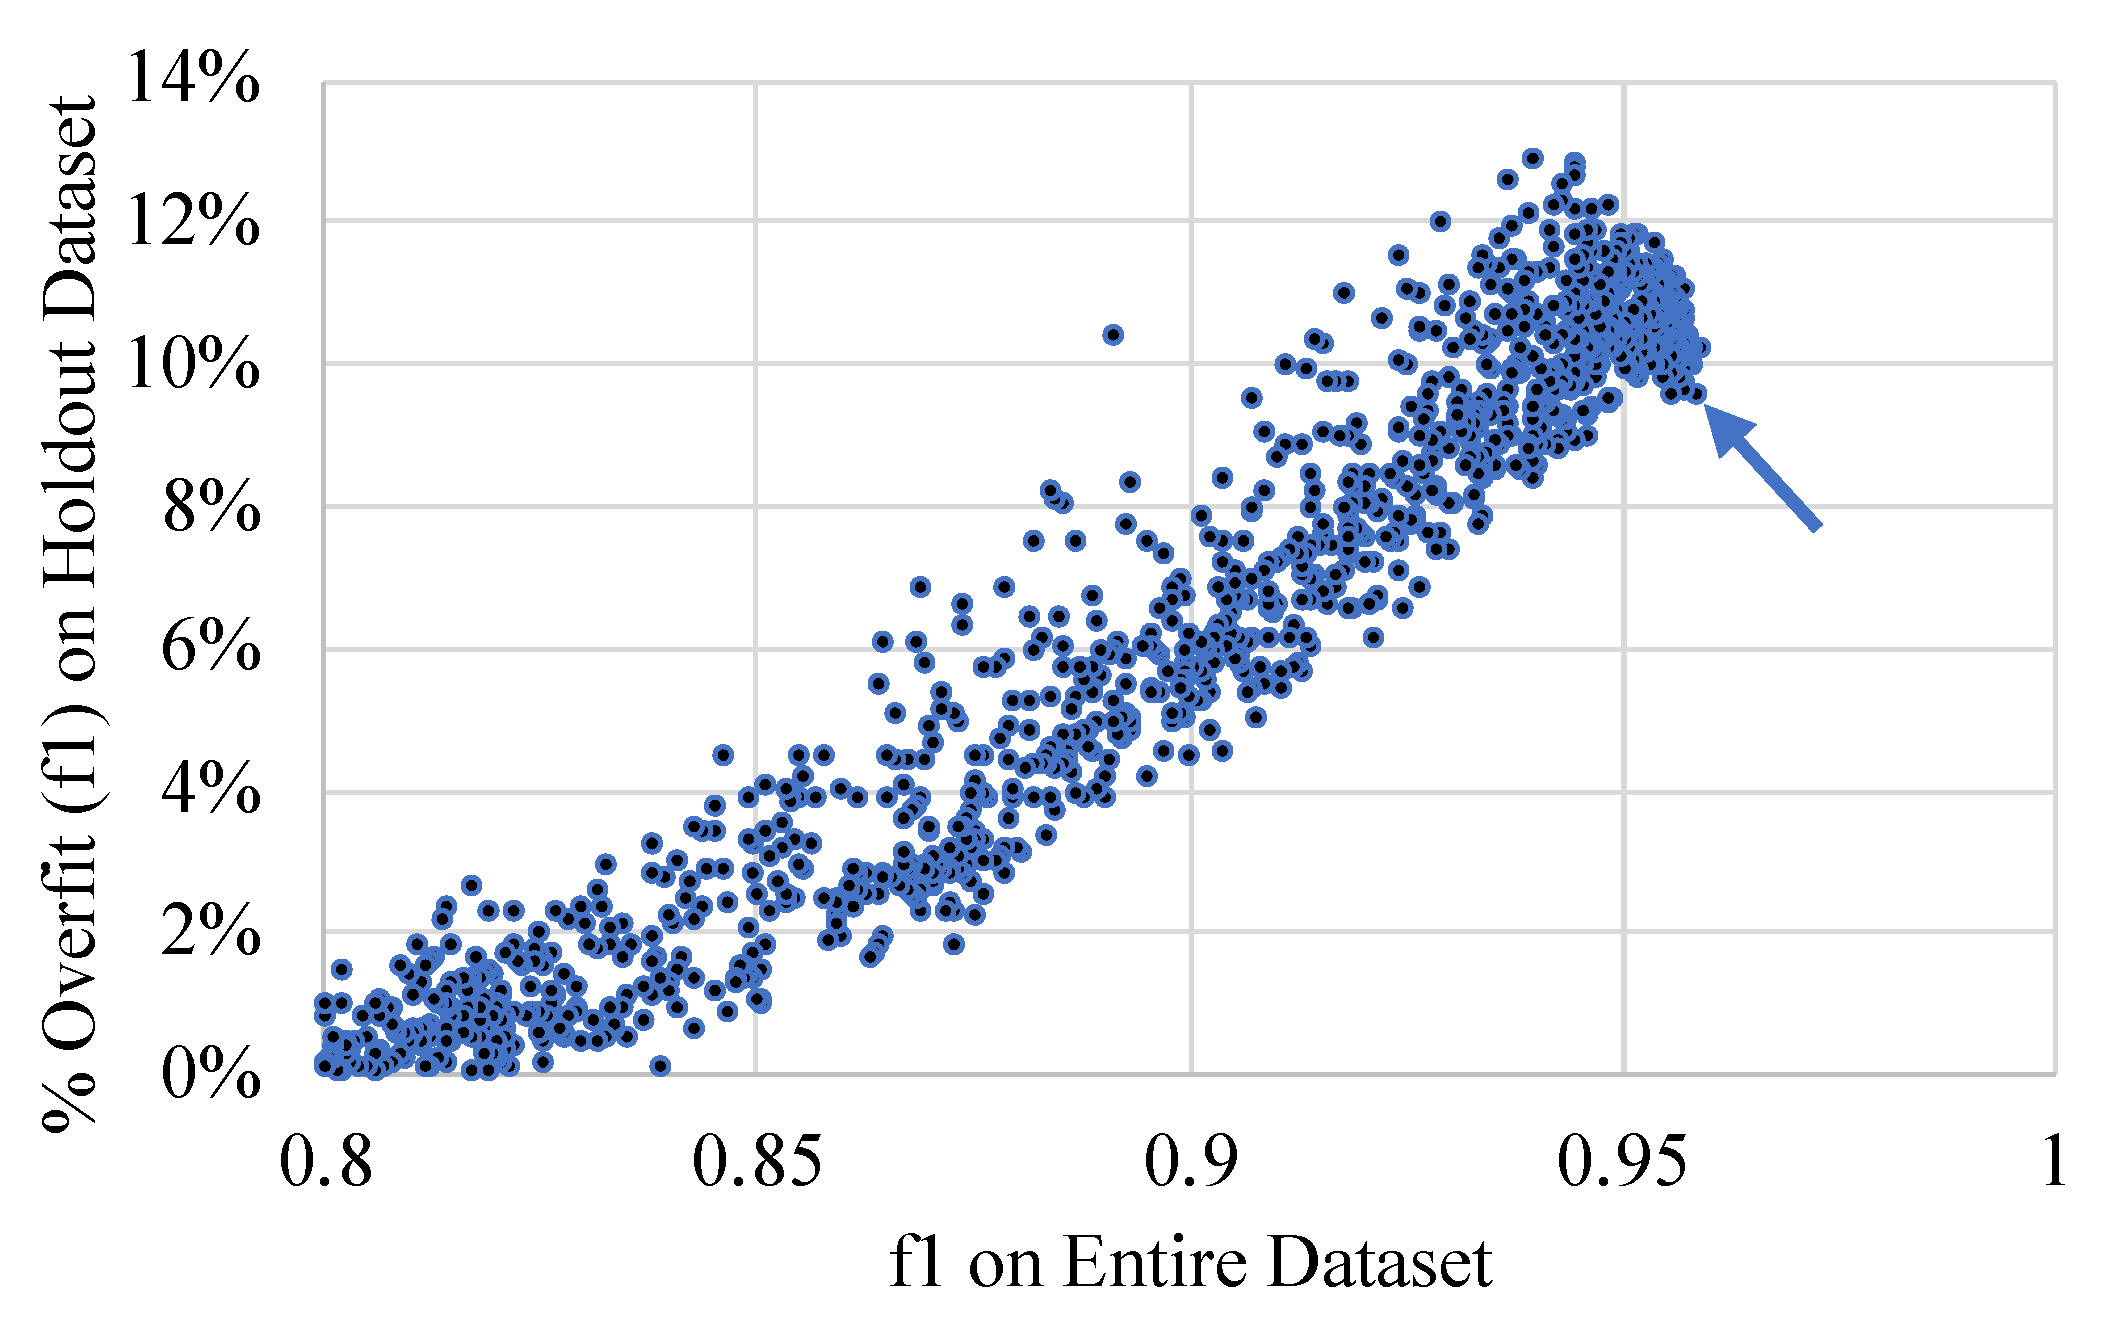
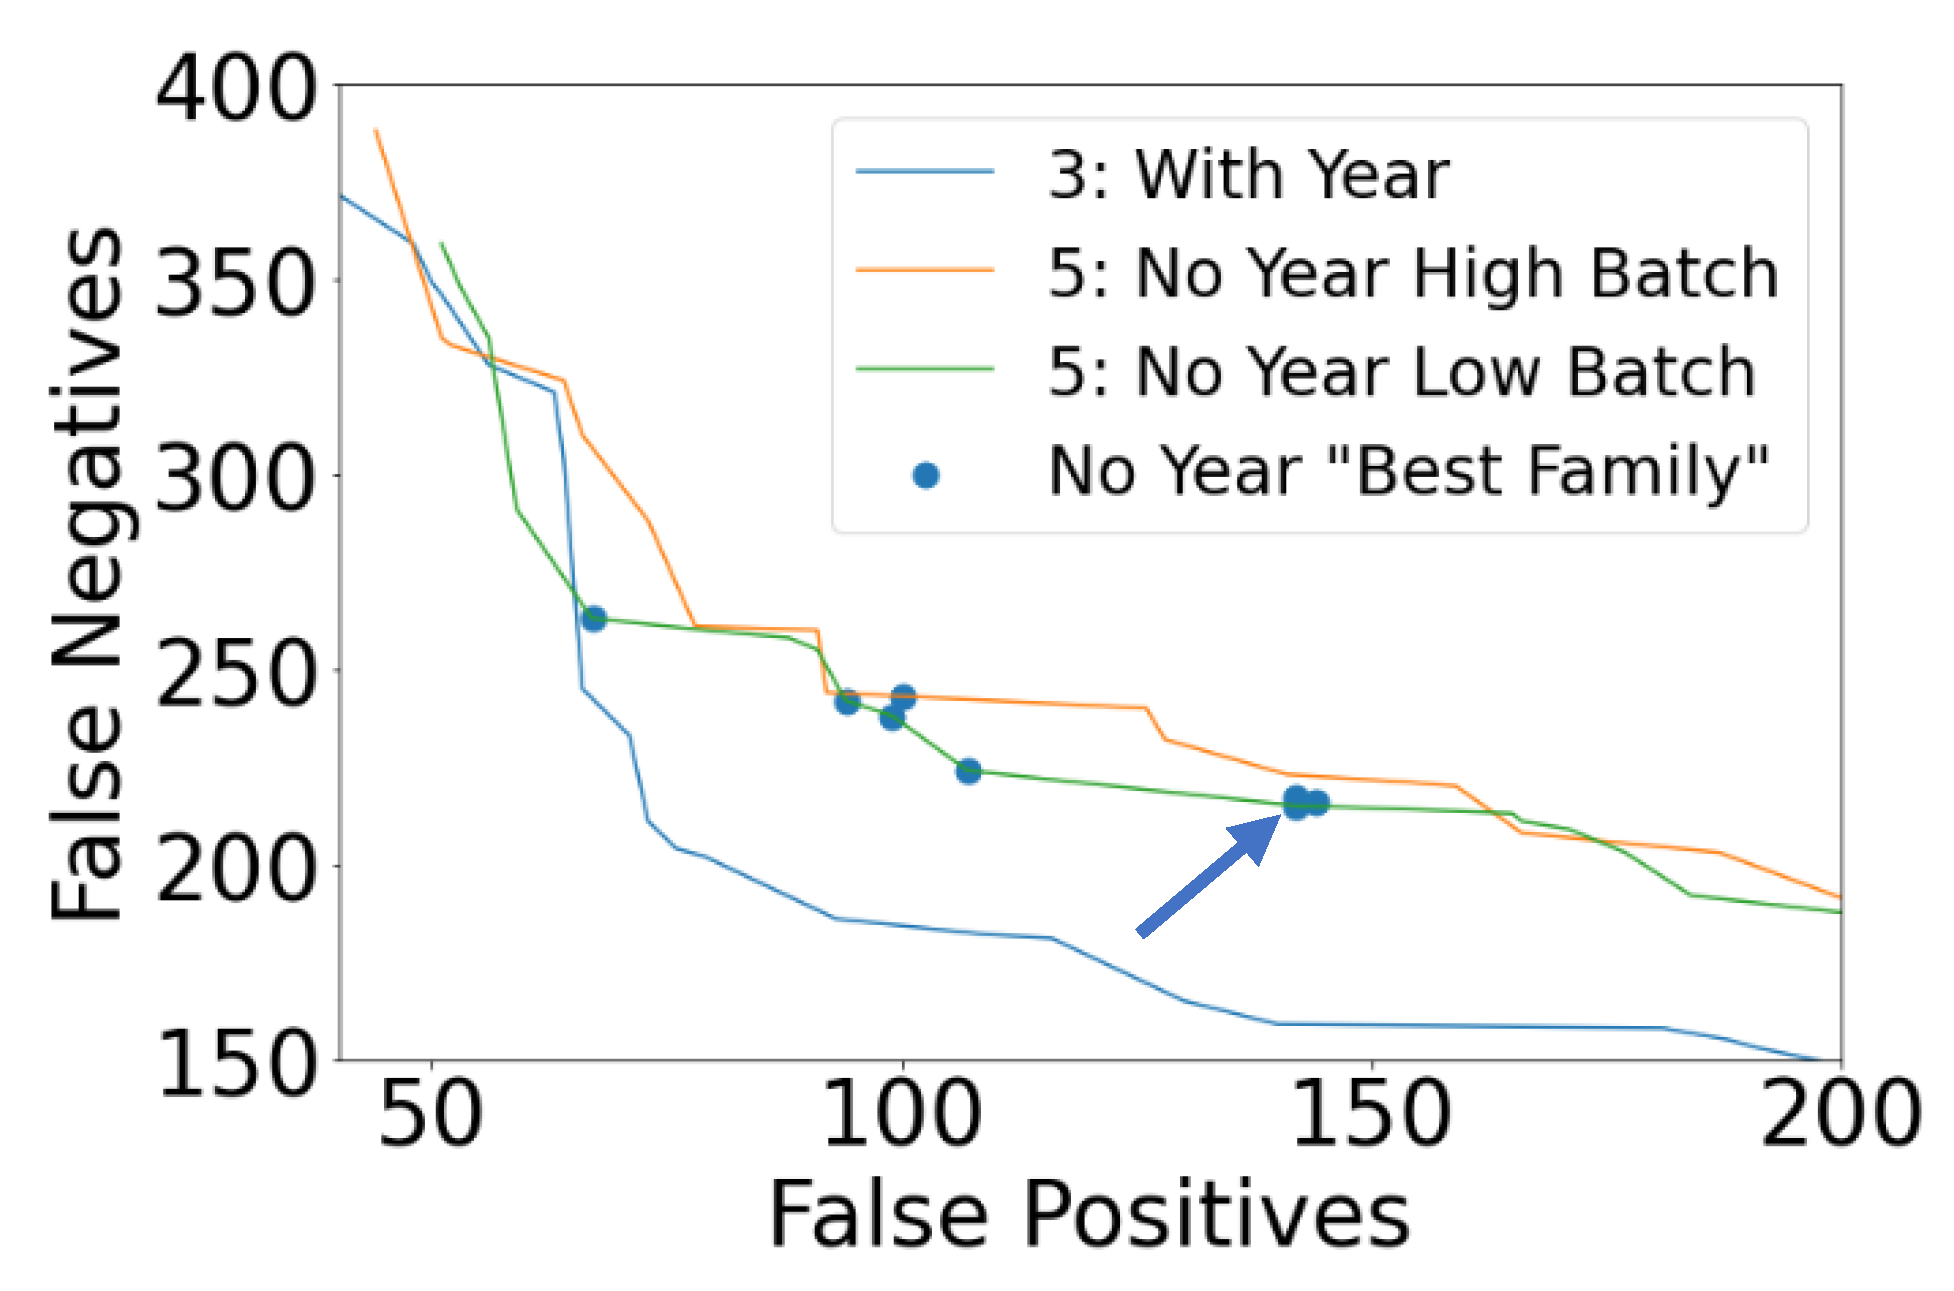
4.2. Neural Network Model
4.3. Discussion
5. Conclusions
Author Contributions
Funding
Data Availability Statement
Conflicts of Interest
References
- Kissinger, H. World Order; Penguin Press: New York, NY, USA, 2014. [Google Scholar]
- Kaplan, R.D. The Return of Marco Polo’s World: War, Strategy, and American Interests in the Twenty-First Century; Random House: New York, NY, USA, 2018. [Google Scholar]
- Department of Defense. Summary of the National Defense Strategy; Department of Defense: Washington, DC, USA, 2018.
- Zeihan, P. Disunited Nations: The Scramble for Power in an Ungoverned World; Harper Business: New York, NY, USA, 2020. [Google Scholar]
- Wischnath, G.; Bahaug, H. Rice or riots: On food production and conflict severity across India. Political Geogr. 2014, 43, 6–15. [Google Scholar] [CrossRef]
- Huang, J.; Zhang, G.; Zhang, Y.; Guan, X.; Wei, Y.; Guo, R. Global desertification vulnerability to climate change and human activities. Land Degrad. Dev. 2020, 31, 1380–1391. [Google Scholar] [CrossRef]
- Whitmire, C.; Vance, J.; Rasheed, H.; Missaoui, A.; Rasheed, K.; Maier, F. Using Machine Learning and Feature Selection for Alfalfa Yield Prediction. AI 2021, 2, 71–88. [Google Scholar] [CrossRef]
- Wen, W.; Timmermans, J.; Chen, Q.; van Bodegom, P. A Review of Remote Sensing Challenges for Food Security with Respect to Salinity and Drought Threats. Remote Sens. 2020, 13, 6. [Google Scholar] [CrossRef]
- Sousa, D.; Small, C. Mapping and Monitoring Rice Agriculture with Multisensor Temporal Mixture Models. Remote Sens. 2019, 11, 181. [Google Scholar] [CrossRef]
- Andree, B.P.; Chamorro, A.; Kraay, A.; Spencer, P.; Wang, D. Predicting Food Crises. Policy Research Working Paper; no 9412. Available online: https://openknowledge.worldbank.org/handle/10986/34510 (accessed on 16 December 2020).
- Moscato, V.; Picariello, A.; Sperlí, G. A benchmark of machine learning approaches for credit score prediction. Expert Syst. Appl. 2021, 165, 113986. [Google Scholar] [CrossRef]
- Andree, B.P.; Chamorro, A.; Kraay, A.; Spencer, P.; Wang, D. Afghanistan, Burkina Faso, Chad, Congo, Dem. Rep., Ethiopia, Guatemala, Haiti, Kenya, Malawi, Mali, Mauritania, Mozambique, Niger, Nigeria, Somal—Predicting Food Crises 2020, Dataset for reproducing working paper results. Available online: https://microdata.worldbank.org/index.php/catalog/3811/data-dictionary (accessed on 11 November 2020).
- Famine Early Warning Systems Network. Integrated Phase Classification. Available online: https://fews.net/IPC (accessed on 11 November 2020).
- National Aeronautics and Space Administration. Earth Observatory. 30 August 2000. Available online: https://earthobservatory.nasa.gov/features/MeasuringVegetation/measuring_vegetation_3.php (accessed on 27 January 2021).
- Belay, A.S.; Fenta, A.A.; Yenehun, A.; Nigate, F.; Tilahun, S.A.; Moges, M.M.; Dessie, M.; Adgo, E.; Nyssen, J.; Chen, M.; et al. Evaluation and Application of Multi-Source Satellite Rainfall Product CHIRPS to Assess Spatio-Temporal Rainfall Variability on Data-Sparse Western Margins of Ethiopian Highlands. Remote. Sens. 2019, 11, 2688. [Google Scholar] [CrossRef]
- US Geological Survey. Evapotranspiration and the Water Cycle. Available online: https://www.usgs.gov/special-topic/water-science-school/science/evapotranspiration-and-water-cycle?qt-science_center_objects=0#qt-science_center_objects (accessed on 11 May 2021).
- Kimenyi, M.S.; Mlbaku, J.M.; Moyo, N. Reconstituting Africa’s Failed States: The Case of Somalia. Soc. Res. 2010, 77, 1339–1366. [Google Scholar]
- INDDEX Project. Data4Diets: Building Blocks for Diet-Related Food Security Analysis. Tufts University, INDDEX Project. Available online: https://inddex.nutrition.tufts.edu/data4diets (accessed on 27 January 2021).
- Géron, A. Hands-On Machine Learning with Scikit-Learn and TensorFlow: Concepts, Tools, and Techniques to Build Intelligent Systems, 2nd ed.; O’Reilly Media, Inc.: Sebastopol, CA, USA, 2019. [Google Scholar]
- Han, Q.; Molinaro, C.; Picariello, A.; Sperli, G.; Subrahmanian, V.S.; Xiong, Y. Generating Fake Documents using Probabilistic Logic Graphs. IEEE Trans. Dependable Secur. Comput. 2021, 1. [Google Scholar] [CrossRef]


| Parameter | Range |
|---|---|
| Latitude (deg) | −91.931–71.456 |
| Longitude (deg) | −25.862–37.038 |
| Month | January–December |
| Year | 2007–2020 |
| Food assistance | 0 or 1 |
| Vegetation index (NVDI) | −0.043–0.86 |
| NVDI anomalies | −5496–3790 |
| Mean rainfall | 0.0–125.92 |
| Rain anomalies | −42.51–80.80 |
| Mean evapotranspiration | 0.0–47.90 |
| Evapotranspiration anomalies | −17.50–17.11 |
| Violent events (#) | 0.0–256 |
| Fatalities (#) | 0.0–2394 |
| Food price index | 0.20–139.0 |
| Population (#) | 2123–14,050,940 |
| Log(population) | 7.8–16.4 |
| Cropland percent (%) | 0.0–99.24 |
| Pastureland percent (%) | 0.0–99.60 |
| Ruggedness index | 134.9–1,046,065 |
| Log(ruggedness) | 1.3–13.9 |
| Area (sq. mi.) | 10.29–331,292 |
| Parameter | Specification |
|---|---|
| Neuron count | 5, 10, 30, 50, 100, 120, 150, 180, 200, 230, 250, 400 |
| Layer count | 0, 1, 2, 3 |
| L2 regularization λ | 0, 0.0001, 0.0005, 0.001, 0.01 |
| Batch size | 32, 64, 128, 512, 1024, 2048, 4096 for high batch |
| Epochs | 400–1000 (checkpointed) |
| Learning rate | 0.0001–0.1 |
| Model | p-Value | AUC | Precision | Recall | Accuracy | f1 |
|---|---|---|---|---|---|---|
| Full | 0.00 | 0.58 | 0.73 | 0.18 | 0.86 | 0.29 |
| p-Value Selection | 0.00 | 0.58 | 0.81 | 0.16 | 0.86 | 0.27 |
| RFE | 0.00 | 0.58 | 0.81 | 0.16 | 0.86 | 0.27 |
| Select k-best | 0.00 | 0.59 | 0.75 | 0.20 | 0.87 | 0.32 |
| Chance | -- | 0.50 | 0.15 | 0.50 | 0.50 | 0.23 |
| Always predicts crisis | -- | -- | 0.15 | -- | 0.15 | -- |
| Never predicts crisis | -- | -- | -- | -- | 0.85 | -- |
| Goal/prior work (Andree, Chamorro, Kraay, Spencer, and Wang, Predicting Food Crises. Policy Research Working Paper; no 9412, 2020) | -- | -- | 0.36 | 0.84 | 0.91 | 0.50 |
| Neuron | Layer | L2 | Learn Rate | Batch Size | f1all | f1test | f1hold |
|---|---|---|---|---|---|---|---|
| 150 | 2 | 1 × 10⁻⁴ | 0.004 | 1024 | 0.942 | 0.838 | 0.818 |
| 250 | 2 | 1 × 10⁻⁴ | 0.002 | 1024 | 0.932 | 0.839 | 0.830 |
| 200 | 1 | 1 × 10⁻⁴ | 0.002 | 512 | 0.922 | 0.841 | 0.831 |
| 200 | 1 | 5 × 10⁻⁴ | 0.002 | 512 | 0.918 | 0.838 | 0.836 |
| 100 | 2 | 1 × 10⁻³ | 5 × 10⁻⁴ | 256 | 0.897 | 0.841 | 0.822 |
| 100 | 2 | 5 × 10⁻⁴ | 0.002 | 256 | 0.876 | 0.838 | 0.831 |
| 100 | 1 | 1 × 10⁻⁴ | 0.004 | 128 | 0.872 | 0.846 | 0.824 |
| 200 | 1 | 1 × 10⁻⁴ | 0.004 | 1024 | 0.868 | 0.838 | 0.827 |
| Dataset | AUC | Precision | Recall | Accuracy |
|---|---|---|---|---|
| Entire | 0.98 | 0.95 | 0.92 | 0.97 |
| Test | 0.94 | 0.86 | 0.82 | 0.92 |
| Holdout | 0.94 | 0.85 | 0.81 | 0.92 |
| Model | AUC | Precision | Recall | Accuracy | f1 |
|---|---|---|---|---|---|
| Iteration 1: Baseline | 0.76 | 0.64 | 0.71 | 0.90 | 0.67 |
| Iteration 2: Single HP | 0.82 | 0.64 | 0.71 | 0.89 | 0.67 |
| Iteration 3: Multiple HP | 0.95 | 0.90 | 0.85 | 0.94 | 0.87 |
| Iteration 4: Tapered stack | 0.94 | 0.87 | 0.82 | 0.92 | 0.84 |
| Iteration 5: No Year | 0.94 | 0.86 | 0.82 | 0.92 | 0.84 |
| Prior work/goal [10] | -- | 0.36 | 0.84 | 0.91 | 0.50 |
Publisher’s Note: MDPI stays neutral with regard to jurisdictional claims in published maps and institutional affiliations. |
© 2021 by the authors. Licensee MDPI, Basel, Switzerland. This article is an open access article distributed under the terms and conditions of the Creative Commons Attribution (CC BY) license (https://creativecommons.org/licenses/by/4.0/).
Share and Cite
Christensen, C.; Wagner, T.; Langhals, B. Year-Independent Prediction of Food Insecurity Using Classical and Neural Network Machine Learning Methods. AI 2021, 2, 244-260. https://doi.org/10.3390/ai2020015
Christensen C, Wagner T, Langhals B. Year-Independent Prediction of Food Insecurity Using Classical and Neural Network Machine Learning Methods. AI. 2021; 2(2):244-260. https://doi.org/10.3390/ai2020015
Chicago/Turabian StyleChristensen, Cade, Torrey Wagner, and Brent Langhals. 2021. "Year-Independent Prediction of Food Insecurity Using Classical and Neural Network Machine Learning Methods" AI 2, no. 2: 244-260. https://doi.org/10.3390/ai2020015
APA StyleChristensen, C., Wagner, T., & Langhals, B. (2021). Year-Independent Prediction of Food Insecurity Using Classical and Neural Network Machine Learning Methods. AI, 2(2), 244-260. https://doi.org/10.3390/ai2020015