Article

A Deep Learning Approach to Detect COVID-19 Patients from Chest X-ray Images †

by
Khandaker Foysal Haque
* and
Ahmed Abdelgawad
College of Science and Engineering, Central Michigan University, Mount Pleasant, MI 48859, USA
*
Author to whom correspondence should be addressed.
This paper is an extended version of our paper published in: Haque, K.F.; Haque, F.F.; Gandy, L.; Abdelgawad, A. Automatic Detection of COVID-19 from Chest X-ray Images with Convolutional Neural Networks. In Proceedings of the 3rd IEEE International Conference on Computing, Electronics & Communications Engineering, University of Essex, Southend Campus, Southend, UK, 17–18 August 2020.
AI 2020, 1(3), 418-435; https://doi.org/10.3390/ai1030027
Submission received: 13 August 2020 / Revised: 8 September 2020 / Accepted: 12 September 2020 / Published: 22 September 2020
(This article belongs to the Section Medical & Healthcare AI)

Abstract

:
Deep Learning has improved multi-fold in recent years and it has been playing a great role in image classification which also includes medical imaging. Convolutional Neural Networks (CNNs) have been performing well in detecting many diseases including coronary artery disease, malaria, Alzheimer’s disease, different dental diseases, and Parkinson’s disease. Like other cases, CNN has a substantial prospect in detecting COVID-19 patients with medical images like chest X-rays and CTs. Coronavirus or COVID-19 has been declared a global pandemic by the World Health Organization (WHO). As of 8 August 2020, the total COVID-19 confirmed cases are 19.18 M and deaths are 0.716 M worldwide. Detecting Coronavirus positive patients is very important in preventing the spread of this virus. On this conquest, a CNN model is proposed to detect COVID-19 patients from chest X-ray images. Two more CNN models with different number of convolution layers and three other models based on pretrained ResNet50, VGG-16 and VGG-19 are evaluated with comparative analytical analysis. All six models are trained and validated with Dataset 1 and Dataset 2. Dataset 1 has 201 normal and 201 COVID-19 chest X-rays whereas Dataset 2 is comparatively larger with 659 normal and 295 COVID-19 chest X-ray images. The proposed model performs with an accuracy of 98.3% and a precision of 96.72% with Dataset 2. This model gives the Receiver Operating Characteristic (ROC) curve area of 0.983 and F1-score of 98.3 with Dataset 2. Moreover, this work shows a comparative analysis of how change in convolutional layers and increase in dataset affect classifying performances.

1. Introduction

Deep Learning (DL) is a branch of Machine Learning (ML) which is inspired by the working procedure of the human brain. DL has the capability of unsupervised learning, i.e., to learn from the examples with unlabeled data. The features like unlabeled data utilization, working without feature engineering, and prediction with high accuracy and precision make DL very popular with Artificial Intelligence (AI) and Big Data analysis [1,2]. DL has been vastly used in industries, self driven cars, face recognition, object detection, image classification and in many other fields [3]. Convolutional Neural Network (CNN) is a DL algorithm which has been performing very well in solving problems like document analysis, different sorts of image classification, pose detection and action recognition [4]. Medical imaging is another field where CNN has been showing promising results in recent years [5].
CNN is an Artificial Neural Network (ANN) based deep learning algorithm which has grown significantly in recent times [6,7,8]. CNN is based on the principle of human nervous system specially human brains which is formed of billions of neurons. Idea of artificial neuron is first conceptualized in 1943 [9,10]. Hubel and Wisel first found that for detecting lights in the receptive fields, visual cortex cells has a major role which greatly inspired building models like neocognitron [11]. This model is considered to be the base and predecessor of CNN. CNN is formed of artificial neurons which have the property of self optimization with learning like the brain neurons. Due to this self optimizing property, it can extract and classify the features extracted from images more precisely than any other algorithm. Moreover, it needs very limited preprocessing of the input data though it yields highly accurate and precise results. CNN is vastly used in object detection and image classification including medical imaging. Alexnet, ZFNet, VGGNet are a few prominent CNN models for image classification which perform really well in practical scenarios [12,13,14].
The world has been suffering the formidable outbreak of the novel Coronavirus which was first detected in December 2019. This creates a respiratory infectious disease which has been emerging and spreading very fast causing a real threat to the public health. Transmission rate and mode of transmission are very important factors for any contagious disease like COVID-19. According to the World Health Organization (WHO), respiratory droplets of size greater than 5–10 μm acts as a mode of transmission which potentially involve airborne transmission [15]. This creates an alarming threat to the public health as interaction without necessary safety measures can be highly contagious. So, this disease poses a high growth factor with an estimated fatality rate of 2–5% [16]. According to WHO, to the date of 8 August 2020, the worldwide total confirmed COVID-19 cases is 19.18 M with the fatality of 0.716 M [17]. Figure 1, shows the time-series graph of total confirmed cases and deaths over the time to the date. It shows that this spreads very fast with geometric progression. This graph shows the severity of the situation. The number of confirmed cases were only 41 on 11 January 2020 which increased almost 1000 times to 43,109 in 1 month (11 February 2020). This disease spread fast in the next 3 months taking the confirmed cases count to 4.04 M on 11 May 2020 which is almost 94 times the count on 11 February 2020. Even after taking so many precautions of wearing masks and maintaining social distancing, the affected patient count increased 3 times in the next 2 months taking the count to 12.32 M on 11 July 2020. It is a matter of hope that the growth factor is decreasing day by day due to mass consciousness. Early detection of COVID-19 patients is one of the most important aspects to limit the spread of this virus. WHO listed a few rapid and detailed diagnostic tests for COVID-19 detection including genesig Real-Time PCR Coronavirus (COVID-19) testing and cobas SARS-CoV-2 for use on the cobas 6800/8800 systems [17,18,19]. These tests take a lot of time and money whereas CNN can play a major role in automatic positive patient detection. This can save both time and money which will eventually save lives. Moreover, this can add an extra layer of validation as none of the prevailing tests offer 100% accuracy.
CNN has been performing really well with medical imaging. For recent years, it has been used vastly for a different disease or anomaly detection [20,21]. CNN does the diagnosis of Coronary Artery Disease (CAD), recognition of stages from bright-field microscopy images of malaria-infected blood and detection of Parkinson’s disease from electroencephalogram (EEG) signals [22,23,24]. Researchers have also proposed different CNN models to classify dental images, detect skin diseases, the study of Alzheimer’s disease, and many other diseases [25,26,27,28]. CNN can also play a great role in COVID-19 detection from CT or X-ray images.
In this paper, a CNN model is proposed to detect COVID-19 positive patients from chest X-ray images. With very little time and resources, this model successfully detects Coronavirus patients with high accuracy. This work also includes the comparative analytical analysis of the CNN models in detecting COVID-19. This can help to implement testing of COVID-19 on a much greater scale which would really save both money and time.
Related works are described in Section 2, proposed and pretrained models are presented in Section 3, Results and Comparative Analysis are depicted in Section 4 and lastly Section 5 concludes the paper.

2. Related Works

Extensive research work is going on for classifying COVID-19 patient image data. Few researchers have proposed different DL models for classifying chest X-ray images whereas some others have taken CT images into consideration. Narin et al. proposed three pretrained CNN models based on ResNet50, InceptionV3 and Inception-ResNetV2 for detecting COVID-19 patient from chest X-ray radiographs [29]. It is found that ResNet 50 gives a classifying accuracy of 98% whereas InceptionV3 and Inception-ResNetV2 perform with the accuracy of 97% and 87% respectively. However, these models have taken only 100 images (50 COVID-19 and 50 normal Chest X-rays) into consideration for training which might result in declined accuracy for a higher number of training images. Zhang et al. propose a DL model for Coronavirus patient screening using their chest X-ray images [30]. This research group has used 100 chest X-ray images of 70 COVID-19 patients and 1431 X-ray images of other pneumonia patients where they are classified as COVID-19 and non-COVID-19 respectively. This model is formed of three main parts: backbone networks, classification head, and anomaly detection head. The backbone network is a 18 residual CNN layer pre-trained on ImageNet dataset and it is mentionable that ImageNet provides a huge generalized dataset for image classifications. This model can diagnose COVID-19 and non-COVID-19 patients with an accuracy of 96% and 70.65% respectively. Hall et al. also worked on finding COVID-19 patients from a small set of chest X-ray images with DL [31]. They have used pre-trained ResNet50 which generates the overall accuracy of 89.2%. Sethy and Behea have also utilized deep features for Coronavirus disease detection [32]. Their model is based on ResNet50 plus SVM which achieved an accuracy and F1-score of 95.38% and 91.41% respectively. Apostolopoulos and Mpesiana utilized CNN transfer learning for detecting COVID-19 with X-ray images [33]. This work has considered 224 chest X-ray images of COVID-19 infected people, 714 images with Pneumonia and 504 images of normal people for training their model. This model achieved an accuracy of 96.78% and sensitivity and specificity of 98.66% and 96.46% respectively. Li et al. used the patients’ chest CT images for detecting COVID-19 with the developed CNN architecture called COVNet [34]. This research group has obtained sensitivity, specificity and Area Under the Receiver Operating Curve (AUC) of 90%, 96% and 0.96 respectively. Islam et al. proposed a DL model based on CNN and long short-term memory (LSTM) [35]. This work classifies the dataset into three categories—normal, COVID-19 and pneumonia with 1525 X-ray images in each of those categories. This CNN-LSTM based model achieved an over all accuracy of 99.4% and F1-score of 98.9. Hemdan et al. introduced a deep learning framework naming COVIDX-Net to classify COVID-19 X-ray images [36]. This model is based on only 25 chest X-ray images in each of the classes—normal and Covid-19. For classifying the images this model uses seven different pre-trained models—VGG19, DenseNet121, InceptionV3, ResNetV2, Inception-ResNetV2, Xception, MobileNetV2 [14,37,38,39,40,41,42,43]. This research group has achieved the best performances from VGG19 with an overall accuracy of 90% and F1-score of 90.94. Chowdhury et al. used transfer learning with image augmentation to detect COVID-19 from chest X-ray images [44]. This work does the classification in two different scheme—(i) COVID-19 and normal and (ii) COVID-19, viral pneumonia and COVID-19. They have used 423 COVID-19, 1485 viral pneumonia, and 1579 normal chest X-ray images respectively for training and validation. This group achieved an excellent result with binary classification with accuracy and F1-score of 99.70% and 99.70 respectively. Ozturk et al. also does the binary and multi-class classification with their proposed DarkCovidNet model which is based on Darknet-19 model [45]. This model has used 500 normal and 127 COVID-19 chest X-ray images for training and validation of their model. For binary classification, this model has achieved an average overall accuracy of 98.08% whereas it is decreased to 87.02% in case of multi-class classification. Abbas et al. used Decompose, Transfer, and Compose (DeTraC) which is a deep CNN for classifying COVID-19 positive images. It has used used 80 normal and 105 COVID-19 chest X-ray images with image augmentation for training and validating the model. This model obtained the accuracy of 95.12%. Haghanifar et al., Khan et al., Afshar et al., Wang et al., and Minaee et al. also worked on detecting COVID-19 from chest X-ray images with deep learning in [46,47,48,49,50]. Other researchers have also put an effort to detect COVID-19 patient from CT scans in [51,52].
Most of the discussed research works in detecting COVID-19 use pretrained models for their model architecture. These models are pretrained on more generalized dataset like ImageNet. Here, a sequential CNN model is proposed that is computationally efficient due to its simplicity in architecture and this is trained from scratch with the relevant dataset. Moreover, this model is trained and validated with a smaller dataset as in [53] and also with a comparatively larger dataset to analyze how the model performs with increase in dataset and change in convolutional layers which is novel as per the discussed literature.

3. Proposed CNN Model for COVID-19 Detection

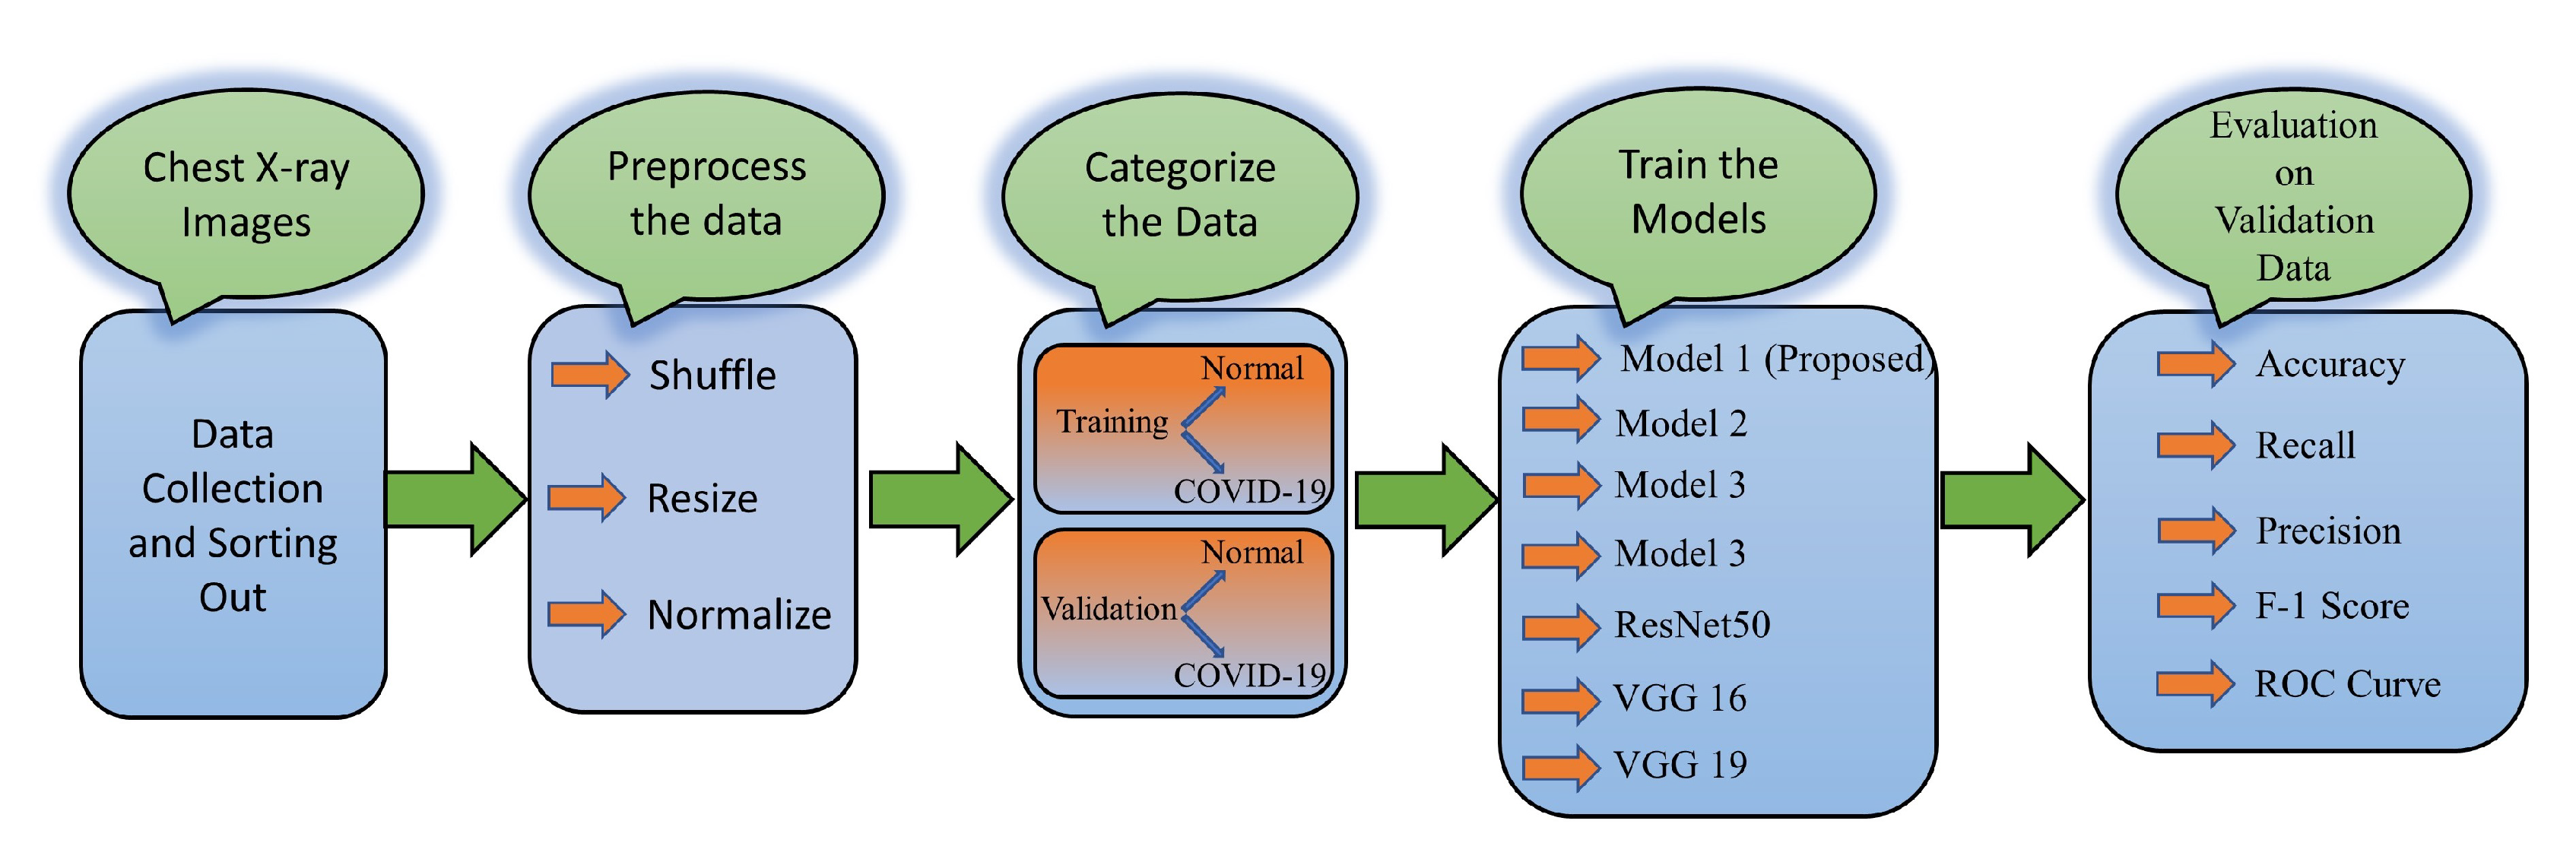
The whole system for detection of COVID-19 from chest X-ray images comprised of few important steps—collection of dataset, pre-processing the data, categorization of dataset, training the models and evaluation and analysis of the model. The complete system architecture of the for detecting COVID-19 with CNN is depicted in Figure 2. At first the dataset needed for training and validating the model is collected and sorted out. The collected data are then shuffled, resized and normalized to maintain the uniformity. After this step, all the data are categorize according to the classification of the model. Then all the models are trained and validated with the same dataset and same environment. Lastly the trained models are analyzed based on few important metrics like accuracy, recall, precision, F-1 score, ROC curve. The next part of this section discuss the dataset modeling and proposed CNN modeling in details.

3.1. Dataset Collection and Modeling

For training and validating the models, 201 chest X-ray images of COVID-19 patients are used which are obtained from open Github repository by Cohen et al. [54]. This repository contains patients’ chest X-ray images of COVID-19, SARS, ARDS, pneumocystis, streptococcus, chlamydophila, E. coli, legionella, varicella, lipoid, bacterial, pneumonia, mycoplasma bacterial pneumonia, klebsiella and influenza. For training, only the COVID-19 positive X-rays are taken into consideration where the patients’ ages range from 12–93 years. The training also needs the normal or non-COVID-19 chest X-rays which is obtained from Kaggle dataset naming “Chest X-ray Images (Pneumonia)” [55]. This repository contains 5863 images in two categories—normal and Pneumonia. However, we have taken 201 (same number as the COVID-19 chest X-ray images) normal chest X-ray images for the training and validating purposes. The whole dataset is primarily split into two categories: training and validation maintaining the ratio of 80% and 20% respectively. Each group of the training and validation dataset contains two subcategories: ‘normal’ and ‘COVID-19’, containing the respective types of X-ray images. So, for the training, both the categories—‘normal’ and ‘COVID-19’ contain 161 chest X-ray images each whereas, the validation dataset contains 40 images for each of the ‘normal’ and ‘COVID-19’ sub-categories. This is termed as Dataset 1 for the rest of the paper.
Another COVID-19 chest X-ray dataset is created by combining the Github repositories [54,56]. A dataset of 295 COVID-19 chest X-ray images are created which is used for training and validation of the model. Similarly, a larger dataset of 659 normal chest X-ray images are collected randomly from [55]. This whole dataset is divided into training and validation set. The training dataset contains 236 COVID-19 and 600 normal chest X-ray images. On the contrary, the validation set contains 59 chest X-ray images for each of the categories: COVID-19 and normal thus keeping the balance of the data for performance analysis. This whole dataset contains 954 chest X-ray images divided in to two classes and this is termed as Dataset 2. Table 1 depicts the categorization of Dataset 1 and Dataset 2.
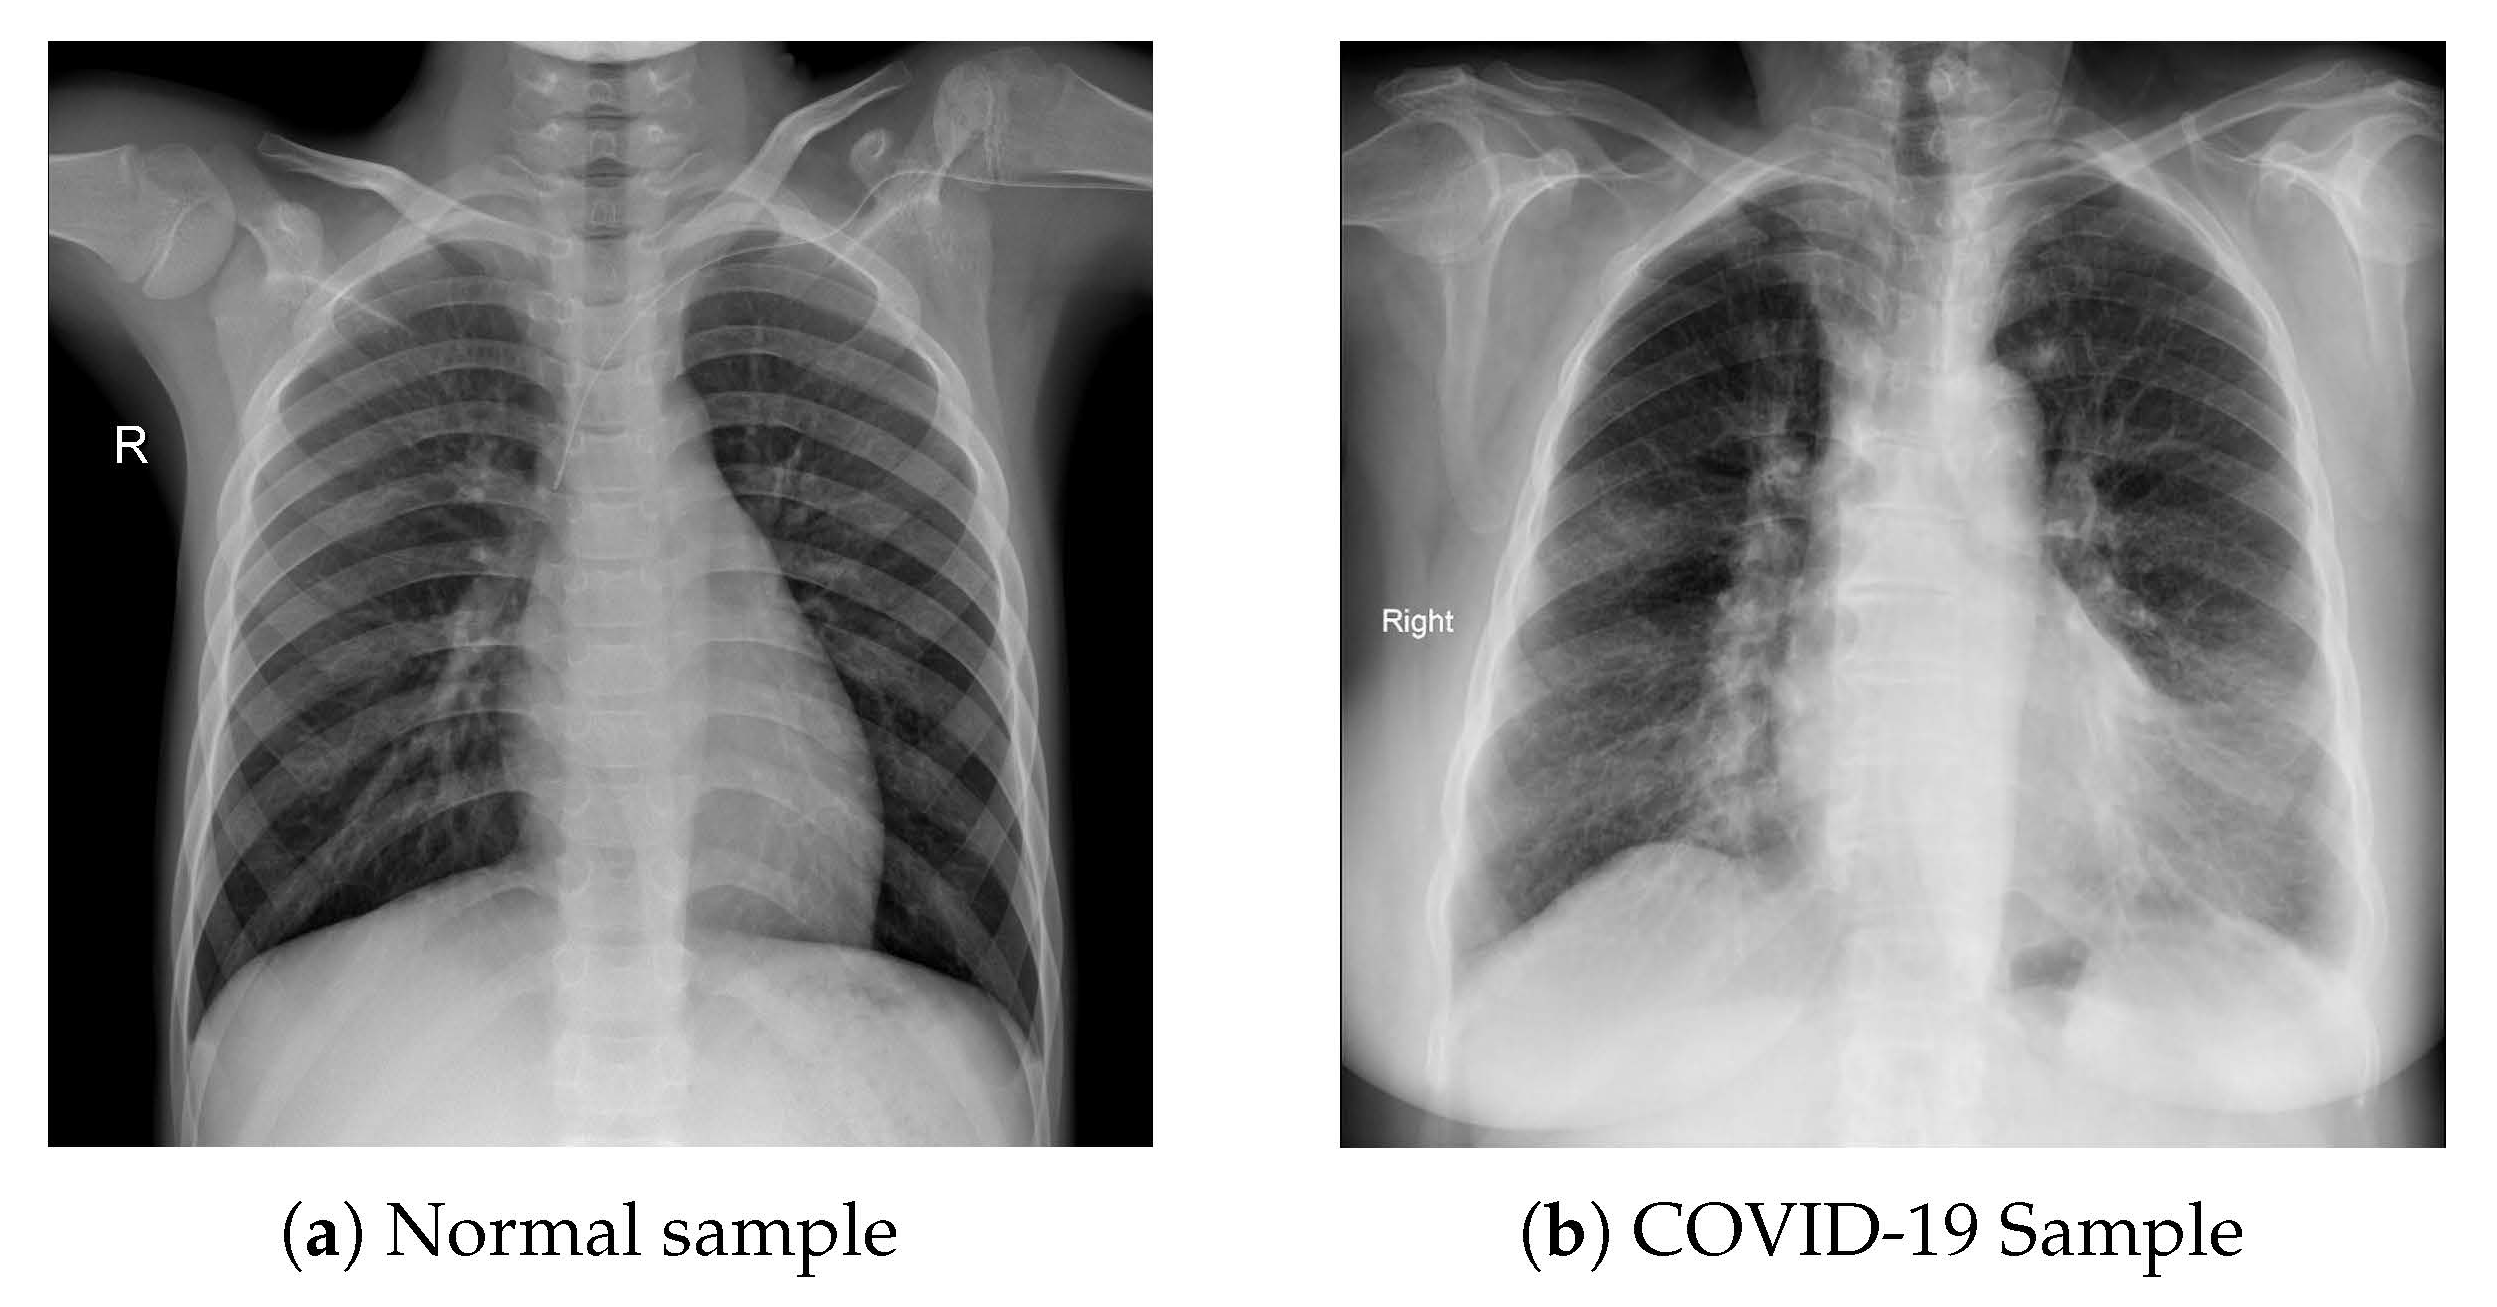
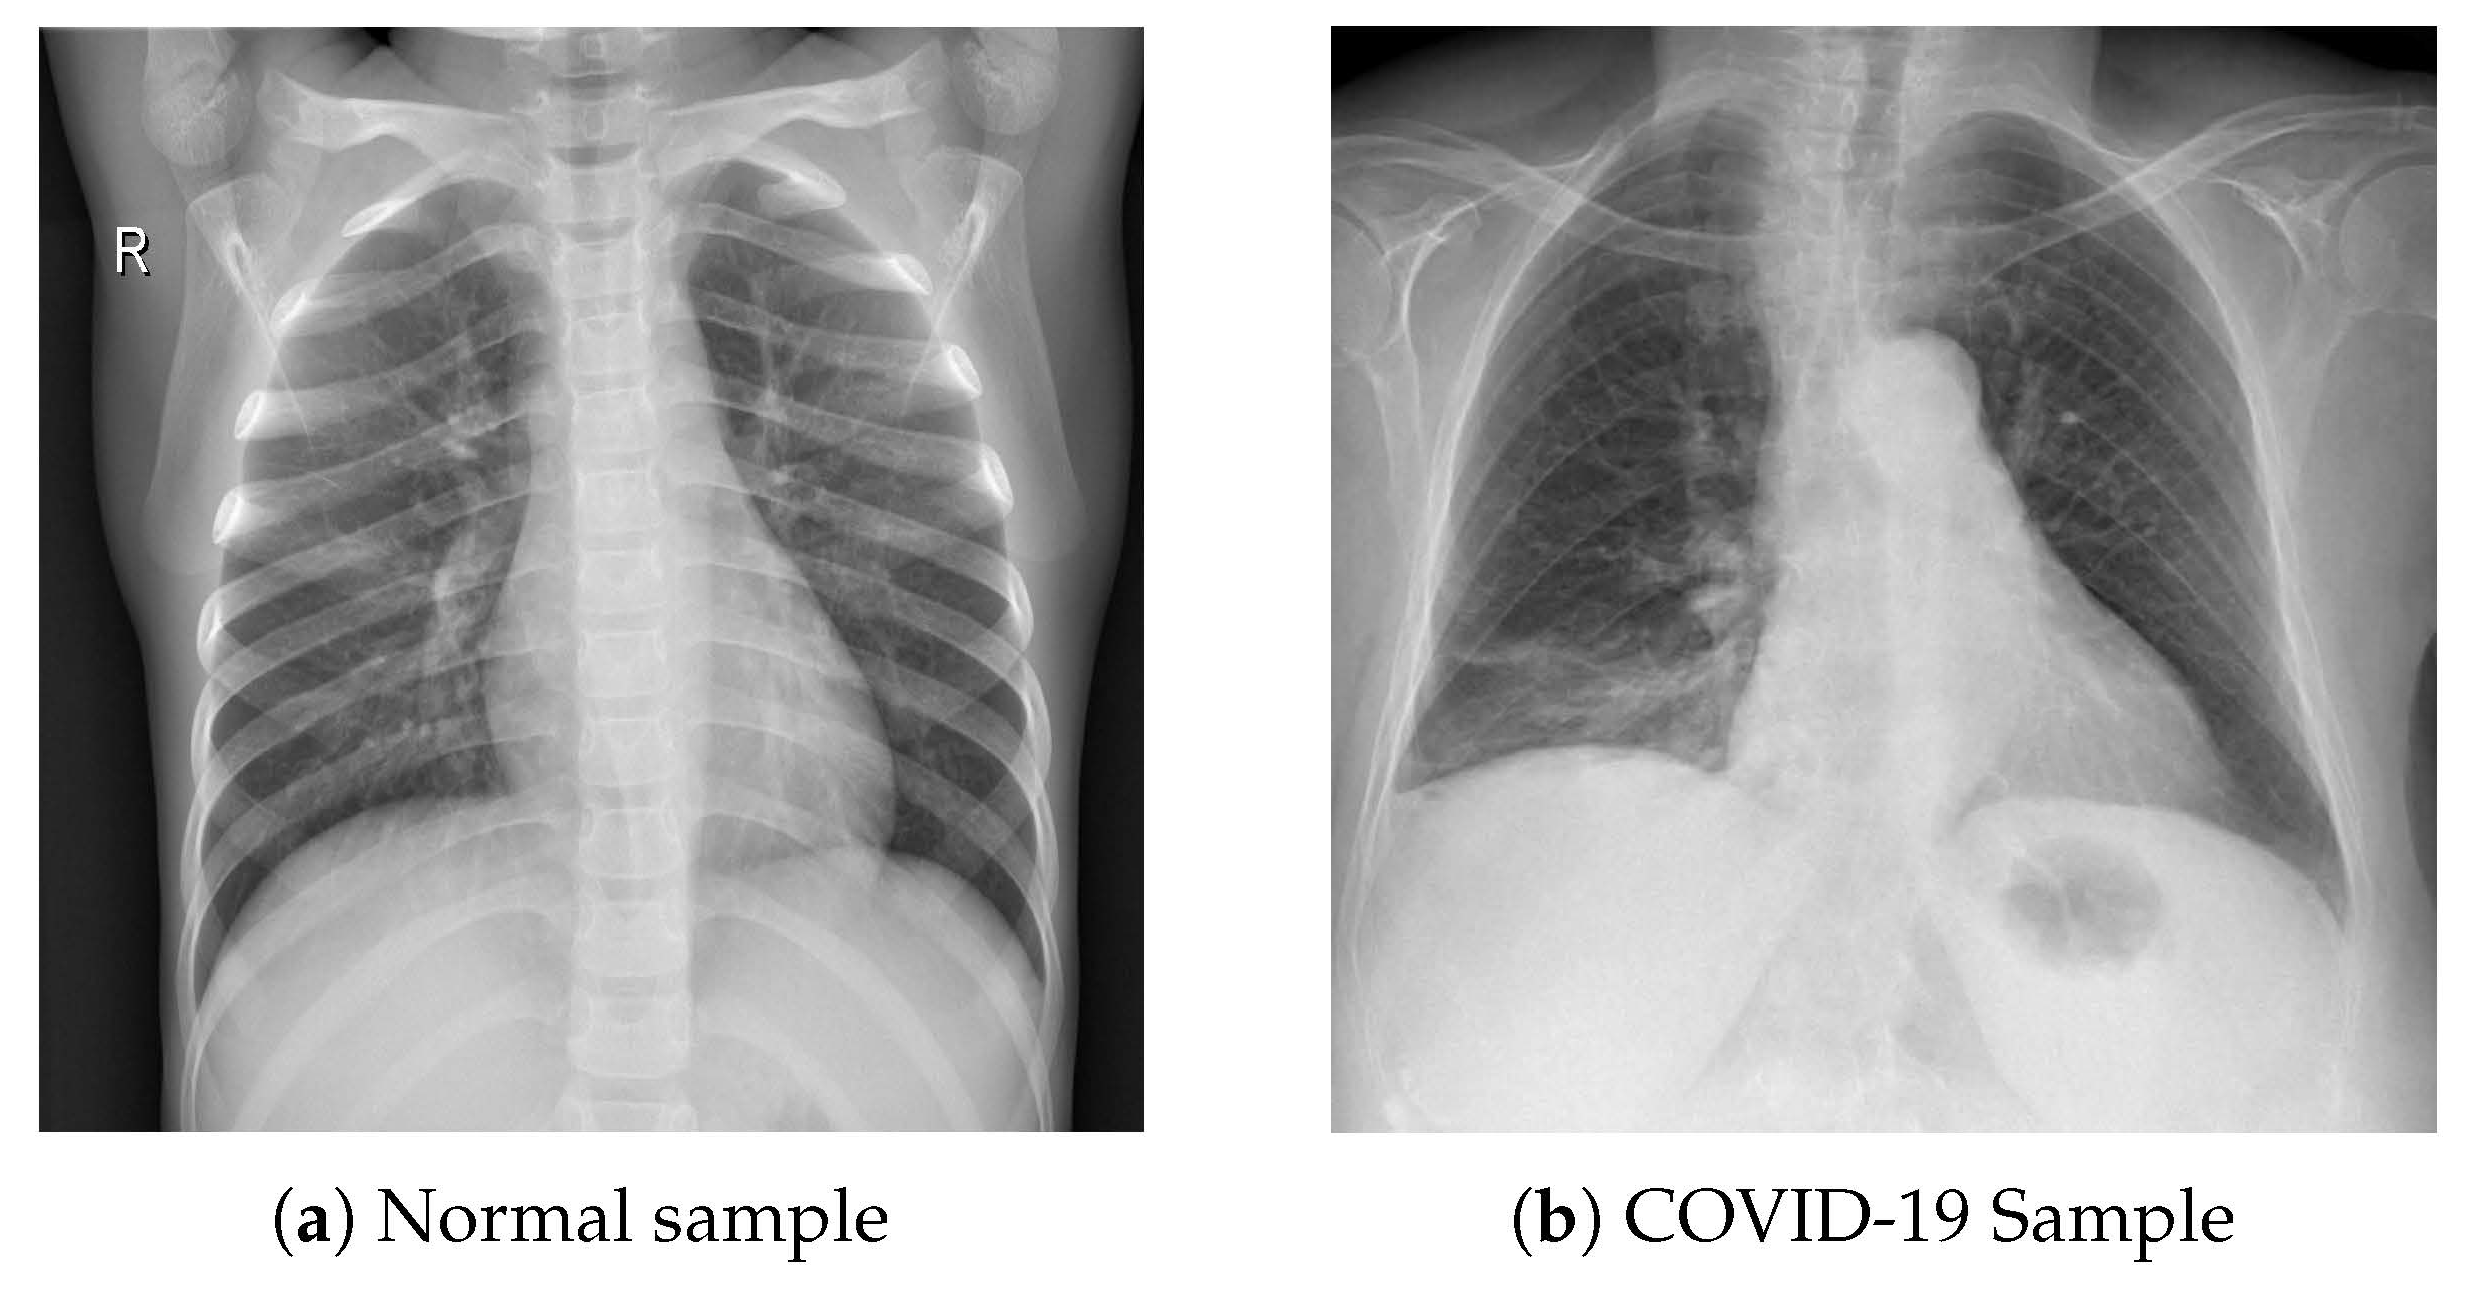
For maintaining uniformity and the image quality at the same time, all the images are converted to 224 × 224 pixels. Moreover, all the X-ray images that are used for training and validation of the model are in Posteroanterior (PA) chest view. Figure 3 and Figure 4 present the sample of PA views of the X-ray images of both COVID-19 positive and Normal cases from the training and validation dataset respectively. All the models are trained and validated based on these two datasets and their performances are analyzed to observe how they perform with the increase in number of dataset.

3.2. CNN Modeling

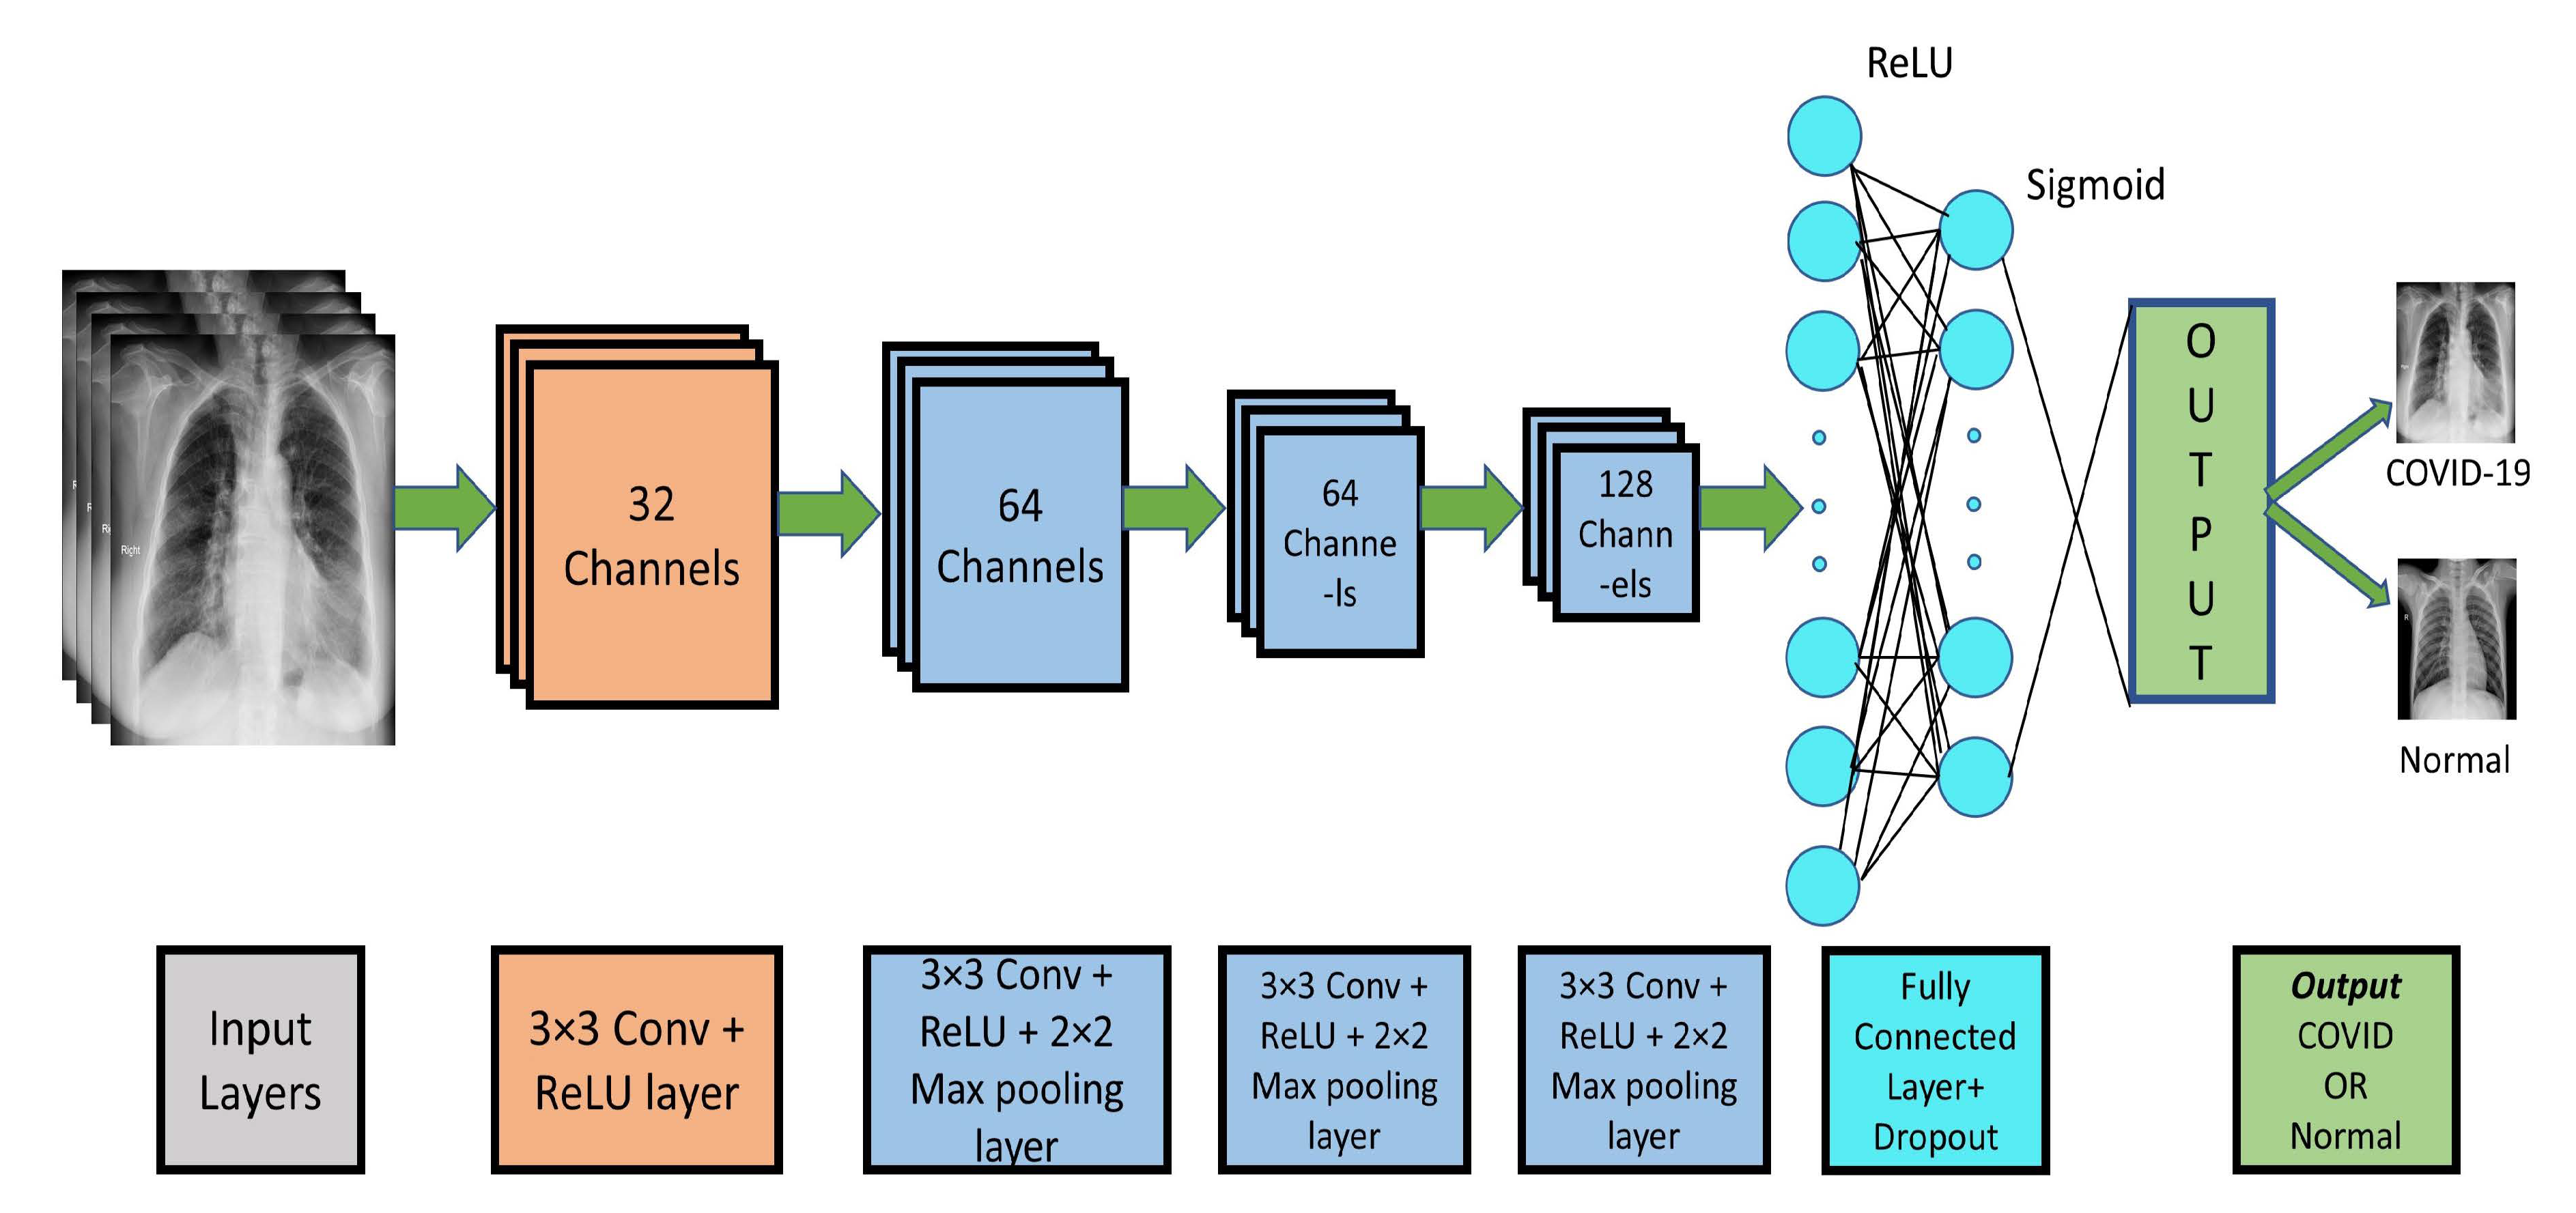
CNN has been playing a great role in classifying images, in particular medical images. This has opened new windows of opportunities and made the disease detection much more convenient. It also successfully detects recent novel Coronavirus with higher accuracy. One of the constraints that researchers encounter is a limited dataset for training their model. Being a novel disease, the chest X-ray dataset of COVID-19 positive patients is also limited. Therefore, to avoid overfitting, a sequential CNN model is proposed as in authors’ earlier work of [53] for classifying X-ray images. Figure 5 depicts the proposed CNN model for COVID-19 detection. This model has 4 main components: (i) input layers (ii) convolutional layers (iii) fully connected layers and (iv) output layers.
The tuned data set is fed into the input layers of the model. It has four convolutional layers, first one is a 2D convolutional layer with 3 × 3 kernels and Rectified Linear Unit (ReLU) activation function. ReLU is one of the most popular and effective activation functions that are being widely used in DL. ReLU does not activate all the neurons at the same time making it computationally efficient in comparison to other activation functions like tanh.
The next three layers are 2D convolutional layer along with the ReLU activation function and Max pooling layer. Max pooling accumulates the features of the convolutional layer by convolving filters over it. It reduces the computational cost as it minimizes the number of parameters thus it helps to avoid overfitting. In each of three layers a 2 × 2 Max pooling layer is added after the convolutional layer to avoid overfitting and to make the model computationally efficient. In the next step of the model, the output of the convolutional layers is converted to a long 1D feature vector by a flatten layer. This output from the flatten layer is feed to the fully connected layer with dropout. In a fully connected layer, every input neuron is connected to every activation unit of the next layer. All the input features are passed through the ReLU activation function and this layer categorizes the images to the assigned labels. The Sigmoid activation function makes the classification decision depending on the classification label of the neurons. Finally, in the output layer, it is declared if the input X-ray image is COVID-19 positive or normal. This model is termed as ‘Model 1’.
For comparative analysis, two more CNN models are also developed with 3 and 5 convolution layers instead of the 4 layers of the Model 1. These models with 3 and 5 convolution layers are termed as ‘Model 2’ and ‘Model 3’ respectively. Model 2 has one 3 × 3 convolution layer with ReLU having 32 channels and two more 3 × 3 convolution layers with ReLU and 2 × 2 Max Pooling layers having 64 channels each. Model 3 has a 3 × 3 convolution layer with ReLU and 2 × 2 Max Pooling having 128 channels as the fifth layer.
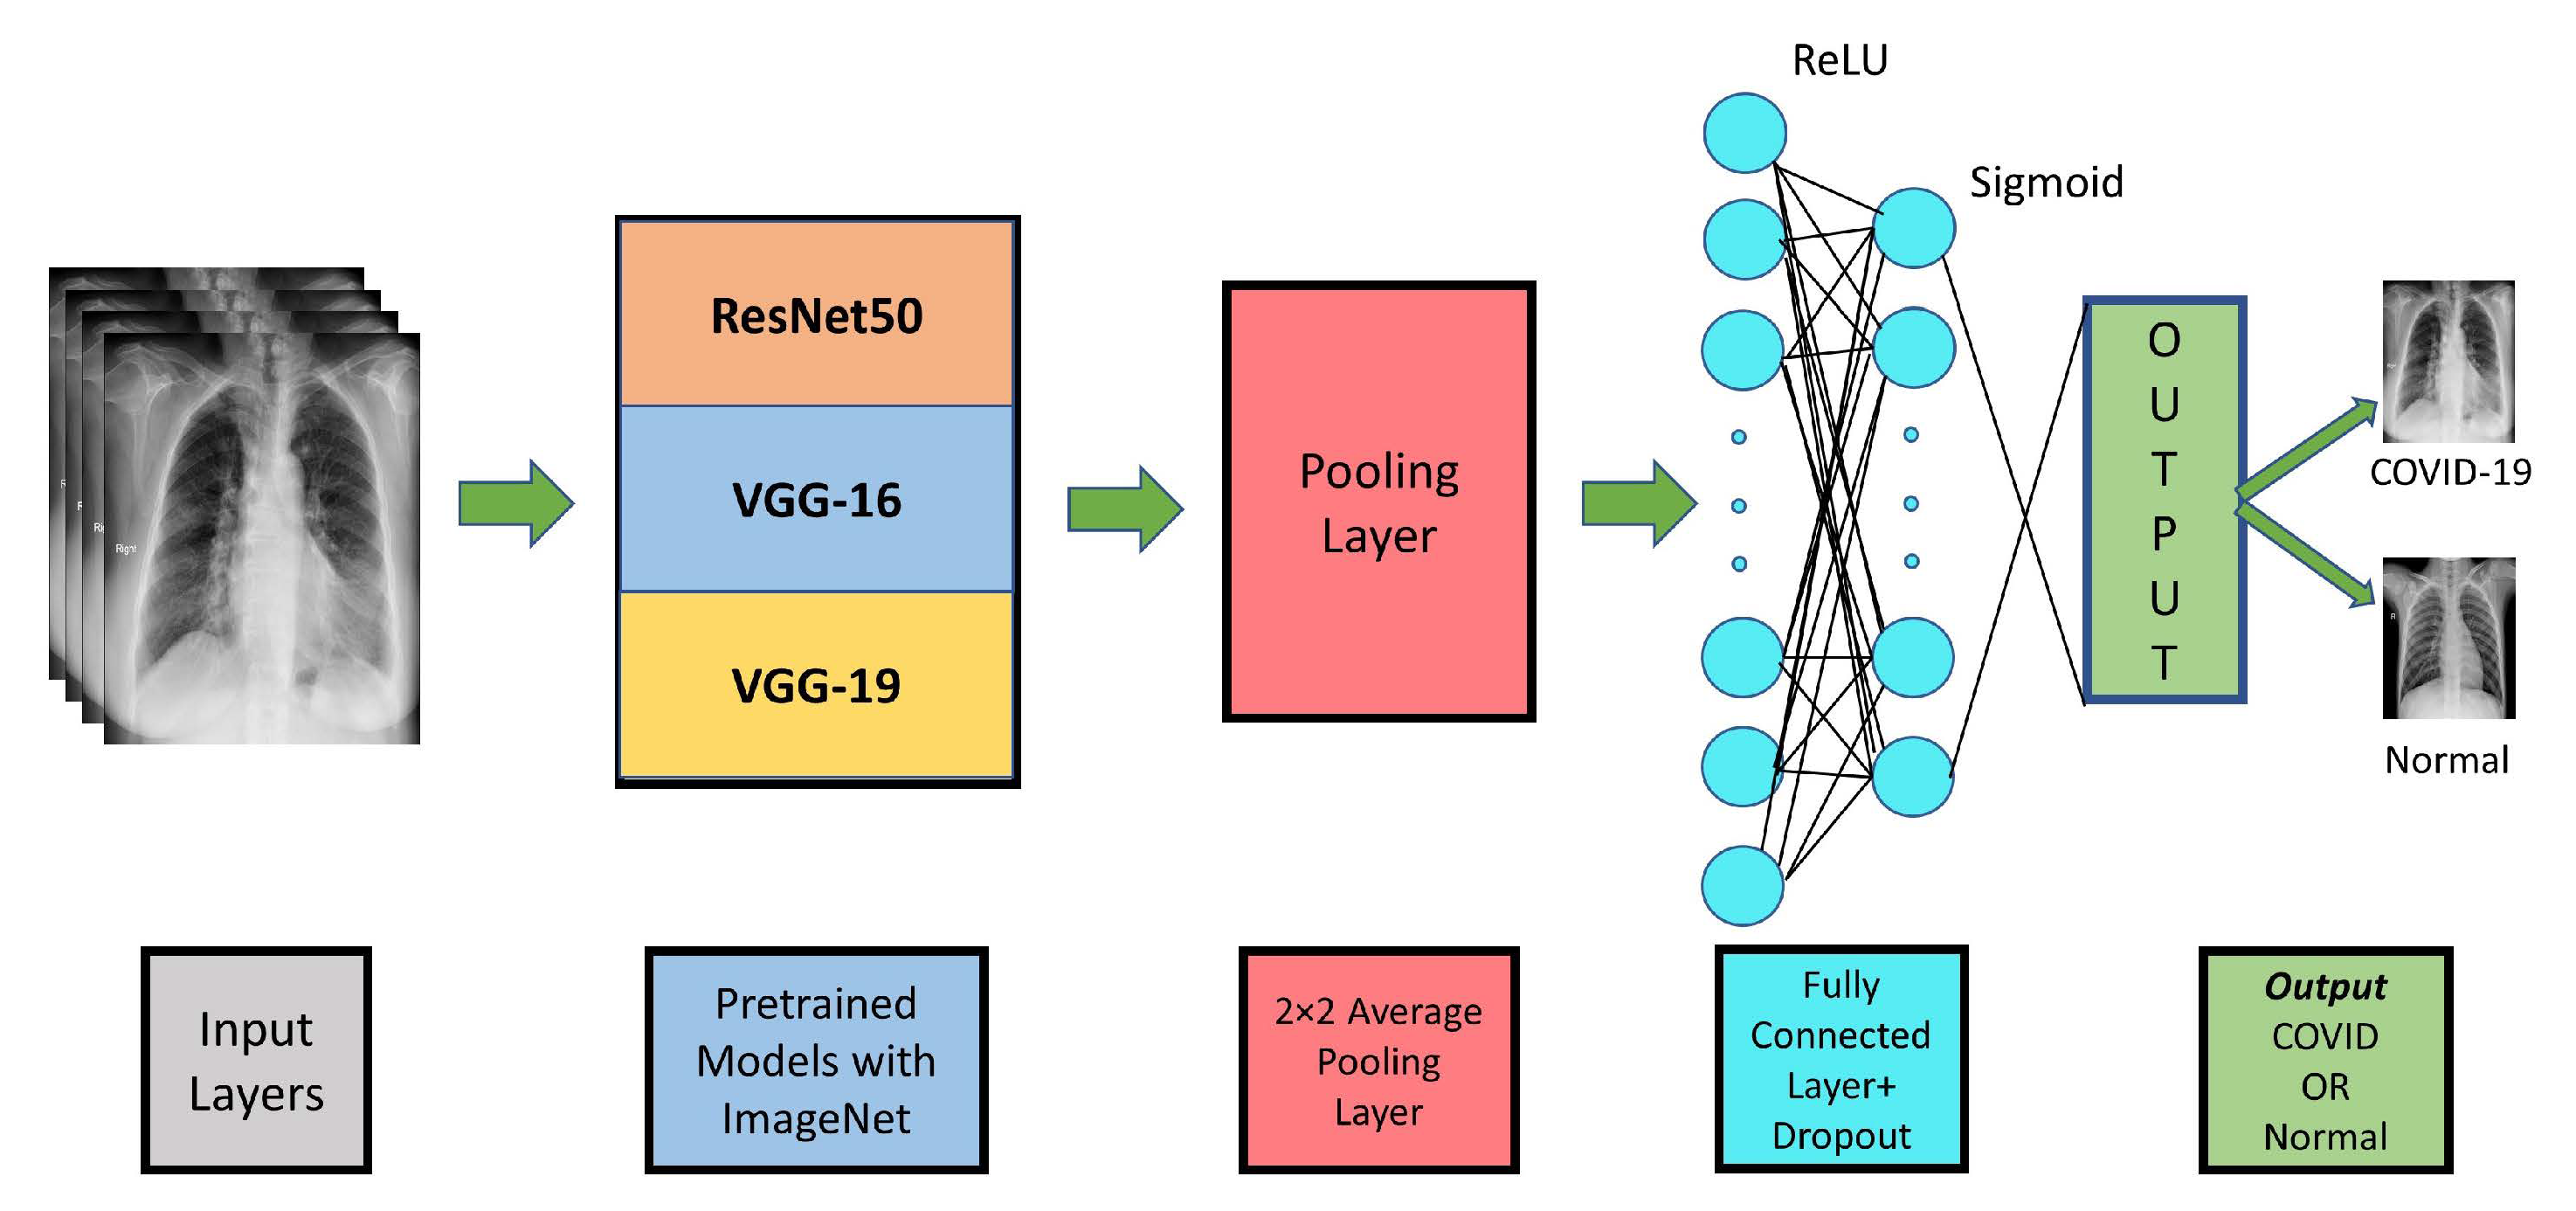
This work also takes few pretrained models into consideration in terms of their performance with COVID-19 image classification. Three pretrained models based on ResNet50, VGG-16 and VGG-19 are also developed and tuned to detect the COVID-19 cases from the same chest X-ray datasets [14,39]. ResNet is based on ImageNet and it has achieved excellent results with only 3.57% error. It has five stages each having one convolution and one identity block. Each of the convolution and identity blocks have 3 convolution layers. VGG-16 is a CNN model which is 16 layers deep as its name suggests. This is one of the most excellent CNN architecture for image classification. This model does not have a large number of hyper -parameters rather it use 3 × 3 convolution layers and 2 × 2 max pooling layer with stride of 1 and 2 respectively. The whole architecture is based on this consistent convolution and max pooling layer. VGG-19 is of the same architecture as VGG-16 except for VGG-19 has 19 deep layers instead of 16. The pretrained model of these three CNN architecture is used to extract features and outputs are feed to 2 × 2 average pooling layer. A flatten layer convert the outputs to a 1D feature vector. The output from the flatten layer is feed to the fully connected layer with dropout which has the same architecture as Model 1, Model 2 and Model 3. Figure 6 depicts the workflow diagram of the pretrained models.
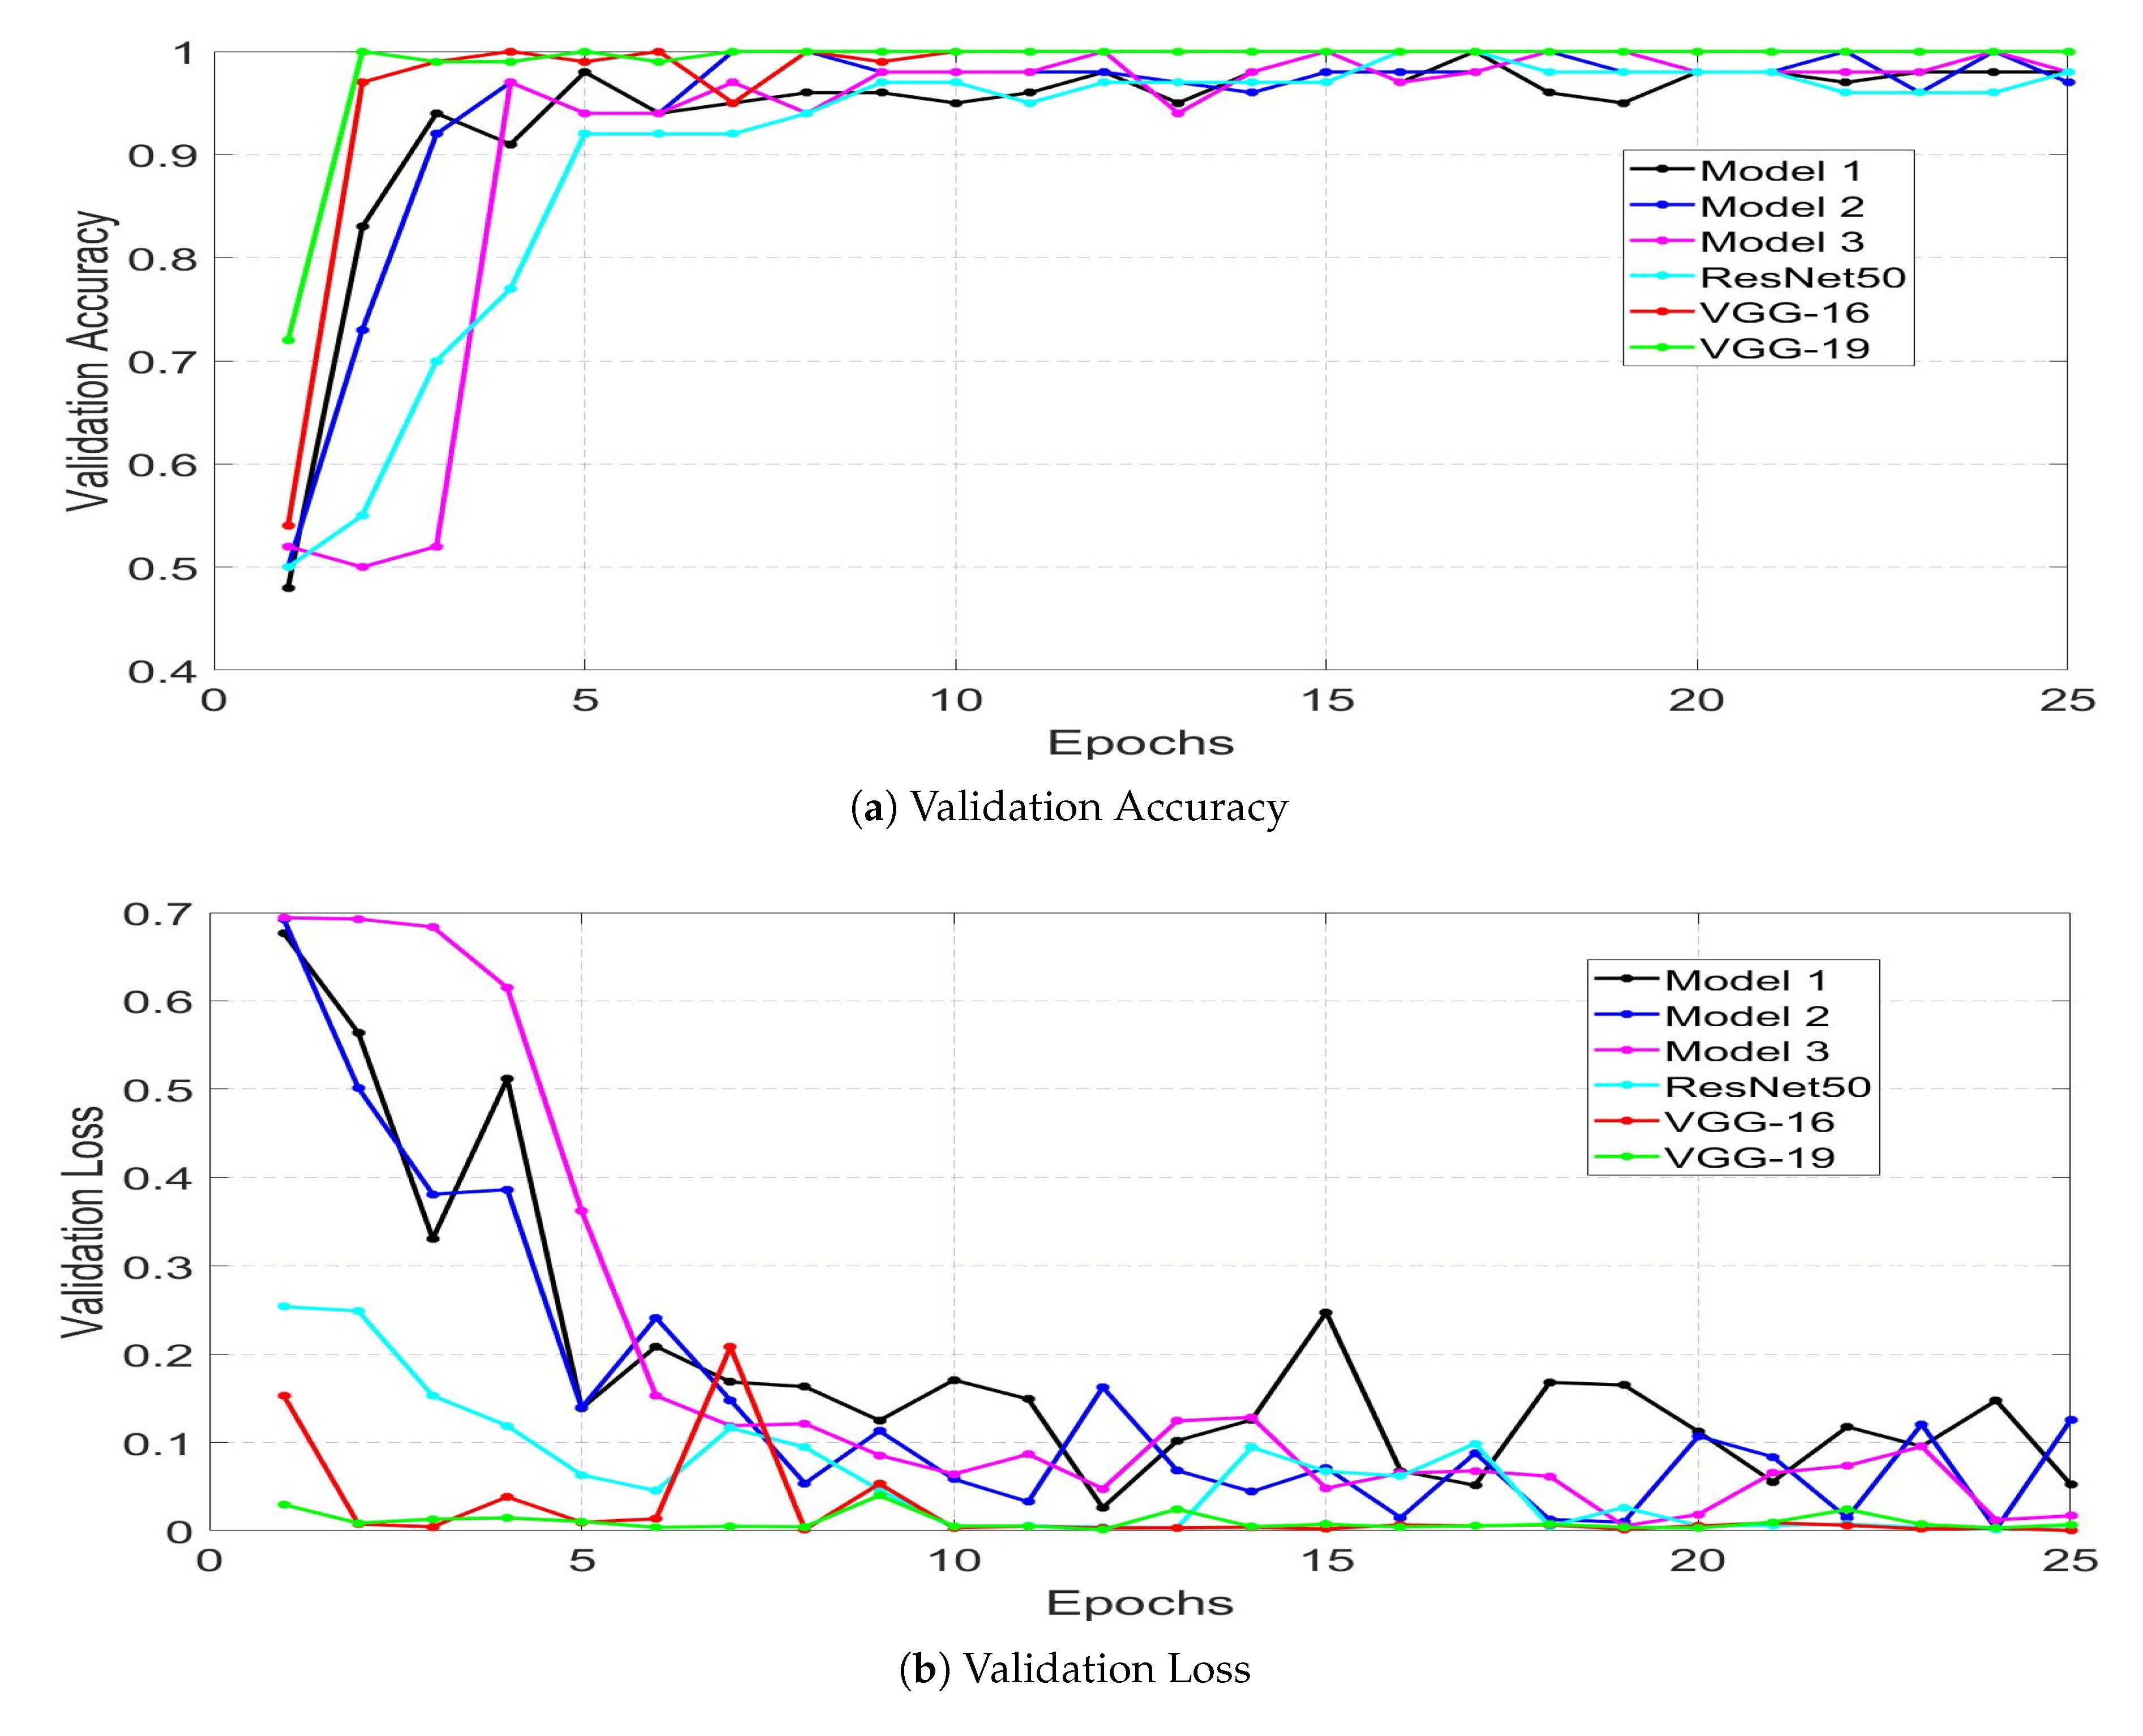
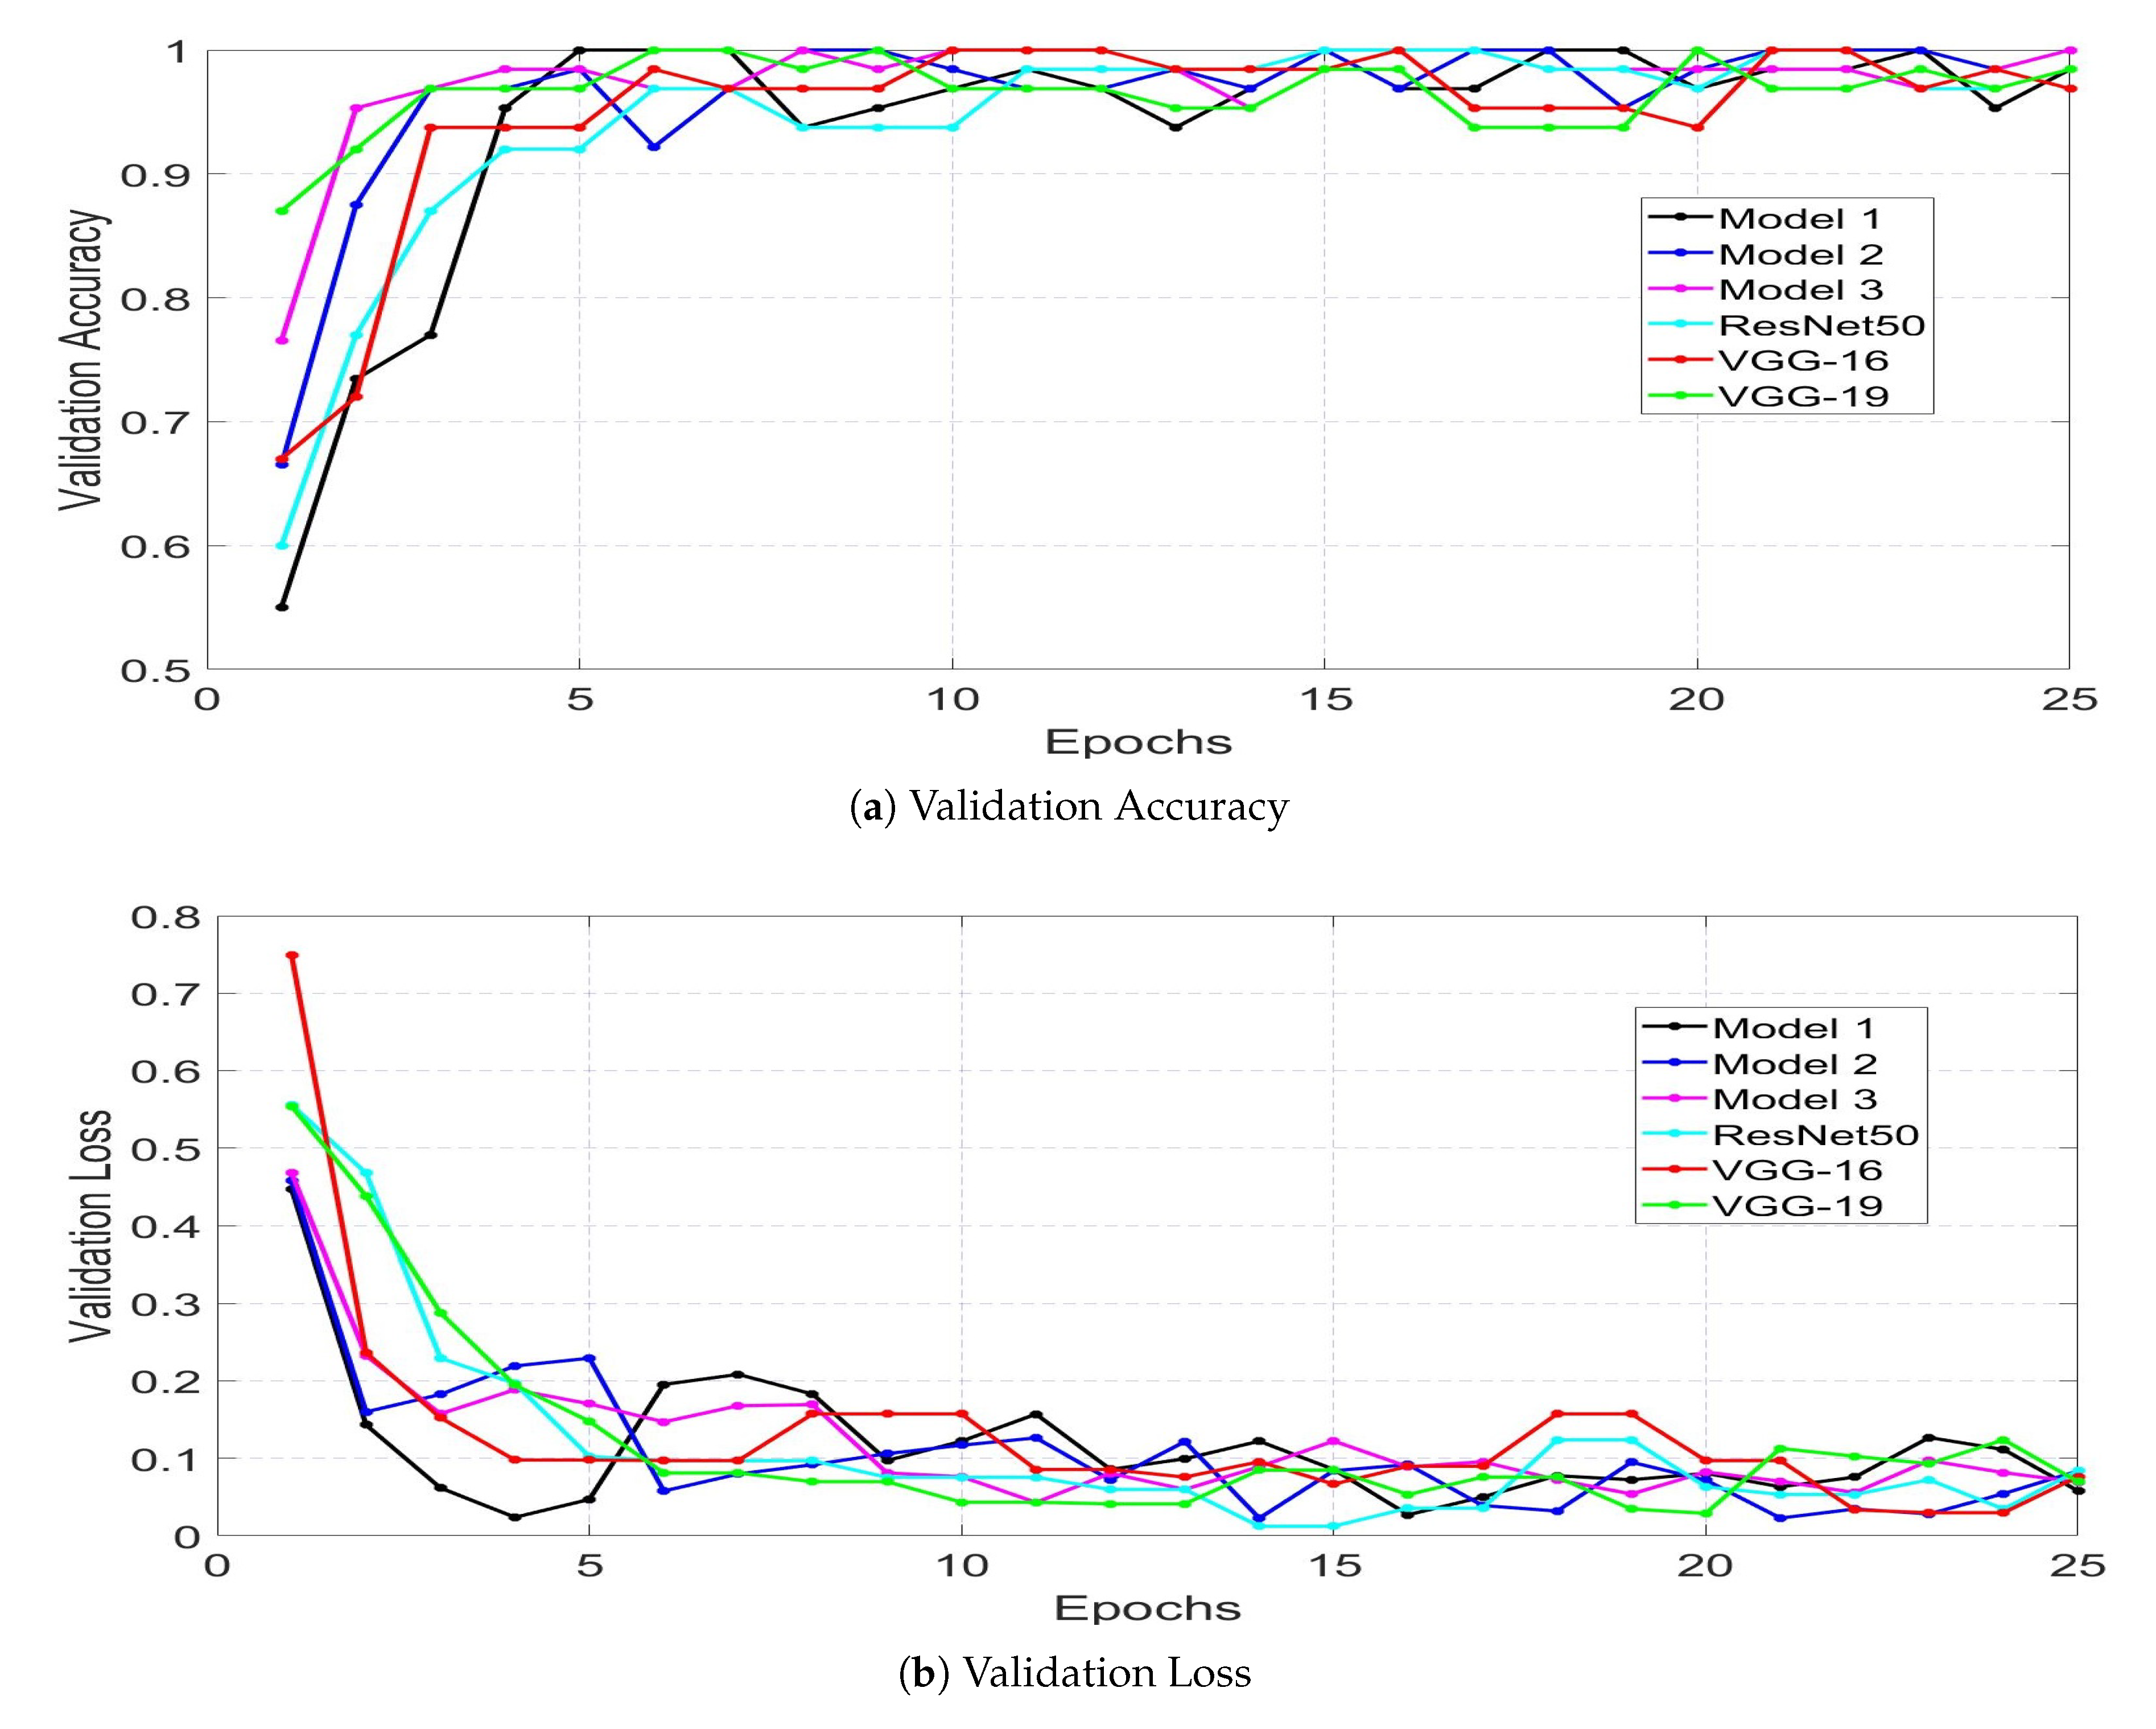
The proposed model is trained for 25 epochs with 10 and 26 steps per epoch for Dataset 1 and 2 respectively. In this section, the proposed model (Model 1) is analyzed along with Model 2 and Model 3 and pretrained ResNet50, VGG-16 and VGG-19. These six models are trained and validated with both the Dataset 1 and Dataset 2 with the same machine. The validation accuracy and validation loss for all the models with Dataset 1 are compared in Figure 7a,b respectively. For the proposed model, the validation accuracy started from 0.48 in the first epoch and it increased to 0.98 in fifth epoch and it remains in the range of 0.94–1 for the rest of the epochs. The validation loss for the model 1 in its first epoch is 0.6765 which is reduced to 0.0525 in its last epoch. On the other hand, all the models show almost same performances with smother transition with Dataset 2. Figure 8a,b show the comparative analysis of validation accuracy and validation loss of all the models trained and validated with larger dataset (Dataset 2). The validation accuracy of model 1 (proposed model) started with 0.55 which reaches to 0.95 in the fourth epoch and it remains in the range of 0.93–1 for rest of the epochs. The validation loss for model 1 is 0.446 in the first epoch which goes down to 0.057 in the last epoch. The validation accuracy and validation loss of all the models show smoother transition with Dataset 2 in comparison to Dataset 1.

4. Results and Analysis

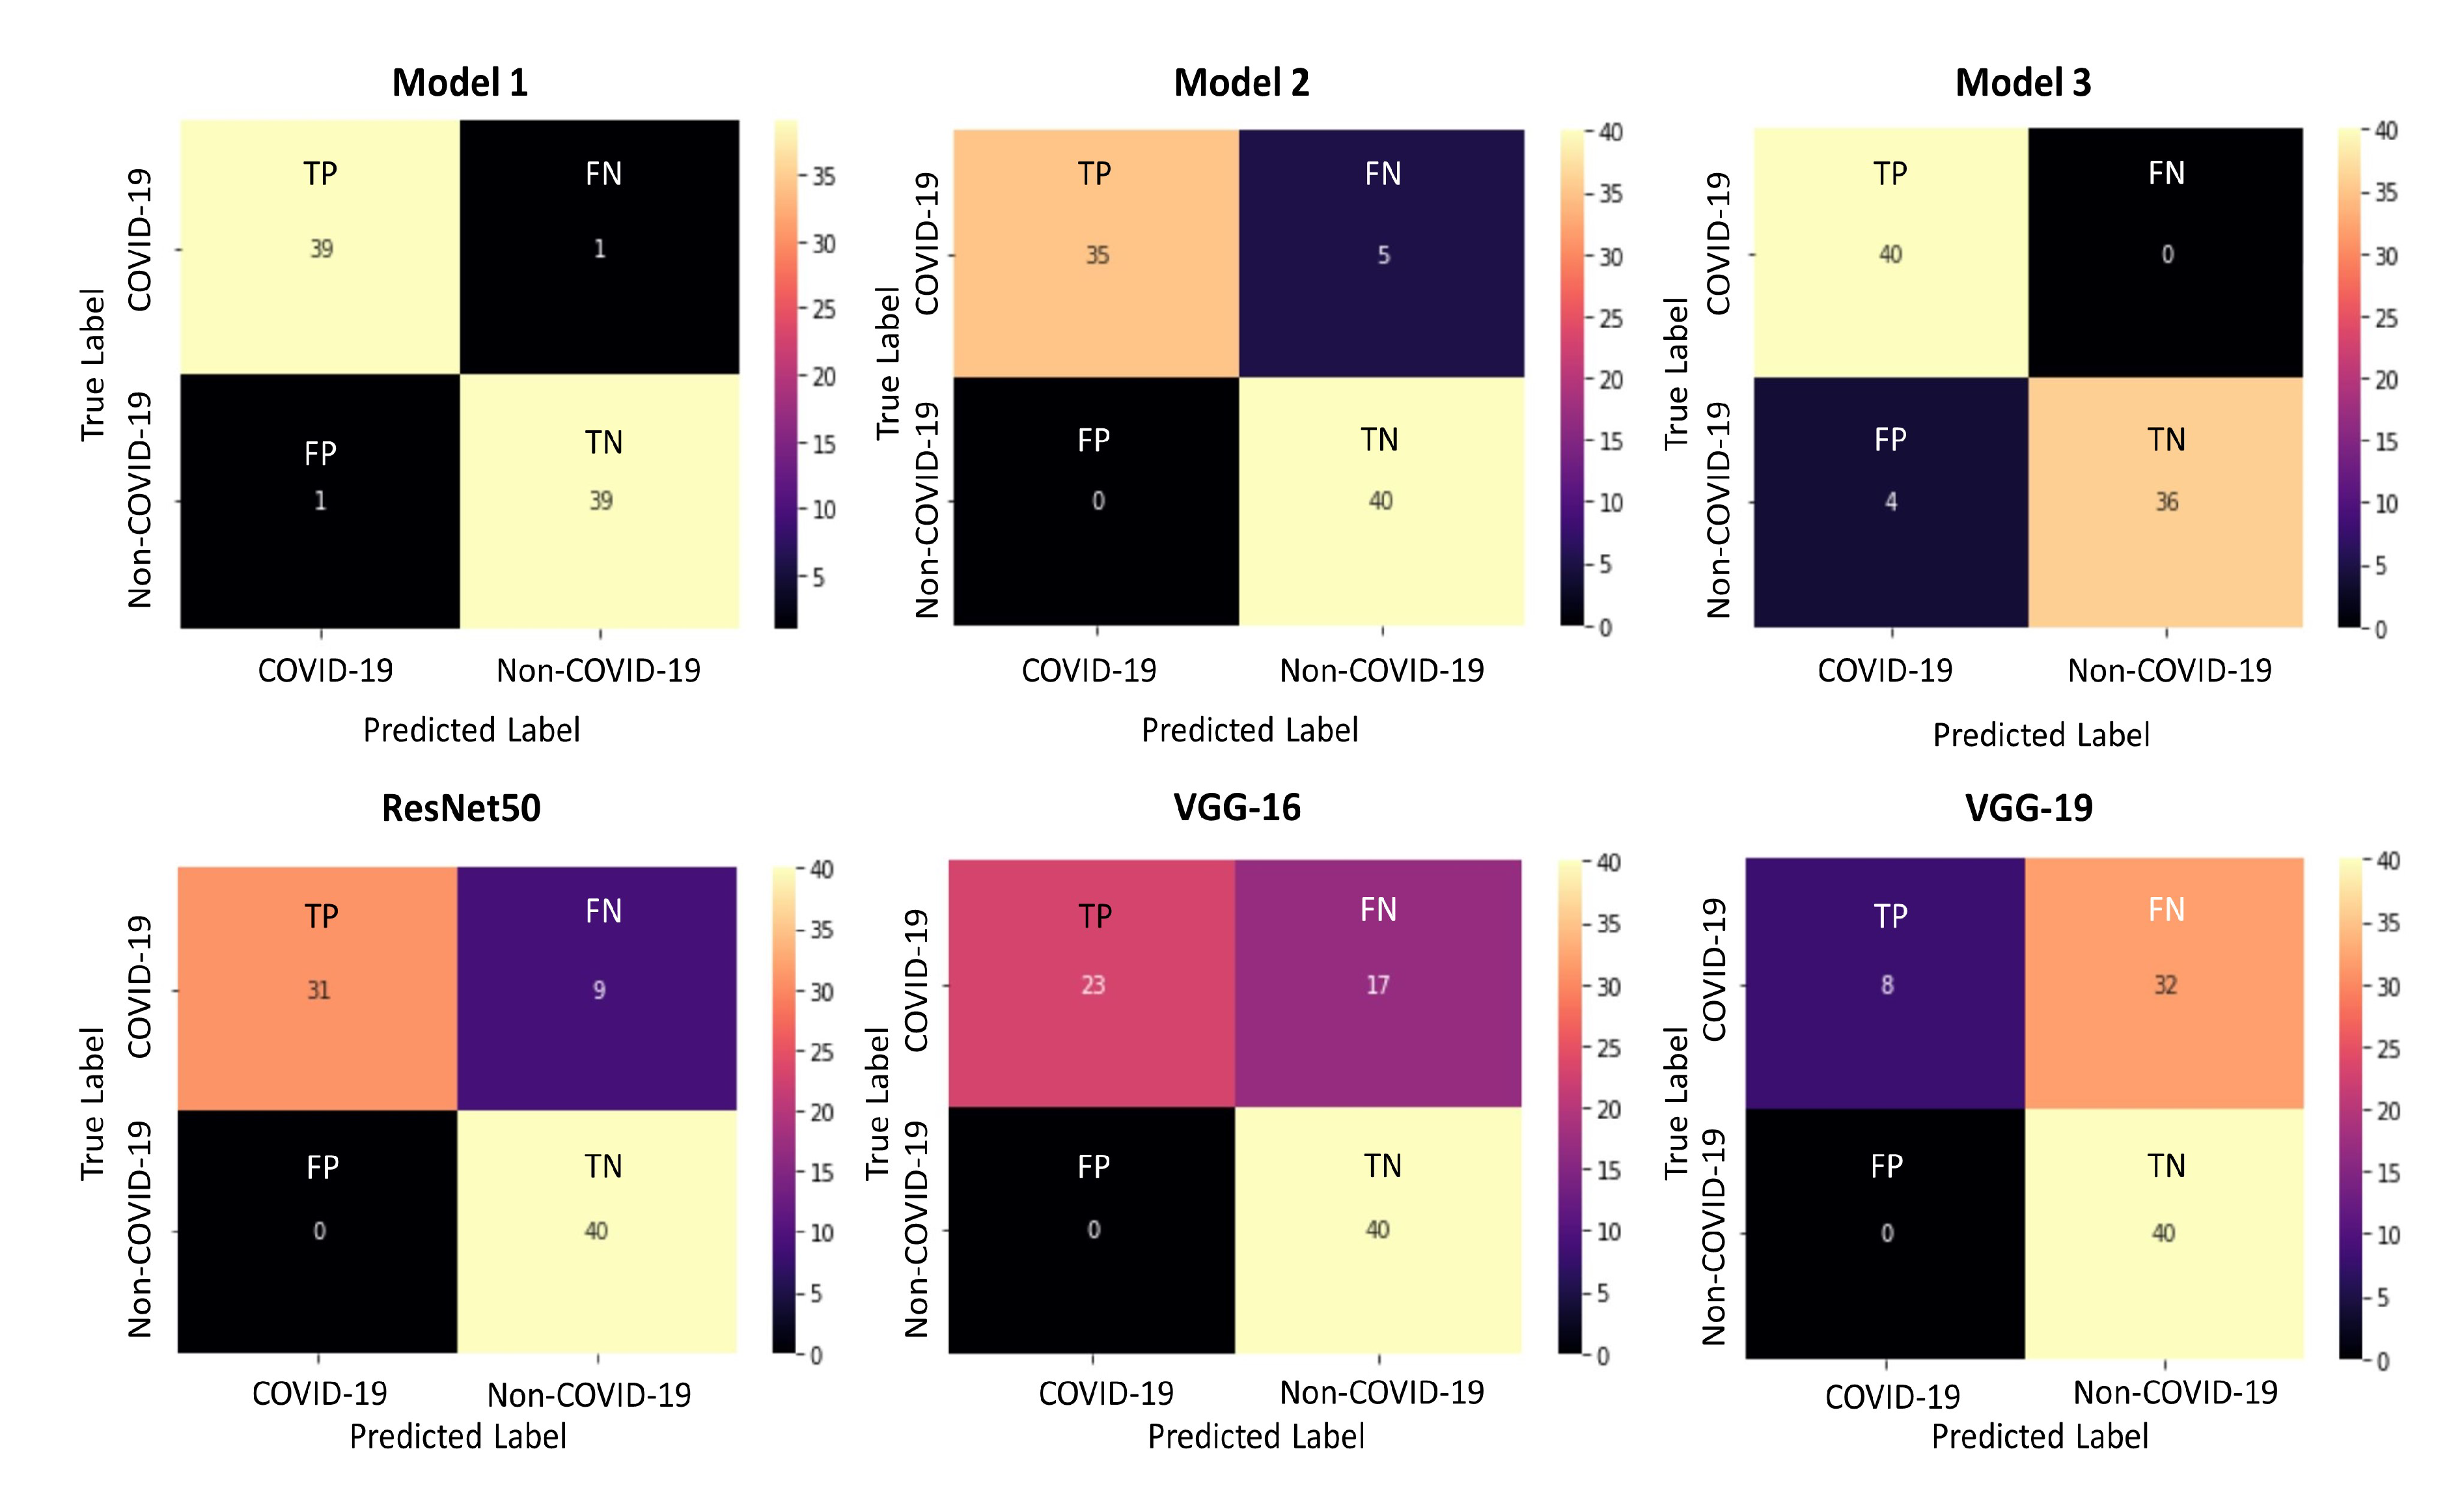
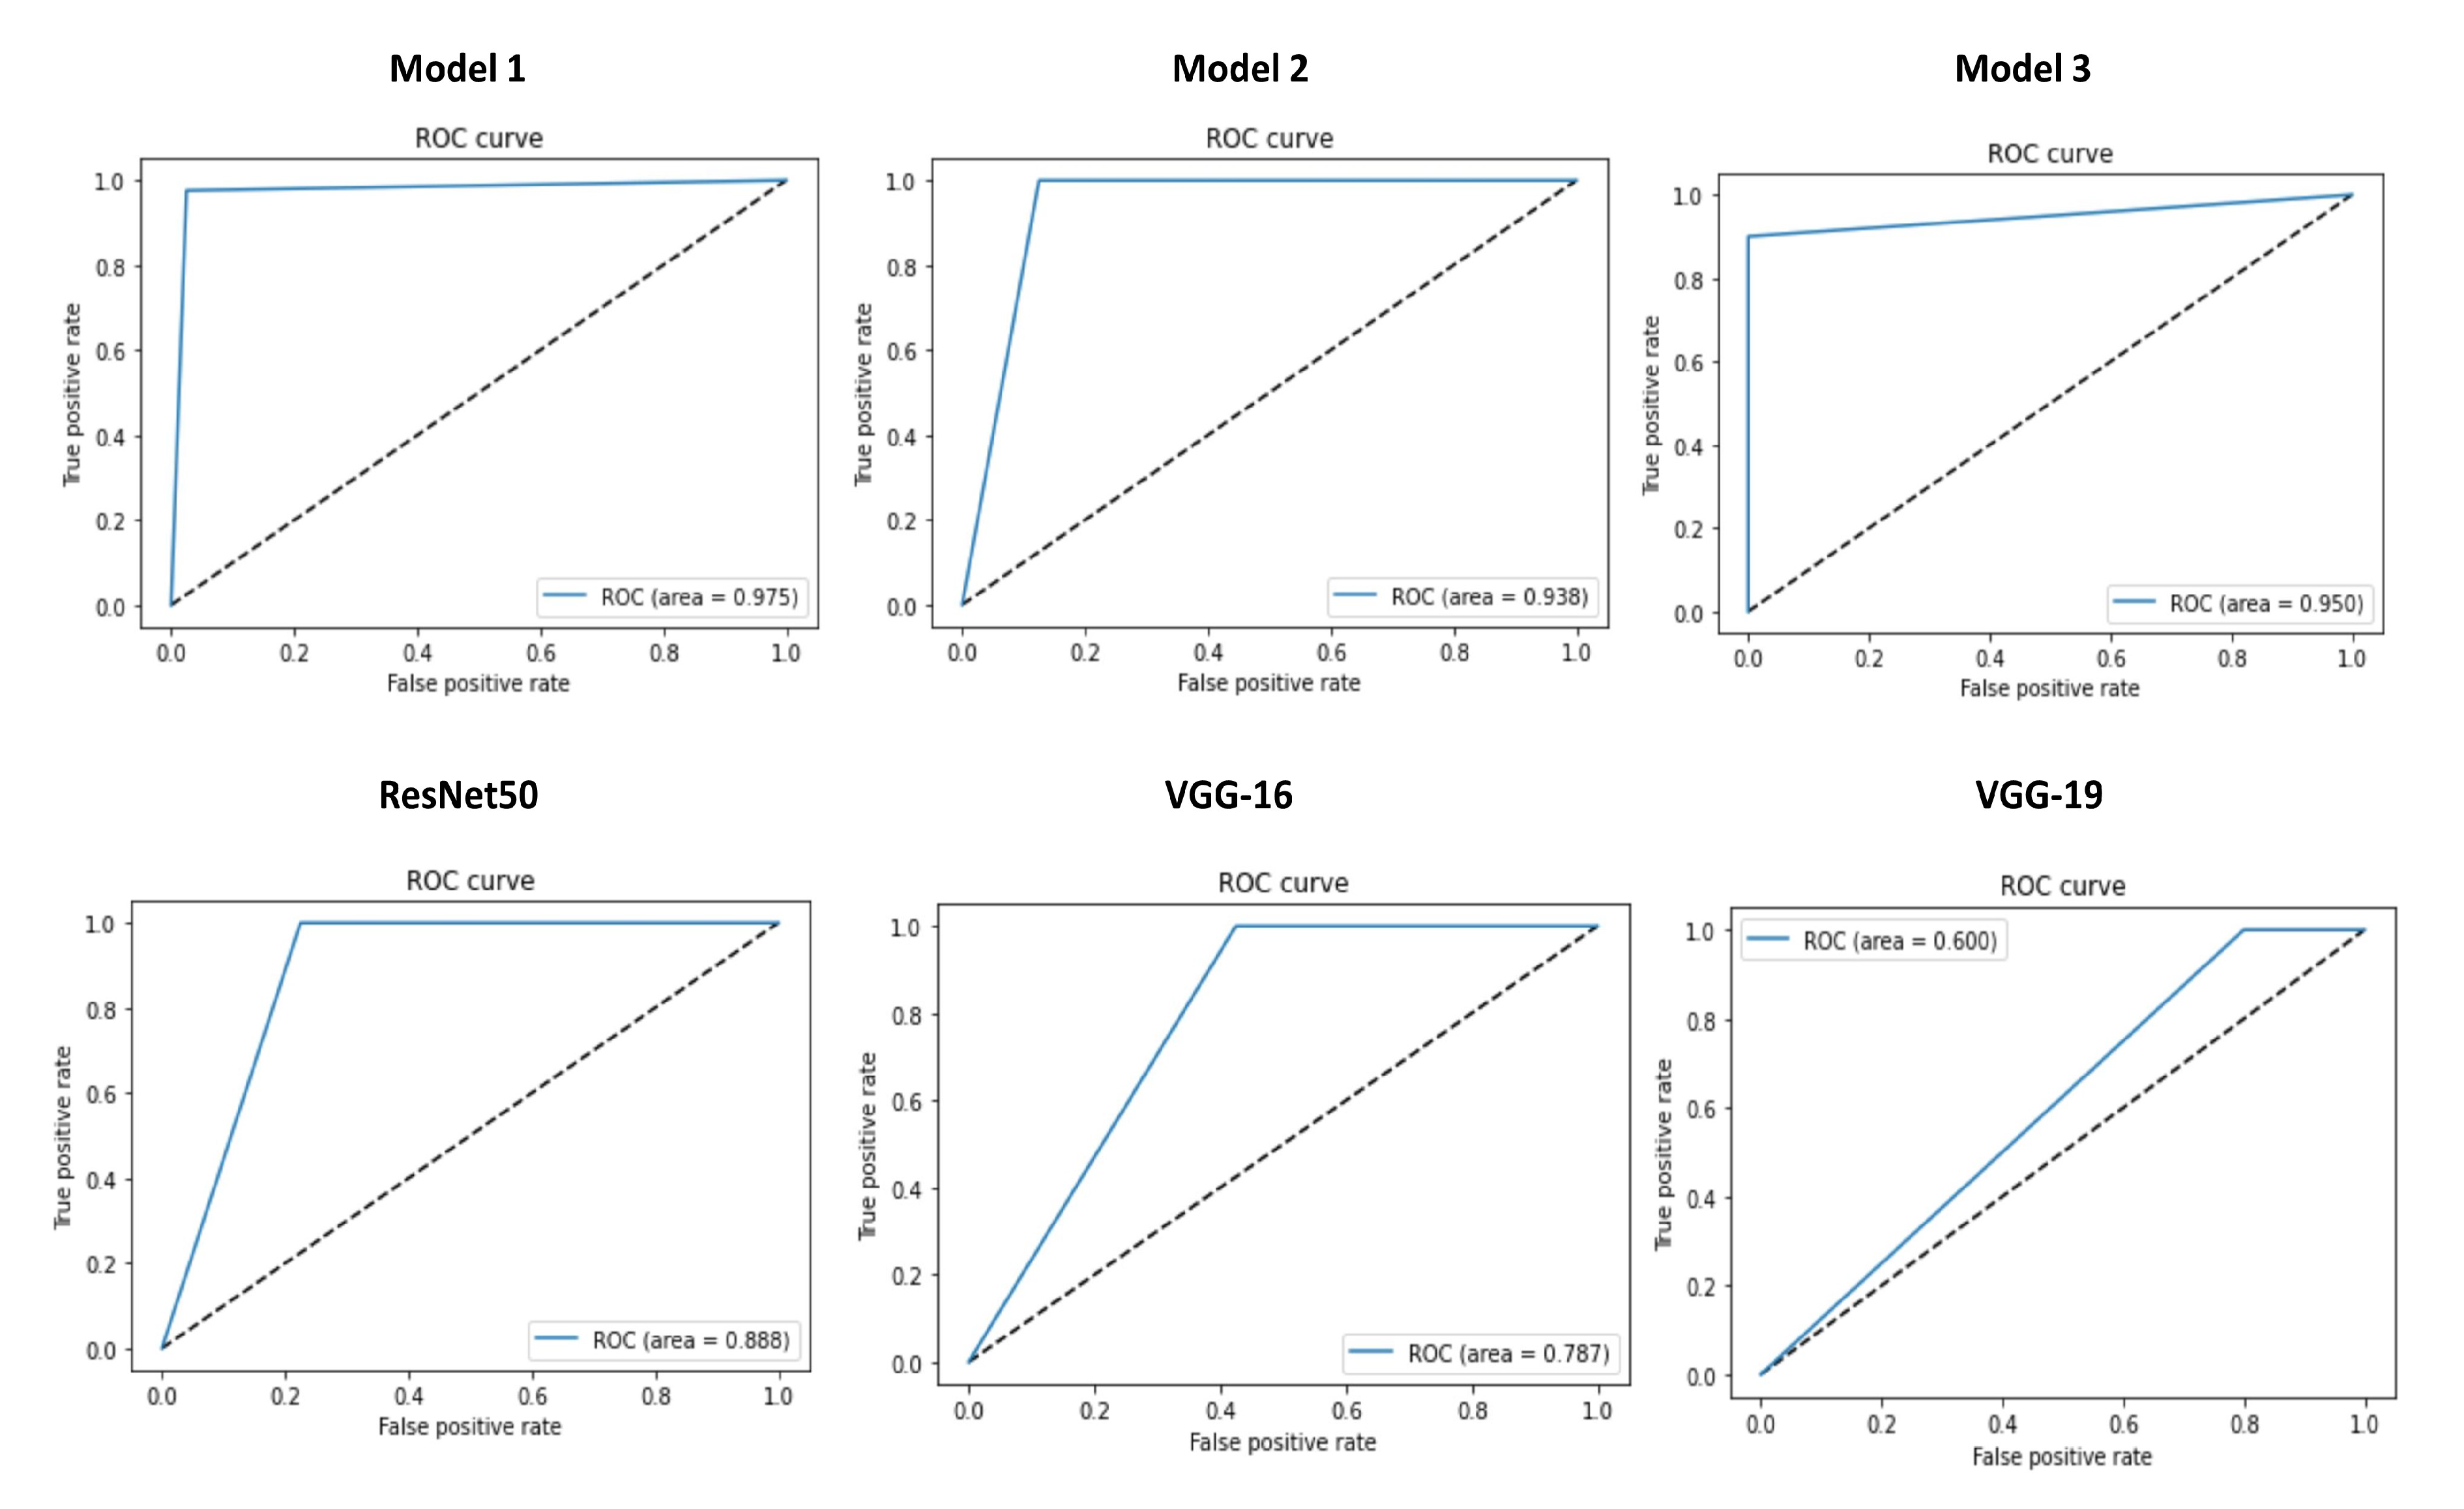
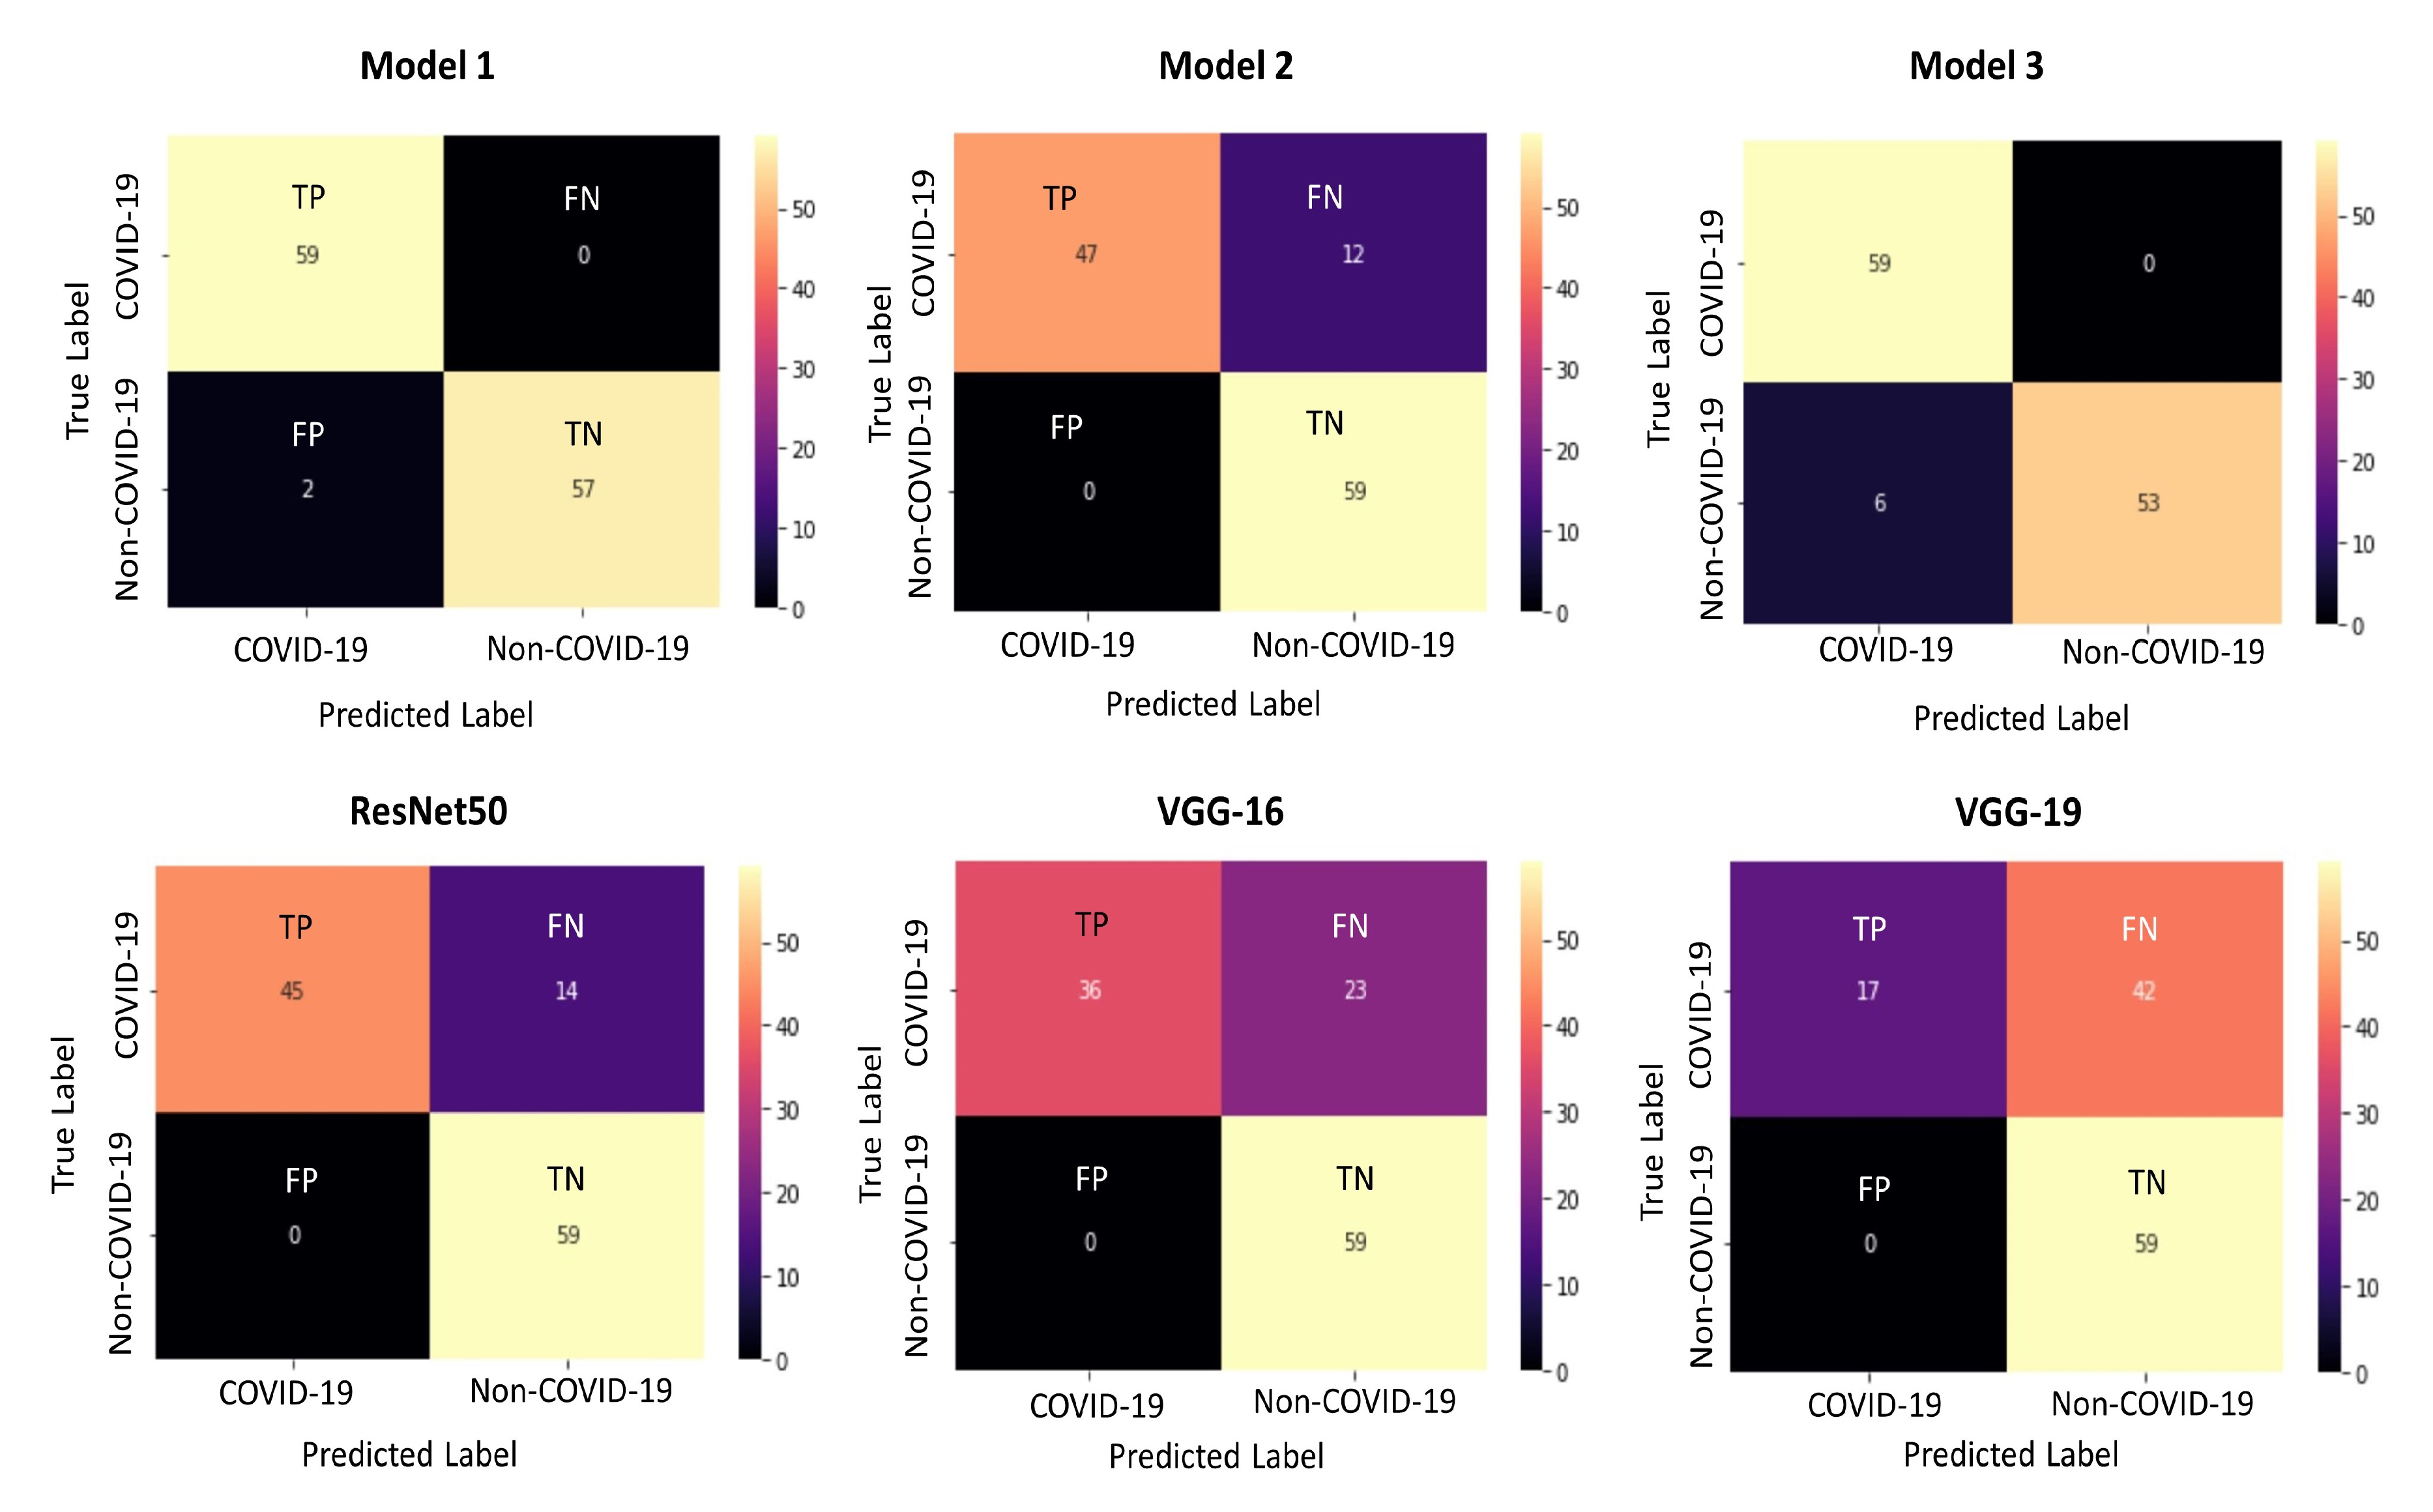
For Dataset 1, the overall accuracy is 97.5%, 93.75%, and 95% for Model 1, Model 2, and Model 3 respectively whereas the pretrained model achieved the accuracy of 88.5%, 78.75% and 60% respectively by ResNet50, VGG-16 and VGG-19. It clearly shows that the proposed model (Model 1) performs better than the other models in terms of accuracy. The performance of the models is more evident from the metrics like precision, recall, and F-1 score. These performance metrics are calculated from the possible outcomes of the validation dataset which is obtained by the confusion matrix. A confusion matrix has four different outcomes: True Positive (TP), True Negative (TN), False Positive (FP), False Negative (FN). In this case, TP denotes the number of Coronavirus positive patients detected as positive, TN denotes the number of negative cases detected as negative, FP presents the number of cases which are actually negative but detected as positive and FN gives the cases which are actually positive but detected as negative. Receiver Operating Characteristics (ROC) curve represents the performance of the classifier at different threshold values which plot the TP rates vs. FP rates. Confusion matrices and ROC curve areas for all the six models is depicted in Figure 9 and Figure 10 respectively for analytical analysis.
A c c u r a c y = T P + T N T P + T N + F P + F N
P r e c i s i o n = T P T P + F P
R e c a l l = T P T P + F N
F 1 S c o r e = 2 × P r e c i s i o n × R e c a l l P r e c i s i o n + R e c a l l
With Dataset 1, model 1 detects 39 TP and 39 TN cases, Model 2 finds 35 TP and 40 TN cases whereas, Model 3 detects 40 TP and 36 TN cases. On the other hand, the pretrained models perform very well in detecting the TN cases which is 40 for each models whereas the TP cases detected are 31, 23 and 8 by ResNet50, VGG-16 and VGG-19 respectively. The ROC curve area of the Model 1 is 0.975 which outperforms the other discussed models. On the contrary, VGG-19 achieved the lowest ROC curve area of 0.60 in compared to others. It is evident from the confusion matrices that Model 1 performs better in terms of case detection.
Accuracy defines how close the generated result is close to the actual value whereas precision measures the percentage of the relevant results. Recall or sensitivity is another important factor for evaluating a CNN model. It is defined by the percentage of the total relevant results that a model can correctly classify. F1-score combines both precision and recall and it is designated as the weighted average of these two. Equations (1)–(4) represents accuracy, precision, recall, and F-1 sore respectively.
Model 1 achieves the highest F1-score of 97.5, contrarily, VGG-19 performs with the lowest F1-score of 33.33. The overall performance and the F1-score of the proposed model (Model 1) show better results than that of the other models. The accuracy of the proposed model is 97.5% with the precision and recall value of 97.5% for both the parameters. The overall performance including accuracy and F1-score can be improved further by training the model with a larger dataset.
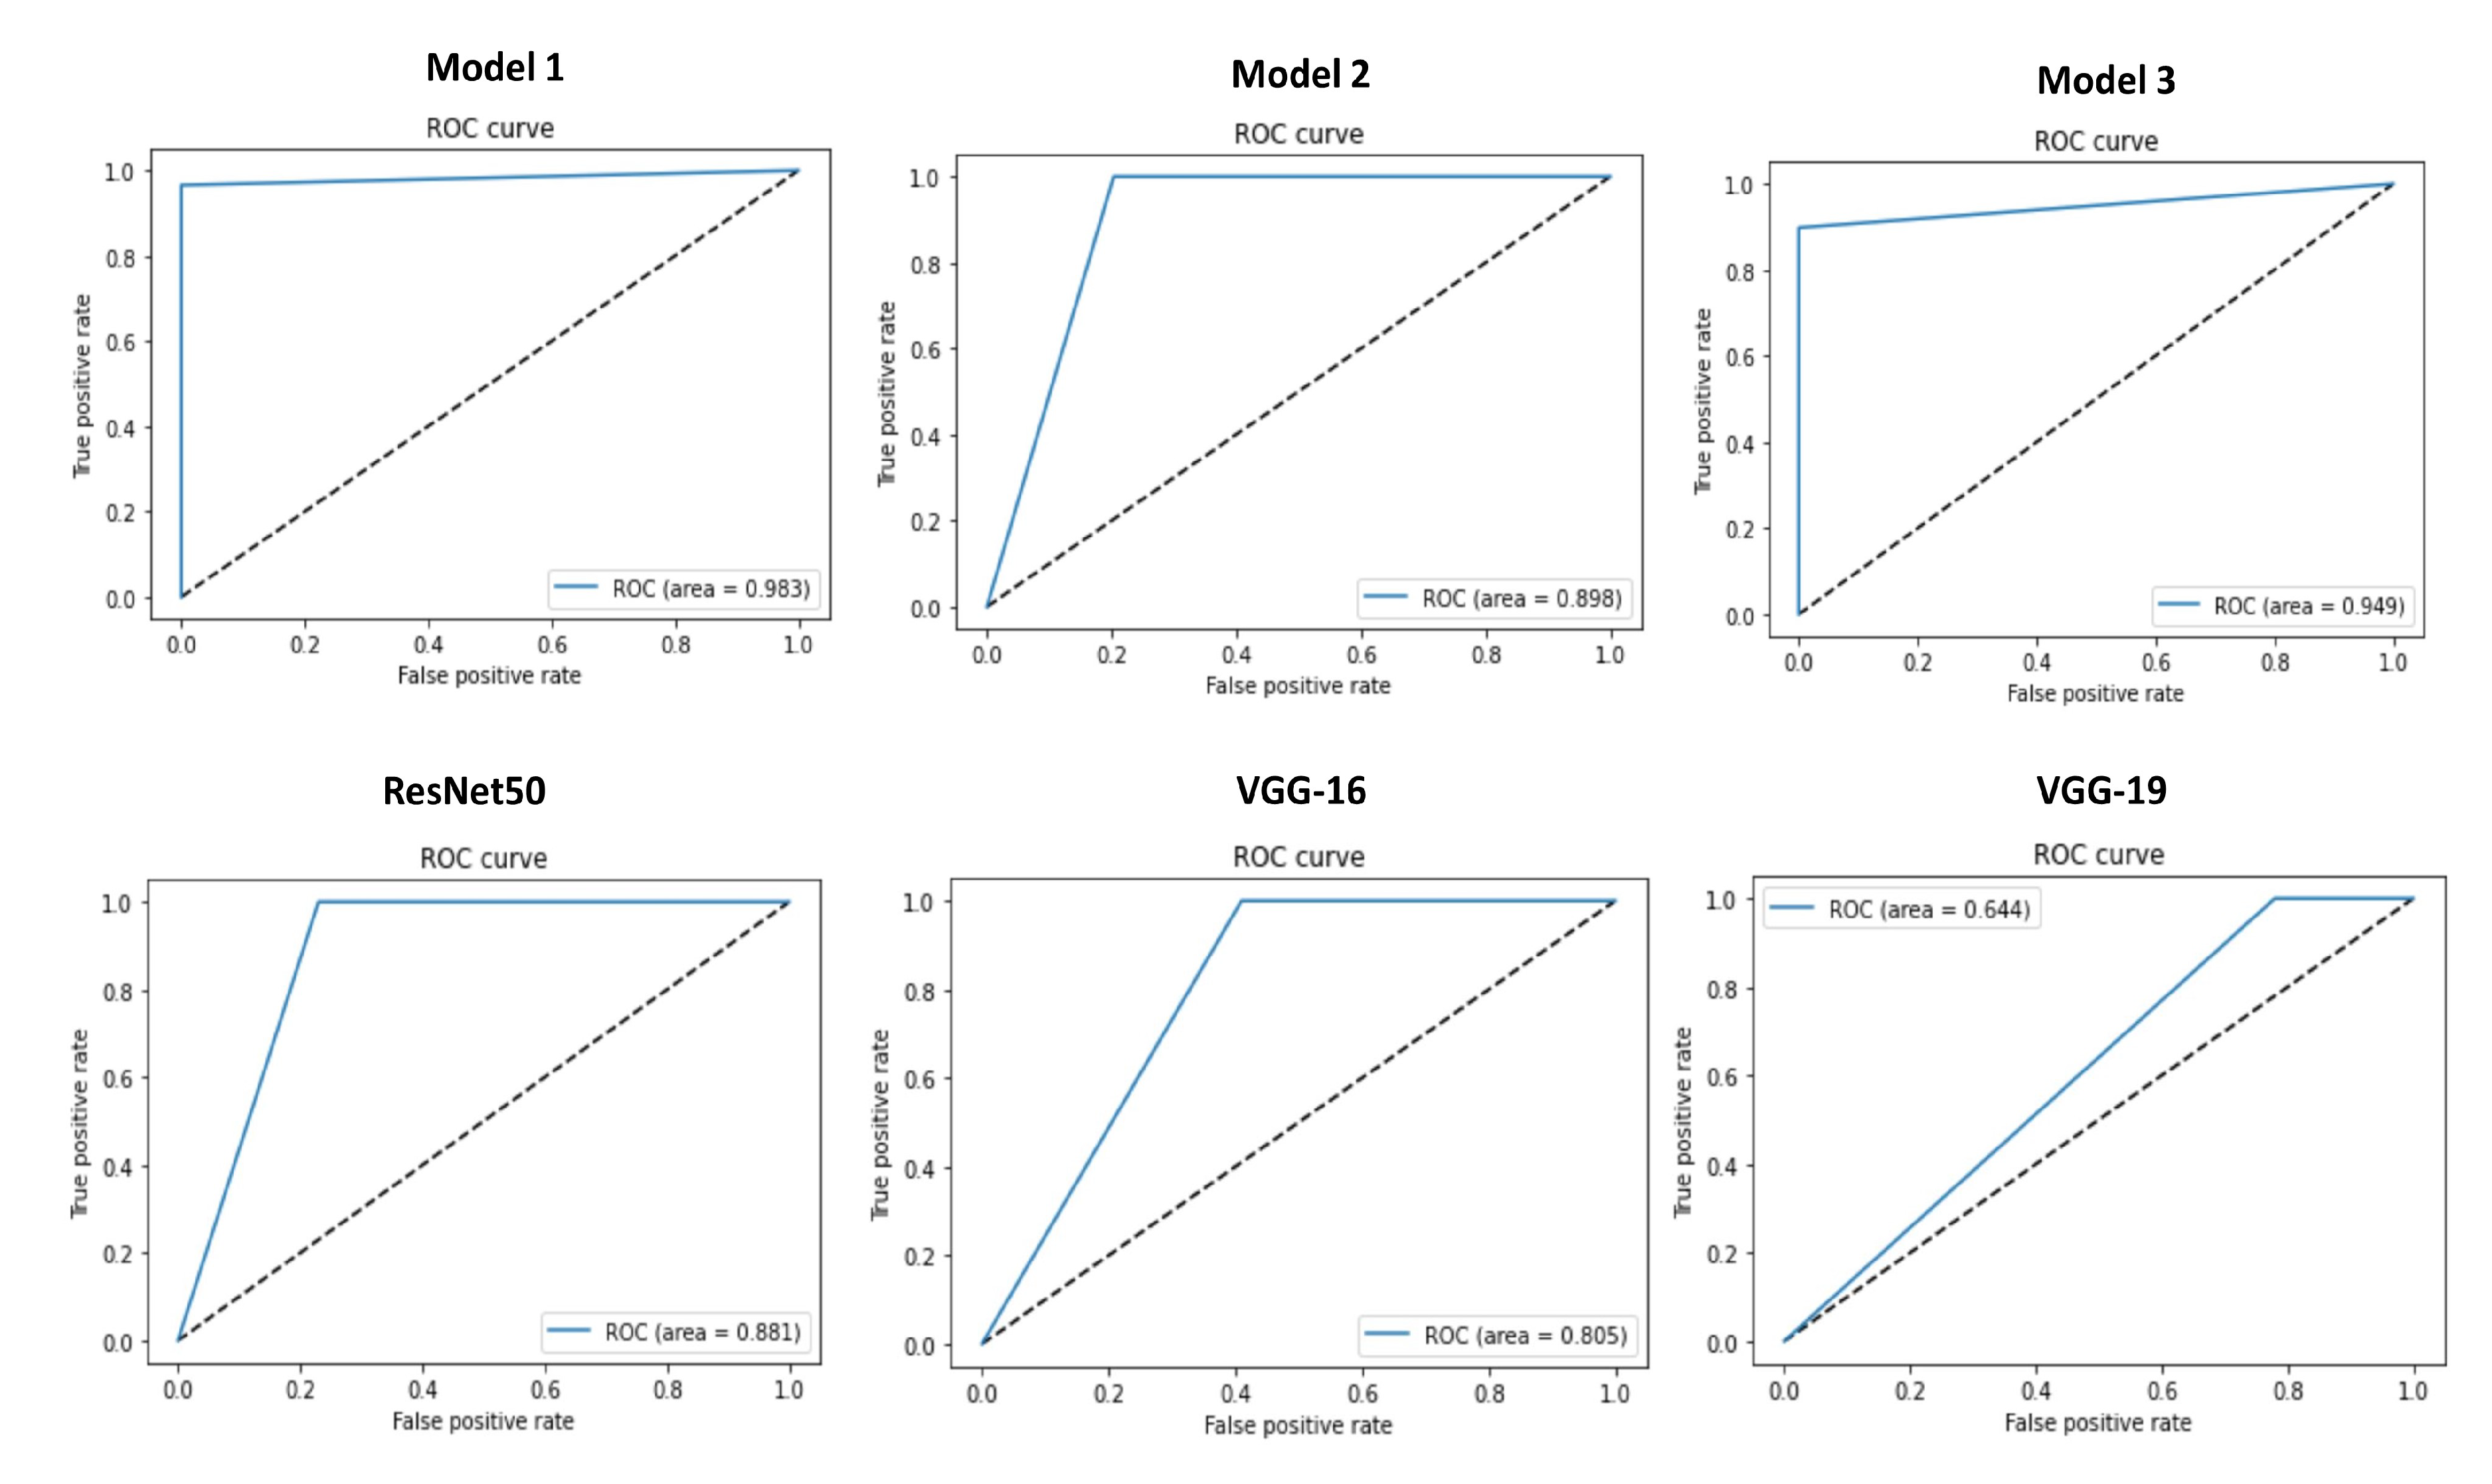
For Dataset 2, Model 1 (proposed model), Model 2 and Model 3 perform with an accuracy of 98.3%, 89.8% and 94.9% respectively whereas ResNet50, VGG-16 and VGG-19 performs with the accuracy of 88.1%, 80.5% and 64.4% respectively. The model 1 (proposed model) achieved the highest F1-score of 98.3 whereas the VGG-19 has the minimum F1-score of 44.72. Similarly, the highest ROC area is 0.983 by model 1 and the lowest ROC area of 0.644 is by VGG-19. For confusion matrices, 59 chest X-ray images in each class: normal and COVID-19 are taken into consideration. Model 1 finds the TP and TN cases of 59 and 57 respectively where the FP case is only 2 with perfect FN case of 0. This model performs better in comparison to other models with the Dataset 2 also. VGG-19 performs worst when compared with other models, the TN and FP cases are 59 and 0 respectively which are perfect but the TP cases are only 17. Figure 11 and Figure 12 shows the confusion matrices and ROC curves for all the models trained and validated with Dataset 2.
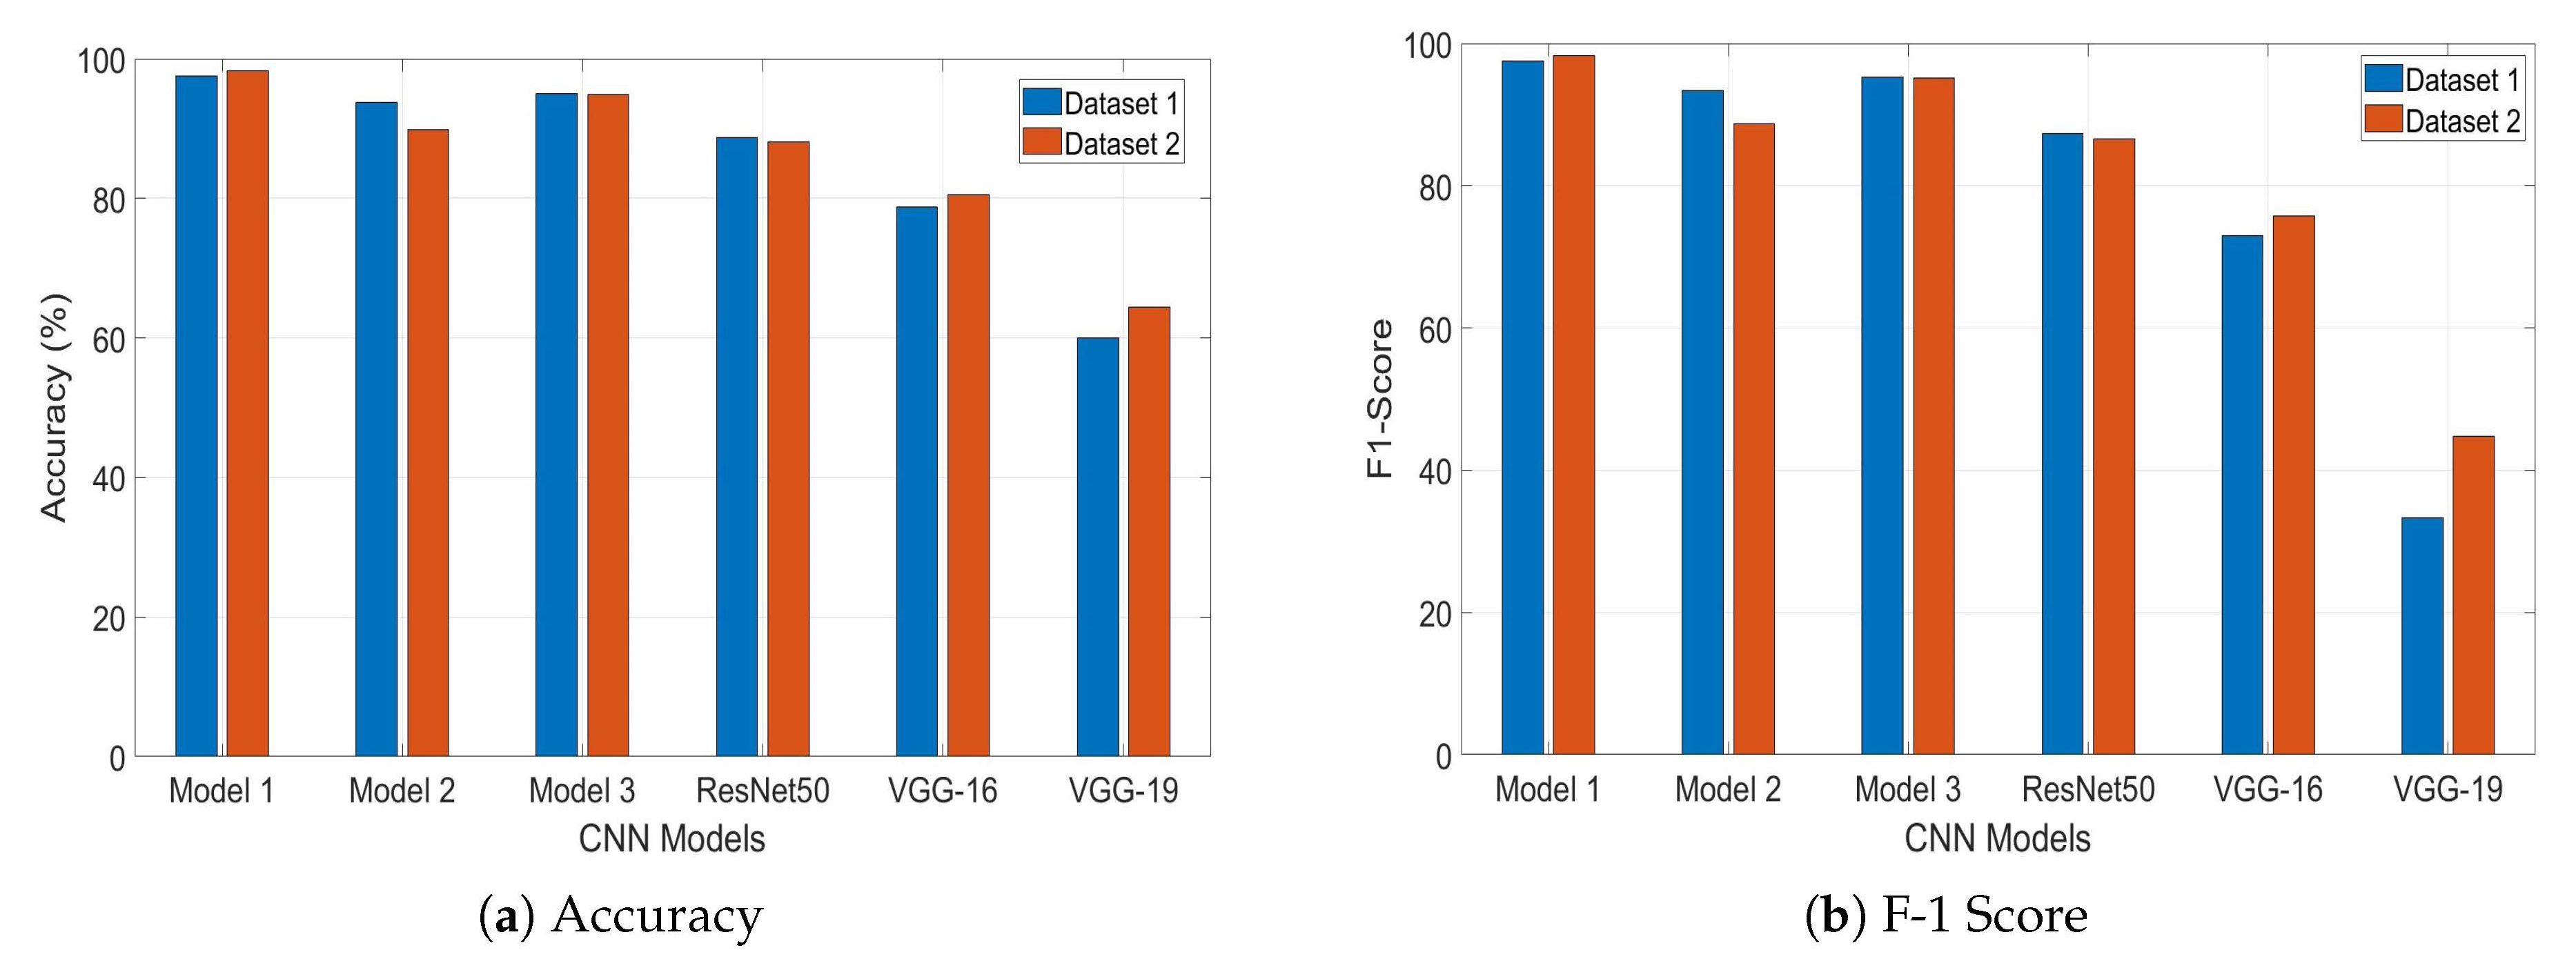
The comparison of the models with Dataset 1 and Dataset 2 shows that, model 1 (proposed model), VGG-16 and VGG-19 performs better with larger dataset (Dataset 2) in comparison to performances with Dataset 1. The accuracy for model 1, VGG-16 and VGG-19 with Dataset 2 are 98.3%, 80.5%, 64.4% respectively whereas with Dataset 1, these models achieved comparatively lower accuracy of 97.5%, 78.5% and 60% respectively. Model 3 and ResNet50 performs almost similar with Dataset 1 and Dataset 2. On the other hand, model 2 performs worse with Dataset 2 in comparison with Dataset 1 due to less convolutional layers than that of other models. In terms of F1-score also, the proposed model (model 1), VGG-16 and VGG-19 perform better with Dataset 2 than that of Dataset 1. Table 2 shows the comparative results of all the models with Dataset 1 and 2.
The performances can be analyzed better with a comparative bar graph of two important metrics—accuracy and F1-score for Dataset 1 and 2 which is depicted by Figure 13a,b respectively.
It clearly shows that, the best result is achieved by model 1 (proposed model) which is trained and validated with Dataset 2 which contain 295 COVID-19 and 659 normal chest X-ray images with accuracy and F1-score of 98.3% and 98.3 respectively. It performs better than the other models. Dataset 1 contains total of 402 images and Dataset 2 contains 954 images. With these images, Model 1 (proposed model) fits perfectly thus produce better results. On the other hand, Model 2 has only 3 convolutional layers, which underfit with Dataset 1 and this underfitting increases with the increase number of images in Dataset 2.
Model 3 has five convolutional layers which starts overfitting a bit with Dataset 1 and 2. On the other hand, VGG-16, VGG-19 and ResNet50 have much more deep layers than these three models thus easily overfits with this smaller training and validating dataset. Therefore the performances of VGG-16 and VGG-19 improve with Dataset 2 compared to Dataset 1 (comparatively smaller). Their performances can be improved further by increasing the dataset. Moreover, approaches like data augmentation and cross layer validation can be adopted to improve the performances of these pre-trained models.
Even though this is a good result for the proposed model, a few researchers could achieve better results than this with binary classification. However, this work shows how number of convolutional layers and number of images in the dataset play role with performances of the models. Table 3 shows a comparative analysis of how the proposed model perform with other prominent models by different researchers.
As CNN classifies images by extracting features from the images, it is possible to differentiate and classify between images with very minute and subtle changes. Of course, chest X-ray of a COVID-19 patient from early stage would show differences from an X-ray of the same patient at middle stage and late stage. Provided the necessary dataset, it would be possible to detect the stages of the COVID-19 patients. Moreover, this will allow doctors to treat the patients of different stages accordingly. This would need the chest X-ray datasets to be classified in stages or by days like—X-ray from the first day, X-ray from the third day or X-ray from the eighth day. Unfortunately, to the best of authors’ knowledge, they could not find such a dataset with time labelling. As it is a very new disease, and there is a lack of reliable classified data according to different stages, classifying stages are not addressed here in this work but it is hoped to address this challenge in future work.

5. Conclusions

Mass testing and early detection of COVID-19 play an important role in preventing the spread of this recent global pandemic. Time, cost, and accuracy are the few major factors in any disease detection process specially COVID-19. To address these issues, a CNN based model is proposed in this paper for detecting COVID-19 cases from patients’ chest X-rays. The CNN models are trained with Dataset 1 which has a total of 402 chest X-ray images divided into two classes and also with a comparatively larger dataset (Dataset 2) which contains a total of 954 chest X-ray images. Of all the discussed six models, the proposed model excels other models with both the datasets. The accuracy and F1-score of the proposed model is 98.3% and 98.3 with Dataset 2. Moreover, this model compares the achieved results with other prominent works in the field. This work can be improved further with multi-class classification and availability of the larger dataset. Finally, CNN has great prospects in detecting COVID-19 with very limited time, resources, and costs. Though the proposed model shows promising results, it is not clinically tested. However, with such a higher accuracy the proposed model can surely play an important role in early and fast detection of COVID-19 thus reducing testing time and cost.

Author Contributions

Conceptualization, K.F.H. and A.A.; methodology, K.F.H.; software, K.F.H.; validation, K.F.H. and A.A.; formal analysis, K.F.H.; investigation, K.F.H.; writing–original draft preparation, K.F.H.; writing–review and editing, K.F.H. and A.A.; visualization, K.F.H.; supervision, A.A.; project administration, A.A. All authors have read and agreed to the published version of the manuscript.

Funding

This research received no external funding.

Acknowledgments

The authors would like to thank Lisa Gandy for her suggestions to improve the manuscript.

Conflicts of Interest

The authors declare no conflict of interest.

References

  1. Simard, P.Y.; Steinkraus, D.; Platt, J.C. Best practices for convolutional neural networks applied to visual document analysis. In Proceedings of the Icdar 2003, Scotland, UK, 3–6 August 2003; Volume 3. [Google Scholar]
  2. O’Shea, K.; Nash, R. An introduction to convolutional neural networks. arXiv 2015, arXiv:1511.08458. [Google Scholar]
  3. Bhandare, A.; Bhide, M.; Gokhale, P.; Chandavarkar, R. Applications of convolutional neural networks. Int. J. Comput. Sci. Inf. Technol. 2016, 7, 2206–2215. [Google Scholar]
  4. Barbedo, J.G.A.; Castro, G.B. A Study on CNN-Based Detection of Psyllids in Sticky Traps Using Multiple Image Data Sources. AI 2020, 1, 198–208. [Google Scholar] [CrossRef]
  5. Suzuki, K. Overview of deep learning in medical imaging. Radiol. Phys. Technol. 2017, 10, 257–273. [Google Scholar] [CrossRef] [PubMed]
  6. Banihabib, M.E.; Bandari, R.; Valipour, M. Improving Daily Peak Flow Forecasts Using Hybrid Fourier-Series Autoregressive Integrated Moving Average and Recurrent Artificial Neural Network Models. AI 2020, 1, 263–275. [Google Scholar] [CrossRef]
  7. Taravat, A.; Wagner, M.P.; Oppelt, N. Automatic Grassland Cutting Status Detection in the Context of Spatiotemporal Sentinel-1 Imagery Analysis and Artificial Neural Networks. Remote Sens. 2019, 11, 711. [Google Scholar] [CrossRef] [Green Version]
  8. Islam, K.T.; Wijewickrema, S.; Raj, R.G.; O’Leary, S. Street Sign Recognition Using Histogram of Oriented Gradients and Artificial Neural Networks. J. Imaging 2019, 5, 44. [Google Scholar] [CrossRef] [Green Version]
  9. McCulloch, W.S.; Pitts, W. A logical calculus of the ideas immanent in nervous activity. Bull. Math. Biophys. 1943, 5, 115–133. [Google Scholar] [CrossRef]
  10. Liang, M.; Hu, X. Recurrent convolutional neural network for object recognition. In Proceedings of the IEEE Conference on Computer Vision and Pattern Recognition 2015, Boston, MA, USA, 7–12 June 2015; pp. 3367–3375. [Google Scholar]
  11. Gu, J.; Wang, Z.; Kuen, J.; Ma, L.; Shahroudy, A.; Shuai, B.; Liu, T.; Wang, X.; Wang, G.; Cai, J.; et al. Recent advances in convolutional neural networks. Pattern Recognit. 2018, 77, 354–377. [Google Scholar] [CrossRef] [Green Version]
  12. Zeiler, M.D.; Fergus, R. Visualizing and understanding convolutional networks. In European Conference on Computer Vision; Springer: Berlin/Heidelberg, Germany, 2014; pp. 818–833. [Google Scholar]
  13. Krizhevsky, A.; Sutskever, I.; Hinton, G.E. Imagenet classification with deep convolutional neural networks. In Proceedings of the Advances in Neural Information Processing Systems 2012, Lake Tahoe, NV, USA, 3–6 December 2012; pp. 1097–1105. [Google Scholar]
  14. Simonyan, K.; Zisserman, A. Very deep convolutional networks for large-scale image recognition. arXiv 2014, arXiv:1409.1556. [Google Scholar]
  15. World Health Organization. Modes of Transmission of Virus Causing COVID-19: Implications for IPC Precaution Recommendations: Scientific Brief, 27 March 2020; Technical Report; World Health Organization: Geneva, Switzerland, 2020. [Google Scholar]
  16. Wu, Y.C.; Chen, C.S.; Chan, Y.J. The outbreak of COVID-19: An overview. J. Chin. Med. Assoc. 2020, 83, 217. [Google Scholar] [CrossRef] [PubMed]
  17. Coronavirus Disease (COVID-19) Newsroom, W.H.O. Available online: Https://www.who.int/news-room/detail/07-04-2020-who-lists-two-covid-19-tests-for-emergency-use/ (accessed on 7 September 2020).
  18. Loeffelholz, M.J.; Tang, Y.W. Laboratory diagnosis of emerging human coronavirus infections—The state of the art. Emerg. Microbes Infect. 2020, 9, 747–756. [Google Scholar] [CrossRef] [PubMed]
  19. Pfefferle, S.; Reucher, S.; Nörz, D.; Lütgehetmann, M. Evaluation of a quantitative RT-PCR assay for the detection of the emerging coronavirus SARS-CoV-2 using a high throughput system. Eurosurveillance 2020, 25, 2000152. [Google Scholar] [CrossRef] [PubMed] [Green Version]
  20. Litjens, G.; Kooi, T.; Bejnordi, B.E.; Setio, A.A.A.; Ciompi, F.; Ghafoorian, M.; Van Der Laak, J.A.; Van Ginneken, B.; Sánchez, C.I. A survey on deep learning in medical image analysis. Med. Image Anal. 2017, 42, 60–88. [Google Scholar] [CrossRef] [Green Version]
  21. Lundervold, A.S.; Lundervold, A. An overview of deep learning in medical imaging focusing on MRI. Z. Med. Phys. 2019, 29, 102–127. [Google Scholar] [CrossRef] [PubMed]
  22. Hung, J.; Carpenter, A. Applying faster R-CNN for object detection on malaria images. In Proceedings of the IEEE Conference on Computer Vision and Pattern Recognition Workshops 2017, Honolulu, HI, USA, 21–26 July 2017; pp. 56–61. [Google Scholar]
  23. Acharya, U.R.; Fujita, H.; Lih, O.S.; Adam, M.; Tan, J.H.; Chua, C.K. Automated detection of coronary artery disease using different durations of ECG segments with convolutional neural network. Knowl. Based Syst. 2017, 132, 62–71. [Google Scholar] [CrossRef]
  24. Oh, S.L.; Hagiwara, Y.; Raghavendra, U.; Yuvaraj, R.; Arunkumar, N.; Murugappan, M.; Acharya, U.R. A deep learning approach for Parkinson’s disease diagnosis from EEG signals. Neural Comput. Appl. 2018, 32, 1–7. [Google Scholar] [CrossRef]
  25. Prajapati, S.A.; Nagaraj, R.; Mitra, S. Classification of dental diseases using CNN and transfer learning. In Proceedings of the 2017 5th International Symposium on Computational and Business Intelligence (ISCBI), Dubai, UAE, 11–14 August 2017; pp. 70–74. [Google Scholar]
  26. Liao, H. A Deep Learning Approach to Universal Skin Disease Classification; University of Rochester Department of Computer Science: Rochester, NY, USA; CSC: Beijing, China, 2016. [Google Scholar]
  27. Farooq, A.; Anwar, S.; Awais, M.; Rehman, S. A deep CNN based multi-class classification of Alzheimer’s disease using MRI. In Proceedings of the 2017 IEEE International Conference on Imaging Systems and Techniques (IST), Beijing, China, 18–20 October 2017; pp. 1–6. [Google Scholar]
  28. Kruthika, K.; Maheshappa, H.; Initiative, A.D.N. Alzheimer’s Disease Neuroimaging Initiative. CBIR system using Capsule Networks and 3D CNN for Alzheimer’s disease diagnosis. Inform. Med. Unlocked 2019, 14, 59–68. [Google Scholar] [CrossRef]
  29. Narin, A.; Kaya, C.; Pamuk, Z. Automatic detection of coronavirus disease (covid-19) using X-ray images and deep convolutional neural networks. arXiv 2020, arXiv:2003.10849. [Google Scholar]
  30. Zhang, J.; Xie, Y.; Li, Y.; Shen, C.; Xia, Y. Covid-19 screening on chest X-ray images using deep learning based anomaly detection. arXiv 2020, arXiv:2003.12338. [Google Scholar]
  31. Hall, L.O.; Paul, R.; Goldgof, D.B.; Goldgof, G.M. Finding covid-19 from chest X-rays using deep learning on a small dataset. arXiv 2020, arXiv:2004.02060. [Google Scholar]
  32. Sethy, P.K.; Behera, S.K. Detection of coronavirus disease (covid-19) based on deep features. Preprints 2020, 2020. [Google Scholar] [CrossRef]
  33. Apostolopoulos, I.D.; Mpesiana, T.A. Covid-19: Automatic detection from X-ray images utilizing transfer learning with convolutional neural networks. Phys. Eng. Sci. Med. 2020, 43, 635–640. [Google Scholar] [CrossRef] [PubMed] [Green Version]
  34. Li, L.; Qin, L.; Xu, Z.; Yin, Y.; Wang, X.; Kong, B.; Bai, J.; Lu, Y.; Fang, Z.; Song, Q.; et al. Artificial intelligence distinguishes COVID-19 from community acquired pneumonia on chest CT. Radiology 2020, 200905. [Google Scholar] [CrossRef]
  35. Islam, M.Z.; Islam, M.M.; Asraf, A. A combined deep cnn-lstm network for the detection of novel coronavirus (covid-19) using X-ray images. Inform. Med. Unlocked 2020, 100412. [Google Scholar] [CrossRef]
  36. Hemdan, E.E.D.; Shouman, M.A.; Karar, M.E. Covidx-net: A framework of deep learning classifiers to diagnose covid-19 in X-ray images. arXiv 2020, arXiv:2003.11055. [Google Scholar]
  37. Huang, G.; Liu, Z.; Van Der Maaten, L.; Weinberger, K.Q. Densely connected convolutional networks. In Proceedings of the IEEE Conference on Computer Vision and Pattern Recognition 2017, Honolulu, HI, USA, 21–26 July 2017; pp. 4700–4708. [Google Scholar]
  38. Szegedy, C.; Vanhoucke, V.; Ioffe, S.; Shlens, J.; Wojna, Z. Rethinking the inception architecture for computer vision. In Proceedings of the IEEE Conference on Computer Vision and Pattern Recognition 2016, Las Vegas, NV, USA, 27–30 June 2016; pp. 2818–2826. [Google Scholar]
  39. He, K.; Zhang, X.; Ren, S.; Sun, J. Deep residual learning for image recognition. In Proceedings of the IEEE Conference on Computer Vision and Pattern Recognition 2016, Las Vegas, NV, USA, 27–30 June 2016; pp. 770–778. [Google Scholar]
  40. Too, E.C.; Yujian, L.; Njuki, S.; Yingchun, L. A comparative study of fine-tuning deep learning models for plant disease identification. Comput. Electron. Agric. 2019, 161, 272–279. [Google Scholar] [CrossRef]
  41. Szegedy, C.; Ioffe, S.; Vanhoucke, V.; Alemi, A. Inception-v4, inception-resnet and the impact of residual connections on learning. arXiv 2016, arXiv:1602.07261. [Google Scholar]
  42. Chollet, F. Xception: Deep learning with depthwise separable convolutions. In Proceedings of the IEEE Conference on Computer Vision and Pattern Recognition 2017, Honolulu, HI, USA, 21–26 July 2017; pp. 1251–1258. [Google Scholar]
  43. Sandler, M.; Howard, A.; Zhu, M.; Zhmoginov, A.; Chen, L.C. Mobilenetv2: Inverted residuals and linear bottlenecks. In Proceedings of the IEEE Conference on Computer Vision and Pattern Recognition 2018, Salt Lake City, UT, USA, 18–22 June 2018; pp. 4510–4520. [Google Scholar]
  44. Chowdhury, M.E.; Rahman, T.; Khandakar, A.; Mazhar, R.; Kadir, M.A.; Mahbub, Z.B.; Islam, K.R.; Khan, M.S.; Iqbal, A.; Al-Emadi, N.; et al. Can AI help in screening viral and COVID-19 pneumonia? arXiv 2020, arXiv:2003.13145. [Google Scholar] [CrossRef]
  45. Ozturk, T.; Talo, M.; Yildirim, E.A.; Baloglu, U.B.; Yildirim, O.; Acharya, U.R. Automated detection of COVID-19 cases using deep neural networks with X-ray images. Comput. Biol. Med. 2020, 121, 103792. [Google Scholar] [CrossRef]
  46. Haghanifar, A.; Majdabadi, M.M.; Ko, S. COVID-CXNet: Detecting COVID-19 in Frontal Chest X-ray Images using Deep Learning. arXiv 2020, arXiv:2006.13807. [Google Scholar]
  47. Khan, A.I.; Shah, J.L.; Bhat, M.M. Coronet: A deep neural network for detection and diagnosis of COVID-19 from chest X-ray images. Comput. Methods Progr. Biomed. 2020, 196, 105581. [Google Scholar] [CrossRef] [PubMed]
  48. Minaee, S.; Kafieh, R.; Sonka, M.; Yazdani, S.; Soufi, G.J. Deep-covid: Predicting covid-19 from chest X-ray images using deep transfer learning. arXiv 2020, arXiv:2004.09363. [Google Scholar] [CrossRef] [PubMed]
  49. Afshar, P.; Heidarian, S.; Naderkhani, F.; Oikonomou, A.; Plataniotis, K.N.; Mohammadi, A. Covid-caps: A capsule network-based framework for identification of covid-19 cases from X-ray images. arXiv 2020, arXiv:2004.02696. [Google Scholar] [CrossRef]
  50. Wang, L.; Wong, A. COVID-Net: A Tailored Deep Convolutional Neural Network Design for Detection of COVID-19 Cases from Chest X-Ray Images. arXiv 2020, arXiv:2003.09871. [Google Scholar]
  51. Hasan, A.M.; AL-Jawad, M.M.; Jalab, H.A.; Shaiba, H.; Ibrahim, R.W.; AL-Shamasneh, A.R. Classification of Covid-19 Coronavirus, Pneumonia and Healthy Lungs in CT Scans Using Q-Deformed Entropy and Deep Learning Features. Entropy 2020, 22, 517. [Google Scholar] [CrossRef]
  52. Sedik, A.; Iliyasu, A.M.; El-Rahiem, A.; Abdel Samea, M.E.; Abdel-Raheem, A.; Hammad, M.; Peng, J.; El-Samie, A.; Fathi, E.; El-Latif, A.A.A.; et al. Deploying Machine and Deep Learning Models for Efficient Data-Augmented Detection of COVID-19 Infections. Viruses 2020, 12, 769. [Google Scholar] [CrossRef]
  53. Haque, K.F.; Haque, F.F.; Gandy, L.; Abdelgawad, A. Automatic detection of COVID-19 from chest X-ray images with convolutional neural networks. In Proceedings of the 2020 3rd IEEE International Conference on Computing, Electronics & Communications Engineering (IEEE iCCECE ’20), Essex, UK, 17–18 August 2020. [Google Scholar]
  54. Cohen, J.P.; Morrison, P.; Dao, L.; Roth, K.; Duong, T.Q.; Ghassemi, M. COVID-19 Image Data Collection: Prospective Predictions Are the Future. arXiv 2020, arXiv:2006.11988. [Google Scholar]
  55. Mooney, P. Chest X-ray Images (Pneumonia). Available online: Https://www.kaggle.com/paultimothymooney/chest-xray-pneumonia/ (accessed on 7 September 2020).
  56. COVID-19 Chest X-ray. Available online: Https://github.com/agchung/Figure1-COVID-chestxray-dataset (accessed on 7 September 2020).
  57. Rahimzadeh, M.; Attar, A. A New Modified Deep Convolutional Neural Network for Detecting COVID-19 from X-ray Images. arXiv 2020, arXiv:2004.08052. [Google Scholar]
  58. Loey, M.; Smarandache, F.; Khalifa, N.E.M. Within the Lack of Chest COVID-19 X-ray Dataset: A Novel Detection Model Based on GAN and Deep Transfer Learning. Symmetry 2020, 12, 651. [Google Scholar] [CrossRef] [Green Version]
  59. Abbas, A.; Abdelsamea, M.M.; Gaber, M.M. Classification of COVID-19 in chest X-ray images using DeTraC deep convolutional neural network. arXiv 2020, arXiv:2003.13815. [Google Scholar] [CrossRef]
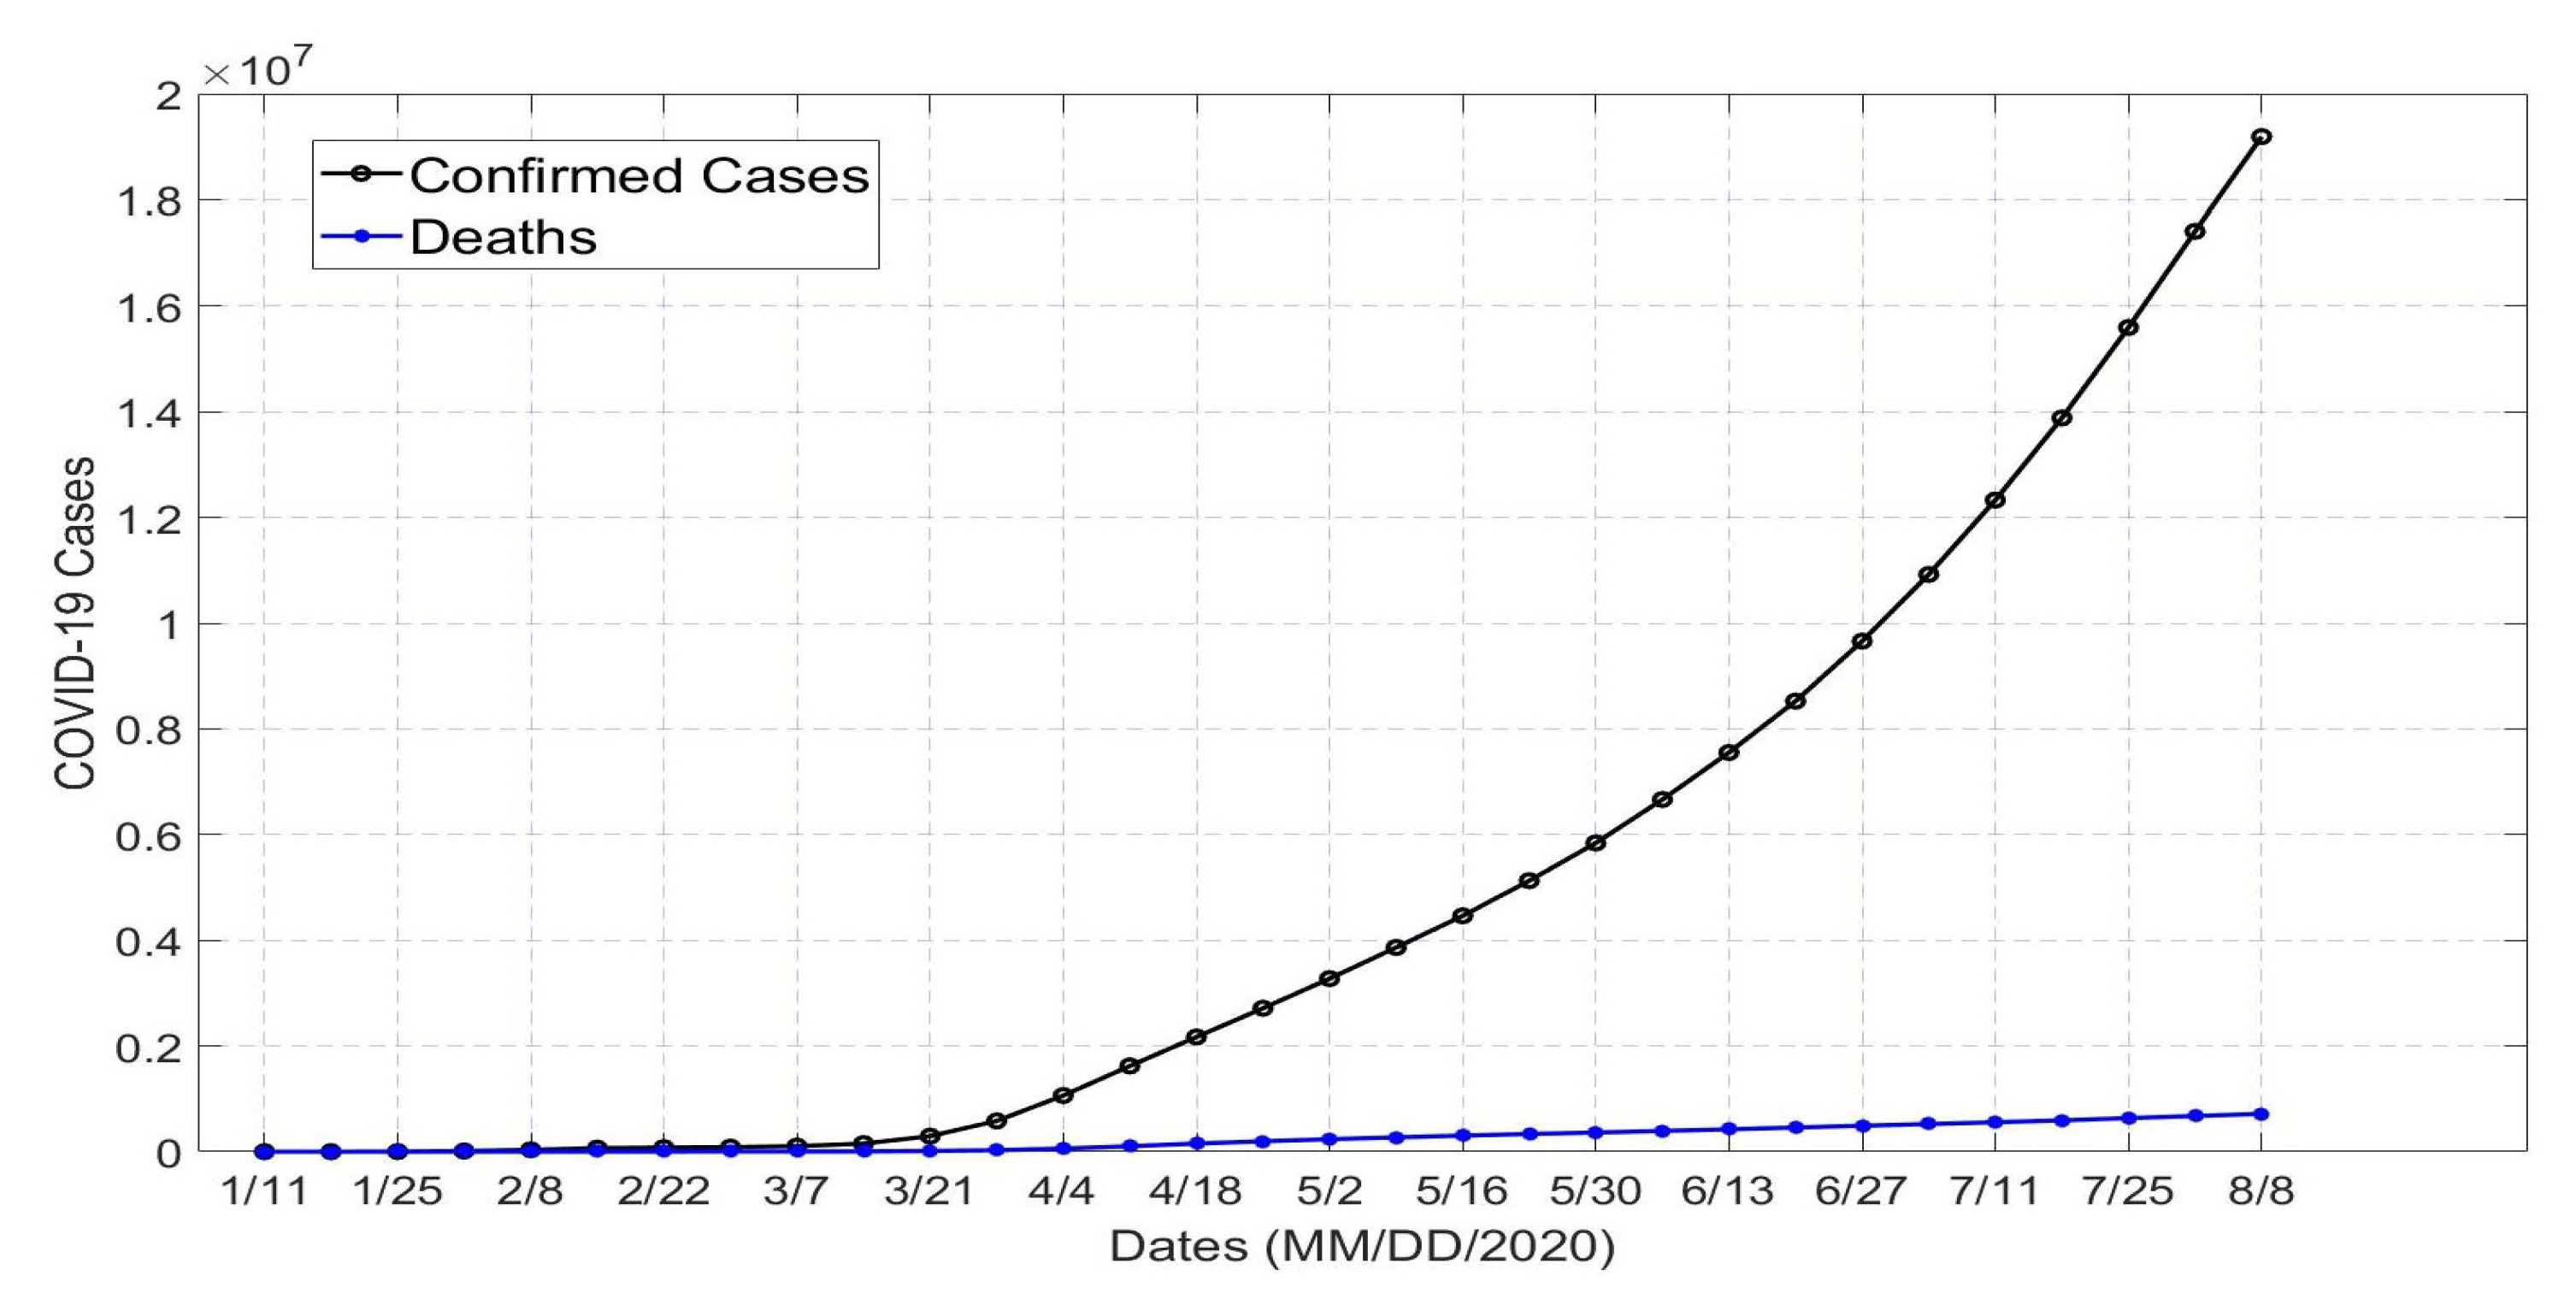
Figure 1. Time-series graph of world-wide total confirmed cases and deaths due to COVID-19.
Ai 01 00027 g001
Figure 2. Complete System Architecture for COVID-19 Detection with CNN.
Ai 01 00027 g002
Figure 3. (a,b) are the PA view of the chest X-rays of training dataset.
Ai 01 00027 g003
Figure 4. (a,b) are the PA view of the chest X-rays of validation dataset.
Ai 01 00027 g004
Figure 5. Workflow diagram of the proposed CNN model for COVID-19 detection.
Ai 01 00027 g005
Figure 6. Workflow diagram of the pretrained models for COVID-19 detection.
Ai 01 00027 g006
Figure 7. (a) Validation accuracy and (b) validation loss of all the six models with Dataset 1.
Ai 01 00027 g007
Figure 8. (a) Validation accuracy and (b) validation loss of all the six models with Dataset 2.
Ai 01 00027 g008
Figure 9. Confusion matrices of all the six models for analytical analysis of Dataset 1.
Ai 01 00027 g009
Figure 10. ROC curves of all the six models for analytical analysis with Dataset 1.
Ai 01 00027 g010
Figure 11. Confusion Matrices of all the six models for analytical analysis with Dataset 2.
Ai 01 00027 g011
Figure 12. ROC curves of all the six models for analytical analysis with Dataset 2.
Ai 01 00027 g012
Figure 13. (a,b) are the comparison of accuracy and F-1 score respectively for all the models with dataset 1 and 2.
Ai 01 00027 g013
Table 1. Categorization of the Dataset 1 and 2.
DatasetCOVID-19NormalTotalTrainingValidation
Dataset 1201201402COVID-19: 161 Normal: 161
Total: 322
COVID-19: 40 Normal: 40
Total: 80
Dataset 2295659954COVID-19: 236 Normal: 600
Total: 836
COVID-19: 59 Normal: 59
Total: 118
Table 2. Confusion Matrix Parameters and Performance Metrics of the Models.
ModelTPTNFPFNTP Percentage (%)TN Percentage (%)Accuracy (%)Precision (%)Recall (%)ROC AreaF1-Score
Model 1 Trained with Dataset 139391197.597.597.597.597.50.97597.5
Model 1 Trained with Dataset 259572010096.698.396.721000.98398.3
Model 2 Trained with Dataset 135400587.510093.7510087.50.93893.34
Model 2 Trained with Dataset 2475901279.710089.810079.70.89888.7
Model 3 Trained with Dataset 1403640100909590.91000.95095.23
Model 3 Trained with Dataset 259536010089.894.990.81000.94995.17
ResNet50 Trained with Dataset 131400977.510088.7510077.50.88887.32
ResNet50 Trained with Dataset 2455901476.310088.110076.30.88186.56
VGG-16 Trained with Dataset 1234001757.510078.7510057.50.78773.01
VGG-16 Trained with Dataset 2365902361.0110080.510061.010.80575.78
VGG-19 Trained with Dataset 18400322010060100200.6033.33
VGG-19 Trained with Dataset 2175904228.810064.410028.80.64444.72
Table 3. Comparison of Different Deep Learning Models Based on Dataset and Overall Performances.
Sl. No.ModelArchitectureNon-COVID-19 DatasetCOVID-19 DatasetOverall Accuracy (%)F1-Score
1Modified Deep CNN by Rahimzadeh and Attar [57]Xception+ ResNet50V2885118091.4
2Deep Transfer Learning based Model by Loey et al. [58]GoogleNet697999.9100
3Transfer Learning with CNN by Apostolopoulos and Mpesiana [33]MobileNet V250422496.78
4Transfer Learning Model by Sethy and Behera [32]ResNet50+ SVM252595.3895.52
5COVIDX-Net by Hemdan et al. [36]VGG1925259090.94
6Pre-trained CNN Model by Chowdhury et al. [44]DenseNet201157942399.7099.70
7Deep Neural Networks by Ozturk et al. [45]DarkCovidNet50012798.0896.51
8A Deep CNN-LSTM Network by Islam et al. [35]CNN-LSTM1525152599.498.9
9A CNN Model by Haque et al. [53]Sequential CNN20620697.5697.61
10A Deep CNN Model by Narin et al. [29]ResNet5050509898
11A Deep Learning Model by Zhang et al. [30]Deep CNN143110096
12Deep Learning Model by Hall et al. [31]ResNet5010210289.2
13COVID-CAPS by by Afshar et al. [49]Capsule Networks95.7
14DeTraC Deep CNN by by Abbas et al. [59]DeTraC8010595.12
15COVID-CXNet by by Haghanifar et al. [46]Pre-trained CheXNet320042899.0496
16CoroNet by by Khan et al. [47]Xception3102849998.5
17Deep Transfer Learning Model by by Minaee et al. [48]SqueezeNet500018492.29
18Proposed ModelSequential CNN65929598.398.3