Article

Image Collection Summarization Method Based on Semantic Hierarchies

by
Zahra Riahi Samani
1,* and
Mohsen Ebrahimi Moghaddam
2
1
Center for Biomedical Image Computing & Analytics, Perelman School of Medicine, University of Pennsylvania, Philadelphia, PA 19104, USA
2
Faculty of Computer Science and Engineering, Shahid Beheshti University, Tehran 15119-43943, Iran
*
Author to whom correspondence should be addressed.
AI 2020, 1(2), 209-228; https://doi.org/10.3390/ai1020014
Submission received: 14 April 2020 / Revised: 10 May 2020 / Accepted: 13 May 2020 / Published: 18 May 2020

Abstract

:
The size of internet image collections is increasing drastically. As a result, new techniques are required to facilitate users in browsing, navigation, and summarization of these large volume collections. Image collection summarization methods present users with a set of exemplar images as the most representative ones from the initial image collection. In this study, an image collection summarization technique was introduced according to semantic hierarchies among them. In the proposed approach, images were mapped to the nodes of a pre-defined domain ontology. In this way, a semantic hierarchical classifier was used, which finally mapped images to different nodes of the ontology. We made a compromise between the degree of freedom of the classifier and the goodness of the summarization method. The summarization was done using a group of high-level features that provided a semantic measurement of information in images. Experimental outcomes indicated that the introduced image collection summarization method outperformed the recent techniques for the summarization of image collections.

1. Introduction

Digital image proliferation has led to the explosion of images and a collection of multimedia data. The majority of these collections are personal collections. For example, one may have a large set of images related to a vacation trip. Managing this huge amount of data is a challenging problem. Image collection summarization methods are provided as a solution to this problem. They provide users a group of most explanatory images from the original huge image collection.
Social media sites’ popularity (e.g., Flickr or Instagram) and social networks for posting photos have given rise to a new form of communication [1] and online photo sharing. This has further increased the need for such systems. Hence, image summarization systems are considered as an essential step to provide a successful platform in image collection and sharing. This can help users to discover the most relevant and important images in each collection efficiently.
Existed methods of image collection summarization are categorized as follows: visual summarization methods and multi-modal summarization ones. Visual summarization techniques apply only visual features of images. Generally, these methods utilize numerical metrics for doing the summarization and ignore semantic relations among images [2,3].
Images on web and social networks often have associated textual tags. This data is a rich source of information to be used together with visual features for image collection summarization. There are various effective techniques available in the literature that aim to model semantic data by using image visual features in combination with its textual data (such as [4]). We discussed these two categories with more details in Section 2.
Ontologies have also shown to improve the result of image collection summarization methods as an alternative to using textual tags when they are not available or difficult to process. Samani and Moghaddam [5] proposed a semantic version of graph centrality algorithms that used domain ontology for image collection summarization. In their approach, they used the concepts of the domain ontology to provide candidate categories for defining semantic similarity between images. In this paper, we used not only the concepts of the domain ontology but also the semantic hierarchy between ontology concepts as an important factor in doing the summarization.
Semantic hierarchies have shown to attain significant improvements comparing to the existed methods in image classification and object recognition algorithms [6,7,8,9]. In this study, we proposed a method according to the semantic hierarchies for image collection summarization. This was the first approach that used semantic hierarchies in both classification and summarization tasks and showed the compromise that exists between those two tasks.
In the proposed approach, a semantic hierarchical image classification technique was used that mapped images to the nodes in a predefined domain ontology that could finally provide information content measurement and semantic similarity between images. We made a compromise between hierarchical classification and summarization techniques. As the image classification approach moved toward more general and more specific classifiers, the result of image summarization got worse. There existed a trade-off point where the summarization performed best. Finally, a group of high-level features was stated based on the hierarchical classifier output for the classification task.
The main contributions of this study are itemized as below:
  • An image summarization technique was proposed that was based on a semantic hierarchical image classification approach.
  • A set of hierarchical features was introduced, and it was shown that semantic hierarchies are an important factor not only in the classification but also in the summarization step.
  • It was shown that a trade-off point existed between the degree of freedom of the classification technique and the goodness of the summarization method.
The suggested technique was adopted in semantic representative image selection for a dataset of Flickr images in cities and locations. Experimental outcomes demonstrated that the introduced image summarization technique had superior performance compared to the current image summarization approaches.
It should be noted that this study focused on the information summarization of an image collection. Some methods consider attractiveness [10], aesthetic [11], quality [12], and further images’ factors [13] as important attributes for doing summarization. Even though the features are considered as important in summarization, the focus of the presented study was on semantic information.
Outline: The remaining parts of this study are organized as follows. In the following part, a comprehensive literature review is conducted in the scope of image summarization. Then, we proposed the summarization method. Experimental results, conclusions, and further work are discussed in the last two Sections.

2. Related Works

Image summarization can be categorized into two main scopes: visual summarization methods and multi-modal summarization ones. By visual summarization methods, we referred to the category of work that applies only visual characteristics as their summarization features. Multi-modal image collection summarization methods usually combine visual features with other modalities like textual, geographical, or other kinds of data. This side data usually comes in the context of social or web images. We first reviewed visual image summarization methods and then looked at the multi-modal image summarization approaches.

2.1. Visual Image Summarization Systems

Various studies have been carried out in the field of image collection summarization. Authors in [14] applied a greedy k-means technique. Their algorithm was based on iteratively selecting exemplars that aimed to meet an objective function considering three main goals: maximizing the selected set’s similarity with the primary set, minimizing selected set’s similarity to itself, and minimizing the selected set’s size. The technique suggested in [15] utilized almost the same objective function.
Clustering approaches, such as k-means [16] or affinity propagation [17], are also widely used for doing the image collection summarization. These methods put images into different clusters and then select one representative image out of each cluster. The same approach has been applied in text summarization systems [18].
Graph centrality algorithms have also been used to analyze the images’ similarity and doing the summarization [19,20,21]. Jing and Baluja [19] selected a group of representative images based on the PageRank algorithms. They made a similarity graph in which images represented the nodes, and their similarity represented the edge between them. Authors in [5] proposed a semantic version of graph centrality algorithms for the summarization of image collection.
Emerging branches in neural networks, especially deep learning approaches [22], such as recurrent neural networks [4] and generative adversarial networks [23], have demonstrated promising improvements in video and text summarization [24]. Temporal information exists in the form of the frames and sequences [25] in video and text, which can be modeled by temporal neural networks, such as long short-term memory (LSTM) [26] and recurrent neural network. In the case of image collection, the temporal sequence between two images does not exist that can be exploited by the network [27]. However, there are a couple of approaches that use Convolutional Neural Network (CNN) for image collection summarization. As an example, Singh and colleagues used a convolutional neural network approach, which was trained by a generator for reconstructing the primary image collection and a discriminator to categorize primary and summary images [2]. Ozkose and colleagues jointly trained a discriminator network to assess the chosen images’ diversity [3].

2.2. Multi-Modal Image Summarization System
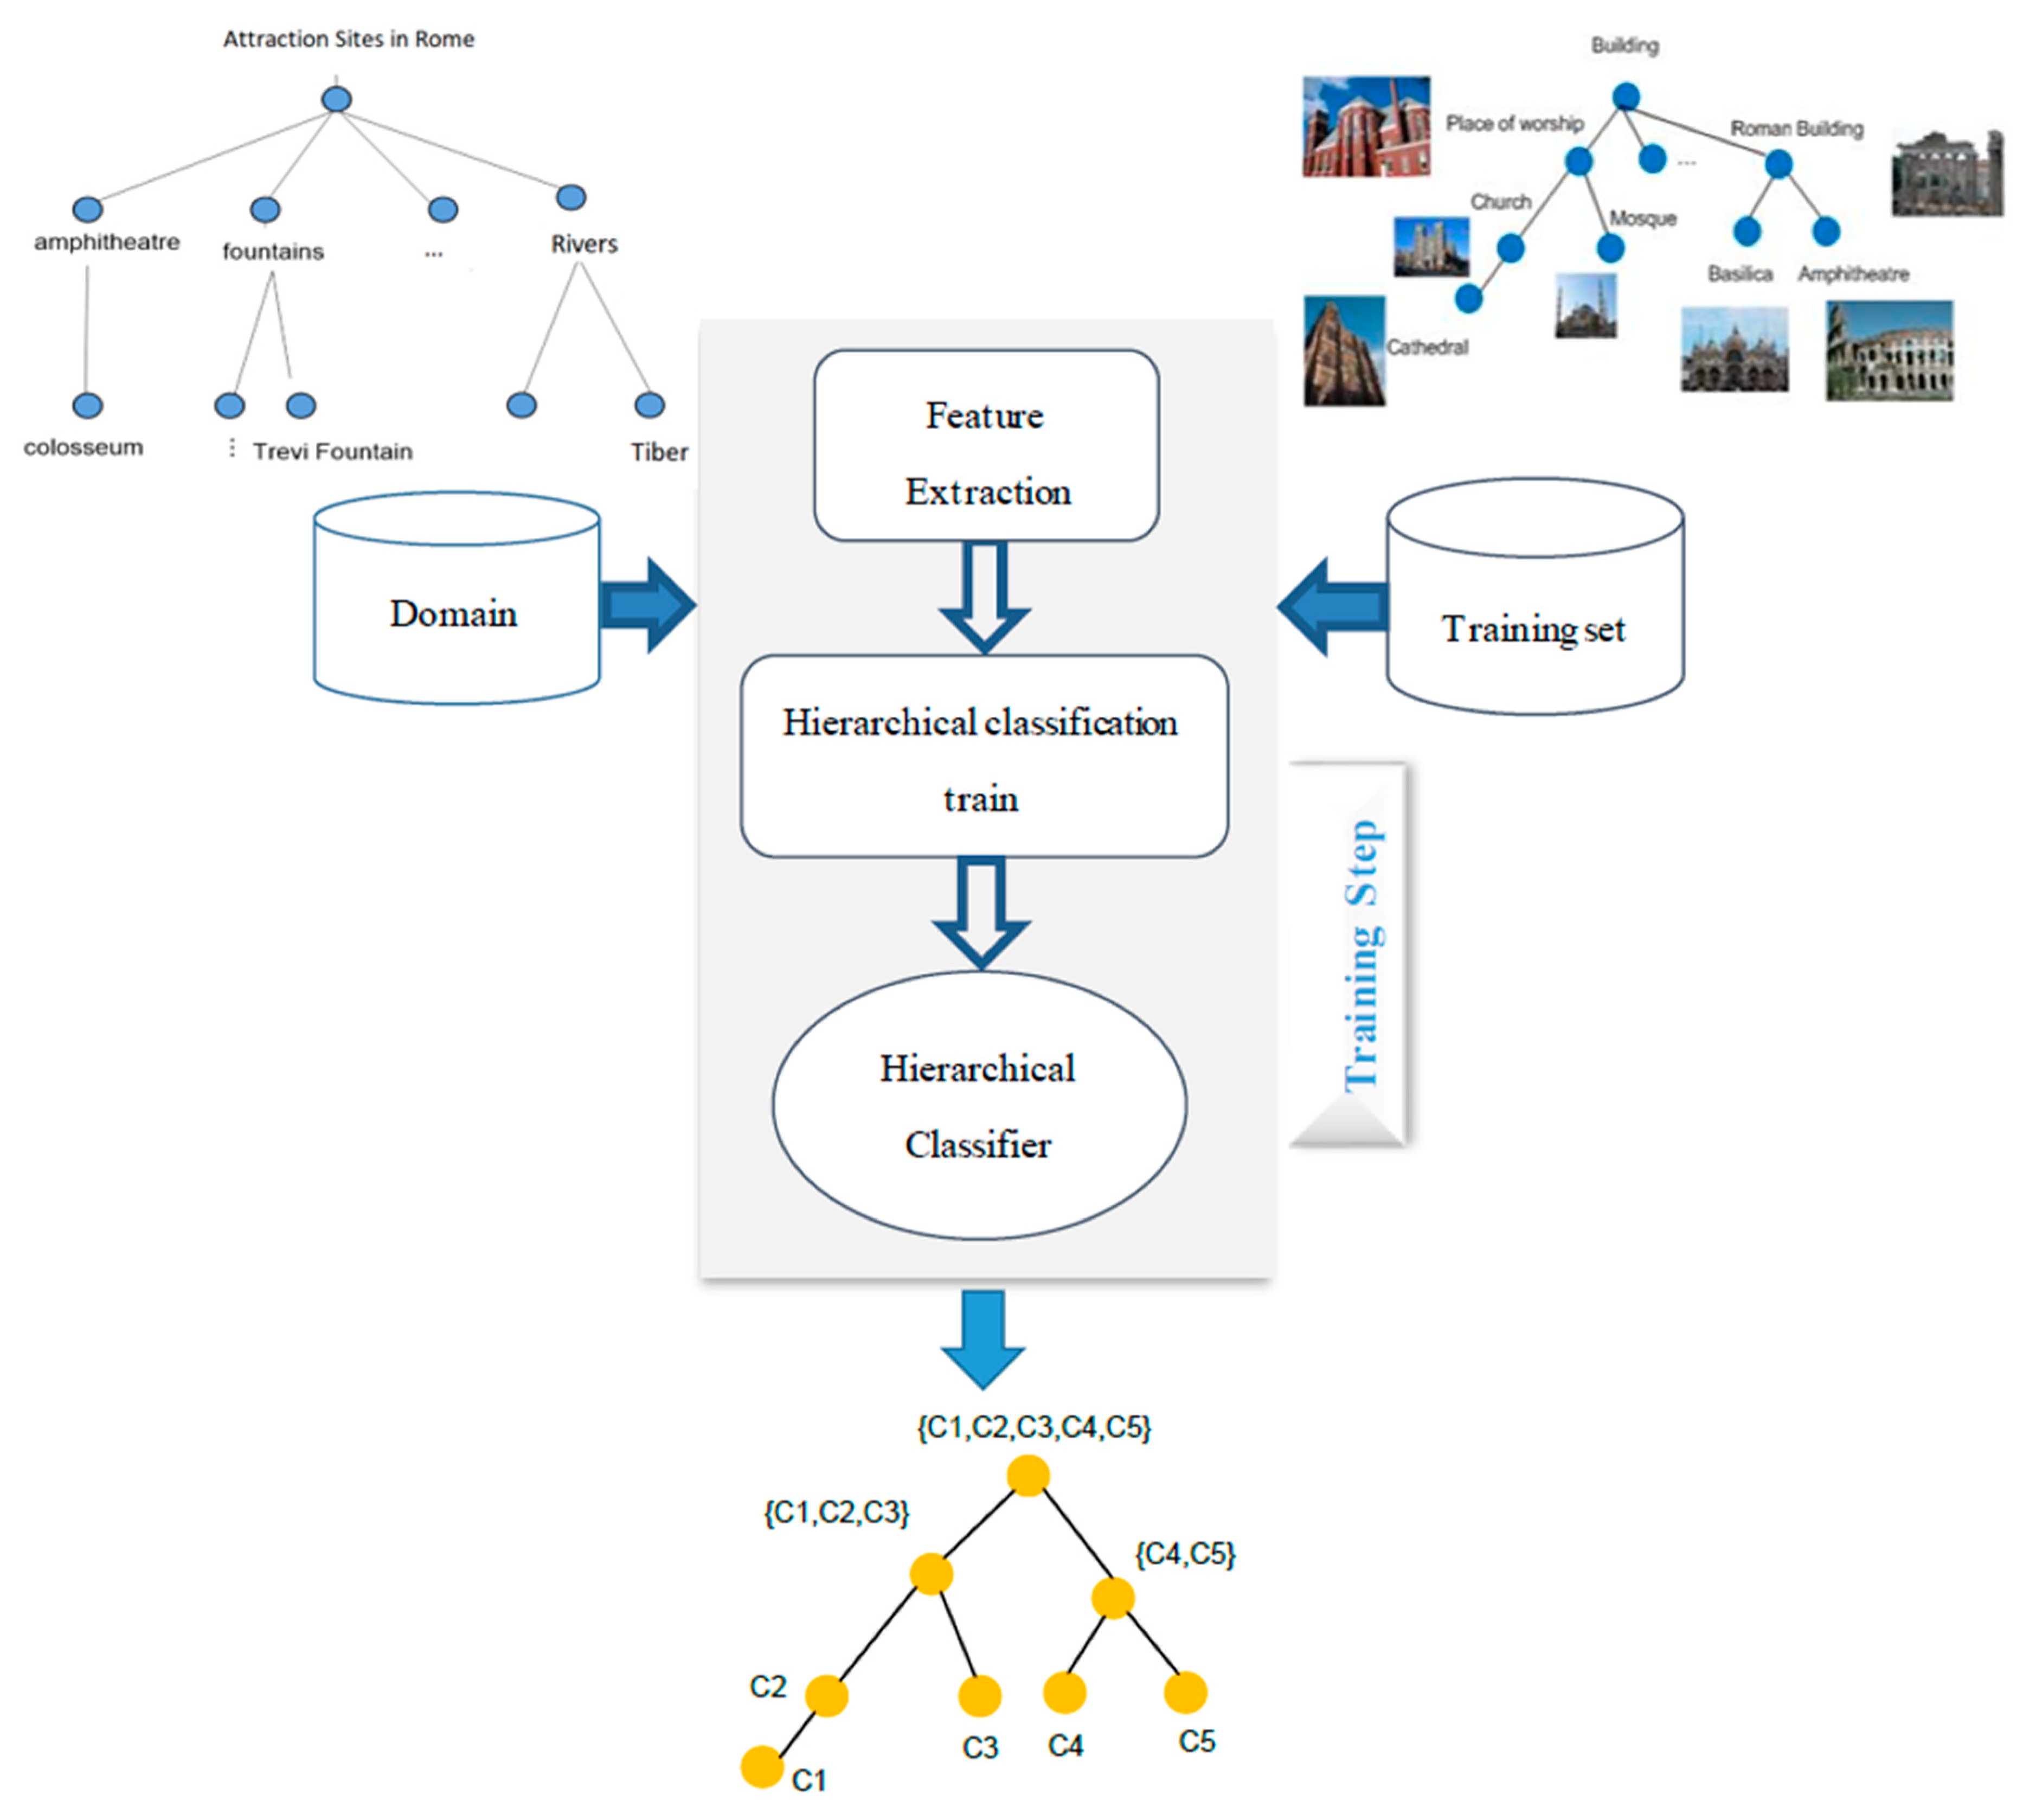
Multi-modal image summarization techniques utilize accompanying data like social, geo, textual, temporal, or other side information along with visual attributes to perform the summarization [28].
Textual data is the most prominent modality that is used for doing image summarization [29]. For instance, Pang et. al [30] suggested a technique that first selected representative topics using a text mining method and then chose images corresponded to the chosen topics as representative images. In [31], authors employed non-negative matrix factorization first in the textual domain and then applied the textual latent topics’ outcomes to perform non-negative matrix factorization in the visual domain for the summarization purpose. Chen and colleagues introduced a multi-modal Recurrent Neural Network (RNN) approach for extractive summarization of documents with images. In their method, sentences were encoded with the hierarchical RNN, and images were fed into a CNN. This was followed by computing the probability of sentence selection and then sentence–image alignment using a logistic classifier [4]. Zhang and colleagues proposed a model based on joint optimization of convex non-negative matrix factorization that integrated both tags and images. The main objective function defined as visual and textual error functions that shared the same indicator matrix to connect various modalities [32].
Social behavior is the next modality that is used to select representative images. Rudinac and colleagues [13] described one of the methods in this category. They conducted a crowdsourcing observation to attain how users do the summarization. The outcome of this observation was then used to decide on the features of summarization. Samani and Moghaddam considered likes or bookmarks of images on social networks as their measure of attractiveness and used this measure for doing the summarization and defined their MCCS (Multi-Criteria Context-Sensitive) approach [10]. Jeong and colleagues reported another sample of this category [33].
The last category is location and time meta-data. Shen et al. [34] utilized a mixture of time, location, and semantic features to perform summarization.
The majority of the image summarization techniques include unsupervised methods. However, some of the supervised methods are introduced in [35,36]. These techniques utilize learning methods to minimize the difference between manual and computer-generated summaries. These techniques mostly operate on the order of hundreds of images [35] since this is not straightforward for a human to create summaries of thousands of images. This study focused on unsupervised methods. Various related work, conducted on image summarization on pure images, have applied numerical metrics to perform the summarization [2,3]. Semantic information, ontology, and knowledge-based platforms are applied in a different scope of multimedia, like computing the affective-aesthetic potential of literary texts [37] and robot intelligent service [38]. In this study, we proposed a semantic technique for image collection summarization.
Table 1 shows a comparison among some of the most recent work in image collection summarization with samples from text and video summarization approaches. As seen, methods were different in their supervision strategy and the modality they applied to extract summary information. Likewise, they had different criteria to consider. Some only focused on information content [5], while others considered other factors like attractiveness [10]. Finally, they were different in their summarization approach.

3. Proposed Method

According to the previous discussion, most of the literature work in image collection summarization have performed the summarization according to the visual features. Semantic features are usually extracted from images and their corresponding textual tags. Ontologies and semantic relations have been shown to improve similar problems in the area of text summarization [40]. They provide the knowledge backbone for intelligent systems [41]. This part aimed to introduce a technique for doing semantic image summarization. Our proposed method was composed of two phases: training and test. These phases are shown in Figure 1 and Figure 2.
During the training stage, a model of classifier known as hierarchical was trained. Figure 1 shows this phase in detail. The inputs of the training phase were the domain ontology and the training set. Domain ontology provides the concepts and the relations between them [42], and the training set provides data for training of the concepts of the ontology. Here, the goal in the training phase was to train a hierarchical classifier with the nodes of the domain ontology. At every node of the domain ontology, a classifier was trained that should distinguish between immediate sub-concepts of the current node.
The test module contained the classification test and summarization steps. The inputs of the test module were domain ontology and image collection to be summarized. In this part, the hierarchical classification was done by choosing the sub-trees that the image was classified with most confidence. In the next steps, ontology features were extracted, and semantic information content of each image was obtained. Finally, a summarization algorithm was proposed to select representative images based on the computed ontology features. The example in Figure 2 shows images of Rome city. The test module got the ontology about attraction sites in Rome as the input knowledge and did the classification of images. Finally, a representative set of images was chosen. In the following two parts, we have discussed the details of the classification and summarization modules.

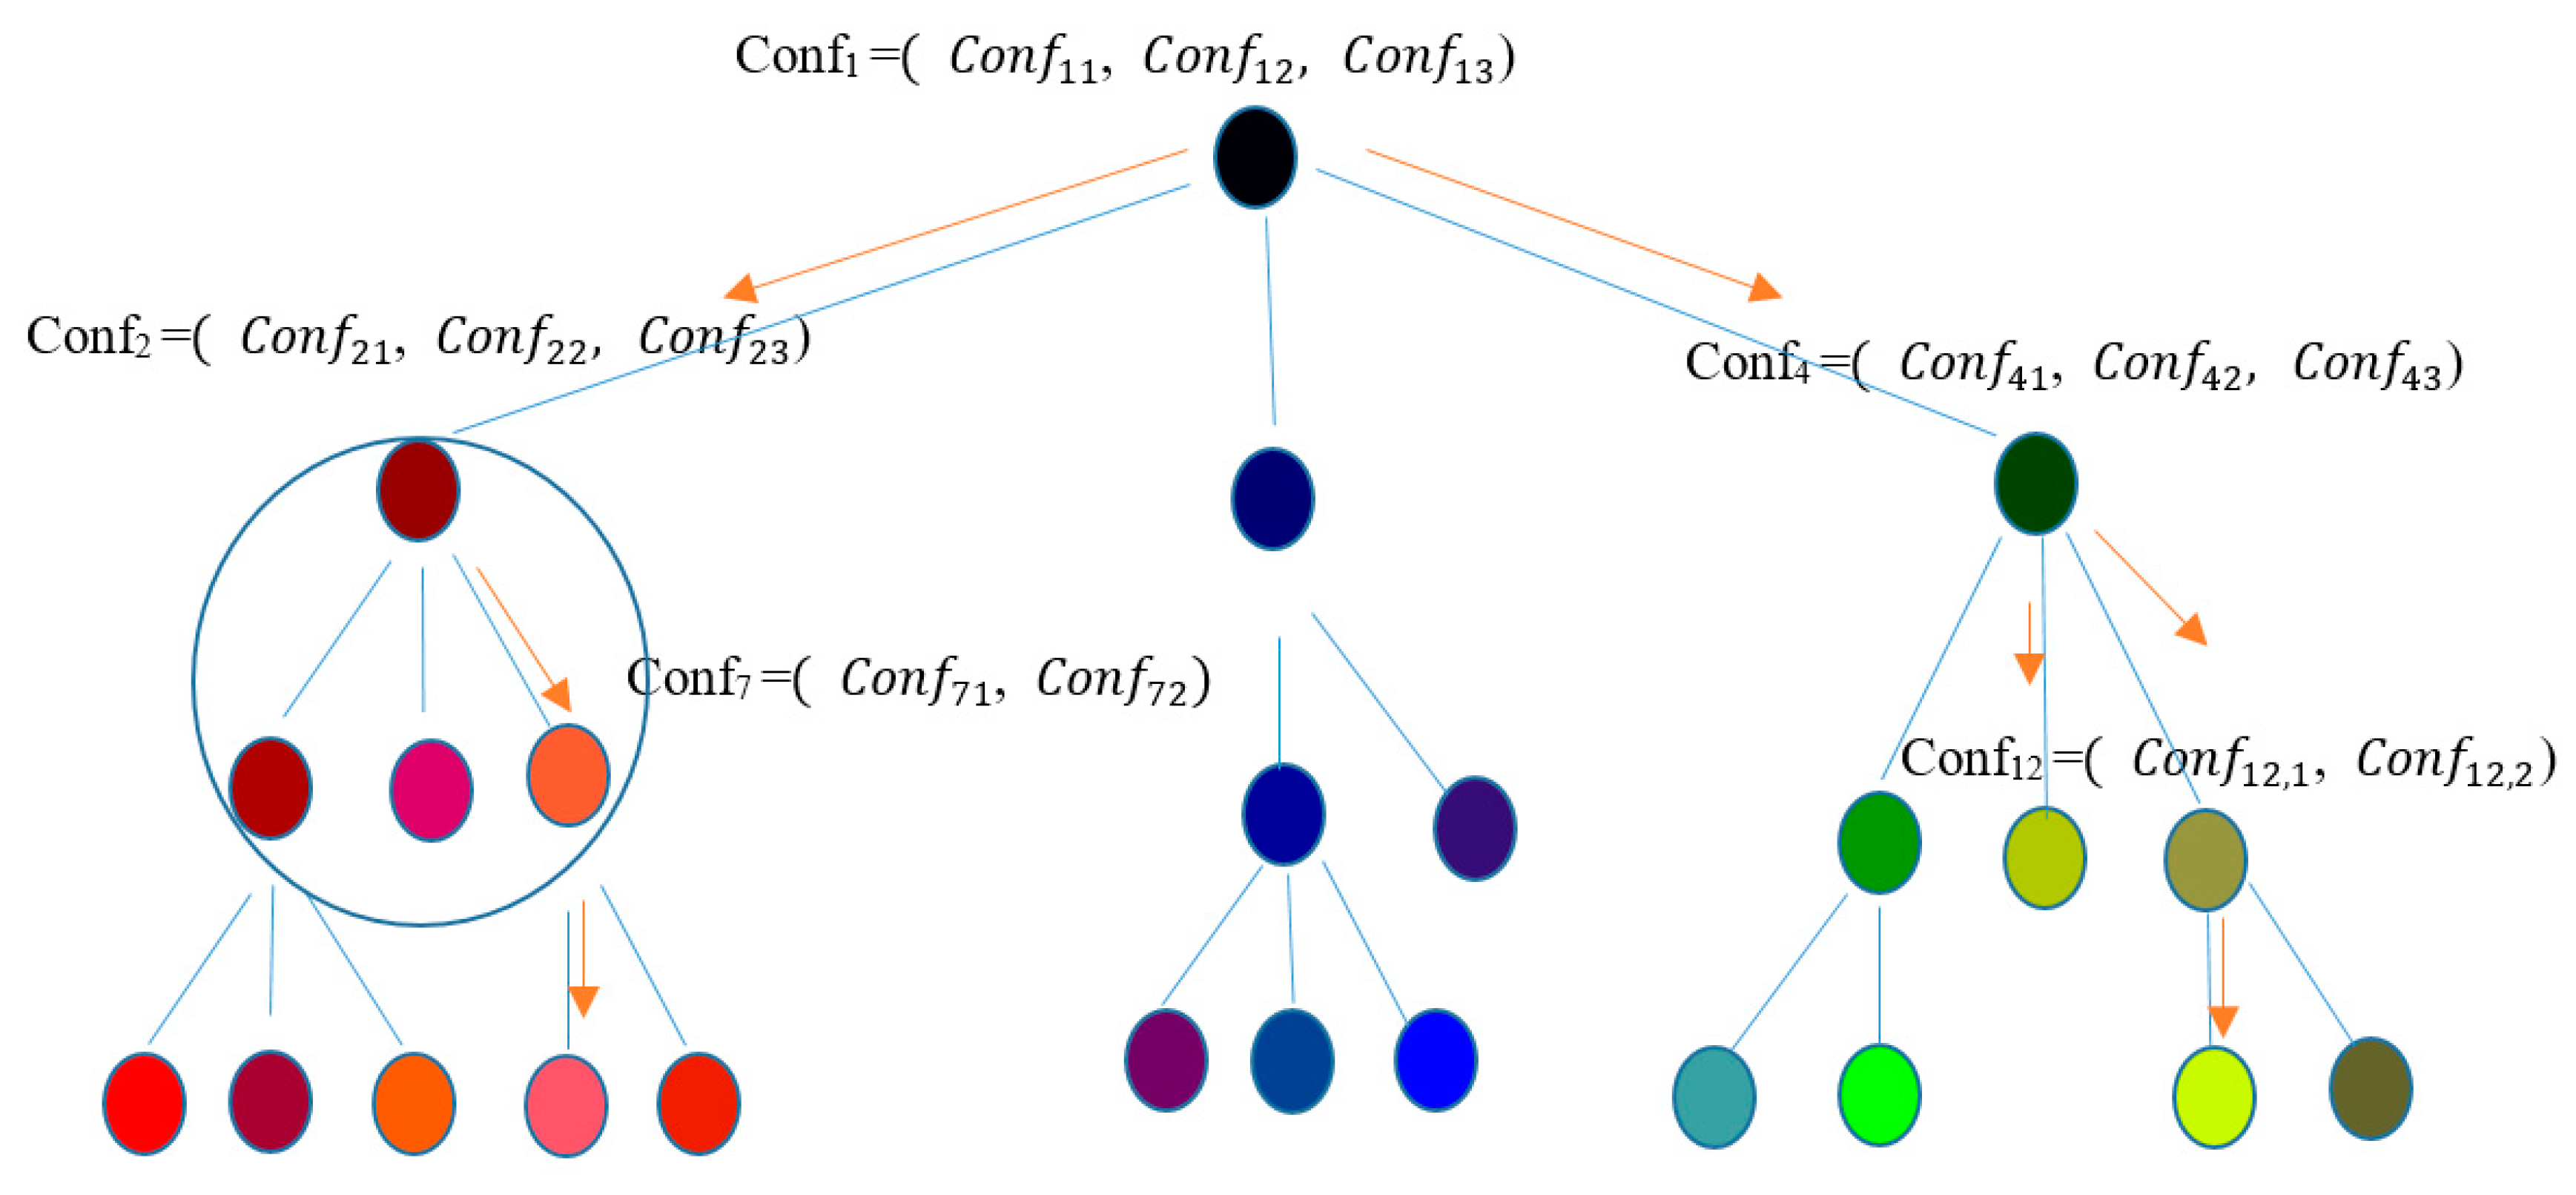
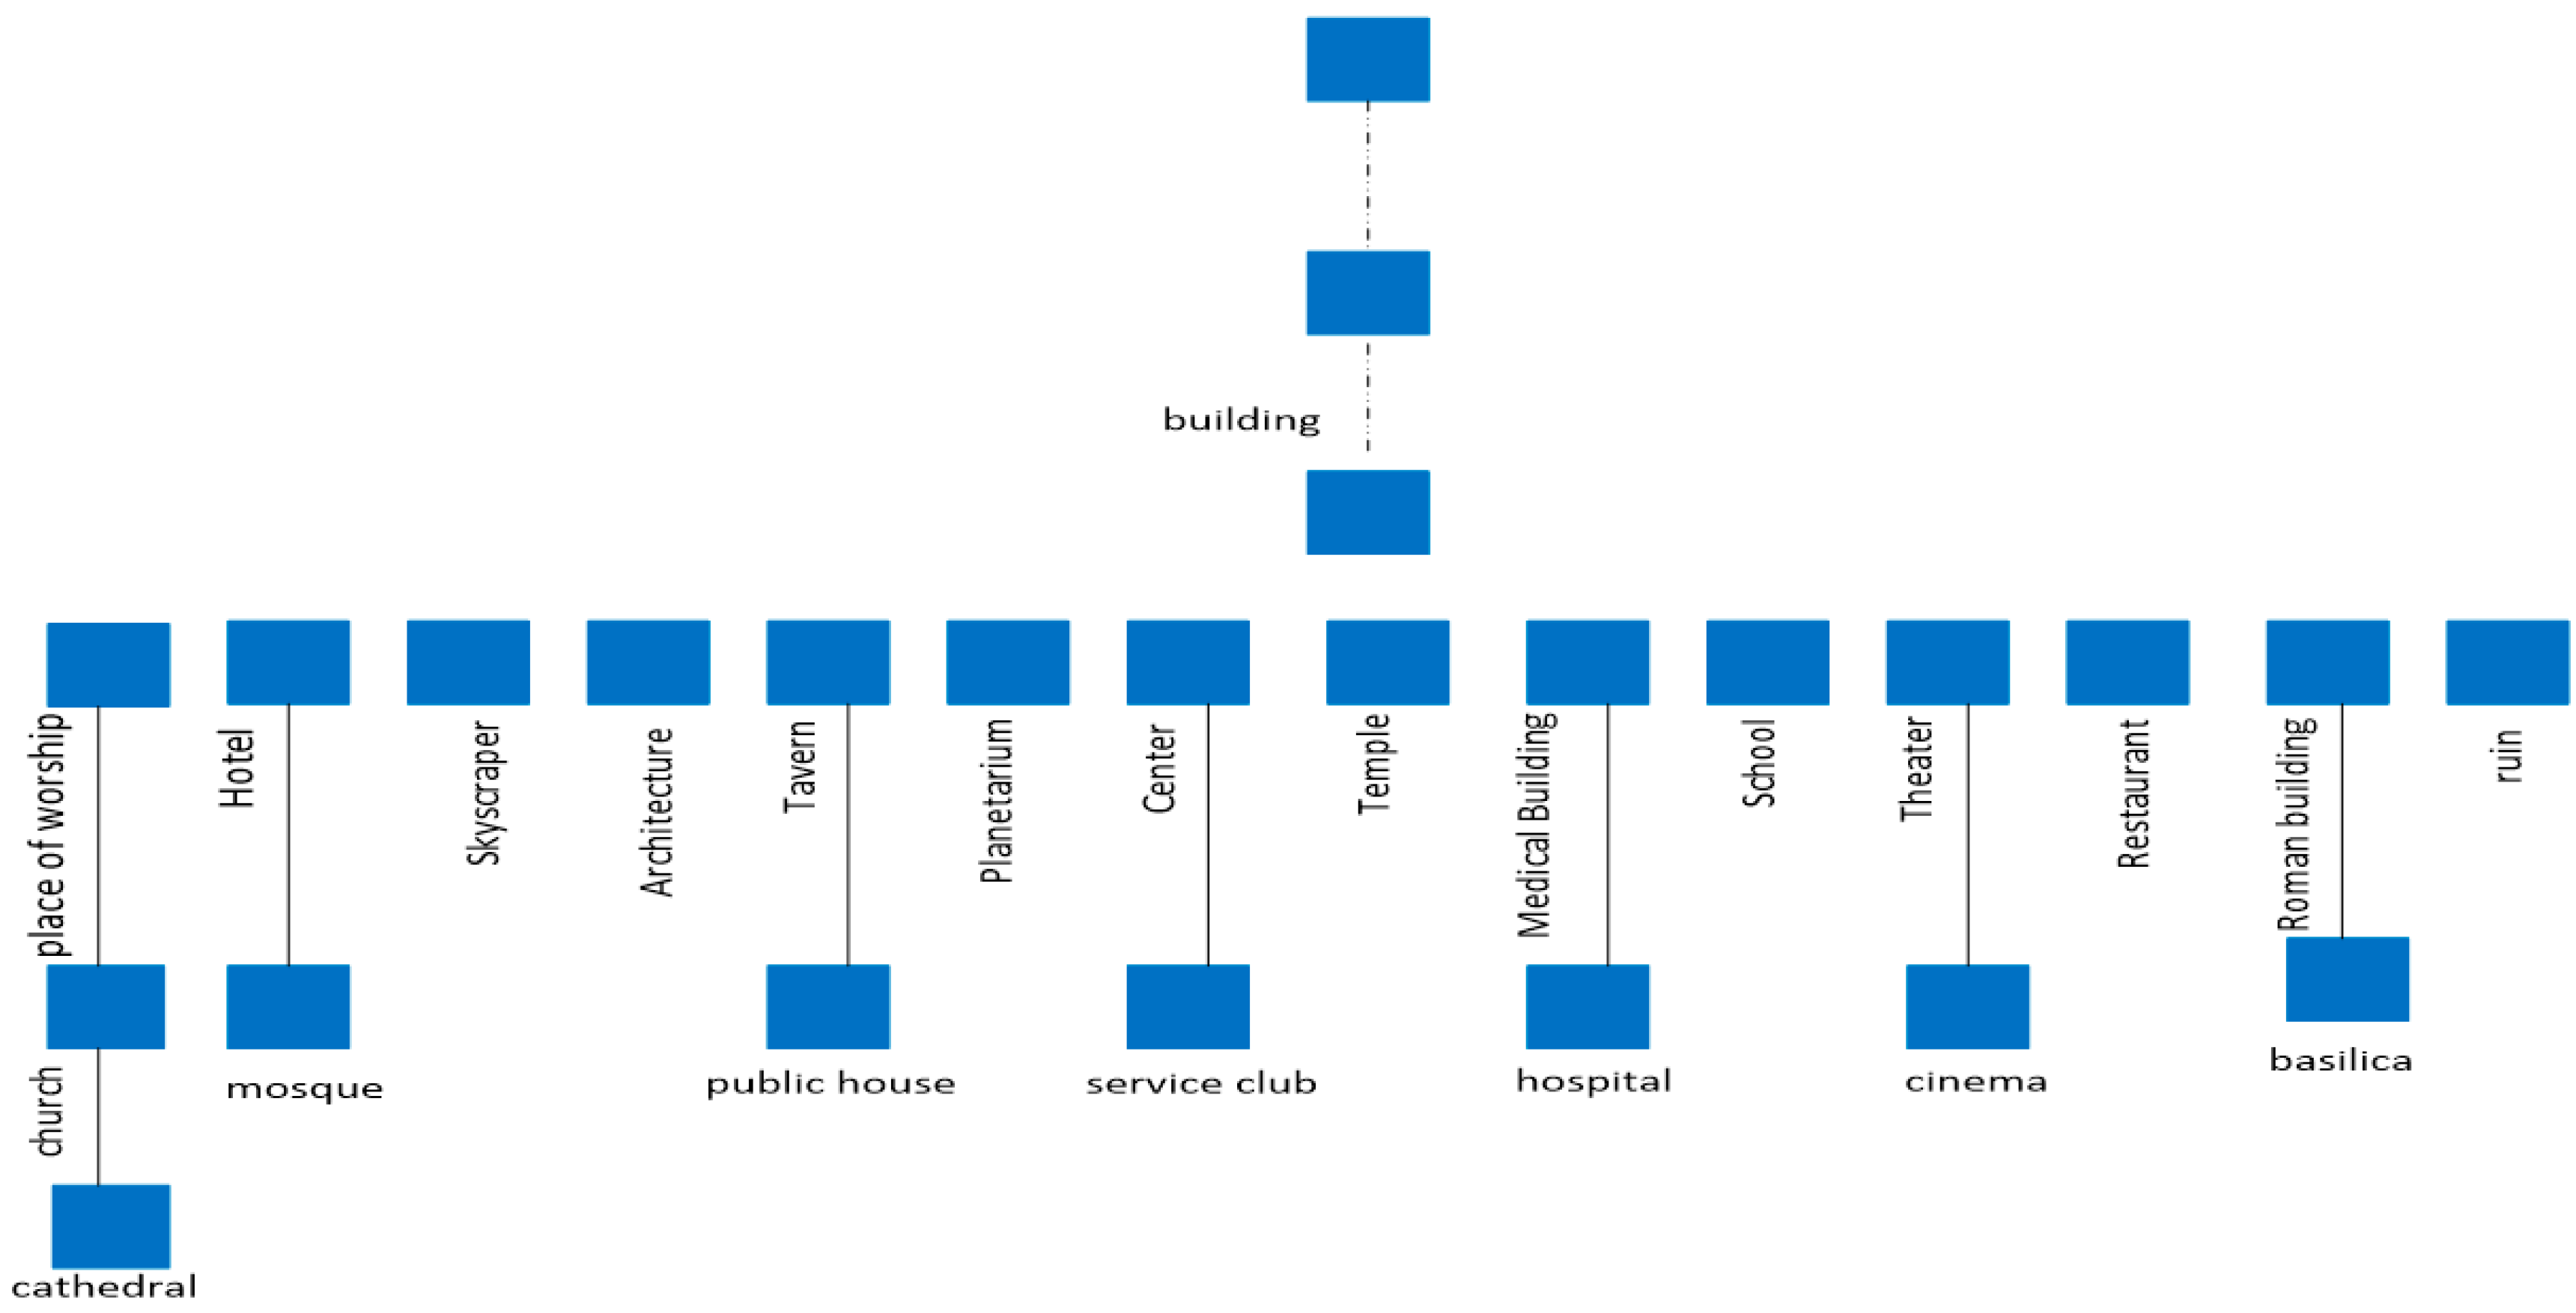
3.1. Hierarchical Classification

We organized a group of classifiers in a hierarchical structure. The hierarchical structure was based on the semantic taxonomic relations in the domain ontology. This layout of classifiers provided the data for making our summarization features space. The idea of the hierarchical classification approach was to move from the root of the ontology to the leaves and find the best nodes that an image could be assigned (classified) to. For this purpose, there were three issues to discuss: classifiers layout, type of classifiers, and traversing between classifiers.
In the proposed method, a multiclass classifier was assigned to each non-leaf node in the ontology space. The purpose of each classifier would be to distinguish among immediate sub-concepts of the current node. Thus, at each node N, a c-way multi-class classification module was used, in which c is defined as the number of sub-concepts of N.
Recently, multi-class classification has caught the attention of many researchers in the computer vision area. For instance, in [8,9], authors leveraged the hierarchical relations among different classes to enhance the overall accuracy of classification models. The hierarchical relations can be formed as visual [43], semantic [44], or even both [45]. Moreover, hierarchies can be employed in the learning and feature extraction stage [46], similarity metric learning [47], and the classification algorithm [48].
Although semantic hierarchies have been applied widely in image classification techniques, they have been applied less in image summarization systems. This study focused on how semantic hierarchies could affect the summarization method; so, we used a basic classifier at each node. In this way, we used Support Vector Machine (SVM) classifiers with Bag of Visual Words (BoVW) representation [46]. At each Node N, c numbers of SVM classifiers were used, where c states the sub-concepts number in the current node. Each classifier must detect one sub-concept of the current node from the others. One could use a stronger classification approach to have a better summarization method [49].
After setting up and training the classifiers, we used a recursive algorithm for moving in the ontology space and running the classifiers. It is shown in Figure 3. For every image, we started from the root node and performed the classification at each node. Based on the analysis of the output of the classifier at each node, several sub-concepts were selected for further exploration. Sub-concepts were then traversed recursively, and the classification was done for the grandchildren. Finally, the classifier mapped each image to several nodes in the taxonomy (Figure 3).
The next question was how to choose sub-concepts for further exploration. We proposed to use statistical analysis on the confidence of belongings of the image to each sub-concept. If we defined Confi as a vector of confidence values:
C o n f i = ( C o n f i N 1 ,   C o n f i N 2 ,   ,   C o n f i N c )
where c is defined as the sub-concepts number of the current node, C o n f i N j states the confidence of belonging of image i to the category assigned to node Nj. We proposed to select node Nk for further exploration based on the following criteria:
N k :     C o n f i N k > μ ( C o n f i ) + α σ ( C o n f i )
where μ   a n d   σ are defined as the mean and standard deviation of the Confi vector. The parameter α determines the branching behavior. The very high value of it made the algorithm choose only a single path, and lower values resulted in selecting multiple paths. In experimental results, we have shown the optimum value for alpha. The result of the image classification method was several paths from the root to the leaves (Figure 3) with different confidence values, which were used as summarization features.

3.2. Summarization

After the classification, each image was represented by sub-trees in the ontology space. We used the ontology nodes as ontology features, which could be used to measure semantic similarity between images.
A bag of features was generated for every image using the nodes selected by a hierarchical classifier. All the nodes in the paths from the root to the target node were considered as features. If an image was mapped to multiple sub-trees in the ontology, all nodes from all sub-trees were included. Figure 4 shows a hypothetical sample of domain ontology with two images I1 and I2. I1 was mapped to N9 and N7, and I2 was mapped to N8. The corresponding feature vector is represented (colored) in Table 2 that could be formulated as below:
F i = ( N i 1 , , N i j , , N i c )
where c states the concepts’ number in the ontology, and N i j states the feature value of image i based on node j and could be defined as follows:
N i j = R a t i o j × C o n f i j
where C o n f i j states the confidence of belongings of image i to the class of node j, and R a t i o j is formulated as follows:
R a t i o j = N j N t = i = 1 n C o n f i j k = 1 c i = 1 n C o n f i k
where n is defined as the overall number of images in the collections, and C states the number of concepts in the ontology. Parameter R a t i o j considers the concept’s frequency in calculating the features in ontology space. By applying R a t i o j , the more frequent concepts have a more important role as summarization features. Given the fact that eventually, the summary images need to be a proper illustrator of the original set, it is reasonable to give more chances to the concepts that happen more frequently in the original set.
After computing a bag of features for each image, the feature vector of the whole collection could be obtained using the aggregation of all images feature vectors.
w N j ( t ) = i I m a g e C o l l e c t i o n N i j n
where w N j ( t ) is the feature value of the total collection according to the node Nj, and N i j states the feature value of image i based on node j. As the distance measurement technique, cosine distance between the feature vectors of the image and the one for the collection was applied.
S i m i C = F i · F C | F i | | F C |
In the above formula, Fi and FC state as ontology features of the image i and the whole collection. The operator “·” is defined as a dot product between images. This measurement of similarity is equivalent to the sub-tree overlap in the ontology space. In each image i, S i m i C presents the similarity of the image to the information content of the initial image collection. In another word, it captures how well an image represents the information content of the collection in the ontology space. Thus, the larger values of S i m for an image i mean that image i is more representative.
Our semantic ranking algorithm for summarization is shown in Algorithm 1. The first image was selected based on the max value of SummVect. SummVect was initialized by Sim vector, and it was updated after selecting each image in the summary set. Images that were selected in the next steps needed to be like the original collection and dissimilar to the selected set. This was done in lines 7 to 9. The value of parameter β determined the trade-off between the similarity to the initial set and dissimilarity to the selected set. In experimental results, we have shown how parameter β affected the goodness of the summarization system.
Algorithm 1 Summarization algorithm
1: function S u m m a r i z a t i o n ( S i m , C )
  Sim: Similarity Vector
  C: Original Collection
2: S u m m V e c t = S i m
3: for selected numbers of S u m m a r y S e t do
  4: S u m m a r y I m a g e = S u m m a r y I m a g e I m a g e   w i t h   M a x ( S u m m V e c t )
  5: Update ( S u m m V e c t ,   S u m m a r y I m a g e )
6: end for
7: Update S u m m V e c t ( S u m m V e c t ,   S u m m a r y I m a g e )
8: S u m m V e c t = β × S u m m V e c t + ( 1 β ) ( 1 s i m i l a r i t y ( S u m m V e c t ,   S u m m a r y I m a g e ) )
9: end function

4. Experimental Results

We applied the experiments on 40,000 images from Flickr corresponding to the locations and cities. In this section, the following points have been discussed:
  • Datasets and implementation details
  • Methods for comparison
  • Evaluation metric for the proposed approach
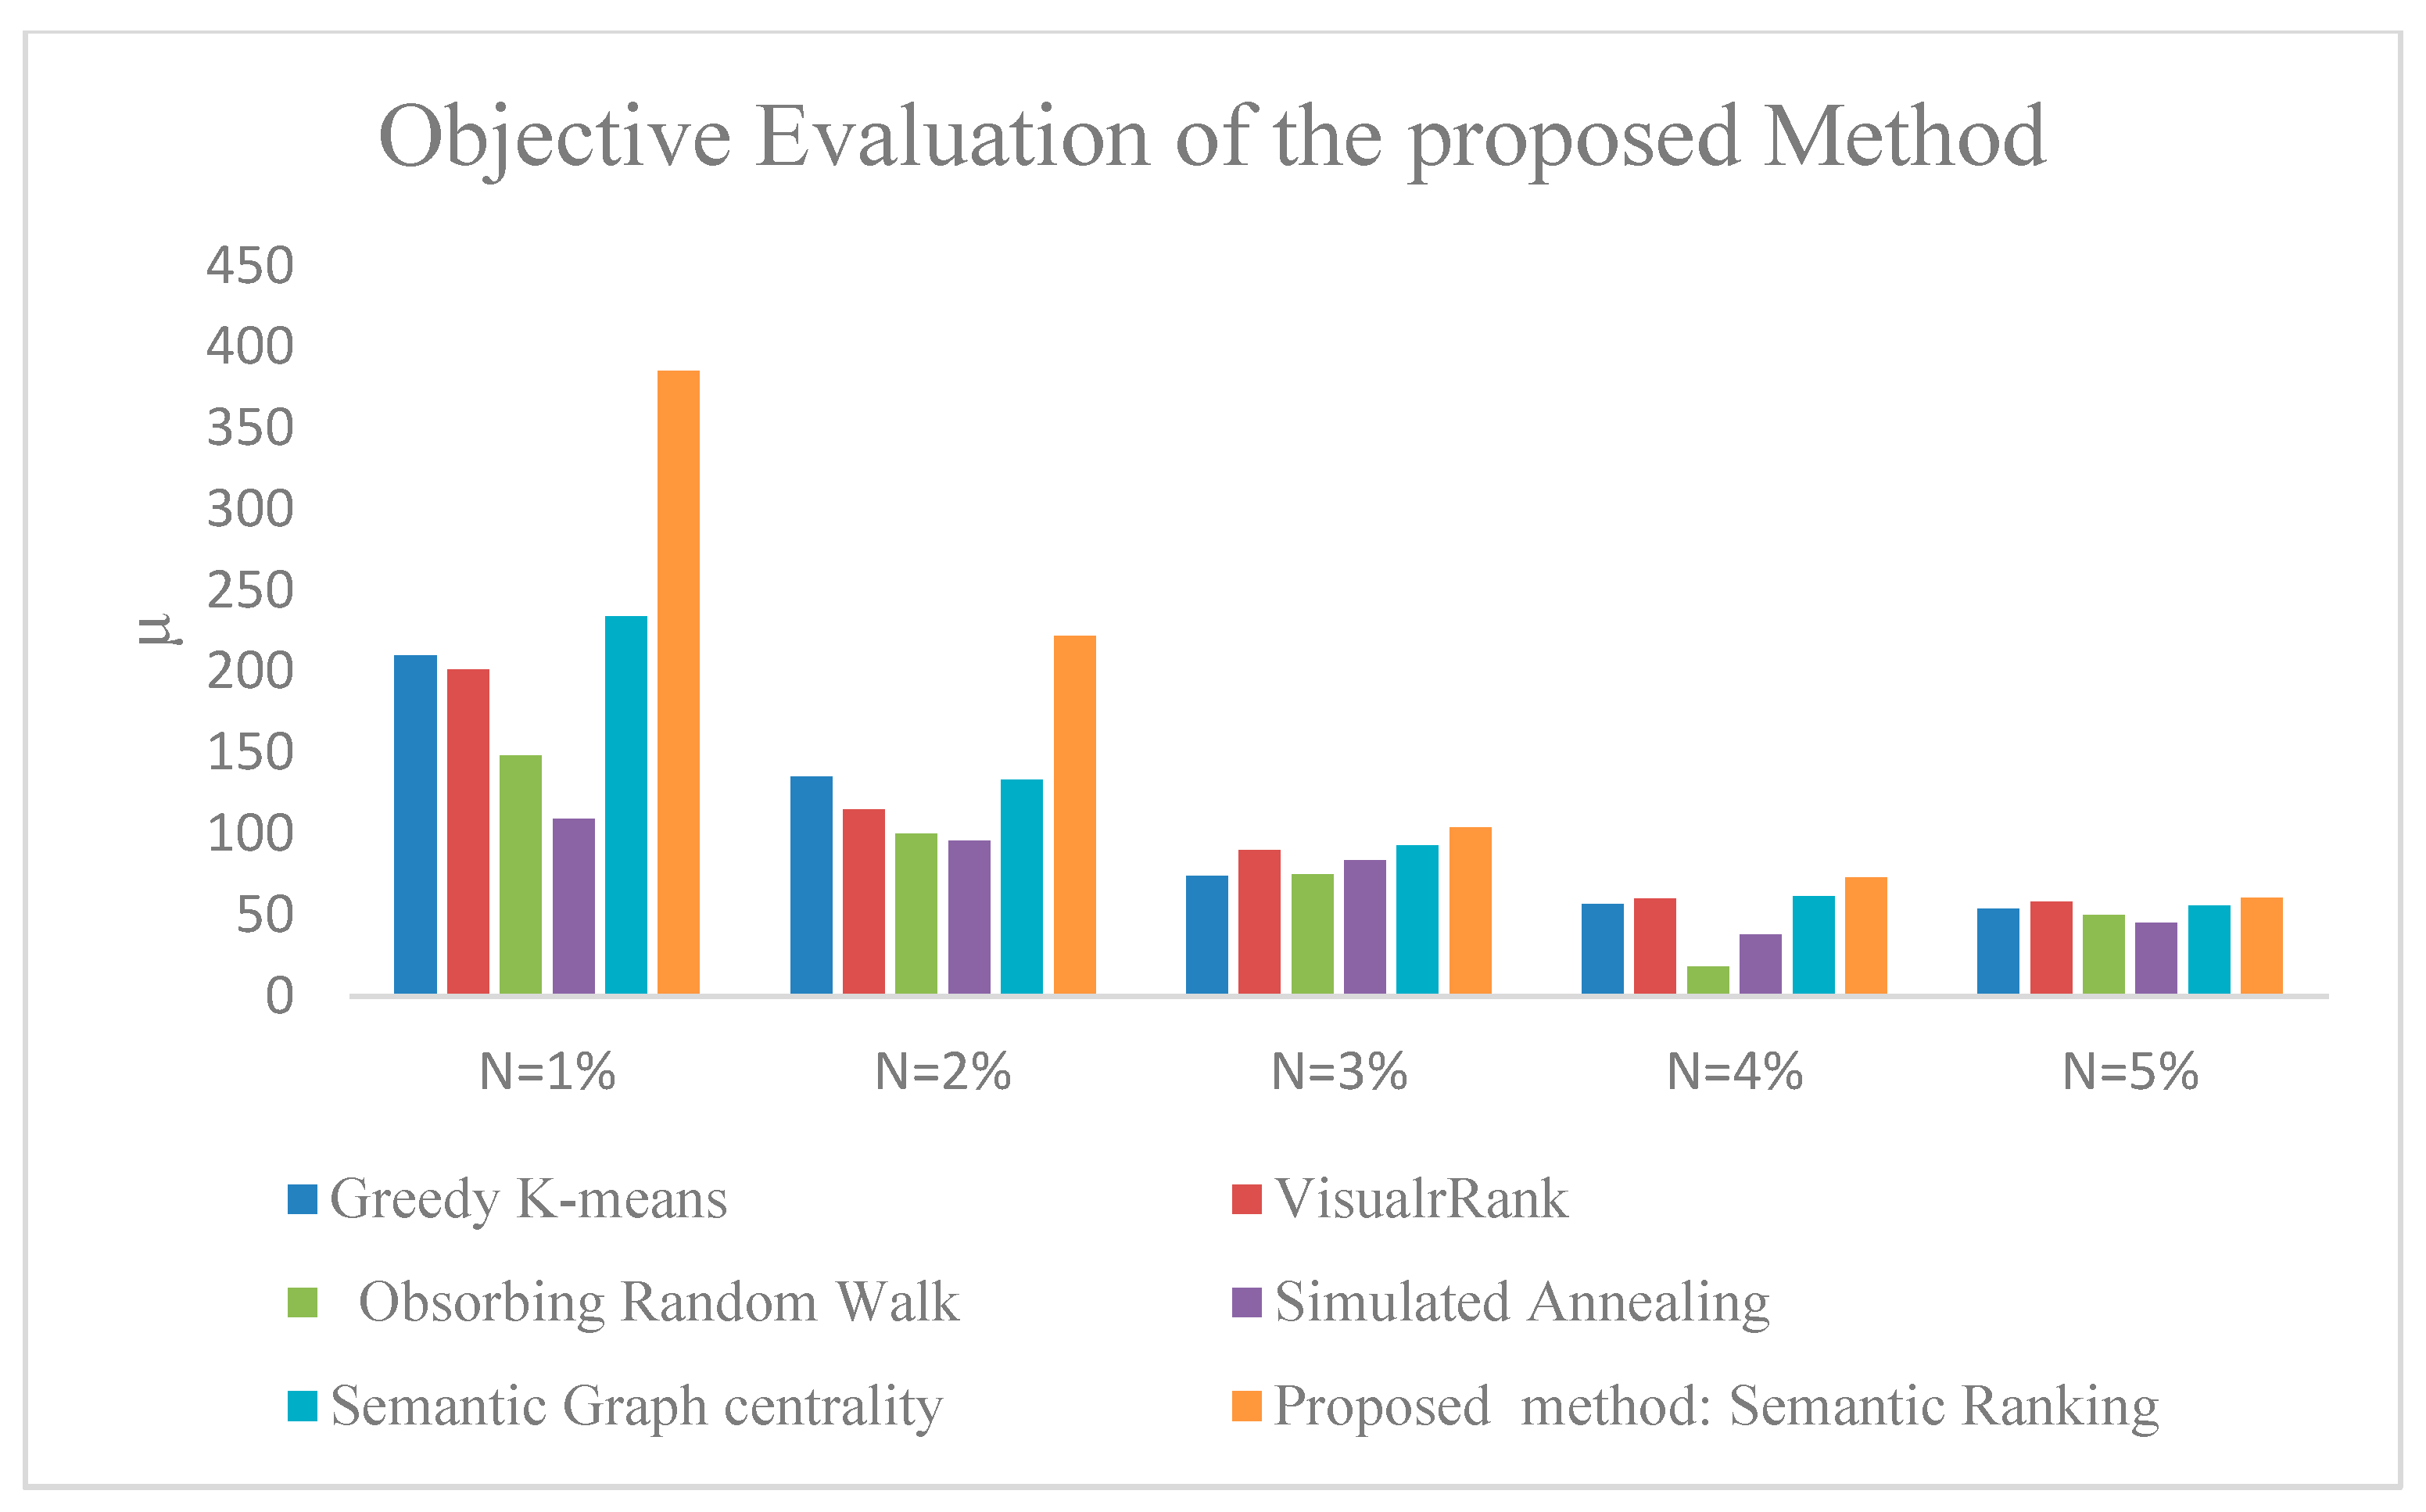
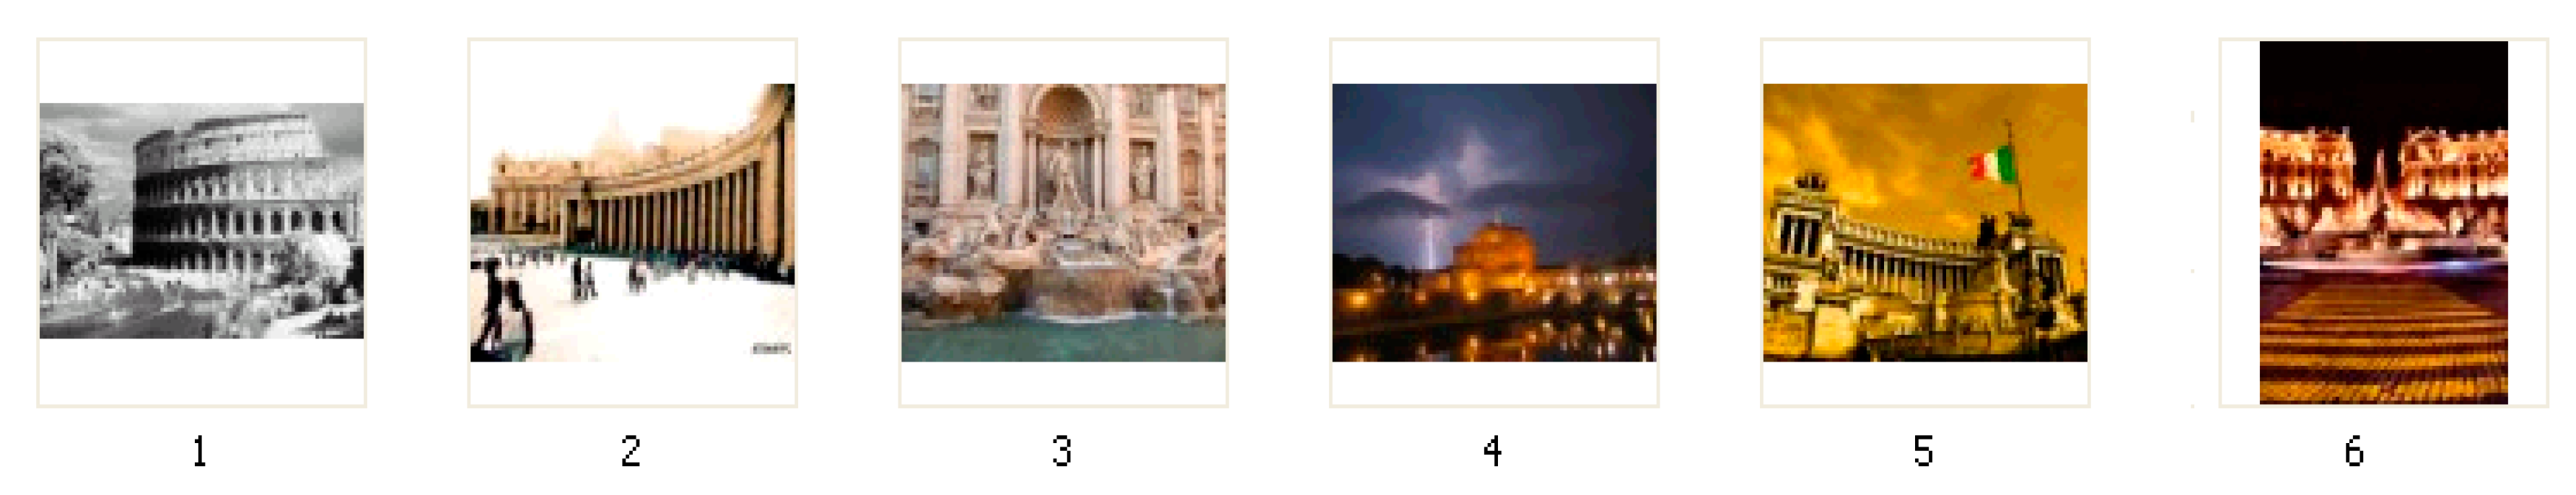
  • The goodness of the summary created by the proposed method
  • The effect of the hierarchical classifier on the result of the summarization approach
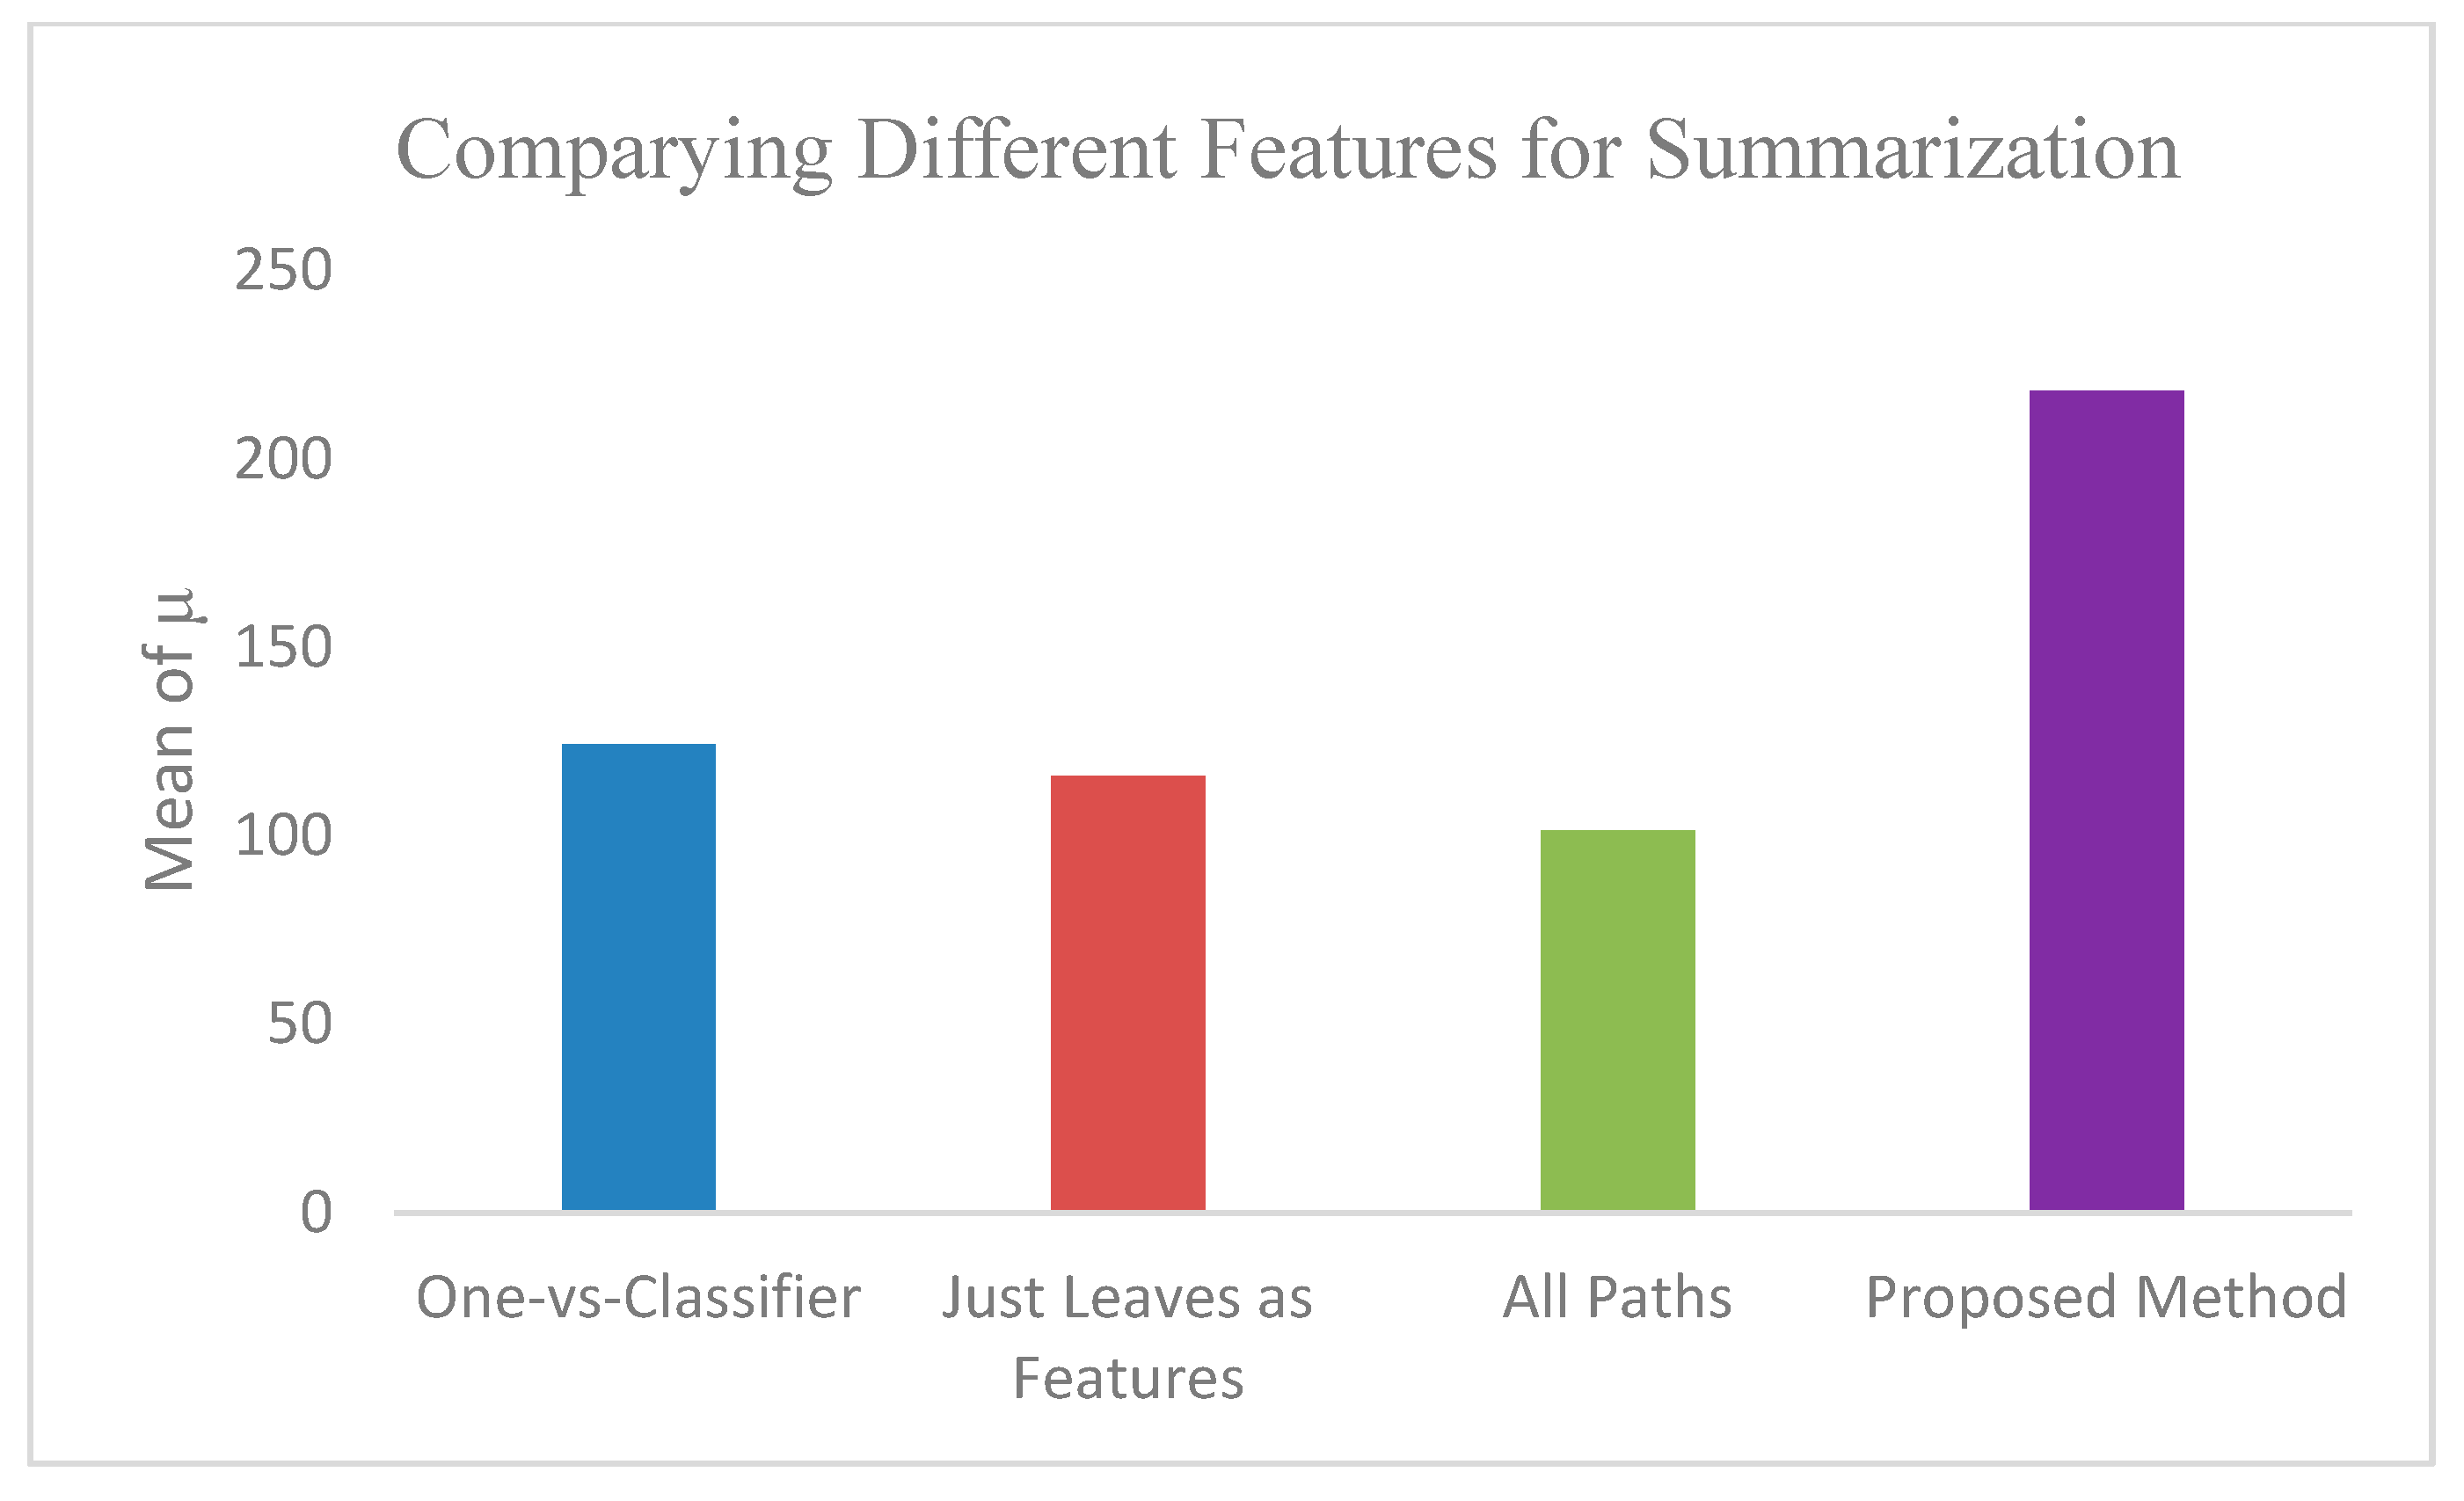
  • The effect of ontology features on the result of the summarization method
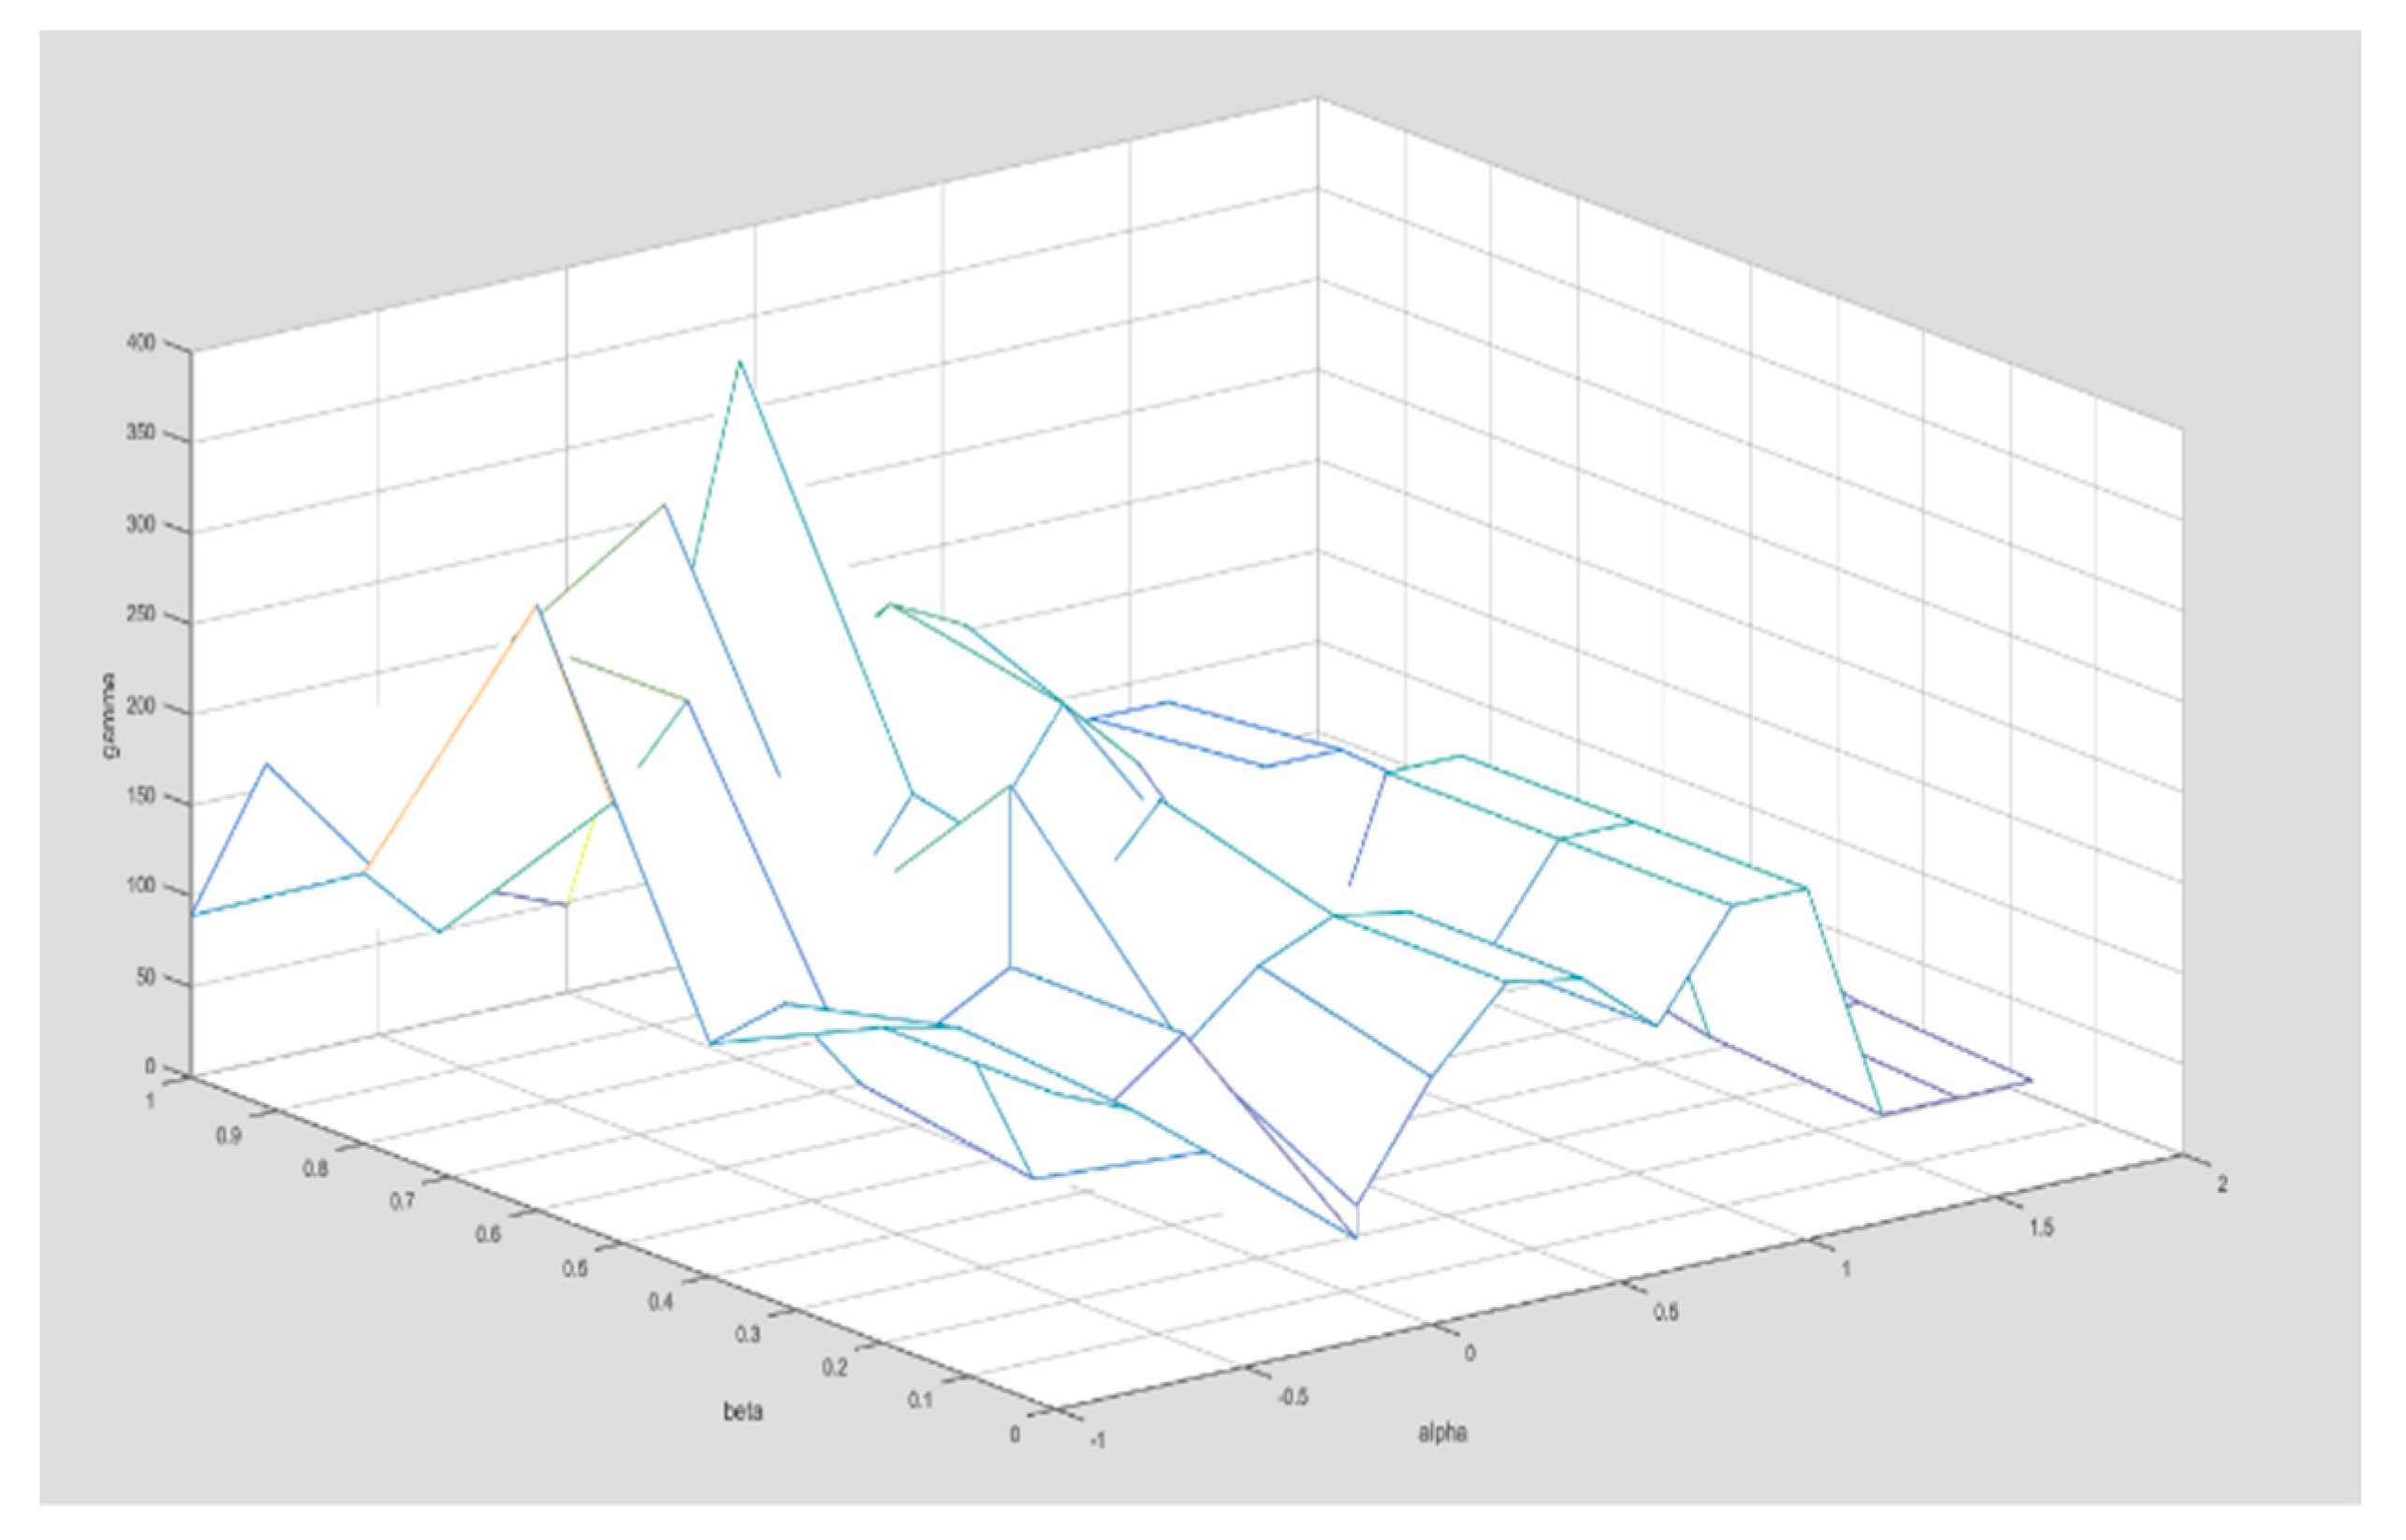
  • The effect of alpha and beta parameters on the result of the proposed summarization method
  • Computational complexity of the proposed method
  • Limitation

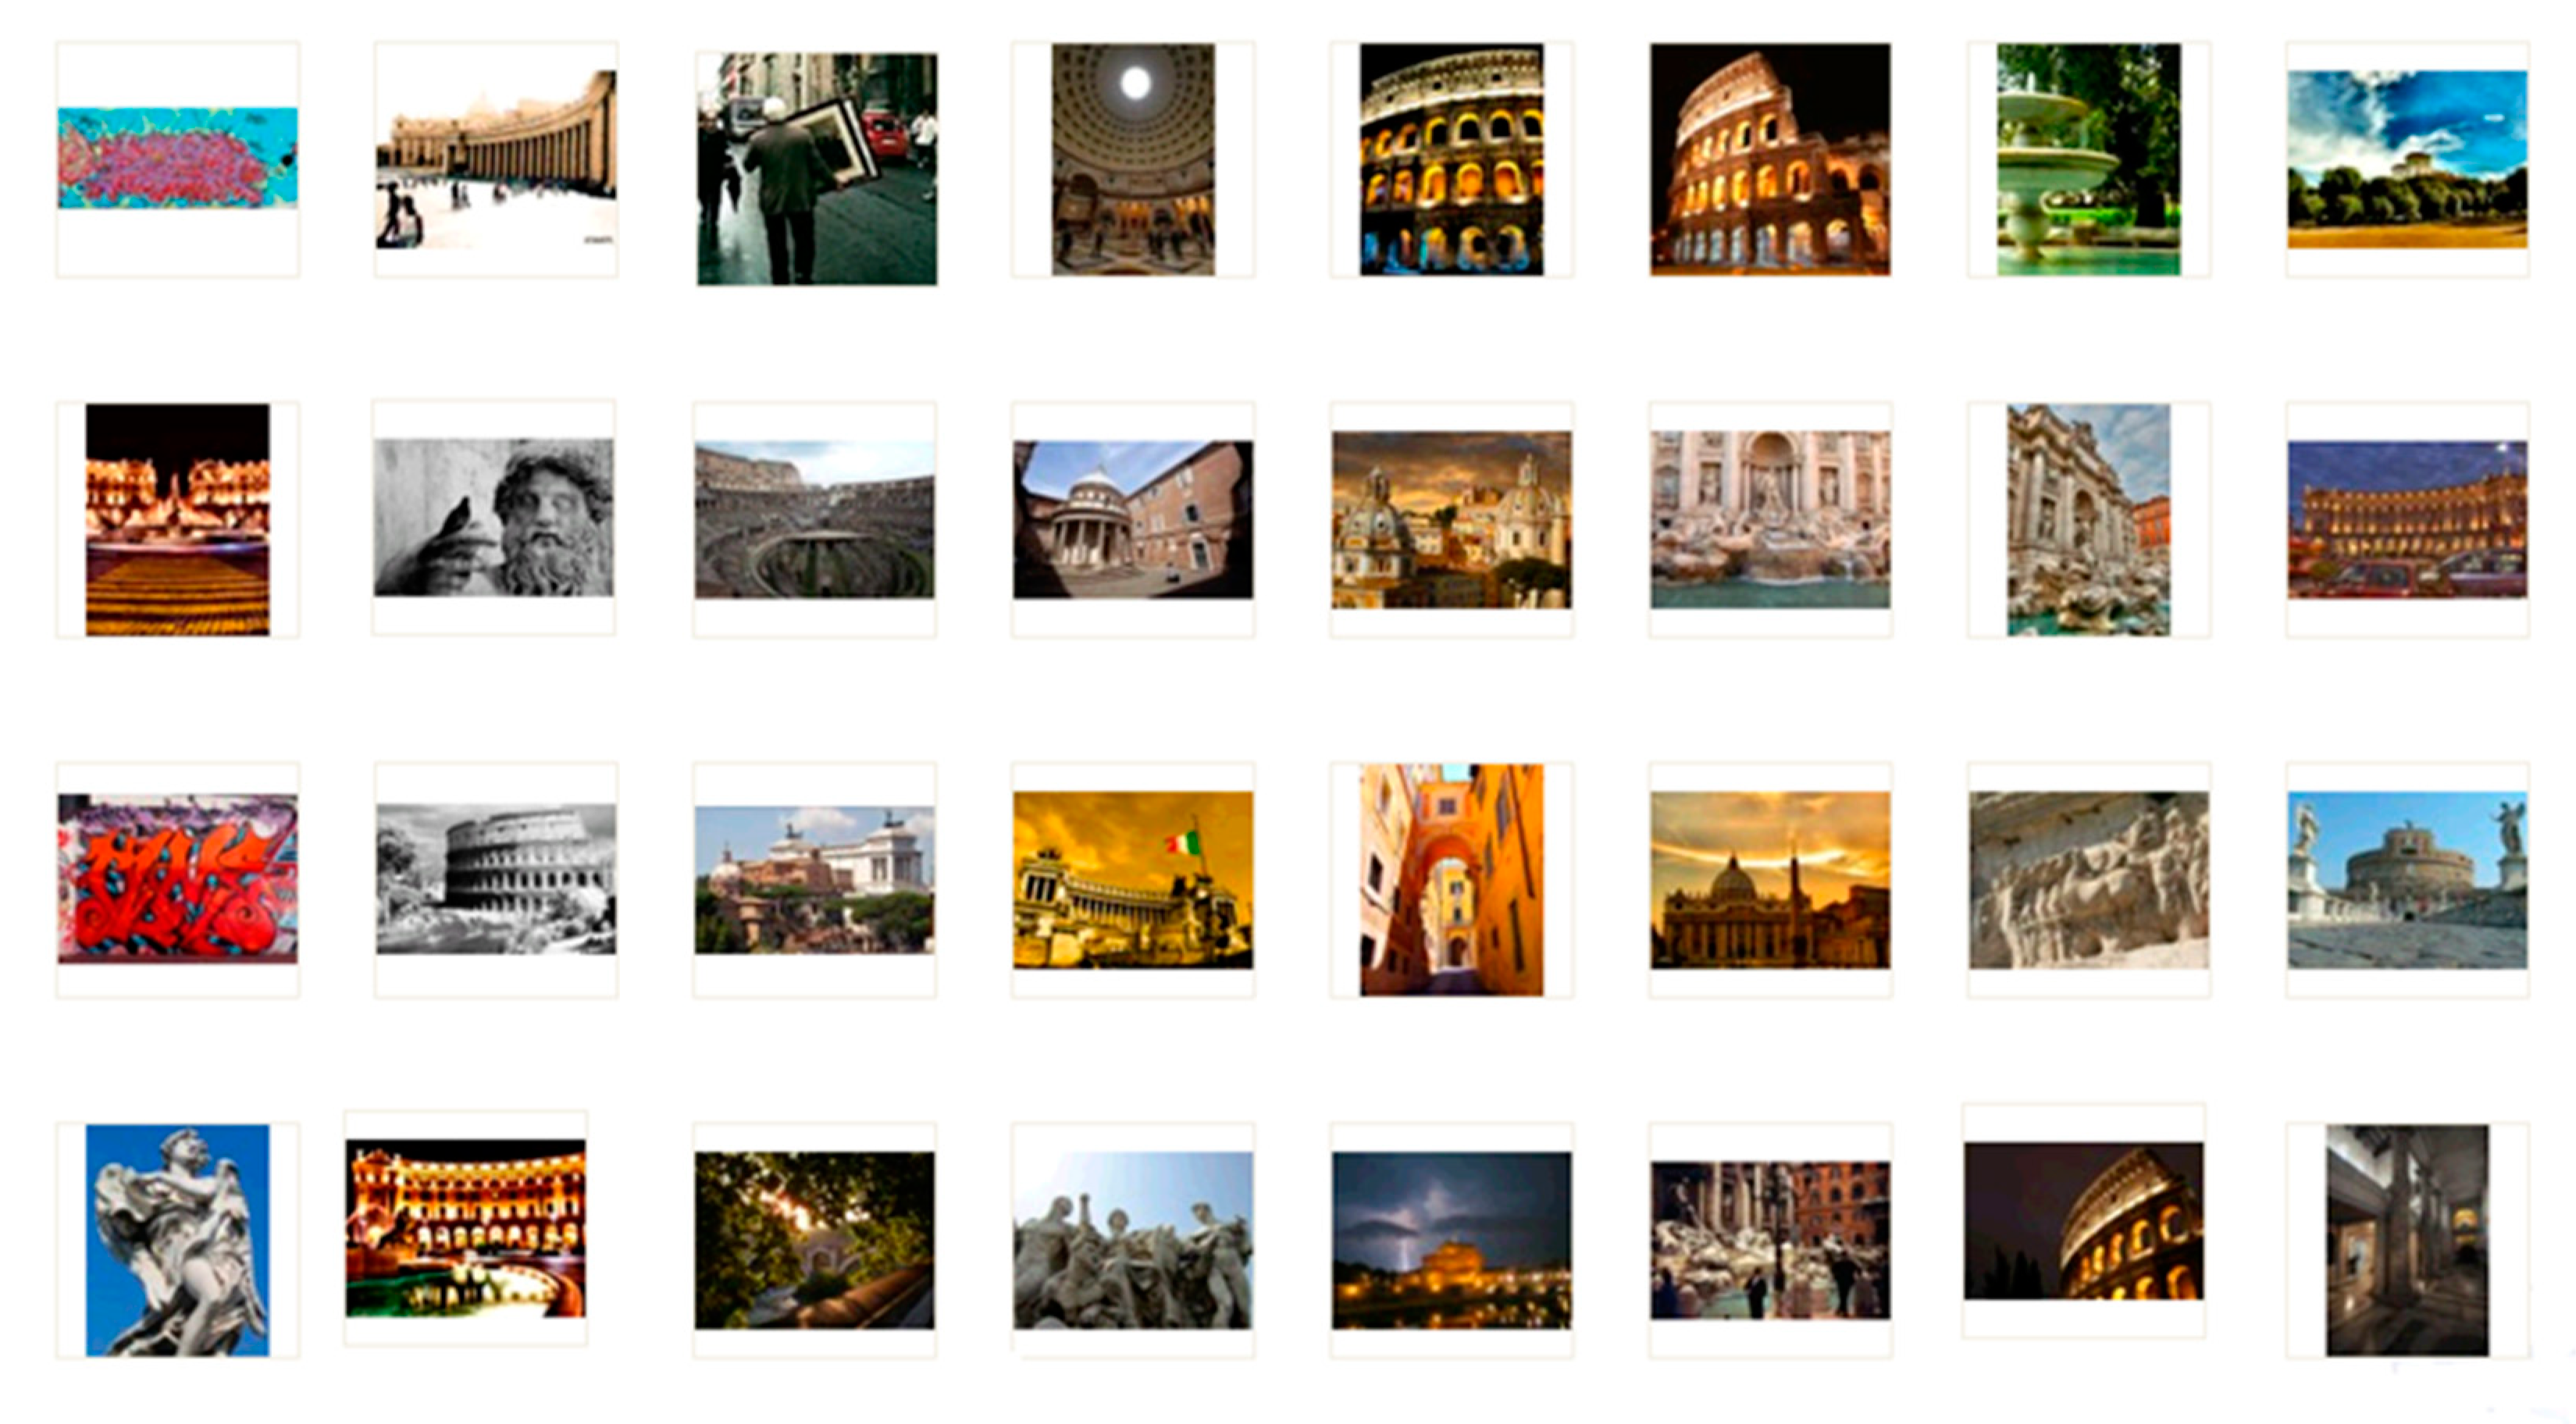
4.1. Datasets and Implementation Details

Most of the researches working on the thousands of images test their techniques on the Flickr Images subset [12,14,21,30,50,51,52,53]; earlier work used google search results as their input images [19,20]. A bunch of researches uses location and cities as their whole or part of the test domain [13,14,21,30,54]. In this paper, we needed the domain ontology of images, so we decided to test our approach for the cities and location images. The dataset contained 40,000 images from Flickr corresponding to 40 different cities. The dataset has been provided in [5]. DBpeida knowledge base was used for providing the domain ontology. DBpeida is a platform, which is designed for structured content extraction from Wikipedia and is accessible online [55]. Knowledge about visiting places in cities was extracted, and corresponding ontology nodes in WordNet were retrieved. Parts of WordNet hierarchy corresponding to the selected synsets were extracted. Ontology nodes were selected, and recursively parent nodes were retrieved until reaching to the root. The final ontology was a part of WordNet. Figure 5 shows a part of our sub-graph for building node with 17 leaf concepts.
We associated a set of SVM classifiers to each semantic node, which was responsible for discriminating among the direct sub-concept of the current node. According to the findings observed in [46], we used SVM with a chi-square kernel on the bag of visual word features with 6000 words and in a one-vs-all manner at each semantic node. We believed a comparison among dimensionality reduction methods, such as RBM [56], sparse coding [57], and mixture models [58], could improve the classification performance. We used the ImageNet dataset [59] for the training of the hierarchical classifier. Hierarchical image classification was done next, and the best nodes representing images were selected. Ontology features were extracted for the images and the whole collection. Finally, summary images were extracted according to the proposed model.
It is worth noting that images were represented differently at different stages in the introduced approach. During classification, images were presented by a bag of visual words, which were then fed into the hierarchical classifier. The results of the hierarchical classifier were utilized in computing ontology features. During the summarization stage, images were presented by a bag of ontology features. The value for each ontology feature was computed from Equation (3).

4.2. Comparative Methods

The proposed method was compared with the following algorithms, which are considered as the popular ones in visual image collection summarization.
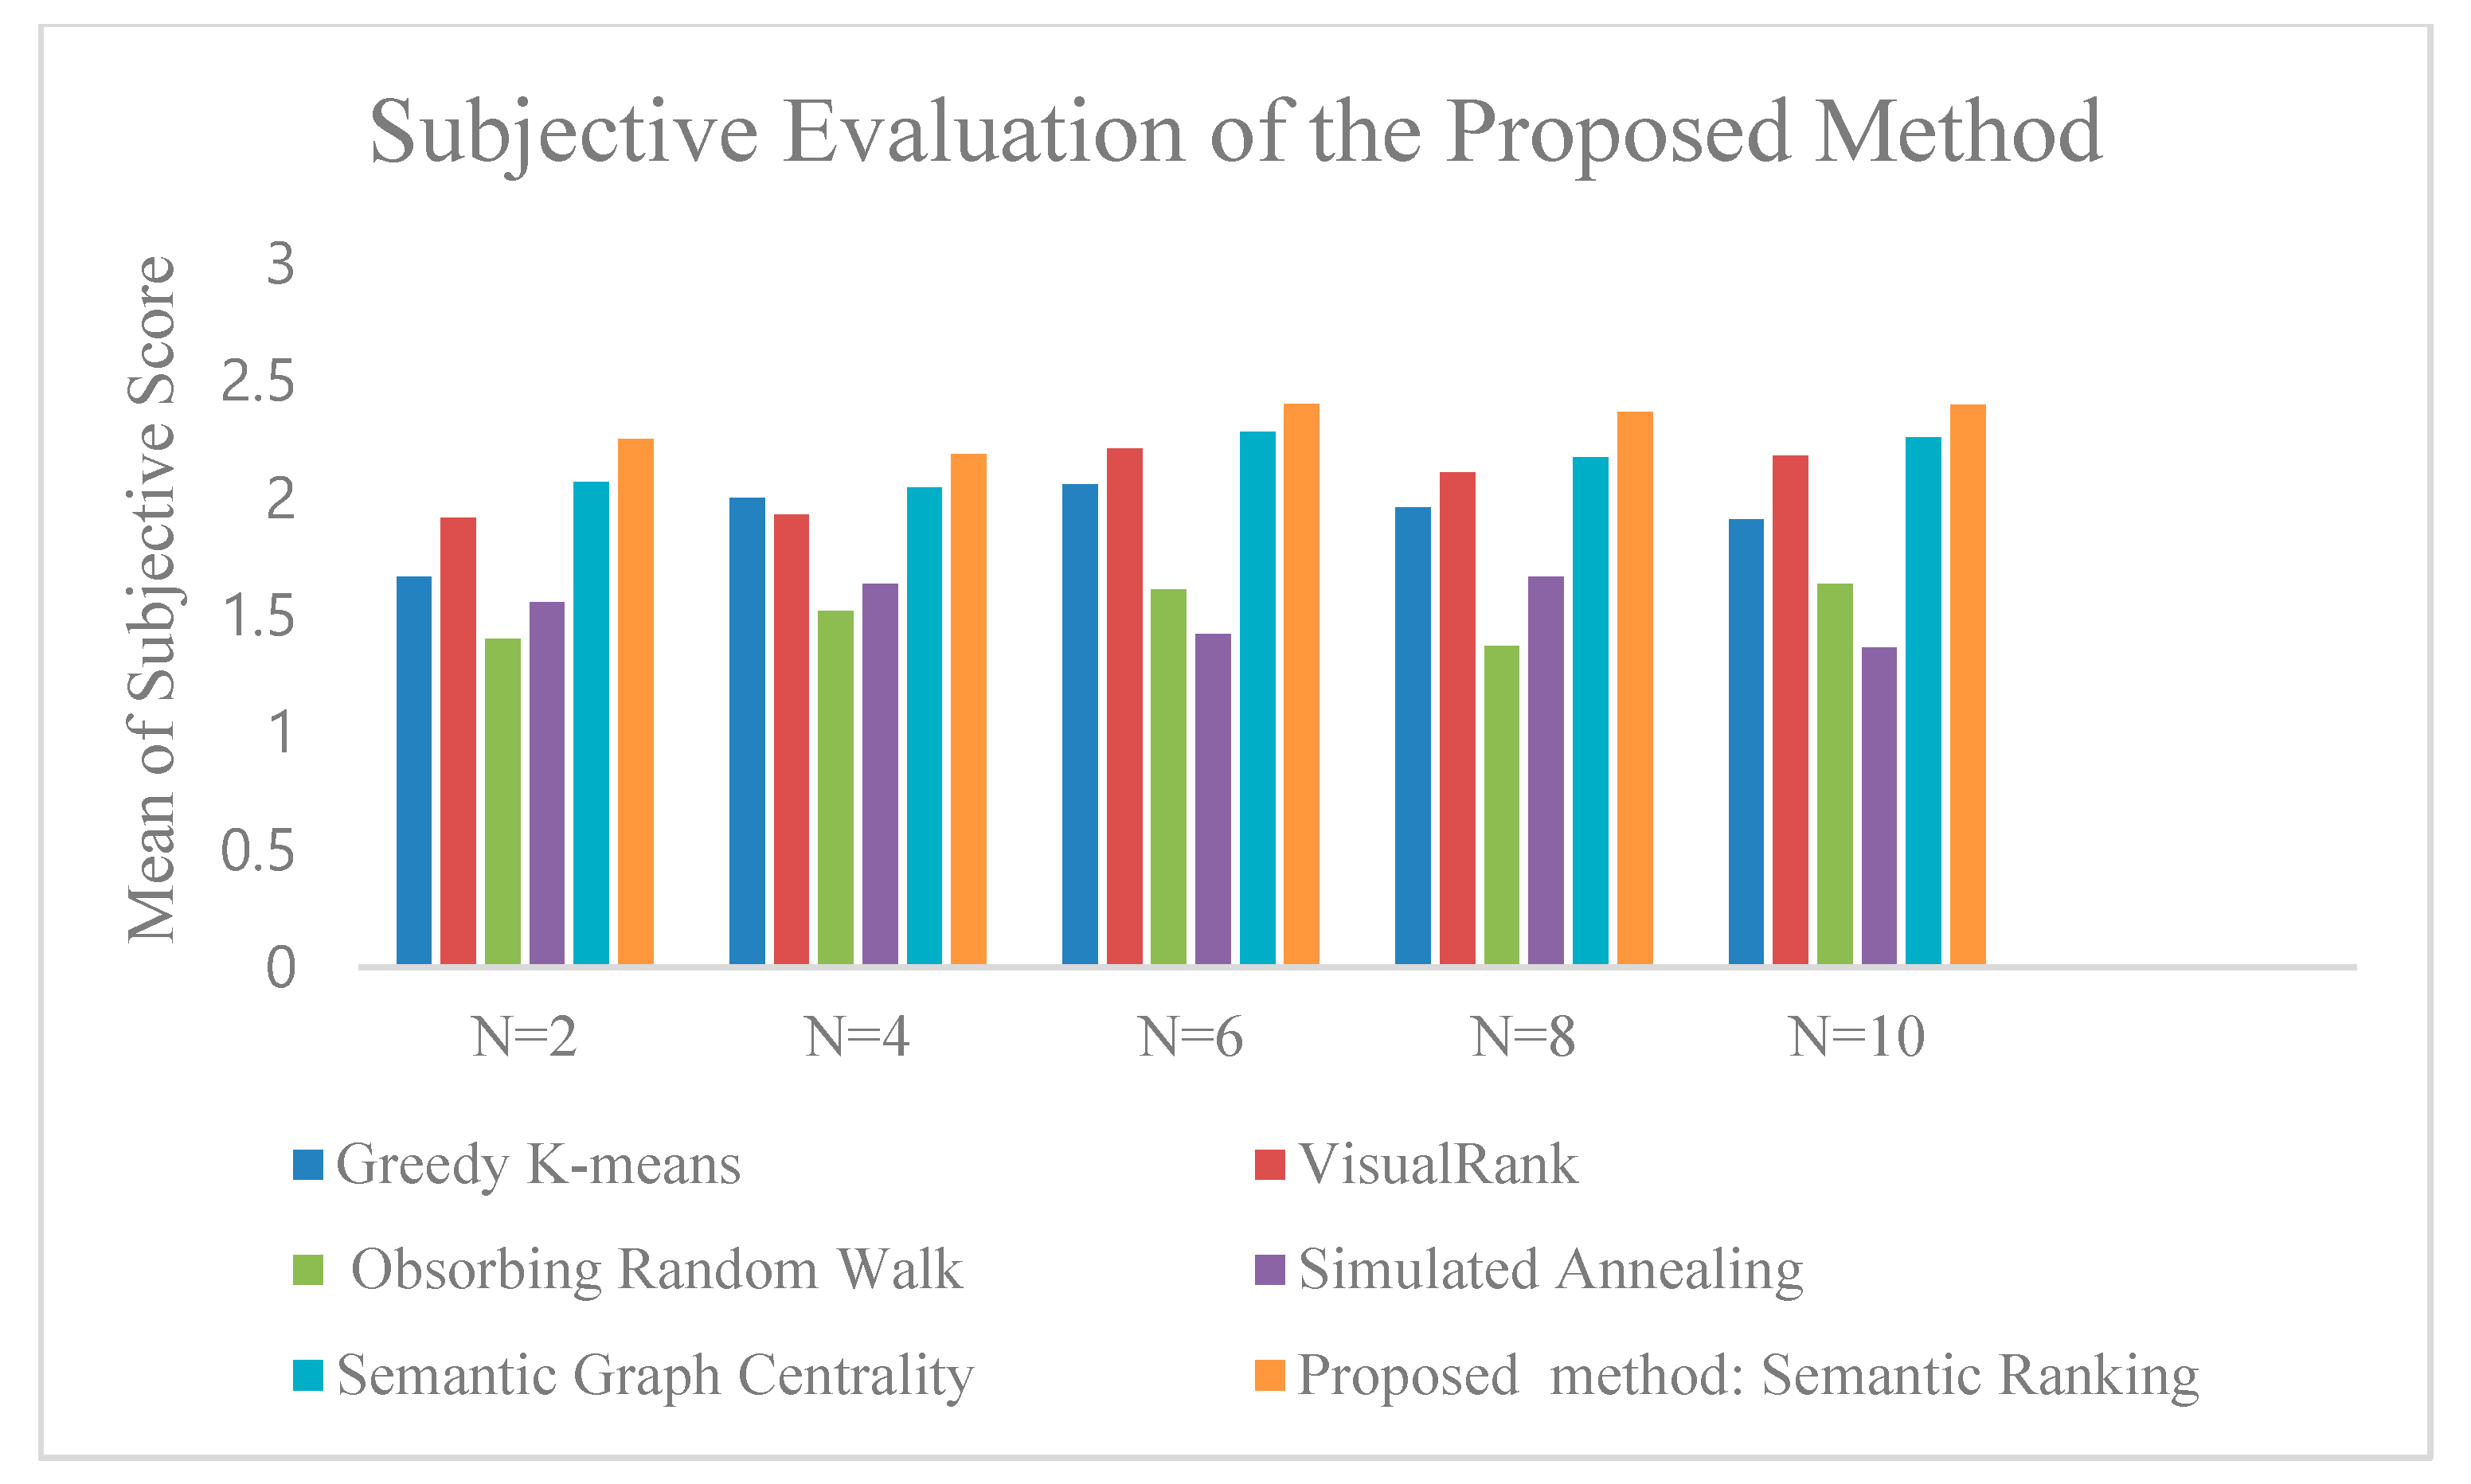
  • Greedy-K means: This technique is a greedy version of the k-means algorithm that was introduced in [14]. The algorithm was designed to meet an optimization objective function that is defined as the similarity maximization of the summary set to the original image set and the similarity minimization of the summary set to itself.
  • VisualRank: This technique was introduced in [19]. They employed the PageRank algorithm on a graph that represents the images’ similarities, where images are represented as nodes of the graph, and edges correspond to the visual similarity.
  • Absorbing random walk: This method was proposed in [20]. They used the idea of a random walk on a similarity graph and nodes, with the largest stationary probability chosen as representative nodes. They proposed the absorbing random walk with the absorbing states dragging down the stationary probabilities of the nodes close to them, hence encouraging the diversity.
  • Simulated annealing: It is a technique that was introduced in [15]. They treated the image summarization problem the same as dictionary learning for sparse representation problem (the initial image collection is constructed sparsely with a dictionary of summary images). They proposed an objective function similar to greedy-k means [14] and applied a simulated annealing approach for the optimization process.
  • Semantic graph centrality: This method was proposed in [5]. They used a domain ontology to establish a graph for similarity based on image semantic similarities. Graph centrality is applied to the similarity graph to find summary images.

4.3. Image Summarization Evaluation

The proposed image summarization method was evaluated by both subjective and objective measures. Usually, subjective assessment is done in image summarization methods [14,19,30,60]. For the subjective evaluation, a small set of 240 images corresponding to six cities {,’saint-Petersburg’, ‘Paris’, ’London’, ’Barcelona’, ‘Rome’, ’Hong Kong’} were selected. The original set and the summary set showed eight graduate students, and they were requested to assign summarization scores according to Table 3. Figure 6 compares the outcomes where the vertical axis presents the average subjective score among users versus different summary size. The summary size was changed from 1% to 5% of the original image collection. Error bars were assigned with a 95 percent confidence interval calculated according to the standard error of the sample average. The outcomes showed that the approach was successful in selecting a summary of images.
As described, most existing methods in image summarization have done subjective evaluation. Sebastian and colleagues [35] proposed VROUGE inspired by ROUGE for evaluating their image collection summarization method, which was the comparison between two human-made and computer-made summaries. Providing human-made references is applicable in the texts and videos area and in small scale datasets (like 100 images related to 14 categories in [35]), but it is not practical in the presence of thousands of images. Samani and Moghaddam in [5] used the following objective metrics for evaluating image collection summaries: coverage, which provides the similarity between the summary set to the original set; redundancy, which is the similarity of the summary set to itself.
The chosen summary images aimed to be like the original image collection and not like each other, which meant that high coverage and low redundancy were desired. In this study, we utilized the μ ratio, which is the coverage divided by the redundancy. The higher values of μ ratio showed better performance of the summarization method.
μ = C o v e r a g e R e d u n d a n c y
It is not practical to measure coverage and redundancy manually. We measured coverage and redundancy by counting the number of Scale-Invariant Feature Transform (SIFT) [61] matches between the two images. Figure 7 shows a comparison based on the proposed objective metric for various summary sizes. In this figure, the summary size varied from 1% to 5% of the original image collection. Figure 8 shows the mean of the introduced objective metric for all sizes of summaries below 10% of the original image collection. As observed, the introduced technique, which was based on semantic hierarchies, performed better in numerical metrics optimization too.
As it was discussed in the previous section, parameters α   a n d   β were chosen experimentally. The classifier should find the best nodes in the hierarchy that an image could be classified to. The best node was chosen based on the α parameter. The very high value of α made the algorithm choosing few paths (low branching behavior and unbalanced tree), and very low value of it resulted in selecting multiple paths. There existed a trade-off point. The parameter β also made a trade-off between similarity to the original set and dissimilarity to the chosen set (relevancy and diversity). Low values of β gave more chance to dissimilarity to the summary set, and high values of β gave more chance to the similarity to the original set. Figure 9 shows the values of μ according to different values of α   a n d   β . The size of the summary was below 1% of the total number of images. As seen, lower values of alpha caused the classifier to choose more paths, so the feature space was not accurate, and higher values of alpha caused the classifier to choose few paths, which lessened the diversity of space. There existed a trade-off point for alpha = 0, where the proposed metrics reached its maximum. Beta parameter had a trade-off point too. Higher values of beta gave more chance to the similarity to the original collection, and lower values of it gave more chance to the dissimilarity to the selected set. Beta = 0.8 was a trade-off point.
As it could be seen, as alpha reached closer to its optimum point, the effect of beta got higher. It means that the proposed feature space was successful in capturing different aspects of the image collections. Figure 10 shows a projection of alpha and beta values. As seen, μ met its maximum value at alpha = 0 and beta = 0.8.
Figure 11 illustrates a set of original images for Rome, which was given as input to our image summarization method, and Figure 12 shows the result of summarization. As seen, the original set contained redundant and irrelevant images, and the summarization system found representative images. After evaluating the proposed method for image collection summarization, we evaluated the classifier module and ontology features separately in the following sub-section.

4.4. Hierarchical Classification and Ontology Feature Evaluation

We now turned to investigate the effect of the classifier module and the ontology features on the introduced technique goodness. To do so, we designed three experiments. In the first experiment, we swapped our classifier with a flat classifier. So instead of using a hierarchical classifier, we used a one-vs-all approach for doing the classification. In the second experiment, we used a hierarchical classifier, but instead of using all ontology nodes as features, we used just leaf nodes as features. On the other hand, the ontological structure was not used in the summarization and just in classification. In the third experiment, we used all the paths of the ontology for doing the classification and used all the nodes of the ontology as ontology features. It means that we ignored the condition of Equation (1) (α parameter) in the classification step. Figure 13 and Figure 14 show the comparison. As seen, the result of the summarization method got better when the hierarchical classifier was used instead of a flat classifier. Furthermore, it gave the best result when the ontology nodes, based on Equation (1), were used as features. This indicated that hierarchical semantic relations could improve the result of image summarization and classification methods. This could be further enhanced by using a sophisticated form of knowledge like fuzzy ontologies [62] or context-aware reasoning [63].

4.5. Computational Complexity

The proposed approach consisted of offline and online phases. The offline phase contained ontology extraction and mapping and training the hierarchical classifier. The online phase consisted of a classification test and summarization. Ontology extractor and ontology mapper time complexities were dependent on the number of concepts in the domain and mapped ontology. The computational complexity of classifier training was dominated by feature extraction and classification algorithm.
The online phase consisted of a classification test and summarization. The classification contained the O ( n ( C + l o g C ) ) computational complexity, where C is the total number of classes in the ontology space, and n is the number of images. This considered the time the hierarchical classifier moved from the root to the leaves and the statistical analysis that it needed to take at every node.
The computational complexity of the summarizer was determined by ontology feature extraction and similarity maximization, which finally ended in O ( n ( C + S ) ) computational complexity, where n is the number of images, S is the number of summary images, and C is the total number of concepts in the ontology.

4.6. Limitation

The proposed approach needs the domain ontology as an input to the system, which provides a formal description of domain knowledge as a set of concepts with the relationships among them. While ontologies provide a rich source of knowledge for the modeling domain, their availability comes with some limitations. However, recent advances in semantic web and linked data are creating a robust infrastructure where more applications can take advantage of ontology and related knowledge-based technologies made available on the Web.

5. Conclusions

In this study, we proposed an image collection summarization method based on semantic hierarchies. The summarization method was based on categorizing images to the nodes of a domain ontology and incorporated semantic hierarchical relations jointly in classification and summarization step. We experimentally showed that the introduced method obtained an improvement in making summary images that are both semantic and visual representatives and performed competitively with respect to the method that considers semantic relationship in classification or summarization separately. This work provided some guidelines for future research. Ontology features could be combined with other features, such as quality or aesthetic features of images. Moreover, the joint hierarchical approach in classification and summarization could be applied in multi-modal document summarization too. Furthermore, we expect to see better performance by using an advanced form of background knowledge like fuzzy ontologies.

Author Contributions

Z.R.S.: conceptualization, methodology, formal analysis, visualization, validation, manuscript writing; M.E.M.: conceptualization, writing—review and editing. All authors have read and agreed to the published version of the manuscript.

Funding

This research received no external funding.

Conflicts of Interest

The authors declare no conflict of interest.

References

  1. Samani, Z.R.; Guntuku, S.C.; Moghaddam, M.E.; Preoţiuc-Pietro, D.; Ungar, L.H. Cross-platform and cross-interaction study of user personality based on images on Twitter and Flickr. PLoS ONE 2018, 13, e0198660. [Google Scholar] [CrossRef] [PubMed] [Green Version]
  2. Singh, A.; Virmani, L.; Subramanyam, A. Image Corpus Representative Summarization. In Proceedings of the 2019 IEEE Fifth International Conference on Multimedia Big Data (BigMM), Singapore, 11–13 September 2019; pp. 21–29. [Google Scholar]
  3. Ozkose, Y.E.; Celikkale, B.; Erdem, E.; Erdem, A. Diverse Neural Photo Album Summarization. In Proceedings of the 2019 Ninth International Conference on Image Processing Theory, Tools and Applications (IPTA), Istanbul, Turkey, 6–9 November 2019; pp. 1–6. [Google Scholar]
  4. Chen, J.; Zhuge, H. Extractive summarization of documents with images based on multi-modal RNN. Futur. Gener. Comput. Syst. 2019, 99, 186–196. [Google Scholar] [CrossRef]
  5. Samani, Z.R.; Moghaddam, M.E. A knowledge-based semantic approach for image collection summarization. Multimed. Tools Appl. 2017, 76, 11917–11939. [Google Scholar] [CrossRef]
  6. Fergus, R.; Bernal, H.; Weiss, Y.; Torralba, A. Semantic label sharing for learning with many categories. In Computer Vision–ECCV 2010; Springer: Berlin/Heidelberg, Germany, 2010; pp. 762–775. [Google Scholar]
  7. Kramer, G.; Bouma, G.; Hendriksen, D.; Homminga, M. Classifying image galleries into a taxonomy using metadata and wikipedia. In Natural Language Processing and Information Systems; Springer: Berlin/Heidelberg, Germany, 2012; pp. 191–196. [Google Scholar]
  8. Seo, Y.; Shin, K.-S. Hierarchical convolutional neural networks for fashion image classification. Expert Syst. Appl. 2019, 116, 328–339. [Google Scholar] [CrossRef]
  9. Li, H.; Wang, T.; Zhang, M.; Zhu, A.; Shan, G.; Snoussi, H. Hierarchical Attention Networks for Image Classification of Remote Sensing Images Based on Visual Q&A Methods. In Proceedings of the 2019 Chinese Automation Congress (CAC), Hangzhou, China, 23 November 2019; pp. 4712–4717. [Google Scholar]
  10. Samani, Z.R.; Moghaddam, M.E. A multi-criteria context-sensitive approach for social image collection summarization. Sādhanā 2018, 43, 143. [Google Scholar] [CrossRef] [Green Version]
  11. Pan, X.; Tang, F.; Dong, W.; Ma, C.; Meng, Y.; Huang, F.; Lee, T.-Y.; Xu, C. Content-Based Visual Summarization for Image Collections. IEEE Trans. Vis. Comput. Graph. 2019. [Google Scholar] [CrossRef]
  12. Raguram, R.; Lazebnik, S. Computing iconic summaries of general visual concepts. In Proceedings of the Computer Vision and Pattern Recognition Workshops, CVPRW’08, Anchorage, AK, USA, 23–28 June 2008; pp. 1–8. [Google Scholar]
  13. Rudinac, S.; Larson, M.; Hanjalic, A. Learning crowdsourced user preferences for visual summarization of image collections. IEEE Trans. Multimed. 2013, 15, 1231–1243. [Google Scholar] [CrossRef] [Green Version]
  14. Simon, I.; Snavely, N.; Seitz, S.M. Scene summarization for online image collections. In Proceedings of the IEEE 11th International Conference on Computer Vision (ICCV 2007), Rio de Janeiro, Brazil, 14–21 October 2007; pp. 1–8. [Google Scholar]
  15. Yang, C.; Shen, J.; Peng, J.; Fan, J. Image collection summarization via dictionary learning for sparse representation. Pattern Recognit. 2013, 46, 948–961. [Google Scholar] [CrossRef]
  16. Ko, E.; Kim, E.Y.; Yu, Y. Summarizing Social Image Search Results using Human Affects. In Proceedings of the 22nd International Conference on Intelligent User Interfaces Companion, Limassol, Cyprus, 13–16 March 2017; pp. 101–104. [Google Scholar]
  17. Zhao, Y.; Hong, R.; Jiang, J. Visual summarization of image collections by fast RANSAC. Neurocomputing 2016, 172, 48–52. [Google Scholar] [CrossRef]
  18. Alguliyev, R.M.; Aliguliyev, R.M.; Isazade, N.R.; Abdi, A.; Idris, N. COSUM: Text summarization based on clustering and optimization. Expert Syst. 2018, 36, e12340. [Google Scholar] [CrossRef] [Green Version]
  19. Jing, Y.; Baluja, S. Visualrank: Applying pagerank to large-scale image search. Pattern Anal. Mach. Intell. IEEE Trans. 2008, 30, 1877–1890. [Google Scholar] [CrossRef] [PubMed]
  20. Wang, J.; Jia, L.; Hua, X.-S. Interactive browsing via diversified visual summarization for image search results. Multimed. Syst. 2011, 17, 379–391. [Google Scholar] [CrossRef]
  21. Yang, L.; Adviser-Johnstone, J.K. Mining Canonical Views from Internet Image Collections; University of Alabama at Birmingham: Birmingham, AL, USA, 2011. [Google Scholar]
  22. Zhang, H.; Gong, Y.; Yan, Y.; Duan, N.; Xu, J.; Wang, J.; Gong, M.; Zhou, M. Pretraining-based natural language generation for text summarization. arXiv 2019, arXiv:1902.09243. [Google Scholar]
  23. Rekabdar, B.; Mousas, C.; Gupta, B. Generative adversarial network with policy gradient for text summarization. In Proceedings of the 2019 IEEE 13th International Conference on Semantic Computing (ICSC), Newport Beach, CA, USA, 30 January–1 February 2019; pp. 204–207. [Google Scholar]
  24. Zhao, B.; Li, X.; Lu, X. TTH-RNN: Tensor-Train hierarchical recurrent neural network for video summarization. IEEE Trans. Ind. Electron. 2020. [Google Scholar] [CrossRef]
  25. Goularte, F.B.; Nassar, S.M.; Fileto, R.; Saggion, H. A text summarization method based on fuzzy rules and applicable to automated assessment. Expert Syst. Appl. 2019, 115, 264–275. [Google Scholar] [CrossRef]
  26. Song, S.; Huang, H.; Ruan, T. Abstractive text summarization using LSTM-CNN based deep learning. Multimed. Tools Appl. 2019, 78, 857–875. [Google Scholar] [CrossRef]
  27. Singh, A.; Sharma, D.K. Image Collection Summarization: Past, Present and Future. In Data Visualization and Knowledge Engineering; Springer: Berlin/Heidelberg, Germany, 2020; pp. 49–78. [Google Scholar]
  28. Jaffe, A.; Naaman, M.; Tassa, T.; Davis, M. Generating summaries and visualization for large collections of geo-referenced photographs. In Proceedings of the 8th ACM International Workshop on Multimedia Information Retrieval, Santa Barbara, CA, USA, 26–27 October 2006; Association for Computing Machinery: New York, NY, USA, 2006; pp. 89–98. [Google Scholar]
  29. Qian, X.; Lu, D.; Wang, Y.; Zhu, L.; Tang, Y.Y.; Wang, M. Image re-ranking based on topic diversity. IEEE Trans. Image Process. 2017, 26, 3734–3747. [Google Scholar] [CrossRef]
  30. Pang, Y.; Hao, Q.; Yuan, Y.; Hu, T.; Cai, R.; Zhang, L. Summarizing tourist destinations by mining user-generated travelogues and photos. Comput. Vis. Image Underst. 2011, 115, 352–363. [Google Scholar] [CrossRef]
  31. Camargo, J.E.; González, F.A. Multimodal latent topic analysis for image collection summarization. Inf. Sci. 2016, 328, 270–287. [Google Scholar] [CrossRef]
  32. Zhang, W.; Fu, K.; Sun, X.; Zhang, Y.; Sun, H.; Wang, H. Joint optimisation convex-negative matrix factorisation for multi-modal image collection summarisation based on images and tags. IET Comput. Vis. 2018, 13, 125–130. [Google Scholar] [CrossRef]
  33. Jeong, J.-W.; Hong, H.-K.; Heu, J.-U.; Qasim, I.; Lee, D.-H. Visual Summarization of the Social Image Collection Using Image Attractiveness Learned from Social Behaviors. In Proceedings of the 2012 IEEE International Conference on Multimedia and Expo, Melbourne, Australia, 9–13 July 2012; pp. 538–543. [Google Scholar]
  34. Shen, X.; Tian, X. Multi-modal and multi-scale photo collection summarization. Multimed. Tools Appl. 2016, 75, 2527–2541. [Google Scholar] [CrossRef]
  35. Tschiatschek, S.; Iyer, R.K.; Wei, H.; Bilmes, J.A. Learning Mixtures of Submodular Functions for Image Collection Summarization. In Advances in Neural Information Processing Systems 27; NeurIPS: Montreal, QC, Canada, 2014; pp. 1413–1421. [Google Scholar]
  36. Fang, H.; Lu, W.; Wu, F.; Zhang, Y.; Shang, X.; Shao, J.; Zhuang, Y. Topic aspect-oriented summarization via group selection. Neurocomputing 2015, 149, 1613–1619. [Google Scholar] [CrossRef]
  37. Jacobs, A.M.; Kinder, A. Computing the affective-aesthetic potential of literary texts. AI 2020, 1, 11–27. [Google Scholar] [CrossRef] [Green Version]
  38. Hao, W.; Menglin, J.; Guohui, T.; Qing, M.; Guoliang, L. R-KG: A novel method for implementing a robot intelligent service. AI 2020, 1, 117–140. [Google Scholar] [CrossRef] [Green Version]
  39. Ma, M.; Mei, S.; Wan, S.; Hou, J.; Wang, Z.; Feng, D.D. Video summarization via block sparse dictionary selection. Neurocomputing 2020, 378, 197–209. [Google Scholar] [CrossRef]
  40. Hennig, L.; Umbrath, W.; Wetzker, R. An ontology-based approach to text summarization. In Proceedings of the IEEE/WIC/ACM International Conference on Web Intelligence and Intelligent Agent Technology, WI-IAT’08, Sydney, Australia, 9–12 December 2008; pp. 291–294. [Google Scholar]
  41. Samani, Z.; Shamsfard, M. A fuzzy ontology model for qualitative spatial reasoning. In Proceedings of the 2011 6th International Conference on Computer Sciences and Convergence Information Technology (ICCIT), Seogwipo, Korea, 29 November–1 December 2011; pp. 1–6. [Google Scholar]
  42. Samani, Z.R.; Shamsfard, M. On the application of fuzzy ontology for qualitative spatial reasoning. JNIT 2012, 3, 9–18. [Google Scholar]
  43. Nister, D.; Stewenius, H. Scalable recognition with a vocabulary tree. In Proceedings of the 2006 IEEE Computer Society Conference on Computer Vision and Pattern Recognition, New York, NY, USA, 17–22 June 2006; pp. 2161–2168. [Google Scholar]
  44. Zhao, B.; Li, F.; Xing, E.P. Large-scale category structure aware image categorization. In Advances in Neural Information Processing Systems 24; NeurIPS: Granada, Spain, 2011; pp. 1251–1259. [Google Scholar]
  45. Li, L.; Jiang, S.; Huang, Q. Learning hierarchical semantic description via mixed-norm regularization for image understanding. IEEE Trans. Multimed. 2012, 14, 1401–1413. [Google Scholar]
  46. Abdollahpour, Z.; Samani, Z.R.; Moghaddam, M.E. Image classification using ontology based improved visual words. In Proceedings of the 2015 23rd Iranian Conference on Electrical Engineering (ICEE), Tehran, Iran, 10–14 May 2015; pp. 694–698. [Google Scholar]
  47. Verma, N.; Mahajan, D.; Sellamanickam, S.; Nair, V. Learning Hierarchical Similarity Metrics. In Proceedings of the 2012 IEEE Conference on Computer Vision and Pattern Recognition (CVPR), Providence, RI, USA, 16–21 June 2012; pp. 2280–2287. [Google Scholar]
  48. Gao, T.; Koller, D. Discriminative Learning of Relaxed Hierarchy for Large-scale Visual Recognition. In Proceedings of the 2011 IEEE International Conference on Computer Vision (ICCV), Barcelona, Spain, 6–13 November 2011; pp. 2072–2079. [Google Scholar]
  49. Samani, Z.R.; Alappatt, J.A.; Parker, D.; Ismail, A.A.O.; Verma, R. QC-Automator: Deep learning-based automated quality control for diffusion mr images. Front. Neurosci. 2020, 13, 1456. [Google Scholar] [CrossRef] [Green Version]
  50. Kennedy, L.S.; Naaman, M. Generating diverse and representative image search results for landmarks. In Proceedings of the 17th international conference on World Wide Web, Beijing, China, 21–25 April 2008; pp. 297–306. [Google Scholar]
  51. Yang, Y.; Chen, S.-C. Disaster Image Filtering and Summarization Based on Multi-layered Affinity Propagation. In Proceedings of the IEEE International Symposium on Multimedia (ISM), Irvine, CA, USA, 10–12 December 2012; pp. 100–103. [Google Scholar]
  52. Fan, J.; Gao, Y.; Luo, H.; Keim, D.A.; Li, Z. A novel approach to enable semantic and visual image summarization for exploratory image search. In Proceedings of the 1st ACM International Conference on Multimedia Information Retrieval, Vancouver, BC, Canada, 30–31 October 2008; pp. 358–365. [Google Scholar]
  53. Van Leuken, R.H.; Garcia, L.; Olivares, X.; van Zwol, R. Visual diversification of image search results. In Proceedings of the 18th International Conference on World Wide Web, Madrid, Spain, 20–24 April 2009; pp. 341–350. [Google Scholar]
  54. Xu, H.; Wang, J.; Hua, X.-S.; Li, S. Hybrid image summarization. In Proceedings of the 19th ACM International Conference on Multimedia, Scottsdale, AZ, USA, 28 November–1 December 2011; pp. 1217–1220. [Google Scholar]
  55. Lehmann, J.; Isele, R.; Jakob, M.; Jentzsch, A.; Kontokostas, D.; Mendes, P.; Hellmann, S.; Morsey, M.; Van Kleef, P.; Auer, S.; et al. DBpedia–A large-scale, multilingual knowledge base extracted from Wikipedia. Semant. Web 2014, 6, 167–195. [Google Scholar] [CrossRef] [Green Version]
  56. Mousas, C.; Anagnostopoulos, C.-N. Learning motion features for example-based finger motion estimation for virtual characters. 3D Res. 2017, 8, 25. [Google Scholar] [CrossRef]
  57. Lee, J.; Kong, T.; Lee, K. Ensemble patch sparse coding: A feature learning method for classification of images with ambiguous edges. Expert Syst. Appl. 2019, 124, 1–12. [Google Scholar] [CrossRef]
  58. Sohn, K.; Jung, D.Y.; Lee, H.; Hero, A.O. Efficient learning of sparse, distributed, convolutional feature representations for object recognition. In Proceedings of the 2011 International Conference on Computer Vision, Barcelona, Spain, 6–13 November 2011; pp. 2643–2650. [Google Scholar]
  59. Deng, J.; Dong, W.; Socher, R.; Li, L.-J.; Li, K.; Fei-Fei, L. Imagenet: A large-scale hierarchical image database. In Proceedings of the IEEE Conference on Computer Vision and Pattern Recognition CVPR 2009, Miami, FL, USA, 20–25 June 2009; pp. 248–255. [Google Scholar]
  60. Li, M.; Zhao, C.; Tang, J. Hybrid image summarization by hypergraph partition. Neurocomputing 2013, 119, 41–48. [Google Scholar] [CrossRef]
  61. Lowe, D.G. Distinctive image features from scale-invariant keypoints. Int. J. Comput. Vis. 2005, 60, 91–110. [Google Scholar] [CrossRef]
  62. Samani, Z.R.; Shamsfard, M. The state of the art in developing fuzzy ontologies: A survey. arXiv 2018, arXiv:1805.02290. [Google Scholar]
  63. Guermah, H.; Fissaa, T.; Guermah, B.; Hafiddi, H.; Nassar, M.; Kriouile, A. How can reasoning improve ontology-based context-aware system? Int. J. Adv. Intell. Paradig. 2020, 15, 300–316. [Google Scholar] [CrossRef]
Figure 1. Classification training (train).
Ai 01 00014 g001
Figure 2. The summarization step (test).
Ai 01 00014 g002
Figure 3. The process of hierarchical classification.
Ai 01 00014 g003
Figure 4. Ontology features corresponding to each ontology node.
Ai 01 00014 g004
Figure 5. A part of the sub-tree of WordNet, which was used in our image summarization method.
Ai 01 00014 g005
Figure 6. Subjective assessment of the introduced approach.
Ai 01 00014 g006
Figure 7. Objective assessment of the introduced approach for different sizes of summaries.
Ai 01 00014 g007
Figure 8. Objective assessment of the introduced approach means of μ ratio (Equation (8)) for different sizes of summaries.
Ai 01 00014 g008
Figure 9. The value of μ according to different values of α   a n d   β . α shows branching behavior and β make the trade-off between relevancy and diversity.
Ai 01 00014 g009
Figure 10. Projection of Figure 9 on alpha and beta planes separately.
Ai 01 00014 g010
Figure 11. A set of 30 images related to Rome.
Ai 01 00014 g011
Figure 12. Summarization outcomes of images in Figure 11.
Ai 01 00014 g012
Figure 13. The effect of ontology features and hierarchical classifiers on the goodness of the summarization system.
Ai 01 00014 g013
Figure 14. The effect of ontology features and hierarchical classifiers on the goodness of the summarization system according to different values of beta.
Ai 01 00014 g014
Table 1. Comparison of Most Recent and Popular Methods on Image Collection Summarization.
ApproachModalitySupervisionCriteriaApproach
Visual Rank [5]ImageUnsupervisedSingle CriteriaSemantic Graph Centrality
Ozkose [3]ImagesSupervisedMulti-CriteriaRecurrent Neural Network (RNN)
Tschiatscheket [35]ImagesSupervisedSingle CriteriaLearning Sub Modular Function
Singh [2]ImagesUnSupervisedSingle CriteriaGenerative Adversarial Network (GAN)
MCCS [10]Image + Social Activities UnsupervisedMulti-CriteriaSemantic and Attractiveness Ranking
Proposed ApproachImagesUnsupervisedSingle CriteriaJoint Optimization of Hierarchical Classification
Rekabdar et al. [23]TextSupervisedSingleGenerative Adversarial Network (GAN)
Ma et al. [39]VideoSupervisedSingleSparse Dictionary Selection
Table 2. Ontology Features According to Ontology Node.
ImagesFeaturesN1N2N3N4N5N6N7N8N9N10N11
Ai 01 00014 i001I1
Ai 01 00014 i002I2
Table 3. Scores Assigned According to Representativeness.
LowMediumHighVery High
0123

