Artificial Intelligence-Enabled Predictive Insights for Ameliorating Global Malnutrition: A Human-Centric AI-Thinking Approach


Abstract
:1. Introduction
1.1. How Policy Making can be Informed by Unified Analytics of Nutrition, Health, and Population Statistics
1.2. The Theoretical Basis of AI-Thinking
1.3. Democratizing the Use of AI for Analysts Who are not Computer Scientists
2. Research Problem, Research Questions, and Model
2.1. Research Problem
2.2. Research Questions
- RQ1: From descriptive analytics of the dataset, what are the characteristics of the state of global malnutrition between the years 2001 and 2018?
- RQ2: From predictive analytics of the dataset, what is the best-case scenario that could result in low malnutrition levels in the global population?
- RQ3: From predictive analytics of the dataset, what is the worst-case scenario that could result in high malnutrition levels in the global population?
2.3. The Research Model
2.4. Descriptive Analytics of “What Has Already Happened?”
2.5. Predictive Analytics Using “What-If?” Hypothetical Scenarios
3. Methods
3.1. Dataset of the Malnutrition, Health and Population Variables
3.2. Data Analysis Methodology
3.2.1. Rationale for Using the AI-Based Bayesian Network Approach
3.2.2. The Bayesian Theorem
3.3. Software Used: Bayesialab
3.4. Pre-Processing: Checking for Missing Values or Errors in the Data
3.5. Overview of the BN Approach Used to Machine-Learn the Data
4. Results
4.1. Descriptive Analytics: A Cursory “First Look”at the Data Using Target-Means Total Effects Analysis
4.2. A User-Friendly Semi-Supervised Machine Learning Approach
- 57.77% probability that more than 87.2% of the population has received BCG immunization;
- 52.53% probability that more than 81.3% of the population has received DPT immunization;
- 52.53% probability that more than 81.1% of the population has received measles immunization;
- 52.53% probability that more than 82.1% of the population has received Pol3 immunization.
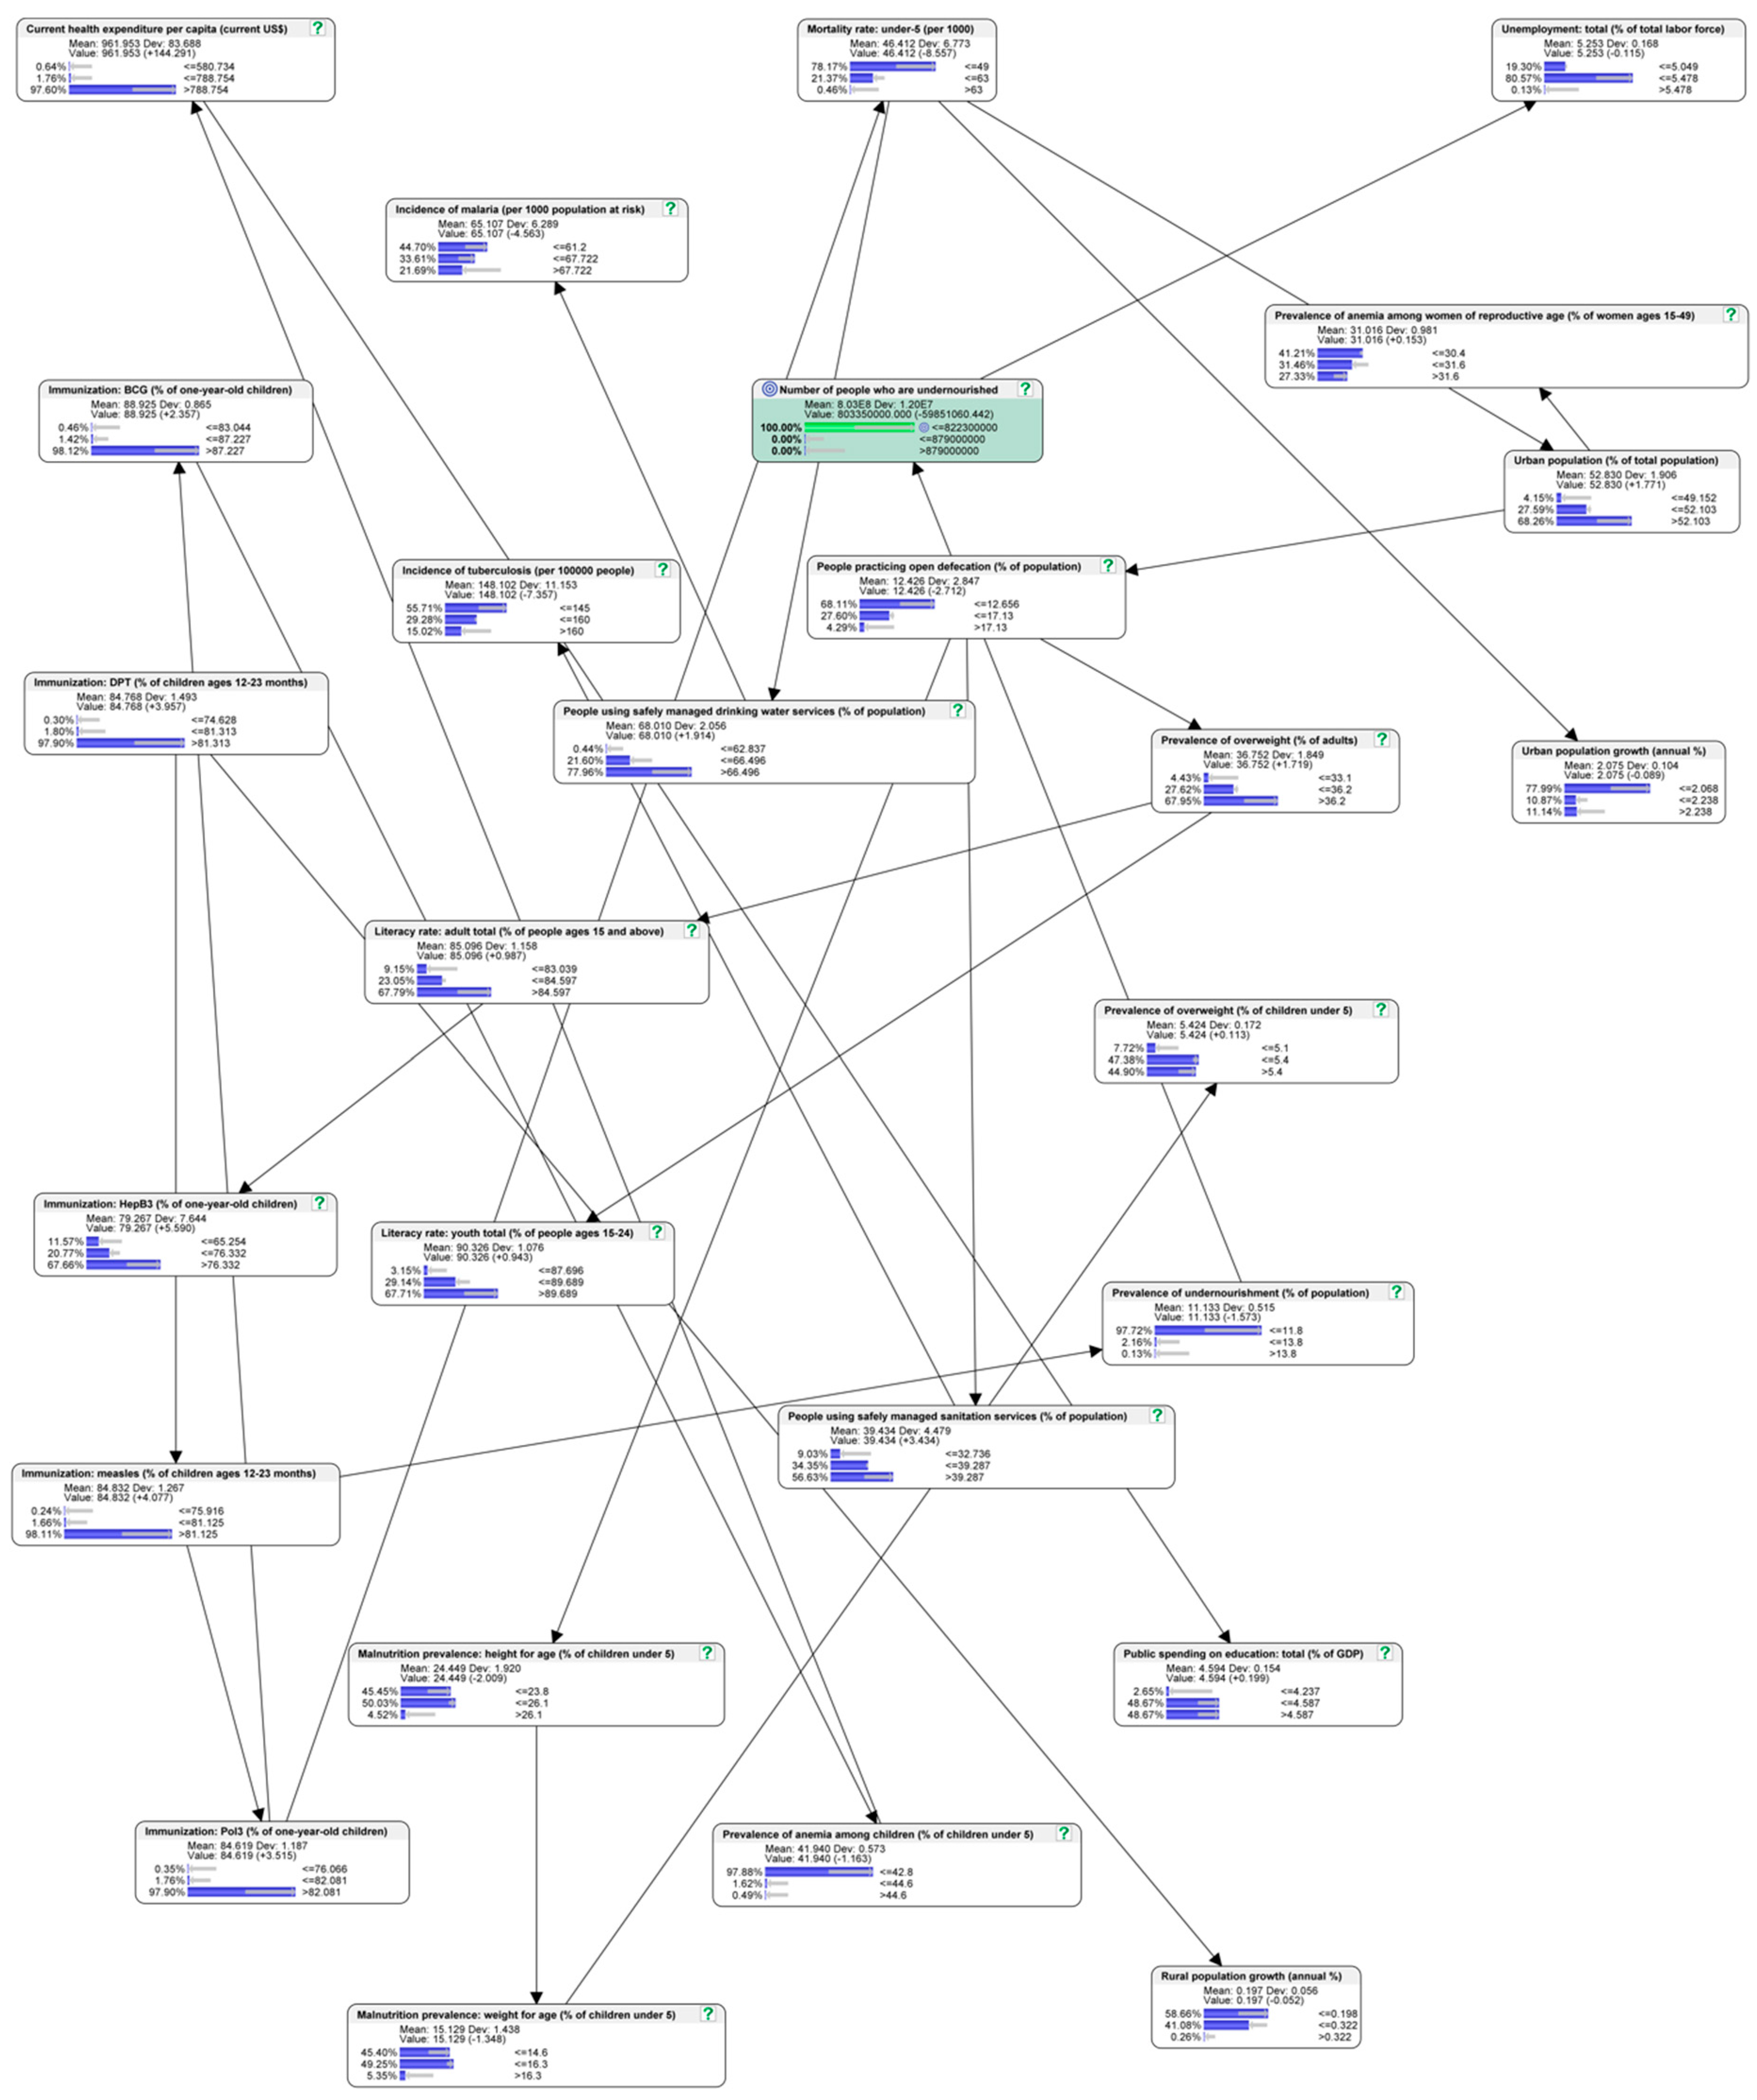
4.3. Predictive Analytics of the Best-Case Scenario
4.4. Predictive Analytics of the Worst-Case Scenario
4.5. Evaluation of the Predictive Performance of the Bayesian Network Model
4.5.1. Evaluation of the Predictive Performance Using Target Evaluation Cross-Validation by K-Folds
4.5.2. Evaluation of the Predictive Performance Using the Gains Curve, Lift Curve and ROC Curve
4.5.3. Limitations of the Study
5. Discussion and Conclusions
Author Contributions
Funding
Acknowledgments
Conflicts of Interest
References
- Prentice, A.M. The Double Burden of Malnutrition in Countries Passing through the Economic Transition. Ann. Nutr. Metab. 2018, 72 (Suppl. 3), 47–54. [Google Scholar] [CrossRef]
- World Health Organization. Strategic Action Plan to Reduce the Double Burden of Malnutrition in the South-East Asia Region 2016–2025; World Health Organization: Geneva, Switzerland, 2017; ISBN 978-92-9022-543-0. [Google Scholar]
- World Health Organization. Global Nutrition Report, 2018; World Health Organization: Geneva, Switzerland, 2018. [Google Scholar]
- Zhang, N.; Bécares, L.; Chandola, T. Patterns and Determinants of Double-Burden of Malnutrition among Rural Children: Evidence from China. PLoS ONE 2016, 11, e0158119. [Google Scholar] [CrossRef] [PubMed] [Green Version]
- World Health Organization. Obesity and Overweight; World Health Organization: Geneva, Switzerland, 2018. [Google Scholar]
- World Health Organization. Children: Reducing Mortality; World Health Organization: Geneva, Switzerland, 2019. [Google Scholar]
- Adler, N.E.; Boyce, T.; Chesney, M.A. Socioeconomic Inequalities in Health: No Easy Solution. J. Am. Med. Assoc. 1993, 269, 3140–3145. [Google Scholar] [CrossRef]
- Becker, L.B.; Han, B.H.; Meyer, P.M.; Wright, F.A.; Rhodes, K.V.; Smith, D.W.; Barrett, J. Racial Differences in the Incidence of Cardiac Arrest and Subsequent Survival. N. Engl. J. Med. 1993, 329, 600–606. [Google Scholar] [CrossRef] [PubMed]
- Patrick, D.L.; Madden, C.W.; Diehr, P.; Martin, D.P.; Cheadle, A.; Skillman, S.M. Health Status and Use of Services among Families with and without Health Insurance. Med. Care 1992, 30, 941–949. [Google Scholar] [CrossRef] [PubMed]
- World Bank Health Nutrition and Population Statistics. Available online: https://datacatalog.worldbank.org/dataset/health-nutrition-and-population-statistics (accessed on 1 November 2019).
- Association of Computing Machinery. Turing Award Laureate Dr. McCarthy’s Lecture the Present State of Research on Artificial Intelligence. Available online: https://amturing.acm.org/award_winners/mccarthy_1118322.cfm (accessed on 10 July 2019).
- Holzinger, A. From Machine Learning to Explainable AI. In Proceedings of the 2018 World Symposium on Digital Intelligence for Systems and Machines (DISA), Kosice, Slovakia, 23–25 August 2018. [Google Scholar]
- How, M.-L. Future-Ready Strategic Oversight of Multiple Artificial Superintelligence-Enabled Adaptive Learning Systems via Human-Centric Explainable AI-Empowered Predictive Optimizations of Educational Outcomes. BDCC 2019, 3, 46. [Google Scholar] [CrossRef] [Green Version]
- Zeng, D. From Computational Thinking to AI Thinking. IEEE Intell. Syst. 2013, 28, 2–4. [Google Scholar]
- Gadanidis, G. Artificial intelligence, computational thinking, and mathematics education. Int. J. Inf. Learn. Technol. 2017, 34, 133–139. [Google Scholar] [CrossRef]
- How, M.-L.; Hung, W.L.D. Educing AI-Thinking in Science, Technology, Engineering, Arts, and Mathematics (STEAM) Education. Educ. Sci. 2019, 9, 184. [Google Scholar] [CrossRef] [Green Version]
- Rad, P.; Roopaei, M.; Beebe, N. AI Thinking for Cloud Education Platform with Personalized Learning. In Proceedings of the 51st Hawaii International Conference on System Sciences, Waikoloa Village, HI, USA, 2–6 January 2018; pp. 3–12. [Google Scholar]
- Beigman Klebanov, B.; Burstein, J.; Harackiewicz, J.M.; Priniski, S.J.; Mulholland, M. Reflective Writing About the Utility Value of Science as a Tool for Increasing STEM Motivation and Retention—Can AI Help Scale Up? Int. J. Artif. Intell. Educ. 2017, 27, 791–818. [Google Scholar] [CrossRef]
- Rosenberg, L. Artificial Swarm Intelligence, a Human-in-the-Loop Approach to A.I. In Proceedings of the the Thirtieth AAAI Conference on Artificial Intelligence (AAAI-16), Phoenix, AZ, USA, 12–17 February 2016; pp. 4381–4382. [Google Scholar]
- Davis, B.; Sumara, D. Complexity and Education: Inquiries into Learning, Teaching, and Research; Routledge: Mahwah, NJ, USA, 2006. [Google Scholar]
- Davis, B. Complexity and Education: Vital Simultaneities. Educ. Philos. Theory 2008, 40, 50–65. [Google Scholar] [CrossRef]
- Hill, P.; Barber, M. Preparing for a Renaissance in Assessment; Pearson: London, UK, 2014. [Google Scholar]
- Correa, M.; Bielza, C.; Pamies-Teixeira, J. Comparison of Bayesian networks and artificial neural networks for quality detection in a machining process. Expert Syst. Appl. 2009, 36, 7270–7279. [Google Scholar] [CrossRef]
- Georgiopoulos, M.; DeMara, R.F.; Gonzalez, A.J.; Annie, S.W.; Mansooreh, M.; Gelenbe, E.; Kysilka, M.; Secretan, J.; Sharma, C.A.; Alnsour, A.J. A Sustainable Model for Integrating Current Topics in Machine Learning Research into the Undergraduate Curriculum. IEEE Trans. Educ. 2009, 52, 503–512. [Google Scholar] [CrossRef] [Green Version]
- Pearl, J. Causality: Models, Reasoning, and Inference, 2nd ed.; Cambridge University Press: Cambridge, UK, 2010; ISBN 978-0-521-89560-6. [Google Scholar]
- Pearl, J. Causes of Effects and Effects of Causes. Sociol. Methods Res. 2015, 44, 149–164. [Google Scholar] [CrossRef] [Green Version]
- Pearl, J. Fusion, propagation, and structuring in belief networks. Artif. Intell. 1986, 29, 241–288. [Google Scholar] [CrossRef] [Green Version]
- Loveland, D.W. Automated Theorem Proving: A Logical Basis; Elsevier North-Holland, Inc.: New York, NY, USA, 1978; ISBN 0-7204-0499-1. [Google Scholar]
- Moore, R.C. Logic and Representation; Center for the Study of Language (CSLI): Stanford, CA, USA, 1995; Volume 39. [Google Scholar]
- Domingos, P.; Pazzani, M. On the optimality of the simple Bayesian classifier under zero–one loss. Mach. Learn. 1997, 29, 103–130. [Google Scholar] [CrossRef]
- Hand, D.; You, K. Idiot’s Bayes—Not so stupid after all? Int. Stat. Rev. 2001, 69, 385–398. [Google Scholar]
- Tsamardinos, I.; Aliferis, C.F.; Statnikov, A. Time and sample efficient discovery of Markov blankets and direct causal relations. In Proceedings of the Ninth ACM SIGKDD International Conference on Knowledge Discovery and Data Mining-KDD ’03, Washington, DC, USA, 24–27 August 2003; p. 673. [Google Scholar]
- Guoyi, C.; Hu, S.; Yang, Y.; Chen, T. Response surface methodology with prediction uncertainty: A multi-objective optimisation approach. Chem. Eng. Res. Des. 2012, 90, 1235–1244. [Google Scholar]
- Fox, R.J.; Elgart, D.; Christopher Davis, S. Bayesian credible intervals for response surface optima. J. Stat. Plan. Inference 2009, 139, 2498–2501. [Google Scholar] [CrossRef]
- Miró-Quesada, G.; Del Castillo, E.; Peterson, J.J. A Bayesian approach for multiple response surface optimization in the presence of noise variables. J. Appl. Stat. 2004, 31, 251–270. [Google Scholar] [CrossRef]
- Myers, R.H.; Montgomery, D.C.; Anderson-Cook, C.M. Response Surface Methodology: Process and Product Optimization Using Designed Experiments, 3rd ed.; Wiley and Sons, Inc.: Somerset, NJ, USA, 2009; ISBN 978-0-470-17446-3. [Google Scholar]
- How, M.-L.; Hung, W.L.D. Educational Stakeholders’ Independent Evaluation of an Artificial Intelligence-Enabled Adaptive Learning System Using Bayesian Network Predictive Simulations. Educ. Sci. 2019, 9, 110. [Google Scholar] [CrossRef] [Green Version]
- World Bank Transposed Subset of the Health, Nutrition, and Population Statistics Dataset. Available online: https://figshare.com/articles/Data_file_of_malnutrition_health_and_population_statistics/10074344 (accessed on 1 November 2019).
- Hayat, C.; Abian, B. The Modeling of Artificial Neural Network of Early Diagnosis for Malnutrition with Backpropagation Method. In Proceedings of the 2018 Third International Conference on Informatics and Computing (ICIC), Palembang, Indonesia, 17–18 October 2018; pp. 1–7. [Google Scholar]
- Neill, D.B. New Directions in Artificial Intelligence for Public Health Surveillance. IEEE Intell. Syst. 2012, 27, 56–59. [Google Scholar] [CrossRef]
- Bayes, T. A Letter from the Late Reverend Mr. Thomas Bayes, F.R.S. to John Canton, M.A. and F. R. S. In The Royal Society, Philosophical Transactions (1683–1775); the Royal Society Publishing: London, UK, 1763; Volume 53, pp. 269–271. [Google Scholar]
- van de Schoot, R.; Kaplan, D.; Denissen, J.; Asendorpf, J.B.; Neyer, F.J.; van Aken, M.A.G. A Gentle Introduction to Bayesian Analysis: Applications to Developmental Research. Child Dev. 2014, 85, 842–860. [Google Scholar] [CrossRef] [PubMed]
- Hox, J.; van de Schoot, R.; Matthijsse, S. How few countries will do? Comparative survey analysis from a Bayesian perspective. Surv. Res. Methods 2012, 6, 87–93. [Google Scholar]
- Lee, S.-Y.; Song, X.-Y. Evaluation of the Bayesian and maximum likelihood approaches in analyzing structural equation models with small sample sizes. Multivar. Behav. Res. 2004, 39, 653–686. [Google Scholar] [CrossRef] [PubMed]
- Button, K.S.; Ioannidis, J.P.; Mokrysz, C.; Nosek, B.A.; Flint, J.; Robinson, E.S.; Munafao, M.R. Power failure: Why small sample size undermines the reliability of neuroscience. Nat. Rev. Neurosci. 2013, 14, 365–376. [Google Scholar] [CrossRef] [PubMed] [Green Version]
- Kaplan, D.; Depaoli, S. Bayesian structural equation modeling. In Handbook of Structural Equation Modeling; Hoyle, R., Ed.; Guilford Press: New York, NY, USA, 2012; pp. 650–673. [Google Scholar]
- Walker, L.J.; Gustafson, P.; Frimer, J.A. The application of Bayesian analysis to issues in developmental research. Int. J. Behav. Dev. 2007, 31, 366–373. [Google Scholar] [CrossRef]
- Zhang, Z.; Hamagami, F.; Wang, L.; Grimm, K.J.; Nesselroade, J.R. Bayesian analysis of longitudinal data using growth curve models. Int. J. Behav. Dev. 2007, 31, 374–383. [Google Scholar] [CrossRef] [Green Version]
- Kaplan, D. Causal inference with large-scale assessments in education from a Bayesian perspective: A review and synthesis. Large Scale Assess. Educ. 2016, 4, 7. [Google Scholar] [CrossRef] [Green Version]
- Levy, R. Advances in Bayesian Modeling in Educational Research. Educ. Psychol. 2016, 51, 368–380. [Google Scholar] [CrossRef]
- Mathys, C. A Bayesian foundation for individual learning under uncertainty. Front. Hum. Neurosci. 2011, 5, 39. [Google Scholar] [CrossRef] [PubMed] [Green Version]
- Muthén, B.; Asparouhov, T. Bayesian structural equation modeling: A more flexible representation of substantive theory. Psychol. Methods 2012, 17, 313–335. [Google Scholar] [CrossRef] [PubMed]
- Bekele, R.; McPherson, M. A Bayesian performance prediction model for mathematics education: A prototypical approach for effective group composition. Br. J. Educ. Technol. 2011, 42, 395–416. [Google Scholar] [CrossRef]
- Millán, E.; Agosta, J.M.; Cruz, J.L. Pérez de la Bayesian student modeling and the problem of parameter specification. Br. J. Educ. Technol. 2002, 32, 171–181. [Google Scholar] [CrossRef]
- Shannon, C.E. The lattice theory of information. IRE Prof. Group Inf. Theory 1953, 1, 105–107. [Google Scholar] [CrossRef]
- Lleo, S.; Ziemba, W. The Swiss Black Swan Bad Scenario: Is Switzerland another Casualty of the Eurozone Crisis? IJFS 2015, 3, 351–380. [Google Scholar] [CrossRef] [Green Version]
- Chang, W.; Xu, Z.; You, M.; Zhou, S.; Xiao, Y.; Cheng, Y. A Bayesian Failure Prediction Network Based on Text Sequence Mining and Clustering. Entropy 2018, 20, 923. [Google Scholar] [CrossRef] [Green Version]
- How, M.-L.; Hung, W.L.D. Harnessing Entropy via Predictive Analytics to Optimize Outcomes in the Pedagogical System: An Artificial Intelligence-Based Bayesian Networks Approach. Educ. Sci. 2019, 9, 158. [Google Scholar] [CrossRef] [Green Version]
- Cowell, R.G.; Dawid, A.P.; Lauritzen, S.L.; Spieglehalter, D.J. Probabilistic Networks and Expert Systems: Exact Computational Methods for Bayesian Networks; Springer: New York, NY, USA, 1999; ISBN 978-0-387-98767-5. [Google Scholar]
- Jensen, F.V. An Introduction to Bayesian Networks; Springer: New York, NY, USA, 1999; ISBN 0-387-91502-8. [Google Scholar]
- Korb, K.B.; Nicholson, A.E. Bayesian Artificial Intelligence; Chapman & Hall/CRC: London, UK, 2010; ISBN 978-1-4398-1591-5. [Google Scholar]
- Bayesia, S.A.S. Bayesialab. Available online: https://www.bayesialab.com/ (accessed on 18 March 2019).
- How, M.-L.; Cheah, S.-M.; Chan, Y.-J.; Khor, A.C.; Say, E.M.P. Artificial Intelligence-Enhanced Decision Support for Informing Global Sustainable Development: A Human-Centric AI-Thinking Approach. Information 2020, 11, 39. [Google Scholar] [CrossRef] [Green Version]
- Bayesia, S.A.S. BayesiaLab: Missing Values Processing. Available online: http://www.bayesia.com/bayesialab-missing-values-processing (accessed on 2 June 2019).
- Conrady, S.; Jouffe, L. Bayesian Networks & BayesiaLab: A Practical Introduction for Researchers; Bayesia: Franklin, TN, USA, 2015; ISBN 0-9965333-0-3. [Google Scholar]
- Bayesia, S.A.S. R2-GenOpt* Algorithm. Available online: https://library.bayesia.com/pages/viewpage.action?pageId=35652439#6c939073de75493e8379c0fff83e1384 (accessed on 19 March 2019).
- Lauritzen, S.L.; Spiegelhalter, D.J. Local computations with probabilities on graphical structures and their application to expert systems. J. R. Stat. Soc. 1988, 50, 157–224. [Google Scholar] [CrossRef]
- Kschischang, F.; Frey, B.; Loeliger, H. Factor graphs and the sum product algorithm. IEEE Trans. Inf. Theory 2001, 47, 399–431. [Google Scholar] [CrossRef] [Green Version]
- Rodríguez, L.; Cervantes, E.; Ortiz, R. Malnutrition and Gastrointestinal and Respiratory Infections in Children: A Public Health Problem. IJERPH 2011, 8, 1174–1205. [Google Scholar] [CrossRef] [PubMed] [Green Version]
- Asim, M.; Nawaz, Y. Child Malnutrition in Pakistan: Evidence from Literature. Children 2018, 5, 60. [Google Scholar] [CrossRef] [PubMed] [Green Version]
- Alkhaldy, A.A. Nutritional Knowledge and Self-Reported Nutritional Practice against Malnutrition among Physicians in Jeddah, Saudi Arabia. Healthcare 2019, 7, 149. [Google Scholar] [CrossRef] [Green Version]
- Troesch, B.; Biesalski, H.; Bos, R.; Buskens, E.; Calder, P.; Saris, W.; Spieldenner, J.; Verkade, H.; Weber, P.; Eggersdorfer, M. Increased Intake of Foods with High Nutrient Density Can Help to Break the Intergenerational Cycle of Malnutrition and Obesity. Nutrients 2015, 7, 6016–6037. [Google Scholar] [CrossRef] [Green Version]
- Shahid, S.M.; Bishop, K.S. Comprehensive Approaches to Improving Nutrition: Future Prospects. Nutrients 2019, 11, 1760. [Google Scholar] [CrossRef] [Green Version]
- Wieringa, F.; Dahl, M.; Chamnan, C.; Poirot, E.; Kuong, K.; Sophonneary, P.; Sinuon, M.; Greuffeille, V.; Hong, R.; Berger, J.; et al. The High Prevalence of Anemia in Cambodian Children and Women Cannot Be Satisfactorily Explained by Nutritional Deficiencies or Hemoglobin Disorders. Nutrients 2016, 8, 348. [Google Scholar] [CrossRef]
- Dureab, F.; Al-Falahi, E.; Ismail, O.; Al-Marhali, L.; Al Jawaldeh, A.; Nuri, N.N.; Safary, E.; Jahn, A. An Overview on Acute Malnutrition and Food Insecurity among Children during the Conflict in Yemen. Children 2019, 6, 77. [Google Scholar] [CrossRef] [Green Version]
- Volkert, D.; Beck, A.M.; Cederholm, T.; Cereda, E.; Cruz-Jentoft, A.; Goisser, S.; de Groot, L.; Großhauser, F.; Kiesswetter, E.; Norman, K.; et al. Management of Malnutrition in Older Patients—Current Approaches, Evidence and Open Questions. JCM 2019, 8, 974. [Google Scholar] [CrossRef] [Green Version]
- Moramarco, S.; Amerio, G.; Kasengele Chipoma, J.; Nielsen-Saines, K.; Palombi, L.; Buonomo, E. Filling the Gaps for Enhancing the Effectiveness of Community-Based Programs Combining Treatment and Prevention of Child Malnutrition: Results from the Rainbow Project 2015–17 in Zambia. IJERPH 2018, 15, 1807. [Google Scholar] [CrossRef] [Green Version]
- Silapachote, P.; Srisuphab, A. Teaching and learning computational thinking through solving problems in Artificial Intelligence: On designing introductory engineering and computing courses. In Proceedings of the IEEE International Conference on teaching, Assessment, and Learning for Engineering (TALE), Bangkok, Thailand, 7–9 December 2016. [Google Scholar]
- Bayes Fusion LLC. GeNie. Available online: https://www.bayesfusion.com/genie/ (accessed on 18 March 2019).
- Norsys Software Corp. Netica. Available online: https://www.norsys.com/netica.html (accessed on 18 March 2019).
- Bayes Server LLC. Bayes Server. Available online: https://www.bayesserver.com/ (accessed on 18 March 2019).


| Variable/Node Name |
|---|
| Year Current health expenditure per capita (current US$) Immunization: BCG (% of one-year-old children) Immunization: DPT (% of children ages 12–23 months) Immunization: HepB3 (% of one-year-old children) Immunization: measles (% of children ages 12–23 months) Immunization: Pol3 (% of one-year-old children) Incidence of malaria (per 1000 population at risk) Incidence of tuberculosis (per 100,000 people) Literacy rate: adult total (% of people ages 15 years and above) Literacy rate: youth total (% of people ages 15–24 years) Malnutrition prevalence: height for age (% of children under 5 years) Malnutrition prevalence: weight for age (% of children under 5 years) Mortality rate: under-5 years (per 1000) Number of people who are undernourished People practicing open defecation (% of population) People using safely managed drinking water services (% of population) People using safely managed sanitation services (% of population) Prevalence of anemia among children (% of children under 5 years) Prevalence of anemia among women of reproductive age (% of women ages 15–49 years) Prevalence of overweight (% of adults) Prevalence of overweight (% of children under 5 years) Prevalence of undernourishment (% of population) Public spending on education: total (% of GDP) Rural population growth (annual %) Unemployment: total (% of total labor force) Urban population (% of total population) Urban population growth (annual %) |
| Variable/Node | Low Level | Mid-Level | High Level | |||
|---|---|---|---|---|---|---|
| Range | Probability | Range | Probability | Range | Probability | |
| Current health expenditure per capita | <580 | 21.15% | 581–788 | 21.15% | >788 | 57.71% |
| Immunization: BCG | ≤83.0 | 26.35% | 83.1–87.2 | 15.88% | >87.2 | 57.77% |
| Immunization: DPT | ≤74.6 | 21.12% | 74.7–81.3 | 26.53% | >81.3 | 52.53% |
| Immunization: HepB3 | ≤65.2 | 32.84% | 65.3–76.3 | 30.29% | >76.3 | 36.87% |
| Immunization: Measles | ≤75.9 | 26.35% | 76.0–81.1 | 21.12% | >81.1 | 52.53% |
| Immunization: Pol3 | ≤76.1 | 26.35% | 76.2–82.1 | 21.12% | >82.1 | 52.53% |
| People using safely managed drinking water services | ≤62.8 | 15.89% | 62.9–66.5 | 42.72% | >66.5 | 41.39% |
| People using safely managed sanitation services | ≤32.7 | 36.83% | 32.8–39.4 | 32.47% | >39.4 | 30.70% |
| People practicing open defecation | ≤12.6 | 36.82% | 12.7–17.1 | 31.59% | >17.1 | 31.59% |
| Incidence of malaria | ≤61.2 | 26.64% | 61.3–67.7 | 18.64% | >67.7 | 56.72% |
| Incidence of tuberculosis | ≤145 | 30.59% | 146–160 | 27.17% | >160 | 42.24% |
| Prevalence of undernourishment | ≤11.8 | 47.28% | 11.9–13.8 | 21.12% | >13.8 | 31.60% |
| Number of people who are undernourished | ≤822 million | 45.46% | 823–879 million | 17.62% | >879 million | 36.82% |
| Prevalence of anemia among women of reproductive age | ≤30.4 | 38.93% | 30.5–31.6 | 46.24% | >31.6 | 14.83% |
| Prevalence of anemia among children | ≤42.8 | 57.74% | 42.9–44.6 | 21.13% | >44.6 | 21.13% |
| Prevalence of overweight adult | ≤33.1 | 31.59% | 33.2–36.2 | 31.59% | >36.2 | 36.82% |
| Prevalence of overweight children | ≤5.1 | 29.35% | 5.1–5.4 | 42.12% | >5.4 | 28.53% |
| Malnutrition prevalence among children: height | ≤23.8 | 24.83% | 23.9–26.1 | 43.69% | >26.1 | 31.48% |
| Malnutrition prevalence among children: weight | ≤14.6 | 26.19% | 14.7–16.3 | 42.88% | >16.3 | 30.93% |
| Mortality rate of children under age 5 | ≤49 | 42.06% | 50–63 | 31.59% | >63 | 26.35% |
| Variable/Node | Low Level | Mid-Level | High Level | |||
|---|---|---|---|---|---|---|
| Original | Predicted | Original | Predicted | Original | Predicted | |
| Current health expenditure per capita | 21.15% | 0.64% ↓ | 21.15% | 1.76% ↓ | 57.71% | 97.60% ↑ |
| Immunization: BCG | 26.35% | 0.46% ↓ | 15.88% | 1.42% ↓ | 57.77% | 98.12% ↑ |
| Immunization: DPT | 21.12% | 0.30% ↓ | 26.35% | 1.80% ↓ | 52.53% | 97.90% ↑ |
| Immunization: HepB3 | 32.84% | 11.57% ↓ | 30.29% | 20.77% ↓ | 52.53% | 67.66% ↑ |
| Immunization: measles | 26.35% | 0.24% ↓ | 21.12% | 1.66% ↓ | 52.53% | 98.11% ↑ |
| Immunization: Pol3 | 26.35% | 0.35% ↓ | 21.12% | 1.76% ↓ | 52.53% | 97.90% ↑ |
| People using safely managed drinking water services | 15.89% | 0.44% ↓ | 42.72% | 21.60% ↓ | 41.39% | 77.96% ↑ |
| People using safely managed sanitation services | 36.83% | 9.03% ↓ | 32.47% | 21.60% ↓ | 30.70% | 56.63% ↑ |
| People practicing open defecation | 36.82% | 68.11% ↑ | 31.59% | 27.60% ↓ | 31.59% | 4.29% ↓ |
| Incidence of malaria | 26.64% | 44.70% ↑ | 18.64% | 33.61% ↑ | 56.72% | 21.69% ↓ |
| Incidence of tuberculosis | 30.59% | 55.71% ↑ | 27.17% | 29.28% ↑ | 42.24% | 15.02% ↓ |
| Prevalence of undernourishment | 47.28% | 97.72% ↑ | 21.12% | 2.16% ↓ | 31.60% | 0.13% ↓ |
| Prevalence of overweight adults | 31.59% | 4.43% ↓ | 31.59% | 27.62% ↓ | 36.82% | 67.95% ↑ |
| Prevalence of anemia among women | 38.93% | 41.21% ↑ | 46.24% | 31.46% ↓ | 14.83% | 27.33% ↑ |
| Prevalence of anemia among young children | 57.74% | 97.88% ↑ | 21.13% | 1.62% ↓ | 21.13% | 0.49% ↓ |
| Mortality rate of young children | 42.06% | 78.17% ↑ | 31.59% | 21.37% ↓ | 26.35% | 0.46% ↓ |
| Malnutrition prevalence among children: height | 24.83% | 45.45% ↑ | 43.69% | 50.03% ↑ | 31.48% | 4.52% ↓ |
| Malnutrition prevalence among children: weight | 26.19% | 45.40% ↑ | 42.88% | 49.25% ↑ | 30.93% | 5.35% ↓ |
| Prevalence of overweight children | 29.35% | 7.72% ↓ | 42.12% | 47.38% ↑ | 28.53% | 44.90% ↑ |
| Variable/Node | Low Level | Mid-Level | High Level | |||
|---|---|---|---|---|---|---|
| Original | Predicted | Original | Predicted | Original | Predicted | |
| Current health expenditure per capita | 21.15% | 56.06% ↑ | 21.15% | 32.42% ↑ | 57.71% | 11.53% ↓ |
| Immunization: BCG | 26.35% | 70.54% ↑ | 15.88% | 18.39% ↑ | 57.77% | 11.07% ↓ |
| Immunization: DPT | 21.12% | 56.67% ↑ | 26.35% | 38.53% ↑ | 52.53% | 4.80% ↓ |
| Immunization: HepB3 | 32.84% | 61.50% ↑ | 30.29% | 34.02% ↑ | 36.87% | 4.48% ↓ |
| Immunization: measles | 26.35% | 71.02% ↑ | 21.12% | 24.40% ↑ | 52.53% | 4.58% ↓ |
| Immunization: Pol3 | 26.35% | 70.78% ↑ | 21.12% | 24.42% ↑ | 52.53% | 4.80% ↓ |
| People using safely managed drinking water services | 15.89% | 42.25% ↑ | 42.72% | 53.50% ↑ | 41.39% | 4.24% ↓ |
| People using safely managed sanitation services | 36.83% | 77.66% ↑ | 32.47% | 18.92% ↓ | 30.70% | 3.42% ↓ |
| People practicing open defecation | 36.82% | 3.91% ↓ | 31.59% | 21.83% ↓ | 31.59% | 74.26% ↑ |
| Incidence of malaria | 26.64% | 3.53% ↓ | 18.64% | 2.90% ↓ | 56.72% | 93.58% ↑ |
| Incidence of tuberculosis | 30.59% | 3.90% ↓ | 27.17% | 15.58% ↓ | 42.24% | 80.52% ↑ |
| Prevalence of undernourishment | 47.28% | 0.16% ↓ | 21.12% | 14.38% ↓ | 31.60% | 85.46% ↑ |
| Prevalence of overweight adults | 31.59% | 74.04% ↑ | 31.59% | 21.89% ↓ | 36.82% | 4.07% ↓ |
| Prevalence of anemia among women | 38.93% | 22.58% ↓ | 46.24% | 75.75% ↑ | 14.83% | 1.67% ↓ |
| Prevalence of anemia among young children | 57.74% | 11.26% ↓ | 21.13% | 32.44% ↑ | 21.13%. | 56.29% ↑ |
| Mortality rate of young children | 42.06% | 4.05% ↓ | 31.59% | 25.41% ↓ | 26.35% | 70.54% ↑ |
| Malnutrition prevalence among children: height | 24.83% | 3.12% ↓ | 43.69% | 23.30% ↓ | 31.48% | 73.58% ↑ |
| Malnutrition prevalence among children: weight | 26.19% | 5.44% ↓ | 42.88% | 23.75% ↓ | 30.93% | 70.81% ↑ |
| Prevalence of overweight children | 29.35% | 62.95% ↑ | 42.12% | 26.71% ↓ | 28.53% | 10.35% ↓ |
© 2020 by the authors. Licensee MDPI, Basel, Switzerland. This article is an open access article distributed under the terms and conditions of the Creative Commons Attribution (CC BY) license (http://creativecommons.org/licenses/by/4.0/).
Share and Cite
How, M.-L.; Chan, Y.J. Artificial Intelligence-Enabled Predictive Insights for Ameliorating Global Malnutrition: A Human-Centric AI-Thinking Approach. AI 2020, 1, 68-91. https://doi.org/10.3390/ai1010004
How M-L, Chan YJ. Artificial Intelligence-Enabled Predictive Insights for Ameliorating Global Malnutrition: A Human-Centric AI-Thinking Approach. AI. 2020; 1(1):68-91. https://doi.org/10.3390/ai1010004
Chicago/Turabian StyleHow, Meng-Leong, and Yong Jiet Chan. 2020. "Artificial Intelligence-Enabled Predictive Insights for Ameliorating Global Malnutrition: A Human-Centric AI-Thinking Approach" AI 1, no. 1: 68-91. https://doi.org/10.3390/ai1010004
APA StyleHow, M.-L., & Chan, Y. J. (2020). Artificial Intelligence-Enabled Predictive Insights for Ameliorating Global Malnutrition: A Human-Centric AI-Thinking Approach. AI, 1(1), 68-91. https://doi.org/10.3390/ai1010004