Article

No Change in Fireworks-Related Burn Center Admissions: A 10-Year Analysis of the Admission Rates, Treatment, and Costs

by
Daan T. Van Yperen
1,2,
Margriet E. Van Baar
3,4,
Suzanne Polinder
4,
Paul P.M. Van Zuijlen
5,6,
Gerard I.J.M. Beerthuizen
7,
Ymke Lucas
1,
Esther M.M. Van Lieshout
2,
Michael H.J. Verhofstad
2,
Cornelis H. Van der Vlies
1,2,* and
Dutch Burn Repository Group
1
Burn Center, Maasstad Hospital, P.O. Box 9100, 3079 DZ Rotterdam, The Netherlands
2
Trauma Research Unit Department of Surgery, Erasmus MC, University Medical Center Rotterdam, P.O. Box 2040, 3000 CA Rotterdam, The Netherlands
3
Association of Dutch Burn Centers, Maasstad Hospital, P.O. Box 9100, 3079 DZ Rotterdam, The Netherlands
4
Department of Public Health, Erasmus MC, University Medical Center Rotterdam, P.O. Box 9100, 3079 DZ Rotterdam, The Netherlands
5
Burn Center and Department of Plastic and Reconstructive Surgery, Red Cross Hospital, P.O Box 1074, 1940 EB Beverwijk, The Netherlands
6
Department of Plastic, Reconstructive and Hand Surgery, Amsterdam Movement Sciences, Amsterdam UMC (location VUmc), P.O. Box 7057, 1007 MB Amsterdam, The Netherlands
7
Burn Center, Martini Hospital, P.O Box 30033, 9700 RM Groningen, The Netherlands
*
Author to whom correspondence should be addressed.
The ‘Dutch Burn Repository Group’ consists of: G.I.J.M. Beerthuizen, J. Dokter, J. Eshuis, T.M. Haanstra, J. Hiddingh, E. Middelkoop, M.K. Nieuwenhuis, A. Novin, A. Pijpe, D. Roodbergen, S.M.H.J. Scholten-Jaegers, M.M. Stoop, M.E. Van Baar, A. Van Es, C.H. Van der Vlies, P.P.M. Van Zuijlen.
Eur. Burn J. 2021, 2(1), 31-40; https://doi.org/10.3390/ebj2010003
Submission received: 4 January 2021 / Revised: 4 February 2021 / Accepted: 14 February 2021 / Published: 20 February 2021

Abstract

:
The aim of this study was to provide insight into the admission rate, treatment, and healthcare costs of patients with fireworks-related burns admitted to a Dutch burn center in the past 10 years. We hypothesized that, like the nationwide number of injuries, the number of patients admitted to a burn center with fireworks-related burn injuries would have decreased during the study period. In this retrospective multicenter cohort study, all patients with fireworks-related burns admitted to a Dutch burn center between 2009 and 2019 were eligible. Patients were identified from a national database and data were obtained regarding admission details, patient and injury characteristics, treatment, and healthcare costs. A total of 133 patients were included. On average, 12 patients were admitted per year. No increase or decrease was observed during the study period. The median total body surface area burned was 1% (P25–P75 0.5–2.5) and 75% of the burns were of partial thickness. Thirteen (10%) patients were admitted to the ICU and 66 (50%) underwent surgical treatment. The mean total healthcare costs across all 133 patients were estimated at €9040 (95% CI €5830 to €12,260) per patient. In contrast to the hypothesis, no increase or decrease was observed in burn center admissions over the past 10 years. Most burns were of small size, but nevertheless, all patients were admitted to a burn center and half of them underwent surgical treatment.

1. Introduction

Worldwide, fireworks are used to celebrate all kinds of cultural or religious festivities, such as Guy Fawkes Day in the United Kingdom, festival of lights (Diwali) in India, and New Year’s Eve in several countries, such as the Netherlands [1,2,3,4]. However, the use of consumer fireworks is not without any danger, as fireworks have the potential to cause permanent physical damage, such as scars, blind eyes, and amputated digits. In some cases, they can even have fatal consequences. Most injuries occur in young males, of approximately 10–19 years old, and most of the injuries are burns to the hand [2,3,4,5,6,7,8,9,10,11].
During New Year’s Eve 2018–2019, approximately 400 patients visited a Dutch emergency department for medical treatment because of fireworks-related injuries [3,12]. Some patients required treatment at a specialized burn center because of severe burns. These injuries do not only have a major impact on patients’ physical and psychological health, they also lead to increased medical costs. Besides the physical damage, fireworks also cause severe public disturbance. Each year, hundreds of incidents occur during the night of New Year’s Eve, including vandalism, arson, and violence against emergency responders. Therefore, it is considered to be the most unsafe and an expensive event of the year in the Netherlands [13].
Although the request for a general ban on the use of consumer fireworks has been growing over the past decade, the Dutch government has not been willing to meet this request. Several actions have been taken in the past years in order to reduce the number of injuries, such as limiting the legally permitted time to use fireworks, a ban on dangerous fireworks (e.g., Roman candles), and the introduction of fireworks-free areas. Since then, a decrease has been observed in the nationwide number of patient who presented to Dutch emergency departments [12]. However, currently, it has not been investigated whether this also led to a decrease in the number of burn center admissions. Furthermore, the financial impact of these patients from a public healthcare perspective remains unclear.
Therefore, the aim of this study was to provide insight into the admission rate, treatment, and healthcare costs of patients with fireworks-related burn injuries admitted to Dutch burn centers. We hypothesized that, like the nationwide number of injuries, the number of patients admitted to a burn center with fireworks-related burn injuries has decreased during the study period. The results of this study provide additional insight into the consequences of fireworks which may support the public and political debate about the use of consumer fireworks.

2. Results

2.1. Inclusions

During the 10-year study period, 7417 burn patients were admitted to any of the three Dutch burn centers. A total of 133 patients with fireworks-related burns were admitted and included in the current study.

2.2. Trends in Admissions

Figure 1A shows that the majority (89%) of admissions in the past 10 years were in December and January. Most patients (N = 106; 80%) were admitted between 29 December and 3 January and 93 (70%) patients were admitted on 31 December and 1 January. The annual number of admissions fluctuated substantially, from three in 2010 up to 18 in 2014 (Figure 1B). On average 12 patients were admitted per year. No increase or decrease was observed during the study period.
The number of patients with fireworks-related burns admitted to a burn center per month of all years combined (2009–2019).

2.3. Patient and Injury Characteristics

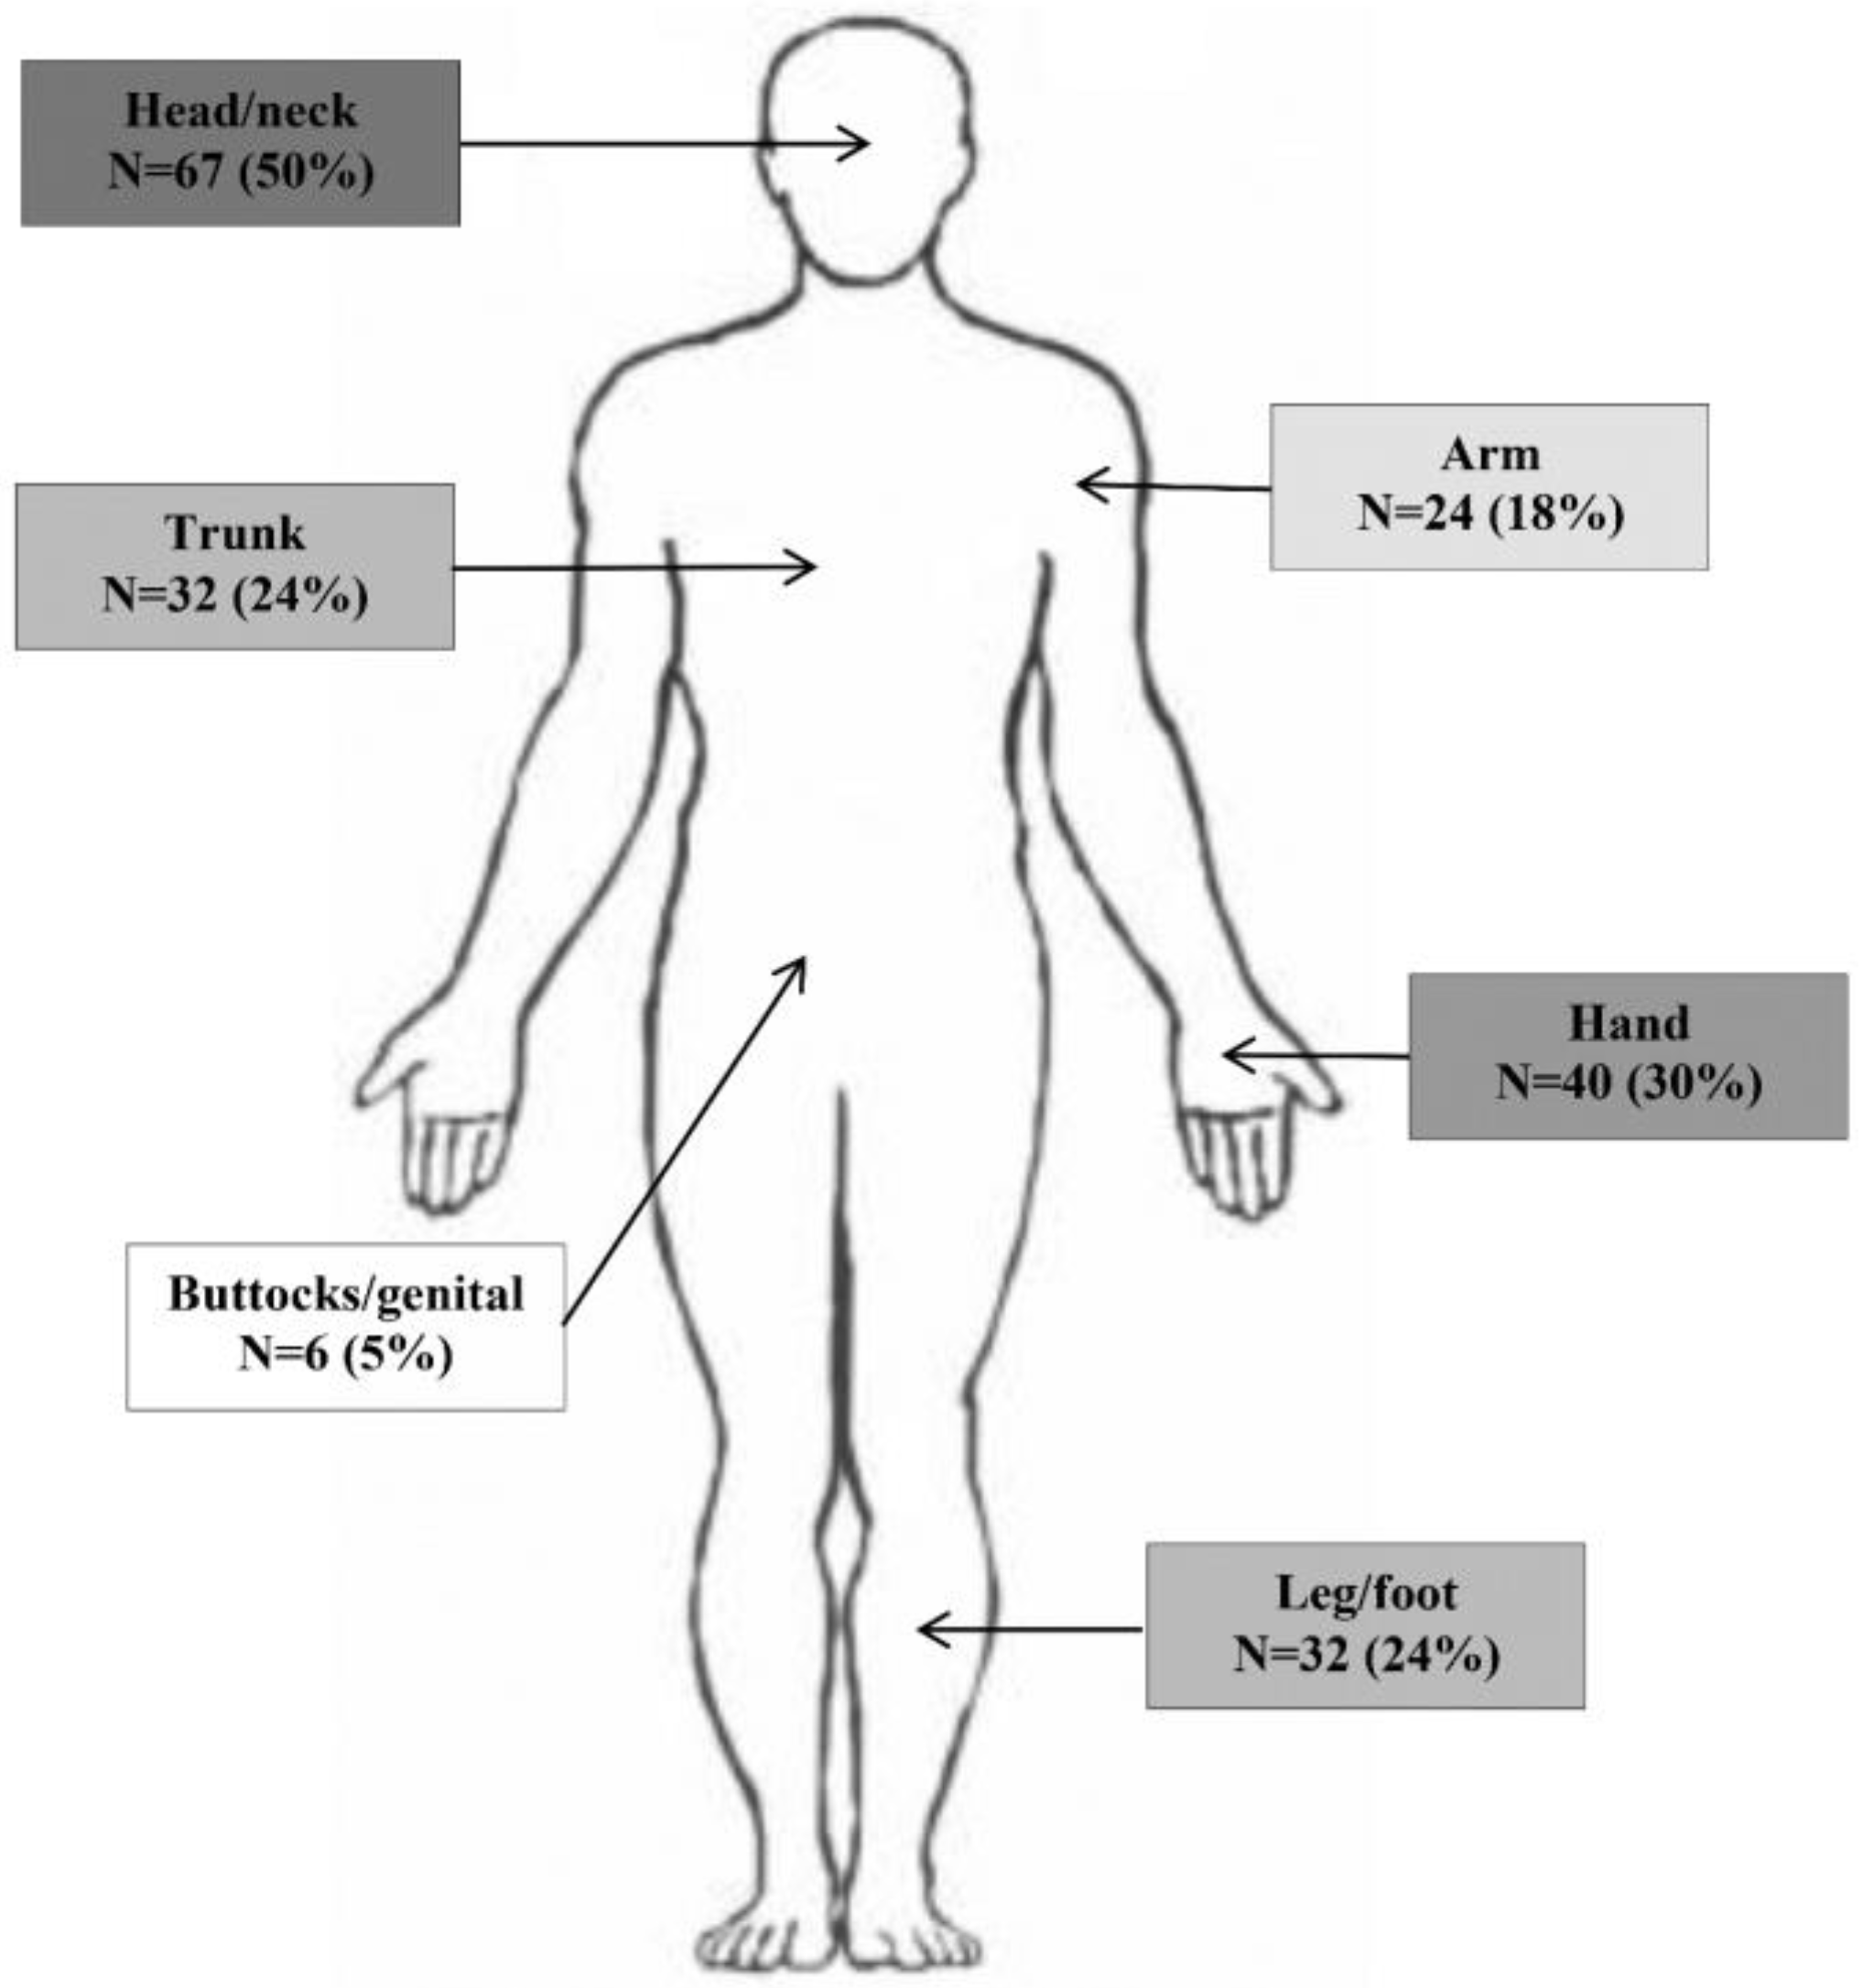
The median age for the entire cohort was 15 years (P25–P75 11–25; range 2–78), and most were males (N = 103; 77%; Table 1). The median percentage total body surface area (TBSA) burned was 1% (P25–P75 0.5–2.5; range 0.1–40), and the majority of burns were of partial thickness (N = 100; 75%). Two patients had ≥15% TBSA burned. Most of the injuries were located to the head/neck (N = 67; 50%), followed by the hand (N = 40; 30%; Figure 2).

2.4. Treatment Characteristics

The median length of hospital stay was 1 (P25–P75 1–5; range 0–77) day (Table 2). Thirteen (10%) patients were admitted to the ICU with a median duration of 2 (P25–P75 2–5; range 1–35) days. Nine patients required mechanical ventilation. Half of all patients (N = 66) underwent surgical treatment in the acute phase, and the most commonly performed type of surgery was split skin grafting (N = 54; 82%). Four (3%) patients needed reconstructive surgery at a later stage (Table 3). Forty-seven (35%) patients were treated in a day care setting and only 16 (12%) were re-admitted. The mortality in this study was zero.

2.5. Costs for Specialized Burn Care

The mean total healthcare costs across all 133 patients for specialized burn care were estimated at €9040 (95% CI €5832 to €12,257) per patient. Non-ICU burn center days accounted for 45% of the total costs for specialized burn care, followed by ICU days (20%), and surgical treatment (16%; Table 4). The mean total costs were lowest for patients who were treated in day care alone (€975 (95% CI €765 to €1185)) and highest for patients requiring hospital admission and surgical treatment (€13,834 (95% CI €7600 to €20,070).

3. Discussion

This retrospective cohort study investigated the admission of patients with fireworks-related burn injuries over the past decade. Although the nationwide number of patients who presented to an emergency department has decreased [12], this study found no increase or decrease in burn center admissions over the past 10 years. The annual number of burn center admission fluctuated widely per year. Previous studies have also shown no evident reduction in burn center admissions in the past years [8,15]. Although it is unknown to what extent preventive measures were taken in other countries, data from this current study suggest that the preventive actions taken by the Dutch government so far have not led to a reduction of admissions to a burn center. Given that, on a nationwide scale, the number of patients who presented to an emergency department has been decreasing, it is a possibility that these measures were only effective for patients with minor burns or for patients with other types of injuries [16]. Those patients may not need to present to a burn center, which may explain why the current study found no decrease in patient numbers. This is supported by a previous study reporting a decreasing incidence rate of fireworks-related eye injuries [17]. Another possibility is that the amount of fireworks used has increased, and that this compensated for a decrease of injuries per consumer.
The current data do not allow drawing conclusions about the effectiveness of preventive measures implemented during the study period. Such inference would require national data from all burn centers and non-burn centers combined, and both from admitted and non-admitted patients. Many governmental measures, such as shortening the time frame during which fireworks are allowed, permission of only light types of fireworks, and the installation of fireworks-free zones (in general, not exceeding a few hundred square meters around, e.g., nursing homes), have not been implemented to reduce the number of victims, but to diminish public nuisance. A preventive effect of such measures on injuries has been claimed by politicians, but our data do not support this assumption. However, the total prohibition on consumer fireworks as proclaimed by the government last year to relieve the overloaded healthcare system, due to COVID-19 infection, seemed to be very effective to reduce the number of fireworks-related injuries. Unfortunately, real data are not yet available.
The annual fluctuation of burn center admissions might be a result of the weather conditions during New Year’s Eve. As a result, fewer people may be handling fireworks, resulting in fewer injuries. In order to reduce the number of burn center admissions, additional or alternative measures are needed. Collaboration between burn center clinicians and the government is important when educating the public about the potential dangers of fireworks. As physicians involved in treating patients with fireworks-related injuries, we advocate for a total ban on consumer fireworks and plea for the use of safer alternatives, such as non-fire generating, electronic laser firework simulations. Furthermore, we advocate that only trained and licensed persons are legally allowed to handle fireworks, and that fireworks displays can be organized on a local scale.
The median TBSA burned in this study was 1%, which is similar to a previous study [15]. Despite the burn injuries being of relatively small size, all patients were admitted to a burn center. Probably, these patients were admitted because of a predominance of burns located to functional areas including the hand, head, and neck. That is one of the referral criteria for burn center presentation. Inhalation injury, which can lead to airway obstruction, is frequently diagnosed in patients with facial burns [18]. These patients may require observation of the airways. This is supported by the very short (one day) hospital length of stay found in this study. Although the median burn size was small, patients had up to 40% of TBSA burned. Moreover, all patients needed burn center admission and half of all patients needed surgery. This is comparable with the general population of admitted burn center patients (45%) [19]. At first glance, most burn injuries found in this study do not seem to be very severe. However, with a TBSA burned up to 40% and many patients requiring surgical treatment, the dangers of fireworks must not be underestimated. Moreover, although not observed in this study, on average, one person dies each year due to the use of consumer fireworks [12], and many more become blind or lose a finger [17,20,21].
Furthermore, this study was the first to determine the healthcare costs for specialized burn care in patients with fireworks-related burns. No previous studies were available for a proper comparison. This study found that, on average, €9040 could be saved for each patient who would not have sustained fireworks-related injuries. Potential savings could even be much higher for each prevented case of patient requiring surgical treatment. This is a significant amount, given that most patients had only small burns. However, due to the relatively small sample size, the mean costs were skewed and affected by some patients with relatively high costs (outliers). This shows that the mean costs were mainly determined by a small selection of patients. Nevertheless, fireworks-related injuries can be prevented easily. Reducing the numbers will not only reduce the economic burden, but will also prevent cases of patients with life-long injuries as a result of scarring. The cost analysis in this study was confined to the health care perspective and included direct medical costs only. However, fireworks-injuries also result in indirect non-medical costs, as a result of absenteeism from work or lost productivity. In a cost analysis from a societal perspective, increased costs would also be included, due to vandalism and the deployment of extra personnel during New Year’s Eve.

3.1. Strengths and Limitations

This was the first study to provide information about patients with fireworks-related burns admitted to a specialized burn center. Due to the 10-year study period, this study was able to provide data about trends in burn center admissions over a longer period of time. Furthermore, this study was the first to provide data about the healthcare costs of this particular population.
A limitation of this study was that no other outcome measures were obtained besides treatment outcomes. Such data are important in the perspective of value-based healthcare, but due to the design of this study and the used database, it was not possible to investigate these issues. Additionally, only the direct healthcare costs were calculated for this population. Although the majority of patients were younger than 20 years, the costs due to lost productivity should also be included. Furthermore, this study focused on admitted burn center patients only. Patients admitted to hospitals without a burn center should have been taken into account in order to obtain a complete overview of the consequences of consumer fireworks. Since the vast majority of severe injuries will have been treated in one of the three burn centers, our data provide a quite reliable insight into the potentials savings of preventive measures at the national level. Not including non-burn centers into this study also explains why only two patients underwent an amputation. Based on national or local referral protocols, patients with traumatic amputations may also present to a level I trauma center.

3.2. Materials and Methods

3.2.1. Study Design and Setting

This was a retrospective multicenter cohort study, with a follow-up ranging from four to 124 months. Patients were identified from the Dutch Burn Repository R3 (DBR R3), a national register for burn patients admitted to one of three Dutch burn centers (Red Cross Hospital Beverwijk, Martini Hospital Groningen, and Maasstad Hospital Rotterdam) [19]. Patients are included in the Dutch Burn Repository R3 if they are admitted for at least two hours to a specialized burn center. All three governmentally assigned burn centers contributed patients to the repository and to the current study. Patients with ‘fireworks’ as trauma mechanism were included for analysis. Anonymized DBR R3 data were extracted and analyzed. The Medical Research Ethics Committee United exempted this study (MEC-U; W19.037).

3.2.2. Participants

All patients (no age limit) with fireworks-related burns admitted to a Dutch burn center between 1 February 2009 and 31 January 2019 were eligible for inclusion. No exclusion criteria were applied to this cohort.

3.2.3. Data Collection

The data collected in the DBR R3 were used for analysis. The following data were extracted from the DBR R3: year and month of admission, patient characteristics (gender and age), burn injury characteristics (percentage total body surface area (TBSA) burned, burn depth (partial or full thickness)), the presence of inhalation injury, additional injury, body region affected (e.g., face or hand), and treatment outcome (hospital and intensive care unit (ICU) admission, surgical treatment details, and mortality).

3.2.4. Cost Analysis

Healthcare cost analysis was performed in accordance with the Dutch guidelines for economic evaluations in healthcare [22]. Costs were calculated from the health care perspective including the healthcare costs for specialized burn care. This included costs for transportation, burn center stay, and surgical treatment. Costs were calculated by multiplying the volumes of health care use with the corresponding unit prices (Table 5). Data on health care utilization (transport, burn center stay, surgical treatment, and reconstructive surgery) were derived from the DBR R3. These items cover approximately 87% of the costs for specialized burn care [14]. To correct for the remaining costs (diagnostic procedures, non-surgical treatment, clinical consultation, and outpatients burn care), 13% of the costs from the available health care resources were added. Unit prices were derived from the Dutch costs manual and Hop et al. [14,22,23]. All unit prices were adjusted for the corresponding year of admission using the national consumer price index. Costs are reported in Euros. Mean total healthcare costs were calculated for the entire population and for three subgroups; (1) patients treated in day care only, (2) patients with clinical admission who were not operated, and (3) patients with clinical admission who were operated.

3.2.5. Statistical Analysis

Statistical analysis was performed using the Statistical Package for the Social Sciences (SPSS) version 25.0 (SPSS, Chicago, IL, USA). Data are reported following the ‘Strengthening the Reporting of Observational studies in Epidemiology’ (STROBE) guidelines.
Normality of continuous data was tested with the Shapiro–Wilk test. Descriptive analysis was performed to report the outcome measures. For continuous data (e.g., age and TBSA), which were all non-parametric, the median and quartiles are reported. For categorical data (e.g., gender and need for surgery) the number and percentages are reported. Mean costs are presented with the 25–75% IQR.

4. Conclusions

This study investigated the admission rate, treatment, and healthcare costs of patients with fireworks-related burns admitted to Dutch burn centers in the past 10 years. Because the preventive measures from the Dutch government have led to a nationwide reduction of fireworks-related injuries, it was hypothesized that the number of hospital admissions in burn centers has also decreased during the study period. This study showed that during the study period, no increase or decrease was observed. Despite the relatively small size of the burn injuries, all patients required burn center admission, and a significant number of patients underwent surgical treatment. The direct healthcare costs for specialized burn care was estimated at a mean of €9040 (95% CI €5830 to €12,260) per patient. Preventive measures from the past years did not result in a reduction of burn center admissions, and thus, an additional or alternative approach is needed. Safer alternatives for fireworks should be promoted more and fireworks legislation should be changed, so that handling of consumer fireworks is reserved for trained and licensed persons only.

Author Contributions

D.T.V.Y., M.E.V.B., M.H.J.V. and C.H.V.d.V. developed this study. D.T.V.Y. and M.E.V.B. collected the study data. D.T.V.Y., M.E.V.B. and S.P. performed the statistical analysis. D.T.V.Y., M.E.V.B. and C.H.V.d.V. drafted the manuscript. S.P., P.P.M.V.Z., G.I.J.M.B., Y.L., E.M.M.V.L., M.H.J.V. and Dutch Burn Repository Group critically read and revised the manuscript. All authors have read and agreed to the published version of the manuscript.

Funding

This research received no external funding.

Institutional Review Board Statement

The Medical Research Ethics Committee United exempted this study (MEC-U; W19.037; approval date 15 February 2019).

Informed Consent Statement

Patient consent was waived due to the retrospective nature of the study.

Data Availability Statement

Data will be made available upon reasonable request by e-mail to the corresponding author.

Conflicts of Interest

The authors declare no conflict of interest.

References

  1. Edwin, A.F.; Cubison, T.C.; Pape, S.A. The impact of recent legislation on paediatric fireworks injuries in the Newcastle upon Tyne region. Burns 2008, 34, 953–964. [Google Scholar] [CrossRef]
  2. Tavakoli, H.; Khashayar, P.; Amoli, H.A.; Esfandiari, K.; Ashegh, H.; Rezaii, J.; Salimi, J. Firework-related injuries in Tehran’s Persian Wednesday Eve Festival (Chaharshanbe Soori). J. Emerg. Med. 2011, 40, 340–345. [Google Scholar] [CrossRef] [PubMed]
  3. Van Yperen, D.T.; Van Der Vlies, C.H.; De Faber, J.T.H.N.; Penders, C.J.M.; Smit, X.; Van Lieshout, E.M.M.; Verhofstad, M.H.J. Firework injuries in the south-western region of the Netherlands around the turn of the year 2017–2018. Ned. Tijdschr. Voor Geneeskd. 2018, 162, D3310. [Google Scholar]
  4. Puri, V.; Mahendru, S.; Rana, R.; Deshpande, M. Firework injuries: A ten-year study. J. Plast. Reconstr. Aesthet. Surg. 2009, 62, 1103–1111. [Google Scholar] [CrossRef] [PubMed]
  5. Canner, J.K.; Haider, A.H.; Selvarajah, S.; Hui, X.; Wang, H.; Efron, D.T.; Haut, E.R.; Velopulos, C.G.; Schwartz, D.A.; Chi, A.; et al. US emergency department visits for fireworks injuries, 2006–2010. J. Surg. Res. 2014, 190, 305–311. [Google Scholar] [CrossRef] [PubMed]
  6. Chaparro-Narváez, P.; Cotes-Cantillo, K.; Castañeda-Orjuela, C.; De La Hoz-Restrepo, F. Injuries due to fireworks use: A surveillance data analysis in Colombia, 2008–2013. Burns 2017, 43, 149–156. [Google Scholar] [CrossRef] [PubMed]
  7. Moore, J.X.; McGwin, G., Jr.; Griffin, R.L. The epidemiology of firework-related injuries in the United States: 2000–2010. Injury 2014, 45, 1704–1709. [Google Scholar] [CrossRef] [PubMed]
  8. Wang, C.; Zhao, R.; Du, W.L.; Ning, F.G.; Zhang, G.A. Firework injuries at a major trauma and burn center: A five-year prospective study. Burns 2014, 40, 305–310. [Google Scholar] [CrossRef] [PubMed]
  9. Bagri, N.; Saha, A.; Chandelia, S.; Dubey, N.K.; Bhatt, A.; Rai, A.; Bhattacharya, S.; Makhija, L.K. Fireworks injuries in children: A prospective study during the festival of lights. Emerg. Med. Australas. 2013, 25, 452–456. [Google Scholar] [CrossRef] [PubMed]
  10. Sandvall, B.K.; Jacobson, L.; Miller, E.A.; Dodge, R.E., 3rd; Alex Quistberg, D.; Rowhani-Rahbar, A.; Vavilala, M.S.; Friedrich, J.B.; Keys, K.A. Fireworks type, injury pattern, and permanent impairment following severe fireworks-related injuries. Am. J. Emerg. Med. 2017, 35, 1469–1473. [Google Scholar] [CrossRef] [PubMed]
  11. Tu, Y.; Ng, J. Fireworks-Related Deaths, Emergency Department-Treated Injuries, and Enforcement Activities During 2018; Consumer Product Safety Commission: Washington, DC, USA, 2019.
  12. Valkenberg, H.; Nijman, S. Ongevallen Met Vuurwerk—Jaarwisseling 2018–2019; VeiligheidNL: Amsterdam, The Netherlands, 2019. [Google Scholar]
  13. Joustra, T.H.J.; Muller, E.R.; Van Asselt, M.B.A.; Verheij, C.A.J.F. Safety Hazards of the Annual Change of Year; Dutch Safety Board: Den Haag, The Netherlands, 2017.
  14. Hop, M.J.; Wijnen, B.F.; Nieuwenhuis, M.K.; Dokter, J.; Middelkoop, E.; Polinder, S.; van Baar, M.E. Economic burden of burn injuries in the Netherlands: A 3 months follow-up study. Injury 2016, 47, 203–210. [Google Scholar] [CrossRef]
  15. Nizamoglu, M.; Frew, Q.; Tan, A.; Band, H.; Band, B.; Barnes, D.; El-Muttardi, N.; Dziewulski, P. The ten-year experience of firework injuries treated at a uk regional burns & plastic surgery unit. Ann. Burn. Fire Disasters 2018, 31, 13–16. [Google Scholar]
  16. Valkenberg, H.; Nijman, S. Ongevallen Met Vuurwerk—Jaarwisseling 2019–2020; VeiligheidNL: Amsterdam, The Netherlands, 2020. [Google Scholar]
  17. De Faber, J.T.; Kivela, T.T.; Gabel-Pfisterer, A. National studies from the Netherlands and Finland and the impact of regula-tions on incidences of fireworks-related eye injuries. Ophthalmologe 2020, 117, 36–42. [Google Scholar] [CrossRef] [PubMed]
  18. Tian, H.; Wang, L.; Xie, W.; Shen, C.; Guo, G.; Liu, J.; Han, C.; Ren, L.; Liang, Y.; Liu, J.; et al. Epidemiology and outcome analysis of facial burns: A retrospec-tive multicentre study 2011–2015. Burns 2020, 46, 718–726. [Google Scholar] [CrossRef] [PubMed]
  19. Dokter, J.; Vloemans, A.; Beerthuizen, G.; Van Der Vlies, C.; Boxma, H.; Breederveld, R.; Tuinebreijer, W.; Middelkoop, E.; Van Baar, M. Epidemiology and trends in severe burns in the Netherlands. Burns 2014, 40, 1406–1414. [Google Scholar] [CrossRef] [PubMed]
  20. Frimmel, S.; De Faber, J.T.; Wubbels, R.J.; Kniestedt, C.; Paridaens, D. Type, severity, management and outcome of ocular and adnexal firework-related injuries: The Rotterdam experience. Acta Ophthalmol. 2018, 96, 607–615. [Google Scholar] [CrossRef] [PubMed] [Green Version]
  21. Sandvall, B.K.; Keys, K.A.; Friedrich, J.B. Severe Hand Injuries From Fireworks: Injury Patterns, Outcomes, and Fireworks Types. J. Hand Surg. 2017, 42, 385.e1–385.e8. [Google Scholar] [CrossRef] [PubMed]
  22. Hakkaart-van Roijen, L.; Van der Linden, N.; Bouwmans, C.; Kanters, T.; Tan, S.S. Costing Manual: Methodology of Costing Research and Reference Prices for Economic Evaluations in Healthcare; In Dutch: Kostenhandleiding: Methodologie van kostenonderzoek en referentieprijzen voor economische evaluaties in de gezondheidszorg; Zorginstituut Nederland: Diemen, The Netherlands, 2016.
  23. Hop, M.; Langenberg, L.; Hiddingh, J.; Stekelenburg, C.; Van Der Wal, M.; Hoogewerf, C.; Van Koppen, M.; Polinder, S.; Van Zuijlen, P.; Van Baar, M.; et al. Reconstructive surgery after burns: A 10-year follow-up study. Burns 2014, 40, 1544–1551. [Google Scholar] [CrossRef] [PubMed]
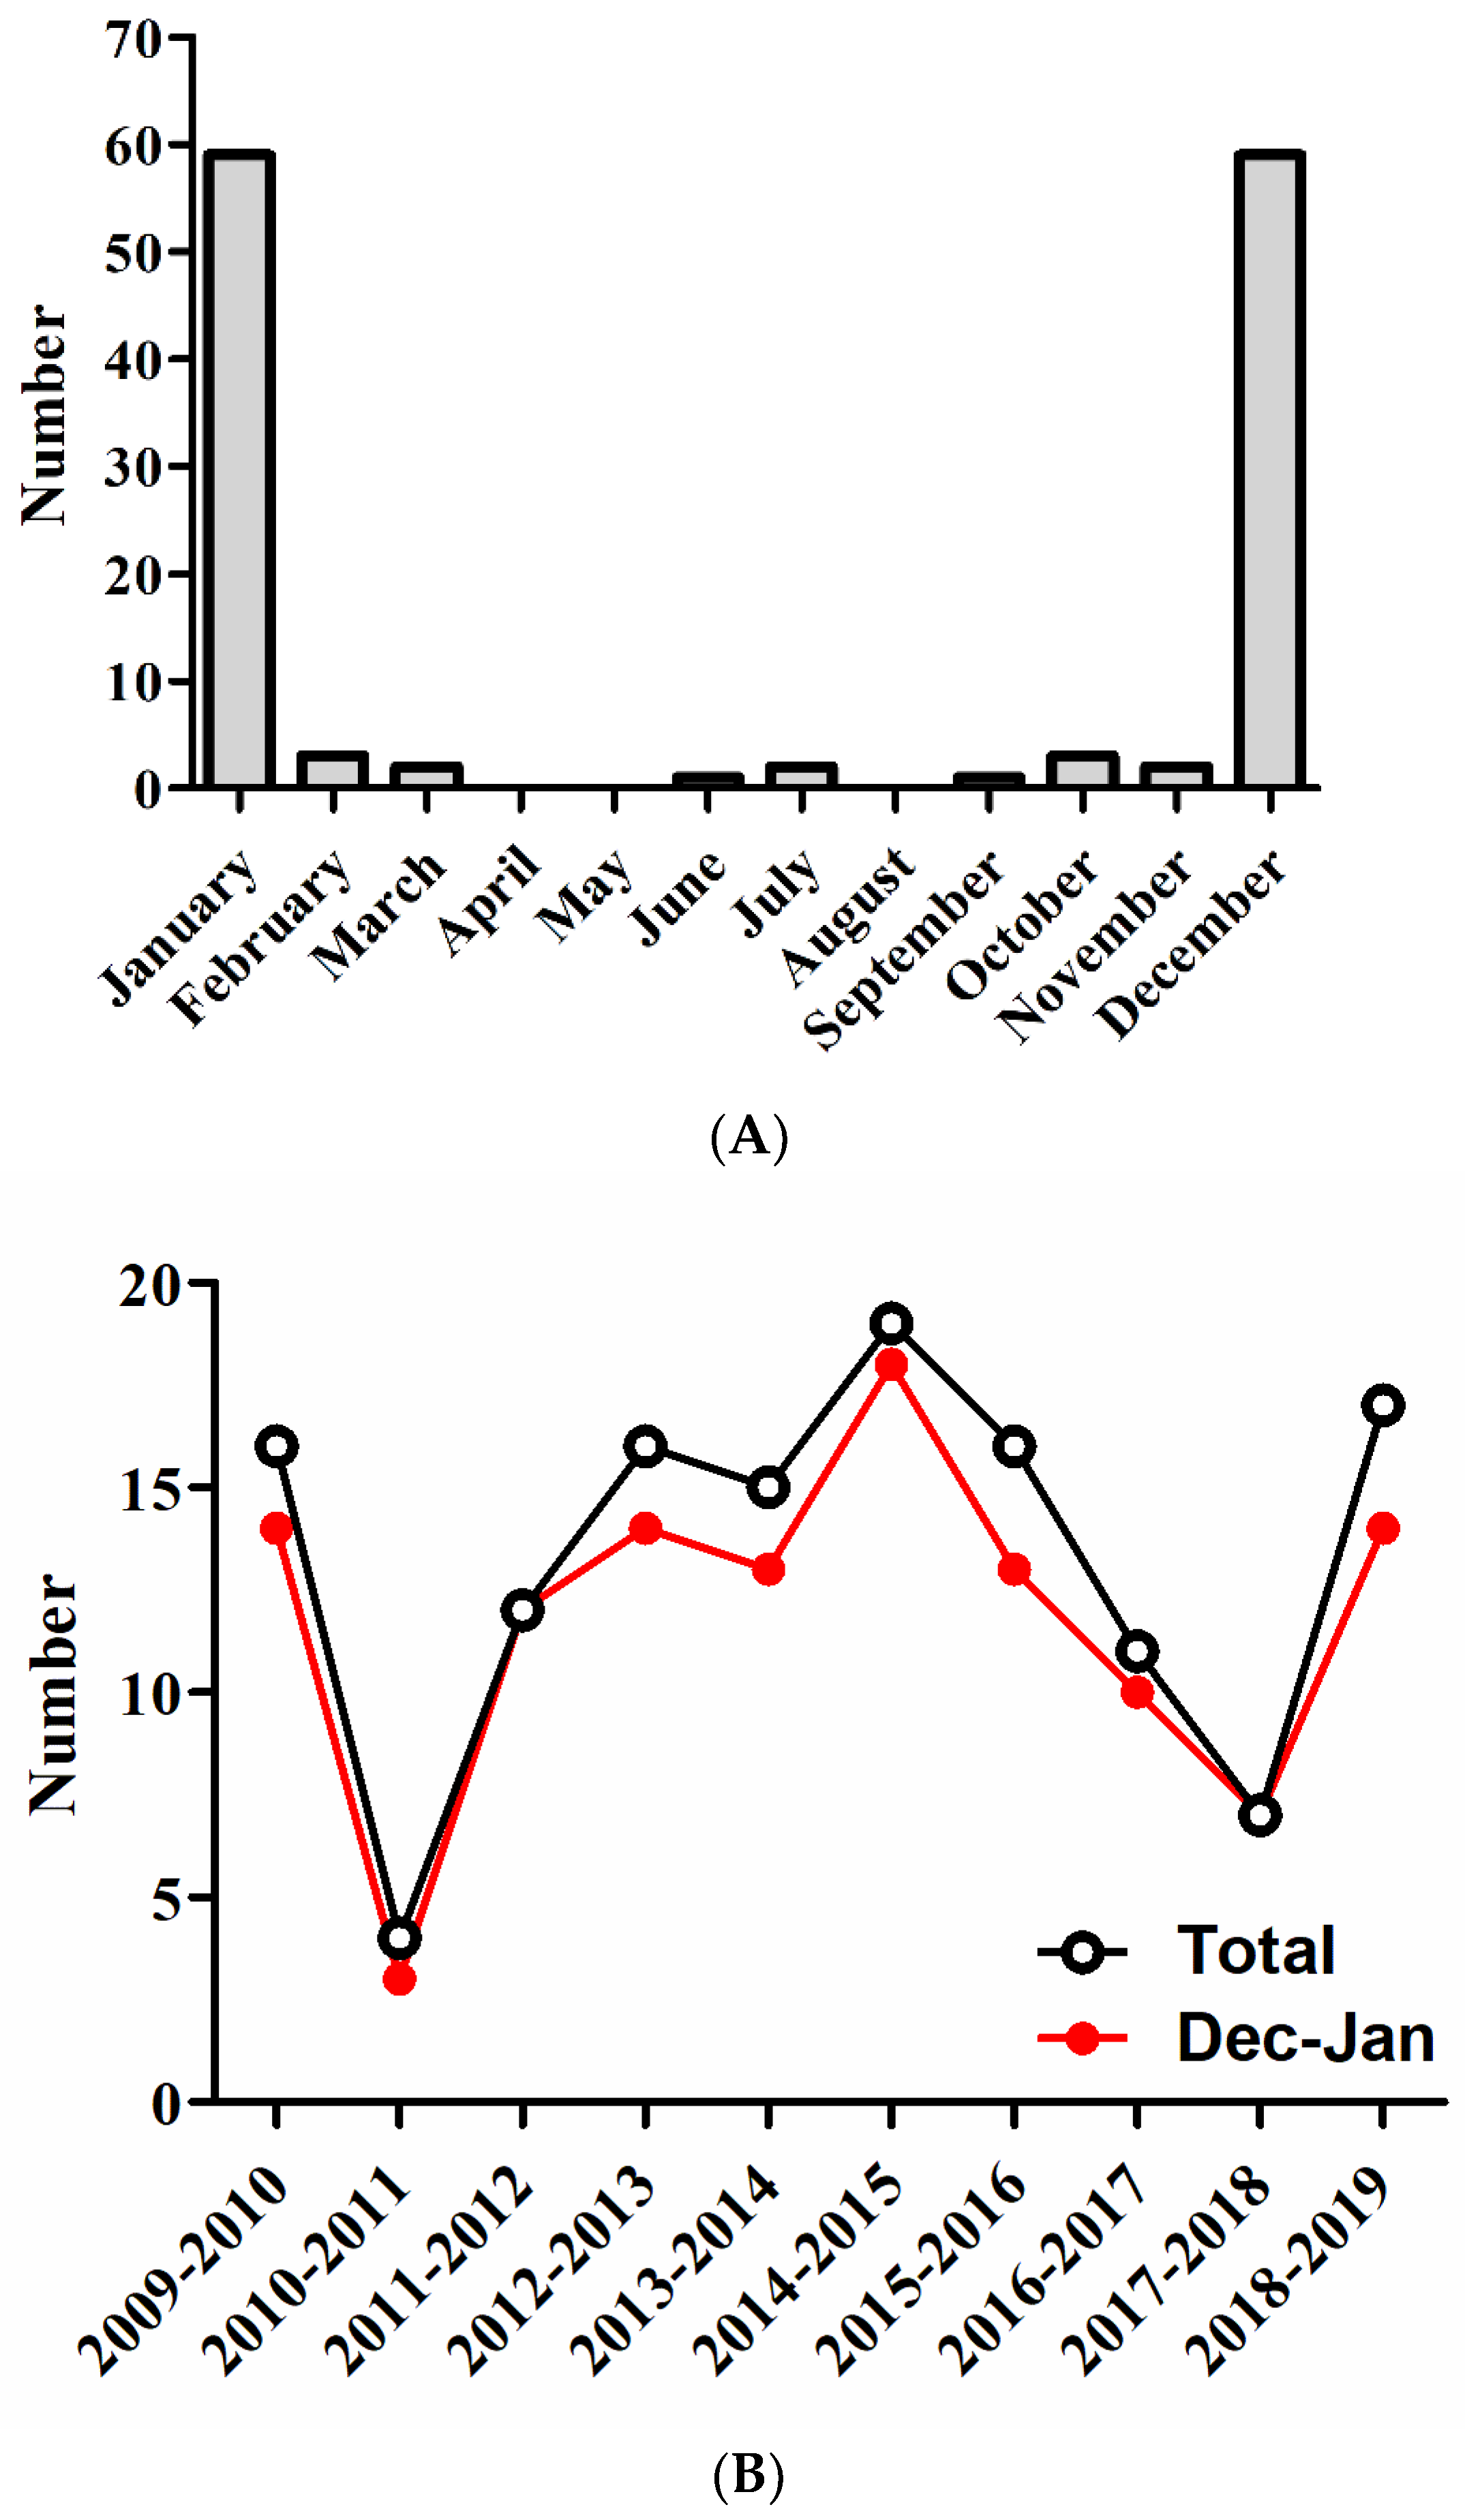
Figure 1. (A) The monthly number of admissions. (B) The annual number of burn center admissions overall (black line) and for the months of December and January (red line).
Ebj 02 00003 g001
Figure 2. Body region affected.
Ebj 02 00003 g002
Table 1. Patient characteristics.
All (N = 133)
Age (year)15 (11–25)
0–45 (4)
5–918 (14)
10–1439 (29)
15–1920 (15)
20–2927 (20)
30–397 (5)
40–499 (7)
50–596 (5)
≥602 (2)
Male103 (77)
TBSA (%)1.0 (0.5–2.5)
≥15% TBSA2 (2)
Partial thickness100 (75)
Full thickness45 (34)
Additional injury23 (17)
Soft tissue damage11 (48)
Eye injury10 (43)
Fractures5 (22)
Subcutaneous emphysema1 (4)
Data are presented as median (P25–P75) or N (%). TBSA, total body surface area.
Table 2. Treatment characteristics.
All (N = 133)
Length of stay (days)1 (0–5)
ICU admission needed13 (10)
Duration (days)2 (2–5)
Surgical treatment for wound closure66 (50)
Mechanical ventilation9 (7)
Type of surgery performed in acute phase
Wound excision & primary closure12 (18)
Split skin graft54 (82)
Meek wall1 (2)
Full thickness graft1 (2)
Dermal substitute (Integra©)1 (2)
Vacuum Assisted Closure system2 (3)
Amputation2 (3)
Reconstructive surgery4 (3)
Day care treatment a47 (35)
Discharged home130 (98)
Re-admitted16 (12)
Data are presented as median (P25–P75) or N (%). ICU, intensive care unit. a Day care, patients who were admitted and discharged on the same day.
Table 3. Reconstructive surgery details.
PatientAge Category (Years)TBSA on Injury (%)Time to Reconstruction (Months)IndicationTechnique
115–190.514ContracturesRelease and random flap
230–346.010Wound problems and contracturesExcision and split skin graft
230–346.019Wound problemsExcision and primary closure
315–190.55Webspace contractureExcision and random flap
425–2940.018ContracturesExcision and full thickness graft
Table 4. Mean direct medical costs per patient in specialized burn care.
Cost CategoryDirect Medical Costs per Patient (in €)
Transportation430 (290 to 580)
Non-ICU burn center days4160 (2830 to 5480)
ICU burn center days1810 (0 to 3620)
Day care150 (110 to 190)
Surgical treatment1410 (950 to 1870)
Reconstructive surgery50 (0 to 100)
Total costs8000 (5160 to 10,850)
Estimated extra costs *1040 (670 to 1410)
Total costs entire population9040 (5840 to 12,260)
Total costs patients treated in day care only975 (765 to 1185)
Total costs patients admitted but not operated5060 (3715 to 6400)
Total costs patients admitted and operated13,834 (7600 to 20,070)
Costs are presented as mean costs per patient with 95% confidence interval between brackets. Costs were calculated for all 133 patients combined, except for the three subgroups mentioned at the three bottom rows. * 13% of the total costs were estimated as costs for diagnostic procedures, other treatment, clinical consultations, and outpatient burn care, based on patients with total body surface area burned between 0 and 5% [14]. These extra costs were added to the total costs to estimate the total costs for specialized burn care.
Table 5. Sources and unit prices of health care use.
Cost CategoriesUnitSource of Unit Prices (Cost Year)Unit Price (in €)
Transportation
Own transportRideHop et al. 2016 (2012)Upon request
AmbulanceRideNZa a (2018)702.00
Mobile Intensive Care UnitRideNZa a (2018)2321.95
HEMS-assistanceYesHospital data calculation (2008)Upon request
Burn center stay
ICU burn center daysDaysHop et al. 2016 (2012)948.12
Non-ICU burn center daysDaysHop et al. 2016 (2012)2965.71
Day careDaysHop et al. 2016 (2012)350.80
Surgery
Surgical treatmentOperationHop et al. 2016 (2012)1966.47
Reconstructive surgeryOperationHop et al. 2014 (2011)Upon request
Reference unit prices are adjusted for the corresponding year of admission using the national consumer price index. DBR R3, Dutch Burn Repository R3. a NZa, Nederlandse Zorgautoriteit (in English: Dutch Healthcare Authority): Standard cost prices, available online at: https://puc.overheid.nl/nza/doc/PUC_6237_22/ (accessed on 23 September 2019). b HEMS, Helicopter Emergency Medical Service: based on hospital costs for 2003–2006.
Publisher’s Note: MDPI stays neutral with regard to jurisdictional claims in published maps and institutional affiliations.