Article

Tidal-Phase Discharge Strategy Significantly Enhances Sewage Dilution Trapped in Deep Tidal Passages

1
Ecological Environment Monitoring and Scientific Research Center, Taihu Basin & East China Sea Ecological Environment Supervision and Administration Bureau, Ministry of Ecology and Environment, Shanghai 200125, China
2
College of Oceanography and Ecological Science, Shanghai Ocean University, Shanghai 201306, China
3
Ecological and Environmental Science and Research Institute of Zhejiang Province, Hangzhou 310007, China
4
Zhejiang Marine Ecology and Environment Monitoring Center, Zhoushan 316004, China
*
Author to whom correspondence should be addressed.
Oceans 2025, 6(4), 73; https://doi.org/10.3390/oceans6040073
Submission received: 11 September 2025 / Revised: 22 October 2025 / Accepted: 31 October 2025 / Published: 6 November 2025

Abstract

Tidal dynamics substantially govern nearshore circulation patterns. The discharge of sewage at different tidal stages may have a significant impact on the dilution of pollutants. However, discussions on tidal phase sewage discharge strategy are still rare. This study focuses on the narrow tidal passage in the Ningbo-Zhoushan sea area, which receives a large amount of coastal wastewater, but the role of the unique hydrodynamic processes in the dilution of pollutants in this region remains unclear. By using a combination of on-site measurements and the FVCOM-dye simulation method, the scenario of high-concentration sewage retention in the tidal passage was demonstrated. The coastal residual circulation formed by strong tidal currents confined over 78% of the tracers within a 3 km range near the shore, and a subsurface dye accumulation zone emerged along the 25–50 m isobaths. Monsoon transitions regulated pollution plumes, inducing 5–8% seasonal variability in pollution footprints controlled by wind-tide-stratification interplay. The tidal phase discharge strategy was revealed to be highly effective in this study; both submerged discharge in deep-water zones and intermittent discharge strategies implemented in shallow-water zones significantly reduce the spatial coverage of high-concentration sewage plumes. Our findings highlight the importance of formulating discharge strategies based on tidal phases in typical narrow and deep tidal passages.

1. Introduction

The southern sector of Hangzhou Bay, situated between Ningbo City and Zhoushan City, features a natural deep-water passage extending eastward into the East China Sea (Figure 1a). This strategic coastal zone serves as a hub for heavy industries, including petroleum refining, shipbuilding, chemical manufacturing, and textile dyeing. Adjacent to this narrow passage, over a dozen major port facilities collectively form the Ningbo-Zhoushan Port Complex, which attained global prominence by handling 24.61 million twenty-foot equivalent units (TEUs) of container throughput in 2017, ranking as the world’s third-largest container port during that period [1].
However, rapid industrialization and urban expansion since the early 21st century have introduced significant environmental challenges. The coastal zones of Zhenhai and Beilun Districts in Ningbo Municipality, constituting the core industrial belt, account for 80% of the city’s industrial discharge outlets. This concentration of anthropogenic pressures—combining intensive urbanization, high population density, and industrial discharge demands—has created systemic stress on the regional marine ecosystem. Every year, approximately 785 million tons of wastewater are discharged into the sea, comprising over 632 million tons of municipal wastewater and more than 151 million tons of industrial effluent [2]. Coastal regions serve as primary discharge pathways for wastewater disposal, introducing complex mixtures of carbon, nitrogen, phosphorus, and other chemical constituents into marine ecosystems [3]. When oceanic systems lack sufficient capacity to dilute and assimilate these pollutants, eutrophication and pathogenic bacterial proliferation ensue, emerging as critical determinants of compromised nearshore water quality and public health risks [4].
To evaluate and mitigate the pressure exerted by sewage discharge activities on coastal ecosystems, integrated methodologies combining in situ monitoring and numerical modeling have emerged as critical tools for environmental management [5,6]. Designing a marine outfall to utilize the natural dilution effect for treating wastewater has been proven to be a cost-effective and reliable strategy. Historically, hydrodynamic models incorporating conservative tracer releases have been widely employed to quantify wastewater transport and dispersion dynamics under varying hydrodynamic regimes [7,8]. Recent advancements in three-dimensional numerical simulations have significantly enhanced the resolution of environmental impact analyses, enabling detailed characterization of pollutant dispersion patterns and comparative evaluation of diverse discharge strategies [9,10]. Some reports have pointed out the situation where sewage accumulates in the deep water column and emphasized the risk of sewage pollution to the bottom sediments [11]. For example, the simulation results of pollutants spreading from a sewage outfall in the Rijeka Bay have shown that the sewage plume stays at a depth of 10 to 20 m [12]. Stark et al. [13] investigated the dilution and dispersal of macerated wastewater around Australia’s Davis Station in East Antarctica, revealing that the high bacterial concentration of sewage was likely to be constrained in a narrow plume very close to the coast, which was an environmental risk to local wildlife.
Furthermore, many studies have explored optimizing the spatial distribution of discharge outfalls and regulating effluent discharge scales as viable strategies for mitigating contamination risks [14,15]. In addressing microbial hazards associated with Escherichia coli and pathogenic organisms in recreational coastal zones, Kim et al. [16] advocated for implementing an offshore extended submerged discharge methodology to minimize beach exposure risks. Taking into account the ecological impact of sewage discharge outfalls on sensitive areas of the marine ecosystem, Wang et al. [17] conducted a case study to assess the rationality of each discharge outfall’s layout and optimized the discharge scale.
However, the re-planning and renovation of existing discharge outfalls is practically challenging. It often encounters financial constraints and the opinions of multiple departments from different regions. Besides, significant limitations also persist in contemporary nearshore pollution modeling. While the substantial regulatory effects of tidal dynamics on effluent dispersion patterns have been extensively recognized [18], discussions regarding the pollutant retention mechanism under specific tidal stages and discharge operational parameters are still rare. The actual process of pollutant discharge—particularly spatiotemporal discharge fluctuations and wastewater concentration—is routinely excluded from analytical frameworks. There is currently some confusion about what measures exist in relation to tidal phase sewage discharge and what are acceptable practices. Therefore, the quantification of the implementation outcomes of pollution discharge strategies and environmental dilution characteristics for specific regions is necessary [19,20,21].
This study focuses on the hydro-environmental dynamics of the constricted tidal passages within the Ningbo-Zhoushan coastal complex. The narrow tidal passage, characterized by its long and constricted geometry, causes water to move back and forth during flood and ebb tides within a tidal cycle. Releasing pollutants at different stages of the tide may have a significant impact on pollutant dilution. The special deep-trough bathymetry of the tidal passage and the typical seasonal wind fields in this area may also modulate the dilution of pollutants. However, the roles of these important processes in pollutant dilution remain unclear. Through integration of field monitoring data and FVCOM (Finite-Volume Community Ocean Model) high-resolution numerical simulations, this study investigated the hydrodynamic transport processes of regional pollutant discharge. The advection-diffusion dynamics and sewage retention mechanisms characteristic of this passage environment were analyzed. Based on the scenario-driven simulation of actual discharge patterns, an optimized discharge plan was proposed that matches the discharge stage with the tidal flushing cycle.

2. Materials and Methods

2.1. Study Area and Field Survey

The study area is situated along China’s eastern coastline (121.5–122.5° E, 29.7–30.3° N), featuring a narrow tidal strait with a width ranging from 5 to 8 km and a pronounced bathymetric gradient culminating in a maximum depth of 112 m (Figure 1a). This longitudinally extended submarine trough (~60 km) exerts significant hydrodynamic control, interacting with the densely distributed peripheral islands and reefs that enforce a semi-diurnal tidal regime. Tidal currents in this region are dominated by a reciprocating flow pattern, characterized by westward flood currents (2–3 knots) and eastward ebb currents of comparable velocity magnitude. During spring tides, peak current velocities can intensify to 6–7 knots.
An investigation of coastal discharge outfalls in Zhenhai and Beilun Districts (Ningbo, China) was conducted during summer 2023, with specific emphasis on total nitrogen (TN) quantification. The monitoring protocol was structured into two components: (a) comprehensive outlet inspections documenting effluent characteristics from municipal wastewater treatment plants and industrial discharge facilities; and (b) spatial analysis of marine pollutant concentrations through seawater sampling. To characterize marine TN distribution patterns, triplicate sampling transects (T1–T3, Figure 1b) were established perpendicular to the coastline. Each transect incorporated three stratified sampling stations extending from the supralittoral zone (0–1 km offshore) to mid-shelf waters (3 km offshore).

2.2. Hydrodynamic Model

The numerical experiments were based on the Finite-Volume Community Ocean Model (FVCOM). FVCOM is a prognostic, unstructured-grid, Finite-Volume, free-surface, three-dimensional (3-D) primitive equations Community Ocean Model, which was originally developed by Chen et al. [22,23] and has been continuously improved and updated by the joint research team of the University of Massachusetts Dartmouth and Woods Hole Oceanographic Institution [23].
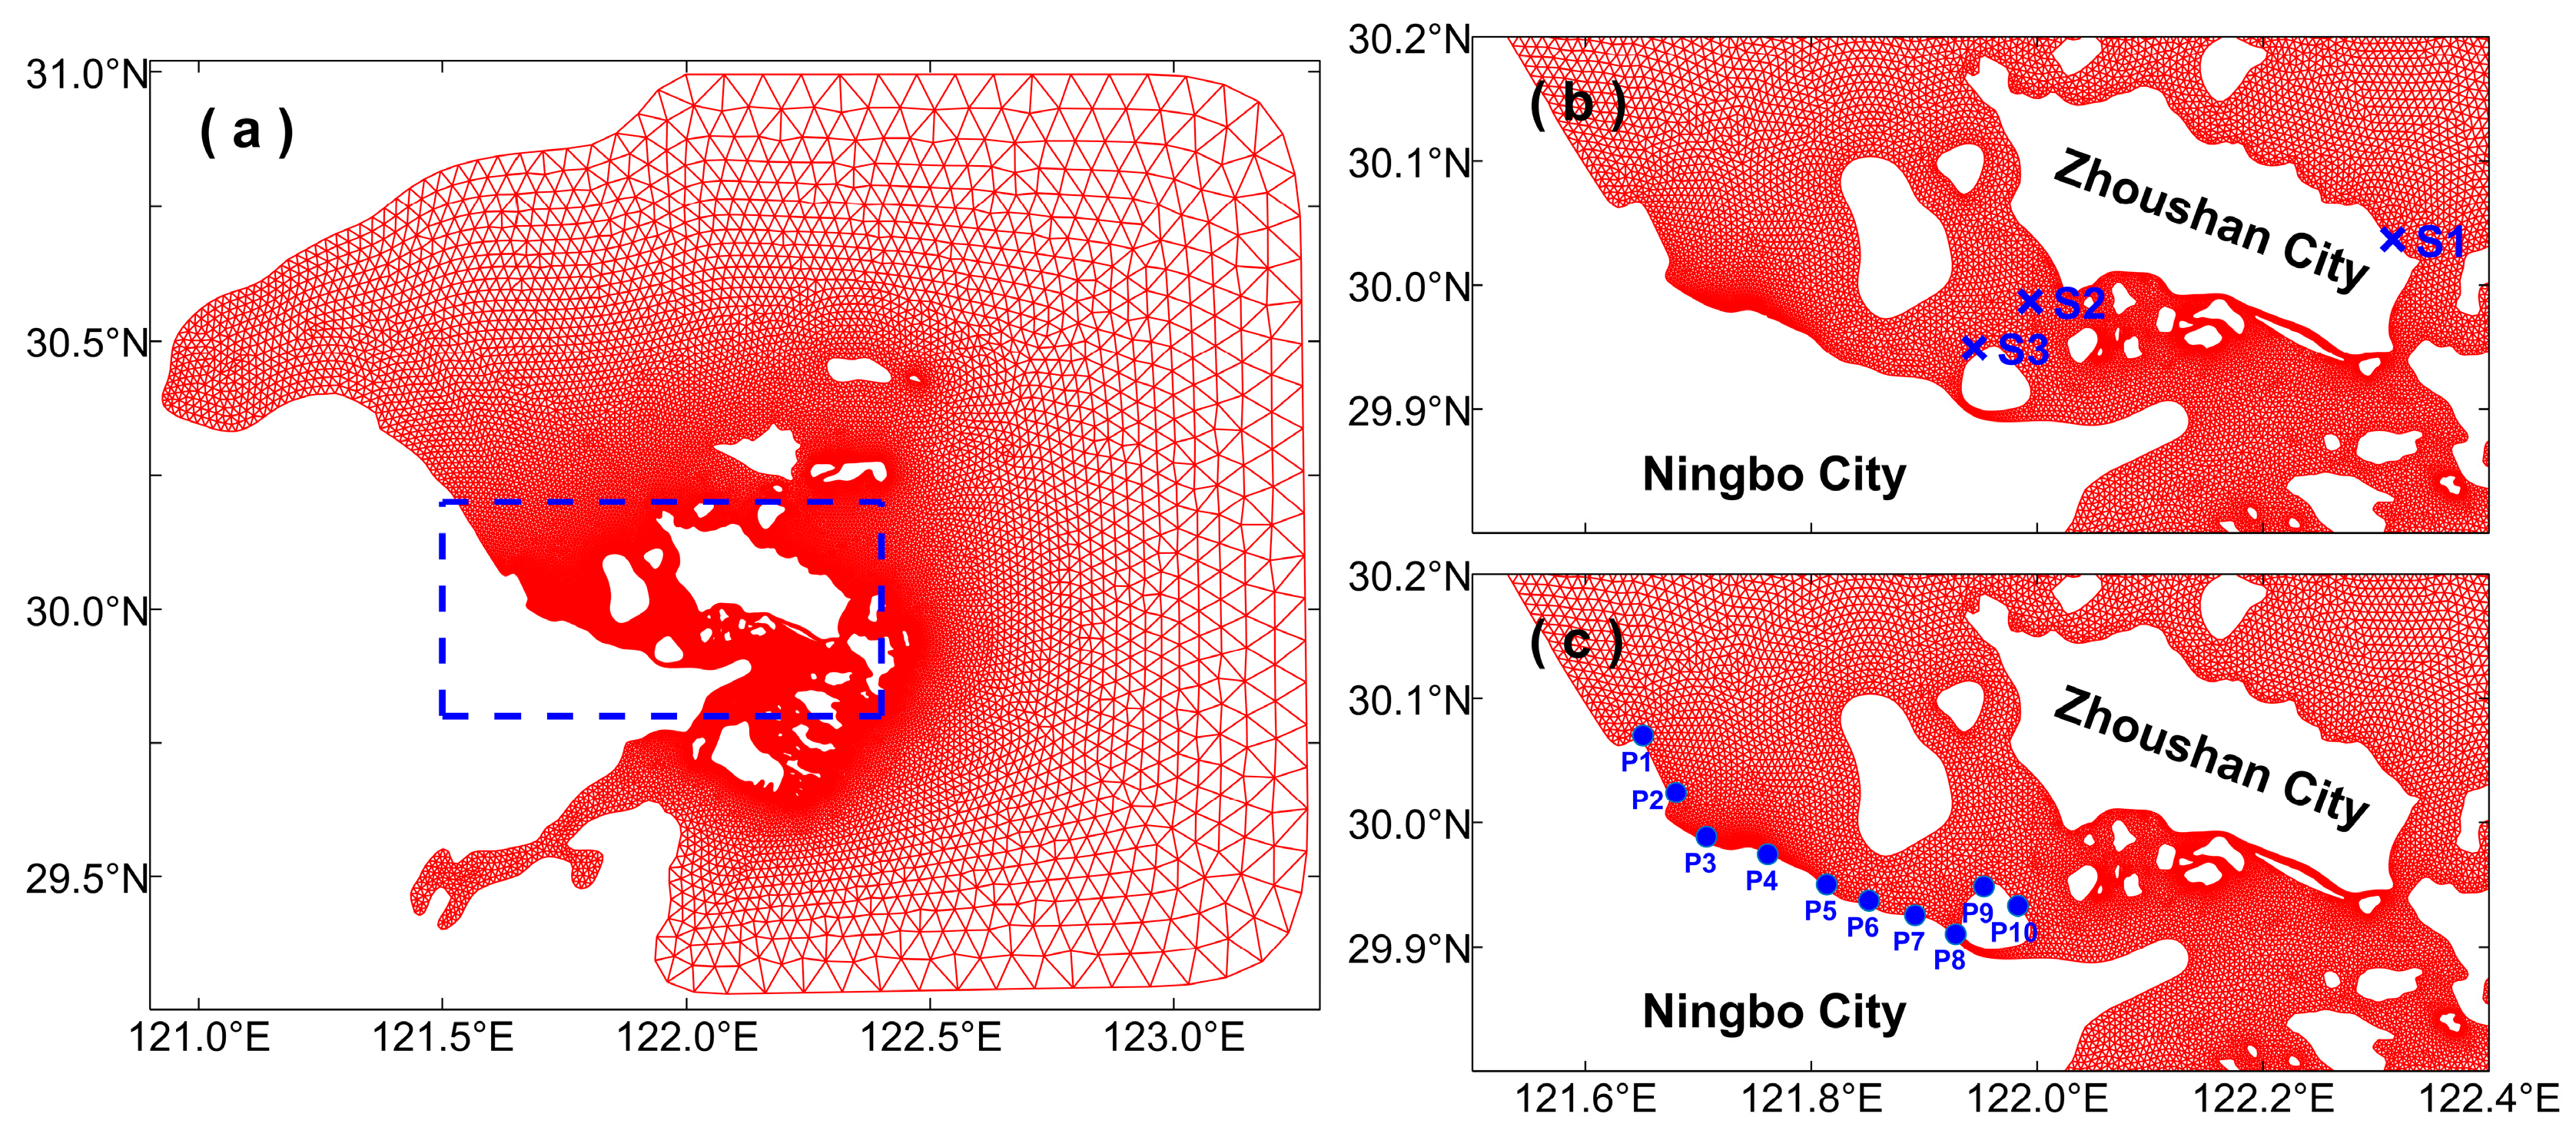
The hydrodynamic numerical model of the Ningbo-Zhoushan sea area was established using unstructured grids (Figure 2a). The model had a domain covering the narrow tidal passages and the island group. Horizontally, the model had a grid size varying from 30 to 100 m within the Ningbo-Zhoushan sea area, 100–500 m in the adjacent area, and 500 m near-shore to 10 km at the most eastern open boundary. Vertically, a total of 30 layers were used in the terrain-following σ-coordinate. The time integration of the model used the split-mode time stepping method with a 6 s external time step and a split number of 3. The wet/dry treatment was turned on because part of the intertidal zones had a bottom depth above the mean sea level. The vertical eddy viscosity and horizontal diffusion coefficients used in the model were calculated using the MY-2.5 [24] and Smagorinsky [25] turbulent closure schemes, respectively.

2.2.1. Input Data for Modeling

Based on the tidal and wind forcing, the FVCOM model adopted a cold-start approach, with the period covered from 1 January to 31 December 2022 (UTC). The tidal forcing at the open boundary was specified using 1/30° TPXO9-atlas model-predicted real-time sea surface heights. TPXO is a series of fully-global models of ocean barotropic tides [26,27], and TPXO9-atlas is obtained by combining a 1/6° base global solution and 1/30° resolution local patches for all coastal areas. Oregon State University has provided the link for this model “https://www.tpxo.net/global (accessed on 11 May 2023)”. The atmospheric forcing at the surface was 10 m u and v components of wind from ERA5 monthly averaged reanalysis data. The temporal and horizontal resolution of the dataset was 1 h and 1/4°, respectively. ERA5 is the fifth generation of atmospheric reanalysis for the global climate and weather from ECMWF (European Centre for Medium-Range Weather Forecasts) [28], and is produced using 4D-Var data assimilation and model forecasts of the ECMWF Integrated Forecast System “https://cds.climate.copernicus.eu/ (accessed on 10 April 2024)”. In addition, to simulate the tidal circulation accurately in the island group and passages, high-resolution bathymetric data are required, particularly in the tidal flats area. The hydrodynamic model used the bathymetric data obtained from SRTM15+ [29], and was further improved by incorporating the latest published sea chart data.

2.2.2. Skill Assessment and Validation

The model was validated using measured hydrodynamic data, including long-term tidal level data with a recording duration of one month at S1 (Figure 1b), as well as tidal current data recorded during spring and neap tides at two sites (S2 and S3, Figure 1b). The period for the tide level data was from 18 April to 18 May 2022, and the tidal current data at the two sites, S2 and S3, were observed simultaneously, including during the spring tide period (11–12 April 2022) and the neap tide period (16–17 April 2022). After the simulation results were linearly interpolated onto the sampling time points on the time axis, the model simulation results were evaluated using the efficiency factor, skill values d proposed by Willmott [30], as follows:
d = 1 i = 1 N ( P i O i ) 2 i = 1 N ( P i O ¯ + O i O ¯ ) 2
where O i is the observed ith value; P i is the predicted ith value; O ¯ is the observed mean; and N is the total number of observation points. The agreement index d has an advantage in including the information of both the Correlation Coefficient (CC) and the Root Mean Square Error (RMSE), with the value ranging from no agreement (i.e., 0) to complete agreement (i.e., 1). Usually, when the d is greater than 0.65, the prediction results are excellent; when the d is between 0.5 and 0.65, the prediction results are very good.

2.3. The Dye-Tracking Module

The dye-tracking module incorporated in FVCOM was developed for the US GLOBal ECosystem (GLOBEC) Northwest Atlantic/Georges Bank (GB) Program Cross-frontal Exchange Processes Study. A model-dye comparison experiment was conducted to examine the module’s ability to simulate the observed dye characteristics [31]. Hu et al. [32] applied it to the research of nutrient transport on GB, and subsequently supplemented the second-order accuracy multi-dimensional positive definite algorithm and flux control algorithm [33]. The module has been utilized in many geographic areas for further research [34,35,36,37,38], including the assessment of runoff input, water exchange capacity and sewage planning, etc. The model dye was tracked by a tracer equation defined as
D C t + D u C x + D v C y + ω C σ 1 D σ K h C σ D F c = D C O ( x , y , σ , t )
where C is the model dye concentration; D is the total water depth; u, v, and ω are the x, y and σ components of water velocity; K h is the vertical thermal diffusion coefficient; F c is the horizontal diffusion term, and C O is the concentration injected from a source point.
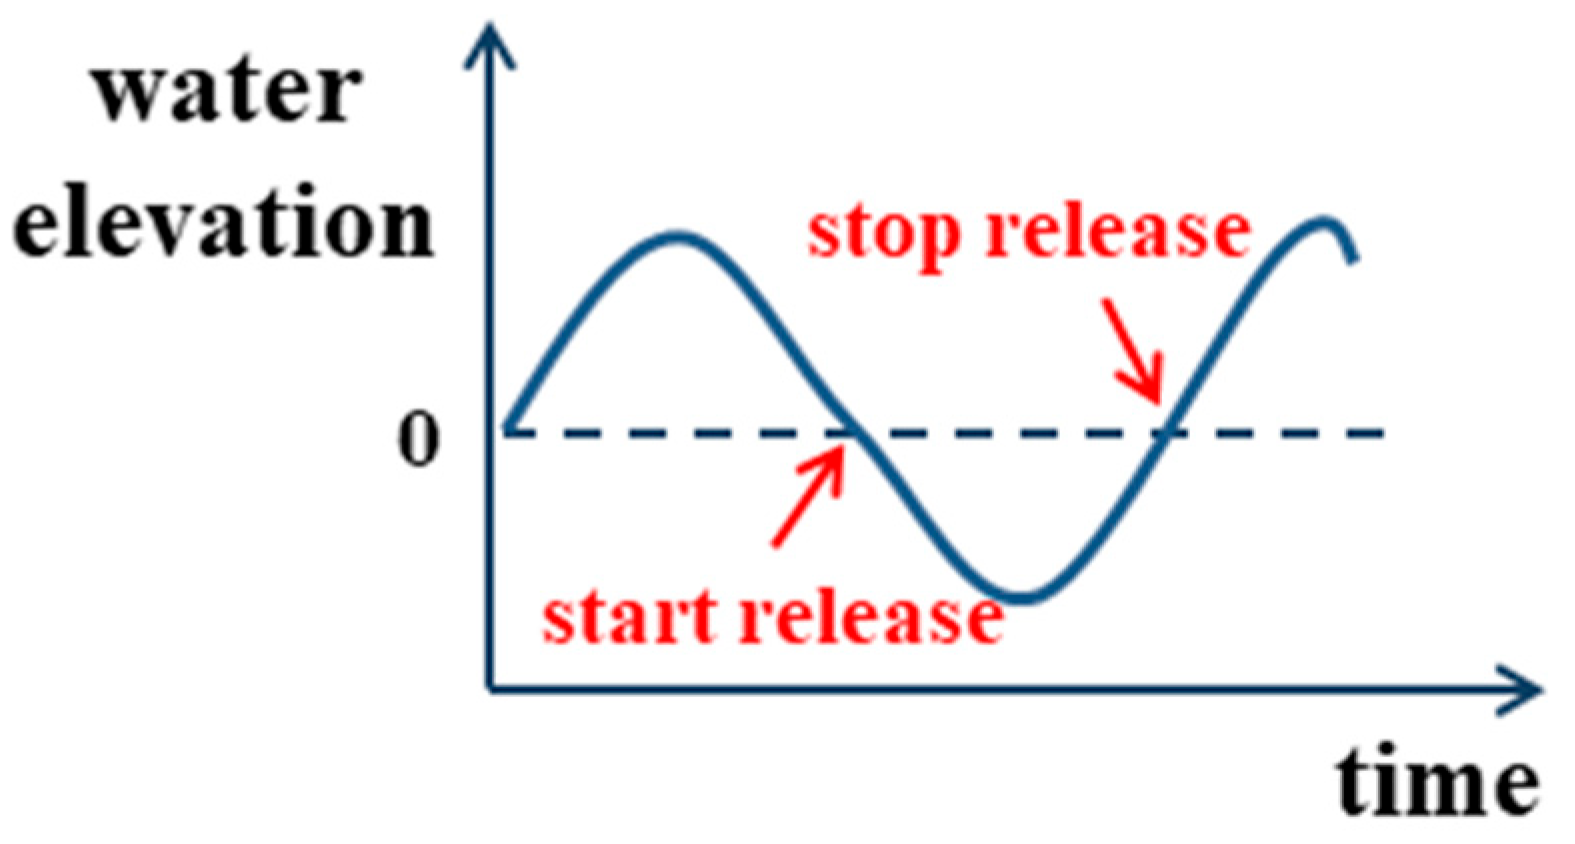
The experimental framework of this study was established utilizing the dye tracer module. The tracer was used to delineate the directional movement of the pollutant-laden aqueous medium. The local discharge characteristics of sewage outfalls in the study area were taken into consideration, with multiple discharge strategies implemented in the numerical simulations, categorized as: (a) temporal modes: continuous discharge versus intermittent discharge (operational exclusively during low-tide phases); and (b) spatial configurations: surface discharge versus submerged discharge. The requirement of the low-tide discharge strategy was to position the sewage outfall at a location below the low-tide line, with pollutants being discharged only during low tide (Figure 3).

2.4. Experimental Design

For this study, ten pollution source points (P1–P10 in Figure 2c) were defined within the numerical model, with initial concentrations standardized at 10 mg∙L−1 to approximate the mean TN level observed in wastewater sampling. Stations P1–P5 are situated within shallow shoal complexes and intertidal habitats, while stations P6–P10 occupy bathymetrically distinct positions along the edge of the continental slope. Different experimental scenarios were designed to quantify pollutant dispersion impacts and investigate the interplay of hydrodynamic processes and discharge strategies (Table 1).
To enhance visualization of wastewater retention characteristics, discharge zones were strategically allocated to three vertical layers: surface, mid-depth, and benthic strata. In Experiments 4 and 5, vertical σ-coordinate adjustments were implemented across distinct discharge configurations to maintain flux equivalence.

3. Results

3.1. Field Survey

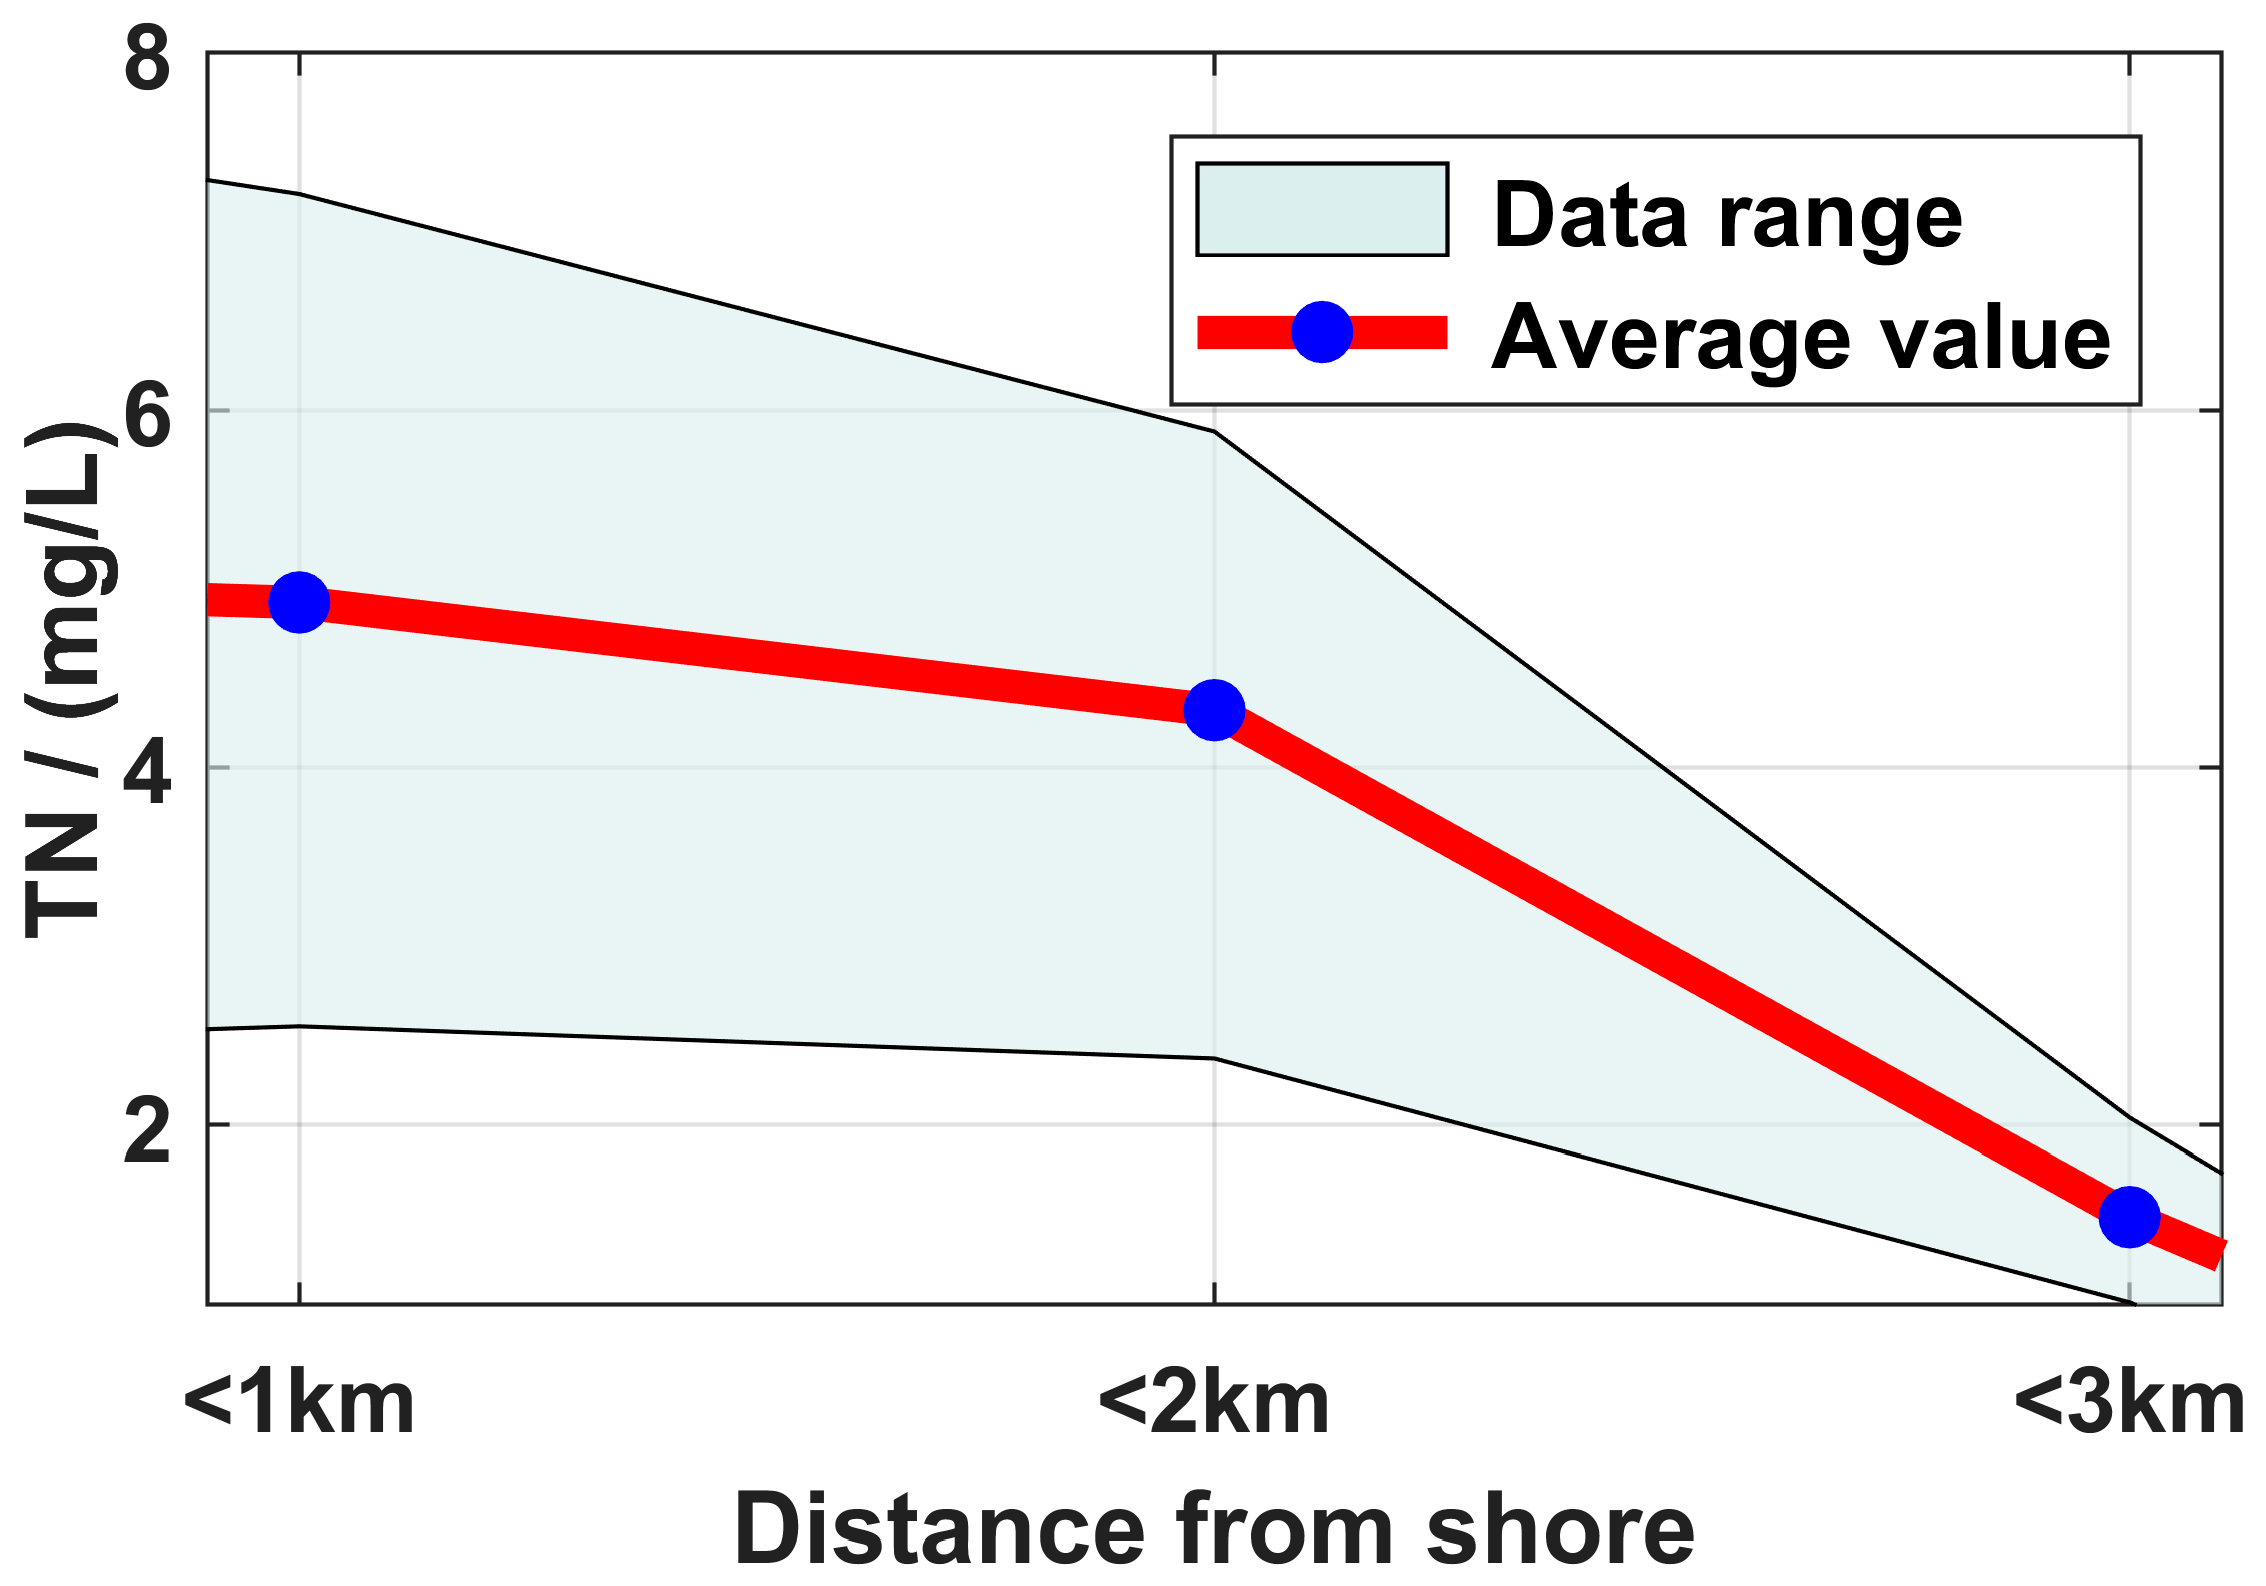
Field investigations revealed four municipal wastewater treatment plants and 97 industrial effluent discharge points actively releasing effluents during the study period. Effluent analyses demonstrated substantial TN variation, with peak concentrations reaching 27 mg∙L−1 and a weighted mean concentration of 10 mg∙L−1. The offshore analysis of TN in seawater revealed obvious spatial differences (Figure 4), with nearshore stations (≤1 km offshore) maintaining maximum TN concentrations exceeding 7 mg∙L−1. Notably, mid-transect stations (2–3 km offshore) exhibited marked attenuation, culminating in baseline concentrations at terminal stations (3 km offshore) averaging 1.13 mg∙L−1. This dataset conclusively demonstrates a pronounced coastward accumulation gradient with exponential seaward attenuation of nitrogenous compounds.

3.2. Model Validation

This study validated both the tidal level and velocity measurements (Figure 5). The validation results at S1 showed an excellent match between model results and observations, with the d for the entire period reaching 0.94. During the neap tide period, the d value for tidal current ranged from 0.63 (S2) to 0.84 (S3). During the spring tide period, the d value for tidal current ranged from 0.88 (S2) to 0.91 (S3). These excellent results indicated that the simulation of the hydrodynamic process had high accuracy in this study.

3.3. Sewage Retention Effect

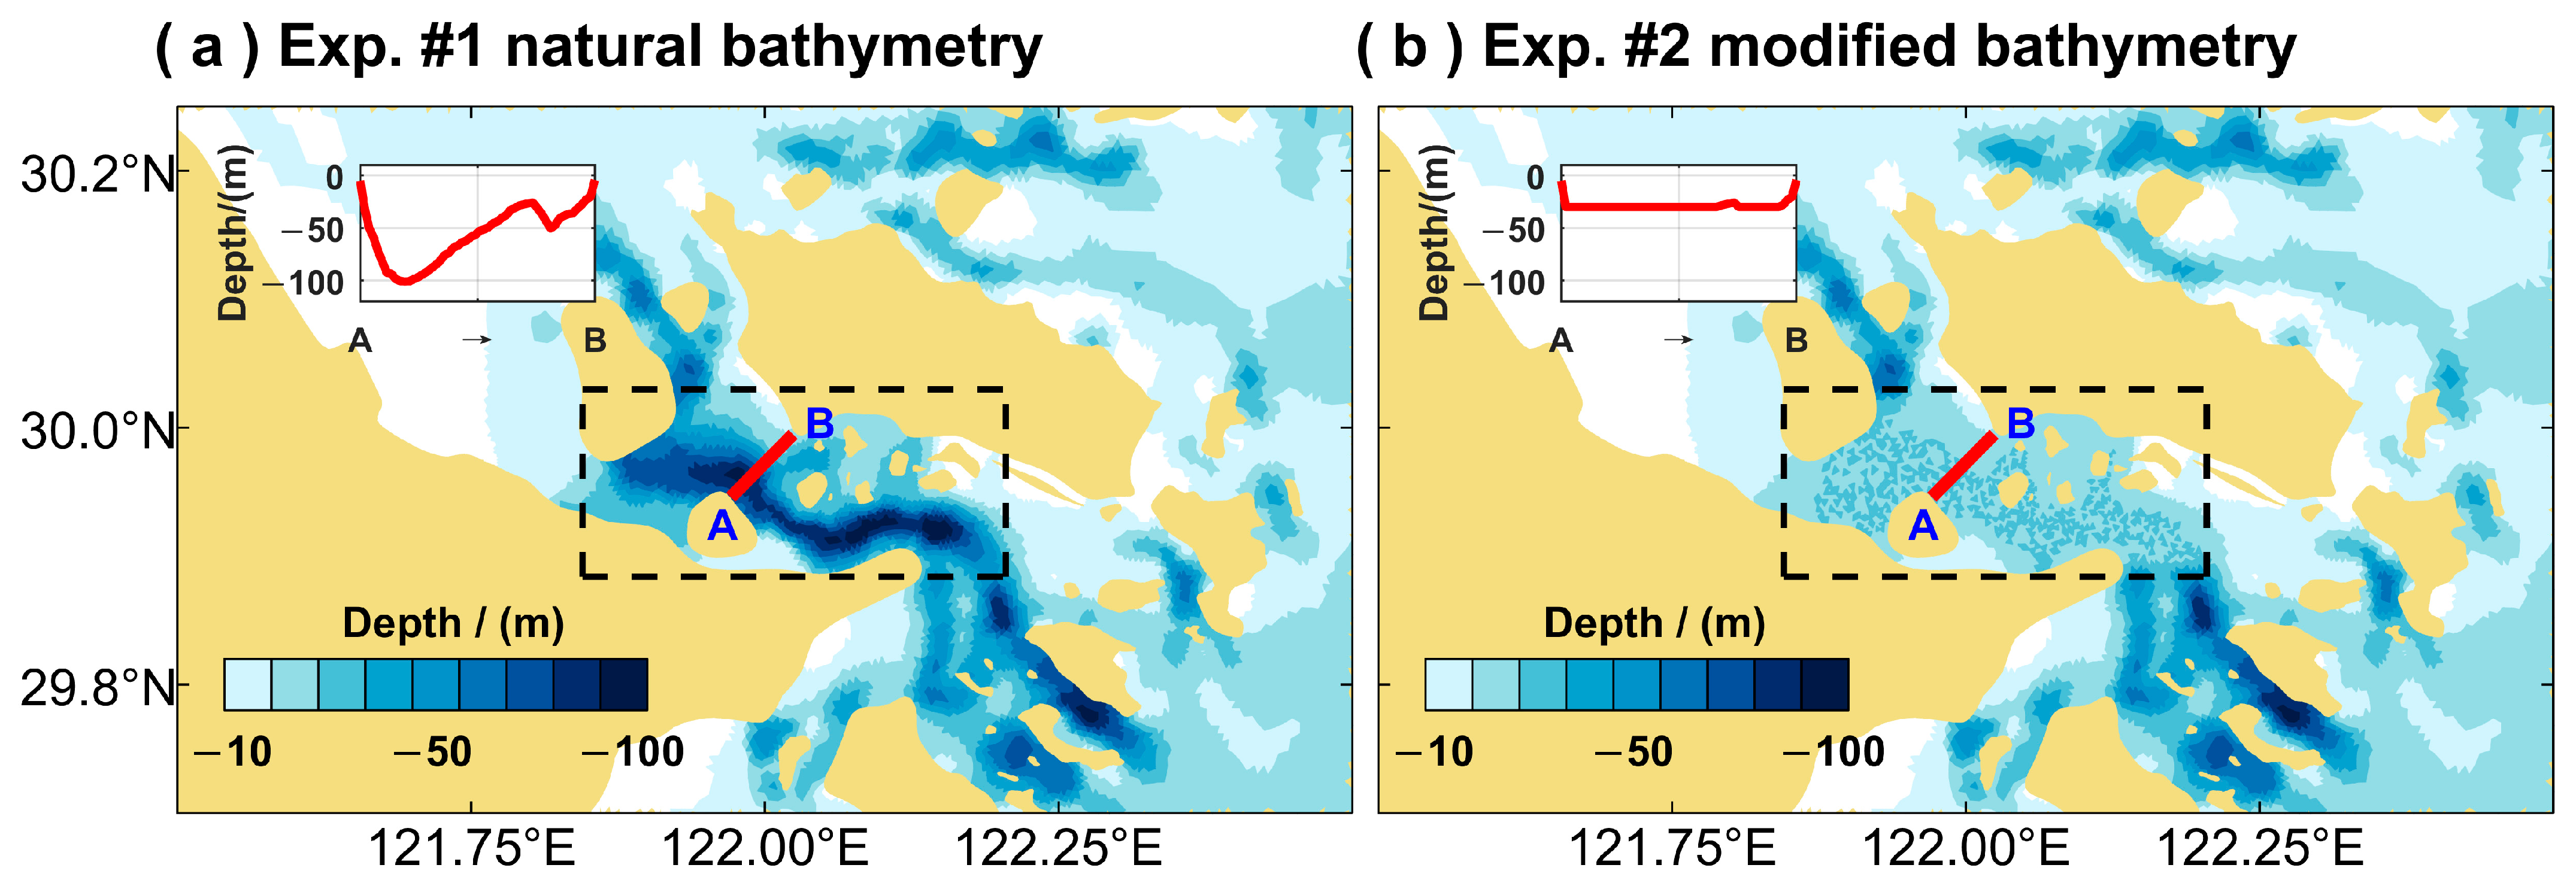
In a grid system uniformly distributed in the horizontal direction, two different water depth conditions were set for the comparative experiments. Specifically, in Experiment #1, the actual natural V-shaped water depth conditions (with a maximum depth of about 100 m) were adopted. In Experiment #2, however, for the part of the study area where the water depth exceeded 30 m (see the black box area in Figure 6), the water depth was adjusted to 30 m. This was to examine the influence of characteristics of V-shaped bathymetric factors on the kinetic processes and the processes of pollutant transport and diffusion in this area.
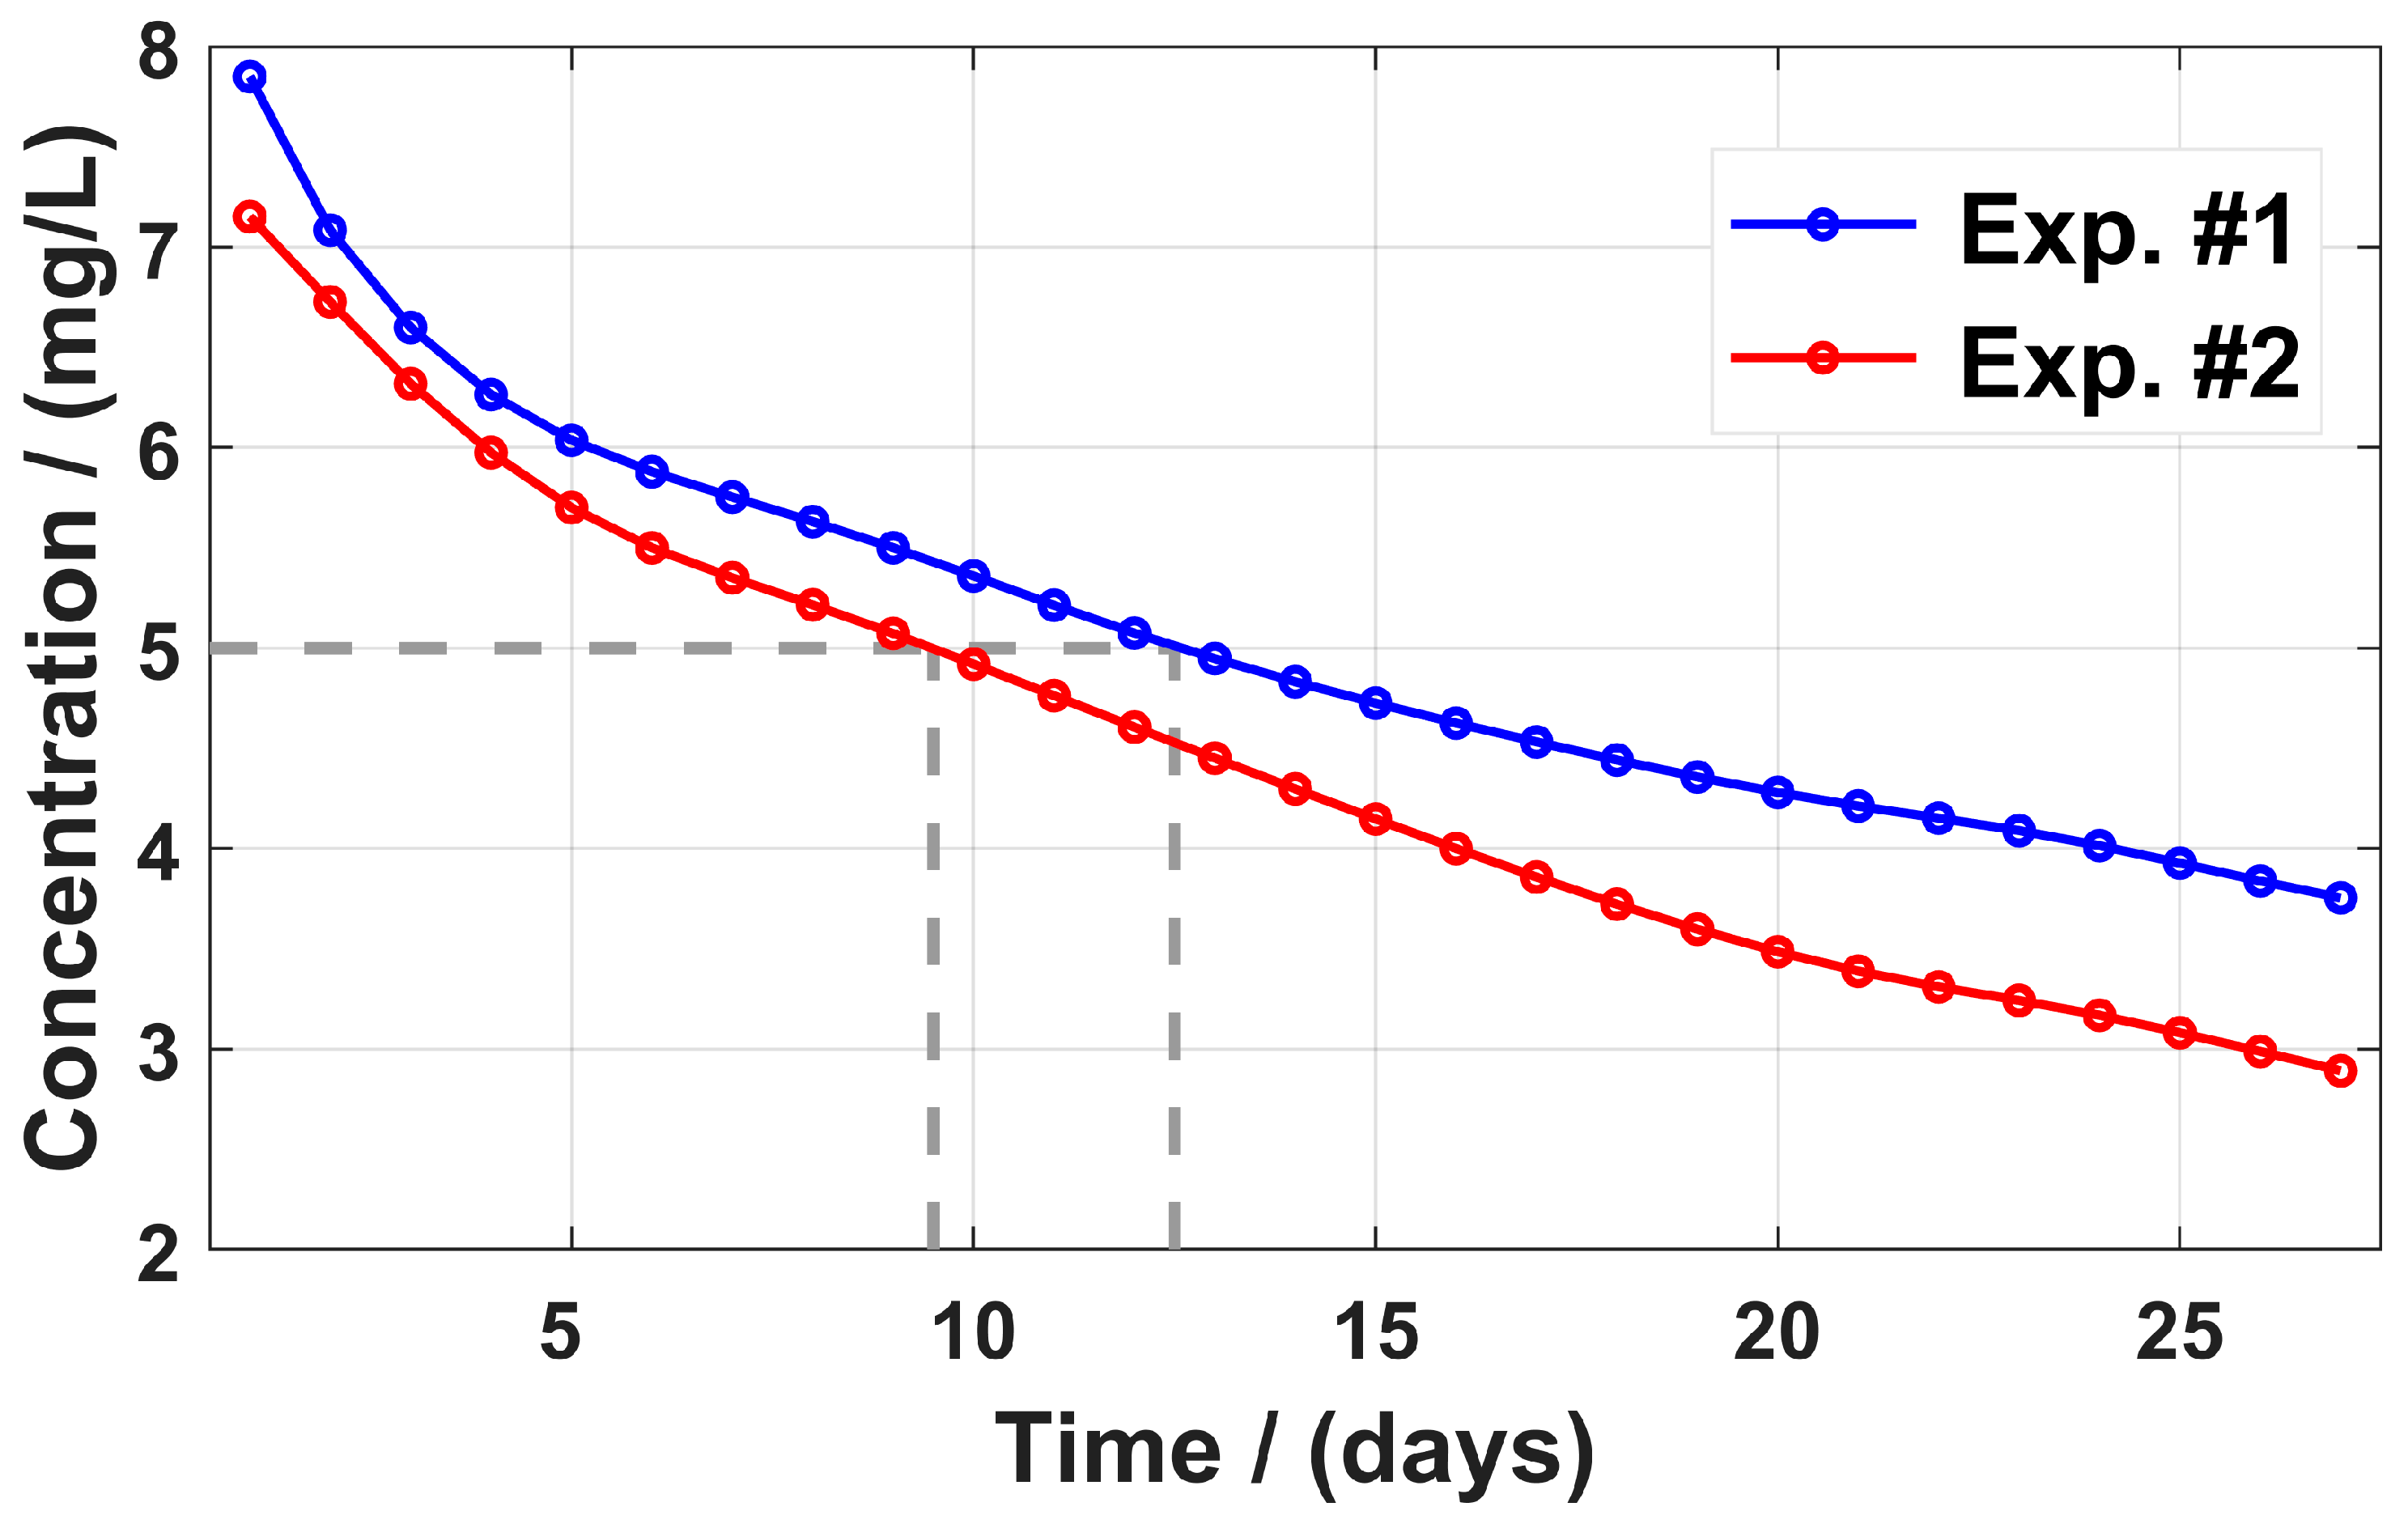
The hydrodynamic retention capacity of the tidal passage was quantified through water half-exchange time calculations under pre-/post-terrain modification scenarios (delimited by the black polygon in Figure 6). During model initialization (t = 0), passive dye tracers (10 mg∙L−1 concentration) were uniformly distributed across all grid nodes and vertical layers within the study domain. Post-release phase monitoring commenced with hourly concentration measurements, which were subsequently processed into 24-h moving averages to mitigate tidal-induced signal variability (approximately spanning two semi-diurnal tidal cycles). Temporal evolution of normalized dye concentration is presented in Figure 7. Experiment #1 (natural bathymetry): half-exchange period ≈ 12.5 days, cross-threshold timing (C/Co < 0.5) = 13 days; and Experiment #2 (modified bathymetry): half-exchange period ≈ 9.5 days, cross-threshold timing (C/Co < 0.5) = 10 days. This comparative analysis reveals that hydrodynamic exchange efficiency within the narrow passage exhibits bathymetric dependency. The half-exchange period decreases by approximately 3 days due to the bathymetric modifications, suggesting that the deep passage is prone to trapping polluted water.
For tracer transport analysis, ten positioned effluent outfalls were designated in the model domain to implement continuous tracer release (10 mg∙L−1). The retention efficiency of wastewater within the strait system was quantified through spatiotemporal monitoring of plumes exceeding 5 mg∙L−1 threshold concentrations. The horizontal dispersion dynamics exhibited three stages: (a) the rapid expansion stage during the initial 5-day period with radial spread rates exceeding 500 m d−1; (b) the transition deceleration stage (Days 5–10), during which the lateral expansion speed was affected by the diffusion effect; and (c) the quasi-steady stage (post-Day 10), during which the concentration fields approached dynamic equilibrium.
Figure 8 reveals the contrasting high-concentration plume during tidal cycles at experimental Day 10. Results demonstrate strong tidal modulation of effluent dispersal patterns, with maximum concentration cores (>5 mg∙L−1) exhibiting littoral-following migration paralleling coastal orientation. Cross-isobath diffusion occurred concurrently, manifested by persistent offshore-directed concentration gradients perpendicular to dominant tidal axes. Comparative analysis of P6–P10 in experimental scenarios revealed marked bathymetric control, under deeper seabed configurations (Experiment #1), 89% of plume mass remained within 1 km nearshore confinement, while in Experiment #2, the offshore propagation was enhanced with 32% of tracer mass penetrating beyond a 3 km radius.
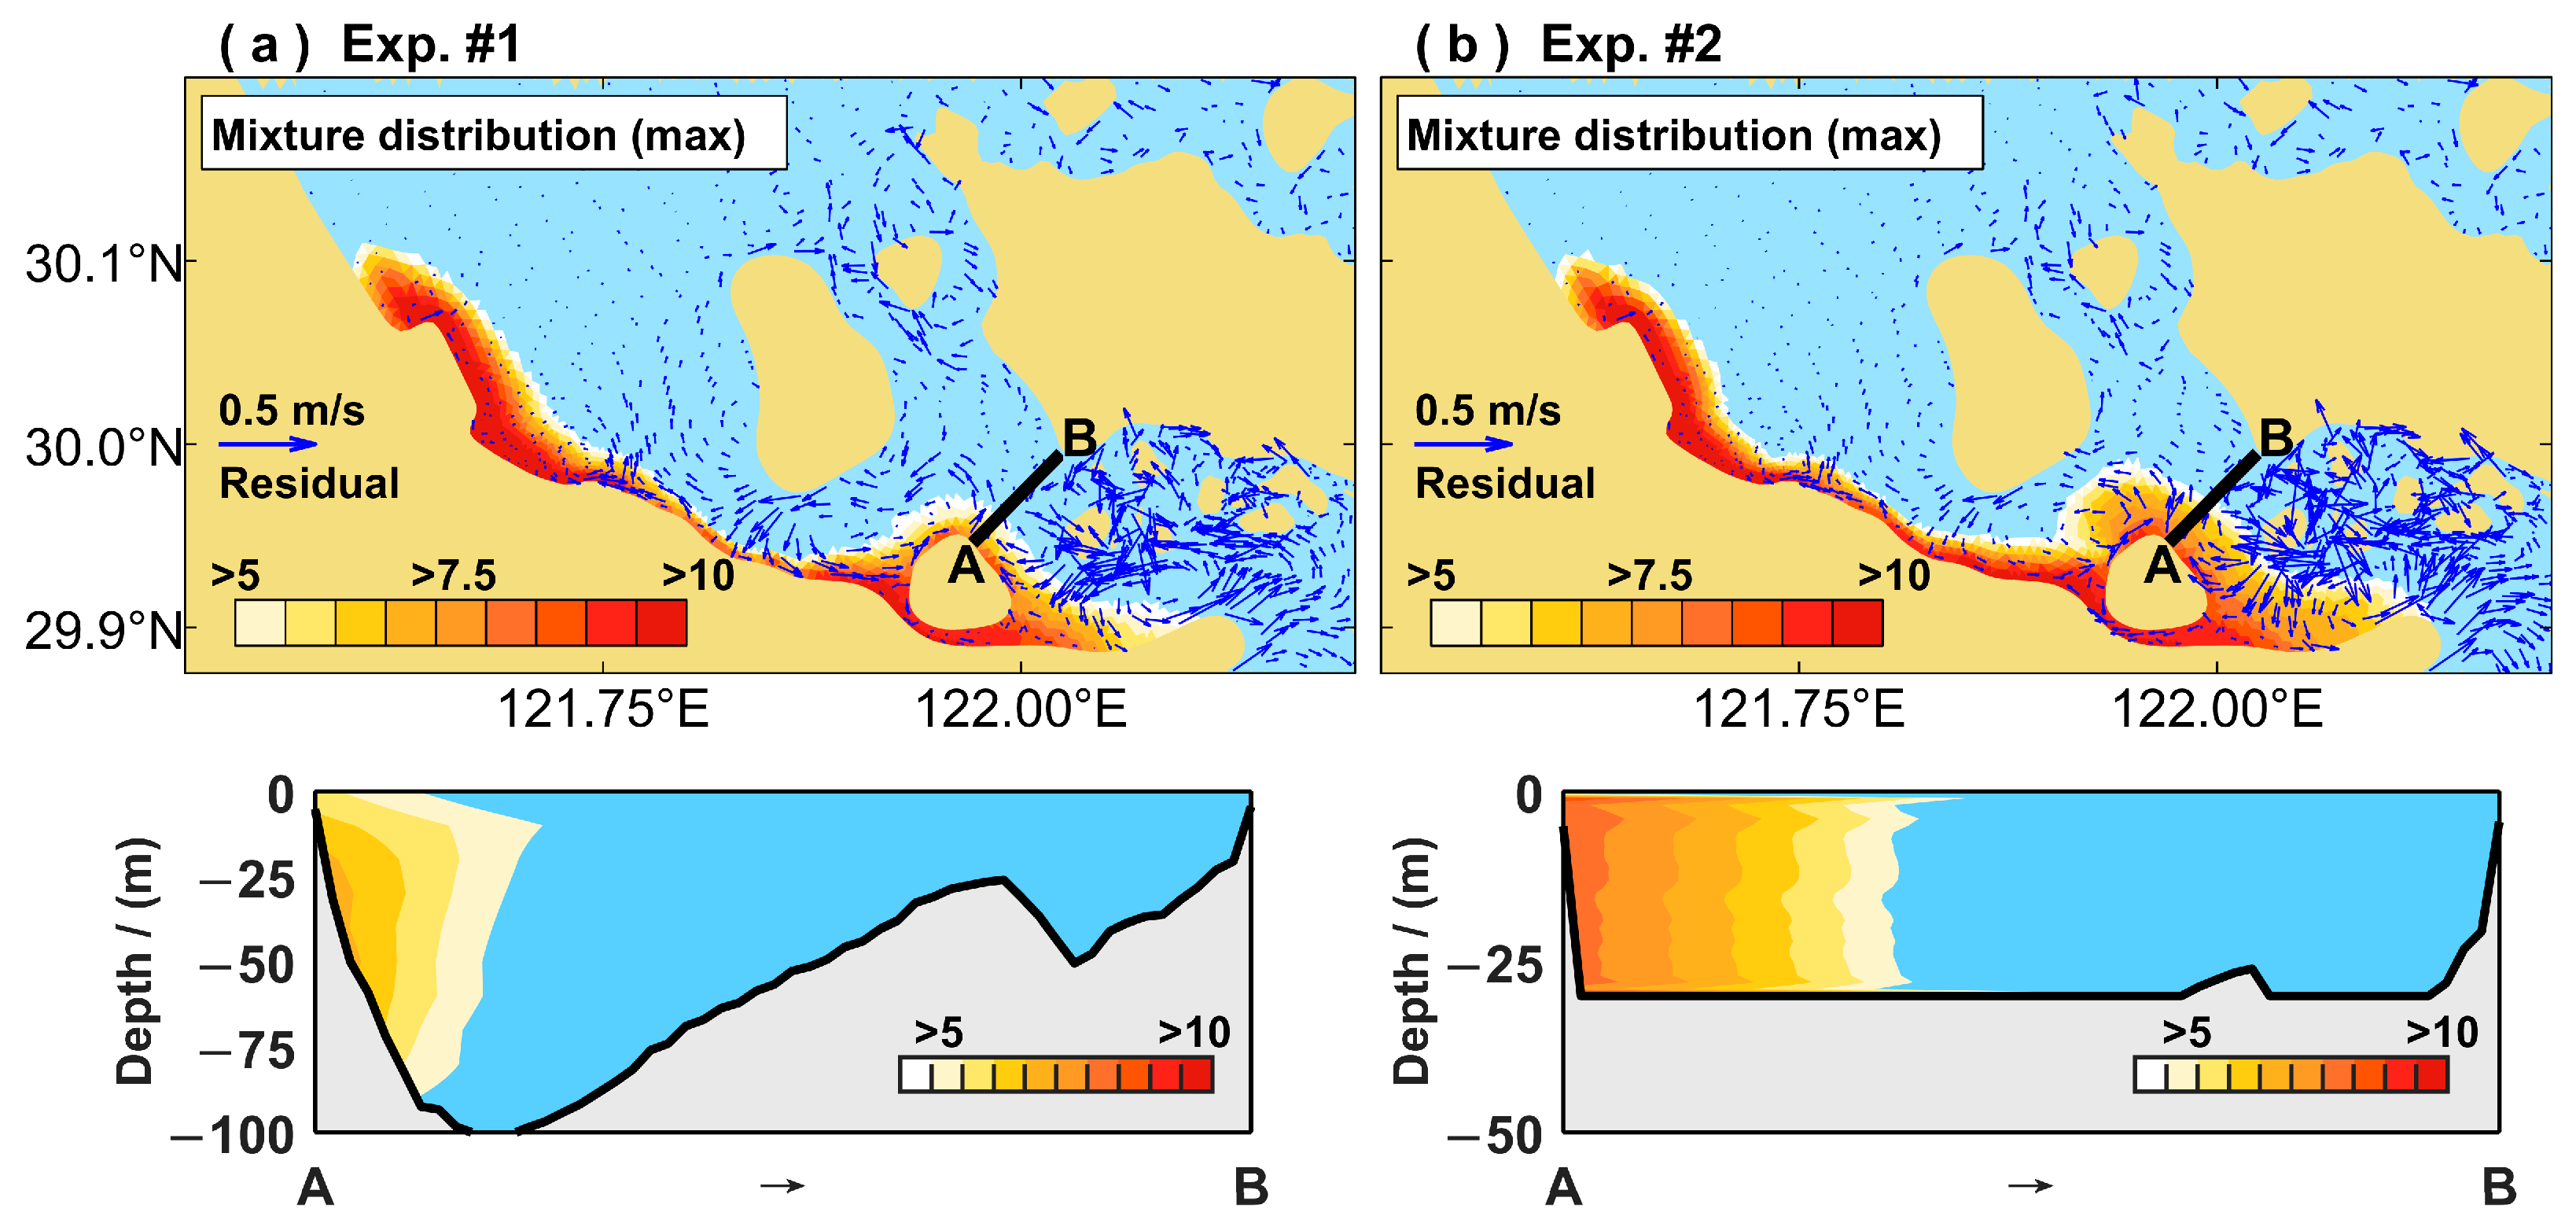
To elucidate the mechanisms governing pollutant retention and cross-shelf transport, we conducted a time-compounded analysis of contaminant dispersion patterns during four consecutive tidal cycles (Days 10–11). The maximum concentration envelope was derived through temporal superimposition of peak contaminant plumes (Figure 9), revealing persistent spatial patterns under varying hydrodynamic conditions.
Horizontal dispersion characteristics exhibit strong bathymetric control, with the estuarine geomorphology facilitating bathymetry-induced residual circulation. This circulation regime constrains >78% of pollutants within 3 km coastal confinement belts, exhibiting shoreline-parallel advection velocities. Vertical stratification analysis demonstrates subsurface contaminant accumulation, with peak concentrations clustered along the 25–50 m isobaths of the continental slope, suggesting active downwelling processes at density fronts. Under modified bathymetric configurations (Experiment #2), while vertical distribution profiles maintain structural similarity, offshore propagation distances increased, and were concomitant with seaward expansion of the 5 mg∙L−1 isopleth boundary by up to 5 km relative to Experiment #1 conditions.
The comparative analysis above has demonstrated the principal bathymetric modulation of wastewater retention dynamics in the region. Temporally, amplified hydrodynamic inertial effects within intensified bathymetric regimes extend contaminant residence time dynamics, manifesting as a 30% augmentation in half-exchange periodicity. Spatially, sustained tidal rectification mechanisms generate residual circulation vortices that laterally sequester >78% of pollutants within 3 km littoral confinement zones. Bathymetric steering of tidal residual currents induces subsurface contaminant pooling along the 20–50 m continental slope gradients (maximum concentration depth: 30 ± 5 m), which may cause potential benthic contamination risks.

3.4. Seasonal Variations

The numerical simulation incorporated monthly averaged wind field data as an additional forcing parameter. Specifically, the hourly tidal data for each month throughout 2022 and monthly averaged wind field data from the ERA5 reanalysis were employed as principal forcing parameters in the numerical simulation. Then, the quantification of spatial variations in elevated pollutant concentration zones (>5 mg∙L−1) substantiated wind forcing’s pivotal role in regulating wastewater advection-dispersion dynamics. Time-compounded analysis of contaminant dispersion patterns during four consecutive tidal cycles (Days 10–11) was conducted. When accounting for wind field forcing effects, the annual mean spatial distribution area of high-concentration contaminated water masses (>5 mg∙L−1) in the study region was quantified as 149.2 ± 6 km2 (Figure 10).
Model simulations revealed distinct seasonal modulation. Under predominant seaward wind vectors during vernal and estival periods, the aggregate surface area of hyper-concentrated domains exhibited marked expansion, averaging 152.2 km2 (March–August) and peaking at 154.9 km2 in July. Vertical stratification analysis demonstrated that wind-driven Ekman transport mechanisms enhanced contaminant sequestration along the continental slope, with benthic layer (25–50 m depth) concentrations reaching maxima of 9 mg∙L−1. In contrast, autumnal and wintertime landward wind regimes induced significant plume dispersion, reducing hyper-concentrated surface areas to a mean of 146.3 km2 (minimum: 143.6 km2 in October). Concurrently, positive wind-stress curl generated compensatory cross-shelf transport, effectively mitigating slope retention through enhanced vertical mixing. This volumetric flux redistribution diminished the pollutant-entrained water column thickness by 18–22% relative to summer conditions.
These multiseasonal simulations delineated a coherent wind-mediated modulation of pollutant dispersal architecture. Seaward wind forcing promotes enhanced nearshore contaminant accumulation and facilitates vertical stratification conditions, whereas landward wind regimes act to mitigate these coastal aggregation processes and destratification tendencies. This bidirectional wind forcing establishes a critical control on the study area’s contaminant meta-stability, with seasonal wind reversals driving 5–8% interannual variability in pollution footprint geometry.

3.5. Discharge Strategies

The numerical model incorporated discharge strategies from various sewage outfalls within the study area. Four discharge modes were comparatively analyzed: surface discharge, submerged discharge, continuous discharge, and intermittent discharge. Figure 11 illustrates the distinct responses of high-concentration sewage distribution to each discharge strategy. Due to varying water depths and hydrodynamic conditions surrounding each discharge location, pollutant dispersion exhibited significant differences across strategies. For clarity, the outfalls were categorized into two groups: (a) P1–P5 in shallow-water zones, and (b) P6–P10 in deep-water zones.
Comparative analysis revealed distinct operational outcomes across discharge strategies. Between surface and submerged discharge modalities, shallow-water zones exhibited minimal distributional variation (Δarea < 5%), while deep-water implementations demonstrated a 48% reduction in sewage retention areas through submerged discharge deployment. In addition, the low-tide discharge strategy proved particularly effective in shallow environments, enhancing pollutant clearance efficiency compared to continuous discharge protocols. Under low-tide discharge conditions, tidal phase synchronization accelerated nearshore pollutant dispersion via ebb-dominated transport mechanisms, concurrently achieving a 27% reduction in high-concentration retention zones. These impacts were systematically realized through coordinated temporal discharge stratification and equivalent cumulative-load distribution controls, maintaining mass balance while optimizing hydrodynamic flushing potential.

4. Discussion

This study investigated the retention effect of sewage discharge in deep tidal passages of the Ningbo-Zhoushan sea area, and quantified the effectiveness of different discharge strategies. While earlier studies have reported the significant influence of tides on the coastal currents and the retention effect of pollutants, they have not explicitly addressed the effectiveness of different discharge strategies on the dilution effect of wastewater after considering the tidal stages. By integrating field investigations with numerical modeling, we found that the processes of sewage transport, diffusion, and retention effect in the Ningbo-Zhoushan sea area are jointly influenced by the local deep trough bathymetry and seasonal winds. The coastal residual circulation formed by strong tidal currents confined over 78% of the tracers within a 3-km range near the shore, and a subsurface dye accumulation zone emerged along the 25–50 m isobaths. As a result, the tidal phase discharge strategy was revealed to be highly effective in this area. In this study, both submerged discharge in deep-water zones and intermittent discharge strategies implemented in shallow-water zones significantly reduce the spatial coverage of high-concentration sewage plumes, without reducing total effluent load. Our study suggests that in typical long and deep tidal passages, it is important to formulate discharge strategies based on tidal phases.
In this study, the measured data of currents and tide levels were used to validate the hydrodynamic parameters of the model, while the reliability of the tracer module, although discussed in previous studies [31], was not further examined in the study area. Although dye release experiments are not permitted in this area, the distribution of other pollutants related to wastewater, such as phosphorus, heavy metals, and pathogenic bacteria, can also provide useful information. Therefore, if there were more monitoring data from the coastal sections to support further study, it would provide a more comprehensive understanding of the wastewater impact in this region.
The simulation in this study was based on the TN concentration from field investigations. It was worth noting that the initial tracer concentration in the model (10 mg∙L−1) was based on the average value from wastewater analyses, which may lead to an underestimation of the impact of wastewater during peak periods. In addition, due to the lack of understanding of the mechanism of sediment adsorption, the complex exchange processes between water and sediments were not included in the current simulation scenario, which needs to be discussed in new work. Therefore, in future research, more attention can be paid to the offshore distribution of pollutants in this area, and supplementary discussions involving the spatiotemporal distribution of pollutants in sediment can be provided to further improve the model’s applicability in comprehensive water management.

5. Conclusions

This study focuses on the Ningbo-Zhoushan narrow tidal passages as a representative area, integrating field investigations with numerical modeling to reveal sewage transport, diffusion, and retention mechanisms in strait environments, while proposing optimized discharge strategies. The results revealed a distinct coastal-offshore sewage pollution gradient trapped by a V-shaped deep trough in Ningbo-Zhoushan narrow tidal passages. The deep-trough bathymetry prolonged water half-exchange time and generated coastal residual circulation, confining more than 78% of tracers within 3 km nearshore zone, and a subsurface tracer accumulation zone emerged along the 25–50 m isobaths. Monsoon transitions regulate pollution plumes, inducing 5–8% seasonal variability in pollution footprints controlled by wind-tide-stratification interplay. Another key finding from this study was that different discharge strategies significantly reduced the spatial extent of high-concentration plumes. In the deep water area, a 48% reduction in submerged discharge was achieved, while the intermittent discharge during low tide periods in the shallow water area was reduced by 27%. Therefore, it is important to formulate discharge strategies based on tidal phases in typical long and deep tidal passages, which have been overlooked in previous studies.

Author Contributions

Conceptualization, Q.C. and S.H.; methodology, Q.C. and S.H.; software, Q.C.; validation, Q.C. and X.W.; formal analysis, S.H.; investigation, Q.C., S.H., and X.W.; resources, Y.T. and S.H.; data curation, Q.C., H.Z., P.L., and X.L.; writing—original draft preparation, Q.C. and S.H.; writing—review and editing, Y.T., H.Z., P.L., and X.L.; visualization, Q.C.; supervision, S.H. and H.Z.; project administration, Y.T. and P.L.; funding acquisition, S.H., Y.T. and P.L. All authors have read and agreed to the published version of the manuscript.

Funding

This research was funded by the National Key R&D Program of China (2023YFC3108005), Construction project of the Innovation Research Center of the Provincial Key Laboratory (ZCX202404) and National Key R&D Program of China (2021YFC3101702).

Data Availability Statement

The original contributions presented in this study are included in the article’s Materials and Methods section. Further inquiries can be directed to the corresponding author.

Conflicts of Interest

The authors declare no conflicts of interest.

References

  1. Feng, H.X.; Grifoll, M.; Zheng, P.J. From a feeder port to a hub port: The evolution pathways, dynamics and perspectives of Ningbo-Zhoushan port (China). Transp. Policy 2019, 76, 21–35. [Google Scholar] [CrossRef]
  2. Ningbo Municipal Ecology and Environment Bureau. Report on the State of the Eco-environment in Ningbo 2018. Available online: http://sthjj.ningbo.gov.cn/art/2019/6/4/art_1229051263_52545151.html (accessed on 1 August 2025).
  3. Law, A.W.K.; Tang, C.Y. Industrial water treatment and industrial marine outfalls: Achieving the right balance. Front. Chem. Sci. Eng. 2016, 10, 472–479. [Google Scholar] [CrossRef]
  4. Rangel-Buitrago, N.; Galgani, F.; Neal, W.J. Addressing the global challenge of coastal sewage pollution. Mar. Pollut. Bull. 2024, 201, 116232. [Google Scholar] [CrossRef] [PubMed]
  5. Muhammetoglu, A.; Yalcin, O.B.; Ozcan, T. Prediction of wastewater dilution and indicator bacteria concentrations for marine outfall systems. Mar. Environ. Res. 2012, 78, 53–63. [Google Scholar] [CrossRef]
  6. Roth, F.; Lessa, G.C.; Wild, C.; Kikuchi, R.K.P.; Naumann, M.S. Impacts of a high-discharge submarine sewage outfall on water quality in the coastal zone of Salvador (Bahia, Brazil). Mar. Pollut. Bull. 2016, 106, 43–48. [Google Scholar] [CrossRef]
  7. Han, H.Y.; Li, K.Q.; Wang, X.l.; Shi, X.Y.; Qiao, X.D.; Liu, J. Environmental capacity of nitrogen and phosphorus pollutions in Jiaozhou Bay, China: Modeling and assessing. Mar. Pollut. Bull. 2011, 63, 262–266. [Google Scholar] [CrossRef]
  8. Premathilake, L.; Khangaonkar, T. Explicit quantification of residence and flushing times in the Salish Sea using a sub-basin scale shoreline resolving model. Estuar. Coast. Shelf Sci. 2022, 276, 108022. [Google Scholar] [CrossRef]
  9. Boehm, A.B.; Sanders, B.F.; Winant, C.D. Cross-shelf transport at Huntington Beach. Implications for the fate of sewage discharged through an offshore ocean outfall. Environ. Sci. Technol. 2002, 36, 1899–1906. [Google Scholar] [CrossRef] [PubMed]
  10. Scroccaro, I.; Ostoich, M.; Umgiesser, G.; De Pascalis, F.; Colugnati, L.; Mattassi, G.; Vazzoler, M.; Cuomo, M. Submarine wastewater discharges: Dispersion modelling in the Northern Adriatic Sea. Environ Sci Pollut Res 2010, 17, 844–855. [Google Scholar] [CrossRef]
  11. Graham, J.A.; Haverson, D.; Bacon, J. Modelling pollution dispersal around Solomon Islands and Vanuatu. Mar. Pollut. Bull. 2020, 150, 110589. [Google Scholar] [CrossRef]
  12. MrŠAHaber, I.V.A.; LegoviĆ, T.; KranjČEviĆ, L.; Cukrov, M. Simulation of pollutants spreading from a sewage outfall in the Rijeka Bay. Mediterr. Mar. Sci. 2020, 21, 116–128. [Google Scholar] [CrossRef]
  13. Stark, J.S.; Bridgen, P.; Dunshea, G.; Galton-Fenzi, B.; Hunter, J.; Johnstone, G.; King, C.; Leeming, R.; Palmer, A.; Smith, J.; et al. Dispersal and dilution of wastewater from an ocean outfall at Davis Station, Antarctica, and resulting environmental contamination. Chemosphere 2016, 152, 142–157. [Google Scholar] [CrossRef]
  14. Bedri, Z.; O’Sullivan, J.J.; Deering, L.A.; Demeter, K.; Masterson, B.; Meijer, W.G.; O’Hare, G. Assessing the water quality response to an alternative sewage disposal strategy at bathing sites on the east coast of Ireland. Mar. Pollut. Bull. 2015, 91, 330–346. [Google Scholar] [CrossRef]
  15. Ahmed, M.A.; Soussa, H.; Hamed, A.M.; El Safty, H. Numerical modeling of hydrodynamic and water quality impacts of wastewater discharges in coastal Lagoons: A case study of Ria Formosa. Ain Shams Eng. J. 2025, 16, 103482. [Google Scholar] [CrossRef]
  16. Kim, M.; Ligaray, M.; Kwon, Y.S.; Kim, S.; Baek, S.; Pyo, J.; Baek, G.; Shin, J.; Kim, J.; Lee, C.; et al. Designing a marine outfall to reduce microbial risk on a recreational beach: Field experiment and modeling. J. Hazard. Mater. 2021, 409, 124587. [Google Scholar] [CrossRef] [PubMed]
  17. Wang, C.; Guo, Z.; Li, Q.; Fang, J. Study on layout optimization of sewage outfalls: A case study of wastewater treatment plants in Xiamen. Sci. Rep. 2021, 11, 18326. [Google Scholar] [CrossRef]
  18. Roberts, P.J.W.; Salas, H.J.; Reiff, F.M.; Libhaber, M.; Labbe, A.; Thomson, J.C. Marine Wastewater Outfalls and Treatment Systems; IWA Publishing: London, UK, 2010. [Google Scholar]
  19. Borja, Á.; Elliott, M.; Carstensen, J.; Heiskanen, A.-S.; van de Bund, W. Marine management—Towards an integrated implementation of the European Marine Strategy Framework and the Water Framework Directives. Mar. Pollut. Bull. 2010, 60, 2175–2186. [Google Scholar] [CrossRef]
  20. Glibert, P.M.; Beusen, A.H.W.; Harrison, J.A.; D€urr, H.H.; Bouwman, A.F.; Laruelle, G.G. Global Ecology and Oceanography of Harmful Algal Blooms; Ecological Studies; Springer International Publishing: New York, NY, USA, 2018; pp. 53–76. [Google Scholar]
  21. Li, K.Q.; Shi, X.Y.; Bao, X.W.; Ma, Q.M.; Wang, X.L. Modeling total maximum allocated loads for heavy metals in Jinzhou Bay, China. Mar. Pollut. Bull. 2014, 85, 659–664. [Google Scholar] [CrossRef]
  22. Chen, C.S.; Liu, H.D.; Beardsley, R.C. An Unstructured Grid, Finite-Volume, Three-Dimensional, Primitive Equations Ocean Model: Application to Coastal Ocean and Estuaries. J. Atmos. Ocean. Technol. 2003, 20, 159–186. [Google Scholar] [CrossRef]
  23. Chen, C.S.; Beardsley, R.C.; Cowles, G.; Qi, J.; Lai, Z.G.; Gao, G.P.; Stuebe, D.; Xu, Q.C.; Xue, P.F.; Ge, J.Z.; et al. An Unstructured Grid, Finite-Volume Community Ocean Model FVCOM User Manual; University of Massachusetts Dartmouth: New Bedford, MA, USA, 2013. [Google Scholar]
  24. Mellor, G.L.; Yamada, T. Development of a turbulence closure model for geophysical fluid problems. Rev. Geophys. 1982, 20, 851–875. [Google Scholar] [CrossRef]
  25. Smagorinsky, J. General Circulation Experiments with the Primitive Equations: I The Basic Experiment. Mon. Weather. Rev. 1962, 91, 99–164. [Google Scholar] [CrossRef]
  26. Egbert, G.D.; Bennett, A.F.; Foreman, M.G.G. TOPEX/POSEIDON tides estimated using a global inverse model. J. Geophys. Res. 1994, 99, 821–852. [Google Scholar] [CrossRef]
  27. Egbert, G.D.; Erofeeva, S.Y. Efficient Inverse Modeling of Barotropic Ocean Tides. J. Atmos. Ocean. Technol. 2002, 19, 183–204. [Google Scholar] [CrossRef]
  28. Hersbach, H.; Bell, B.; Berrisford, P.; Hirahara, S.; Horányi, A.; Muñoz-Sabater, J.; Nicolas, J.; Peubey, C.; Radu, R.; Schepers, D.; et al. The ERA5 global reanalysis. Q. J. R. Meteorol. Soc. 2020, 146, 1999–2049. [Google Scholar] [CrossRef]
  29. Tozer, B.; Sandwell, D.T.; Smith, W.H.F.; Olson, C.; Beale, J.R.; Wessel, P. Global Bathymetry and Topography at 15 Arc Sec: SRTM15+. Earth Space Sci. 2019, 6, 1847–1864. [Google Scholar] [CrossRef]
  30. Willmott, C.J. On the Validation of Models. Phys. Geogr. 1981, 2, 184–194. [Google Scholar] [CrossRef]
  31. Chen, C.S.; Xu, Q.C.; Houghton, R.; Beardsley, R.C. A model—Dye comparison experiment in the tidal mixing front zone on the southern flank of Georges Bank. J. Geophys. Res. Ocean. 2008, 113, C02005. [Google Scholar] [CrossRef]
  32. Hu, S.; Townsend, D.W.; Chen, C.S.; Cowles, G.; Beardsley, R.C.; Ji, R.B.; Houghton, R.W. Tidal pumping and nutrient fluxes on Georges Bank: A process-oriented modeling study. J. Mar. Syst. 2008, 74, 528–544. [Google Scholar] [CrossRef]
  33. Hu, S. Improved vertical algorithm for finite volume coastal and ocean model with unstructured-grid. Chin. J. Hydrodyn. 2011, 26, 430–436. (In Chinese) [Google Scholar] [CrossRef]
  34. Safak, I.; Wiberg, P.L.; Richardson, D.L.; Kurum, M.O. Controls on residence time and exchange in a system of shallow coastal bays. Cont. Shelf Res. 2015, 97, 7–20. [Google Scholar] [CrossRef]
  35. Weisberg, R.H.; Zheng, L.; Liu, Y.; Murawski, S.; Hu, C.M.; Paul, J. Did Deepwater Horizon hydrocarbons transit to the west Florida continental shelf? Deep. Sea Res. Part II 2016, 129, 259–272. [Google Scholar] [CrossRef]
  36. Wang, T.P.; Yang, Z.Q. A modeling study of tidal energy extraction and the associated impact on tidal circulation in a multi-inlet bay system of Puget Sound. Renew. Energy 2017, 114, 204–214. [Google Scholar] [CrossRef]
  37. CHEN, Q.S.; HU, S.; WANG, X.H.; LIU, P.X.; Liu, X.; GAO, Z.Q. Simulation of degradation, diffusion and distribution of total nitrogen pollution influenced by tide and runoff in Yongjiang River. China Environ. Sci. 2024, 44, 344–351. (In Chinese) [Google Scholar] [CrossRef]
  38. Chen, C.S.; Lai, Z.G.; Beardsley, R.C.; Sasaki, J.; Lin, J.; Lin, H.C.; Ji, R.B.; Sun, Y.F. The March 11, 2011 Tōhoku M9.0 earthquake-induced tsunami and coastal inundation along the Japanese coast: A model assessment. Prog. Oceanogr. 2014, 123, 84–104. [Google Scholar] [CrossRef]
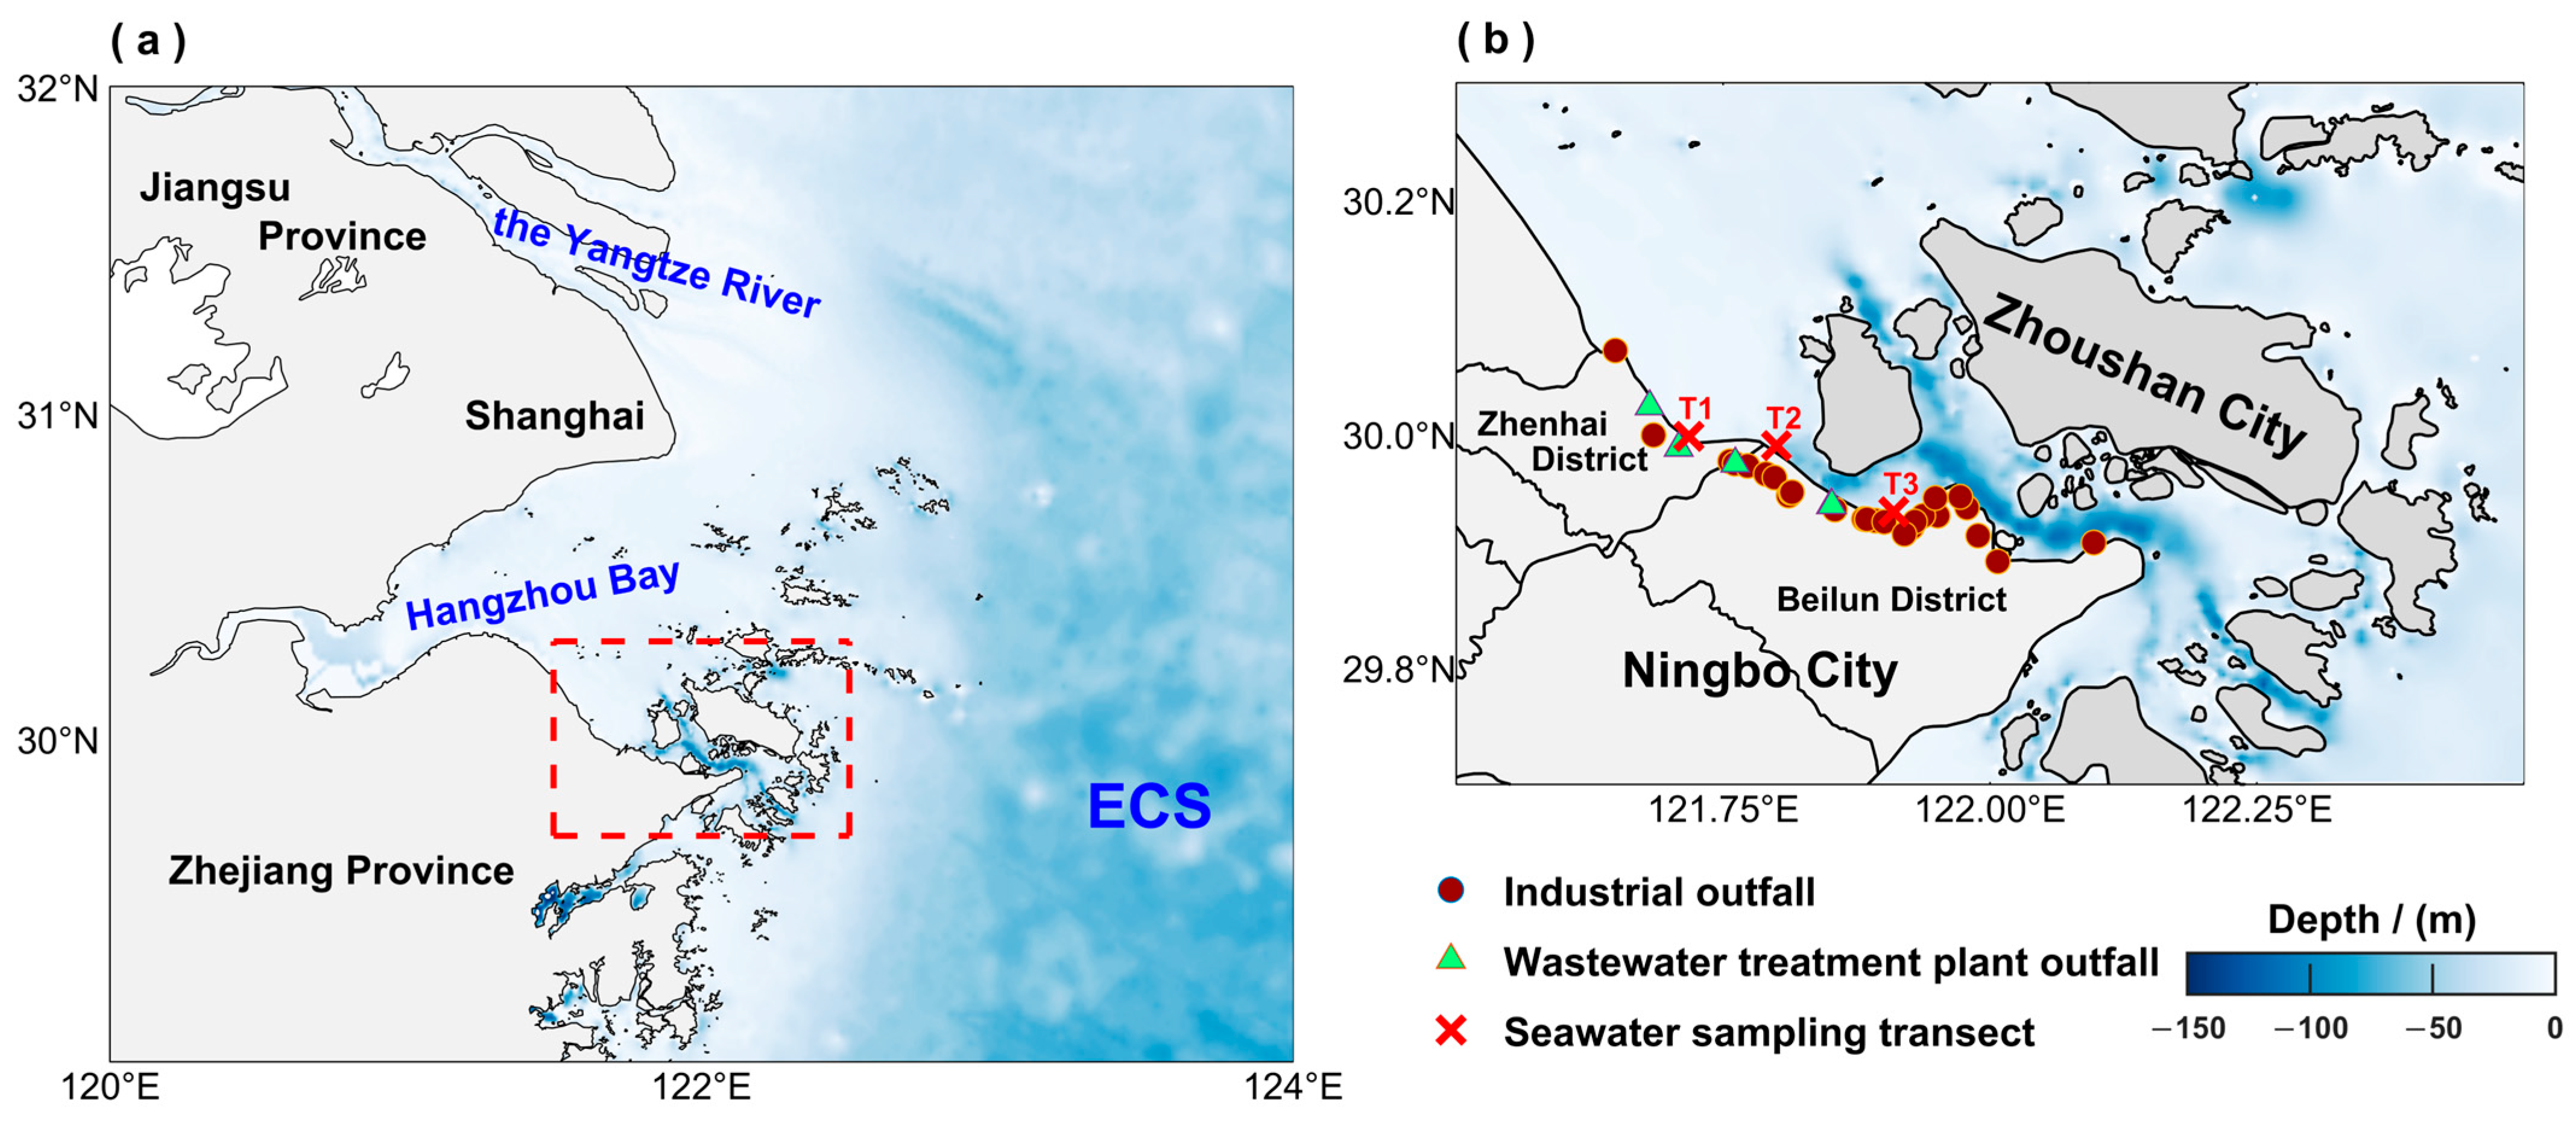
Figure 1. (a) The study area, and (b) the survey sites, including industrial outfall, wastewater treatment plant outfall and seawater sampling transect (T1–T3).
Oceans 06 00073 g001
Figure 2. (a) The model grid, (b) the locations of the tidal observation sites S1–S3 used for model validation, and (c) the locations P1–P10 for dye release.
Oceans 06 00073 g002
Figure 3. Diagram of the low-tide discharge strategy in the dye-tracking module.
Oceans 06 00073 g003
Figure 4. The offshore distribution of TN concentration.
Oceans 06 00073 g004
Figure 5. Comparison of the model-simulated result and the observations. (a) Tidal level in S1; (b) tidal current during neap tides in S2 and S3; and (c) tidal current during spring tides in S2 and S3.
Oceans 06 00073 g005
Figure 6. Bathymetric comparison between Experiment #1 and Experiment #2. (a) natural bathymetry under baseline conditions, and (b) adjusted bathymetry where water depths exceeding 30 m within the delimited region (black rectangle) were truncated to 30 m. Cross-sectional profiles (transect AB) illustrating vertical differences across experimental scenarios.
Oceans 06 00073 g006
Figure 7. Hydrodynamic retention efficiency contrast under divergent bathymetric regimes.
Oceans 06 00073 g007
Figure 8. The distribution of pollutant concentrations in Experiment #1 and Experiment #2 (Units: mg·L−1). (a) the result in Experiment #1, and (b) the result in Experiment #2.
Oceans 06 00073 g008
Figure 9. The mixture distribution of pollutant concentrations in Experiment #1 and Experiment #2 (Units: mg·L−1). (a) The horizontal and vertical results in Experiment #1, and (b) the horizontal and vertical results in Experiment #2.
Oceans 06 00073 g009
Figure 10. The mixture distribution of pollutant concentrations in Experiment #3 (Units: mg·L−1). (a) the horizontal and vertical results of the July case in Experiment #3, (b) the horizontal and vertical results of the October case in Experiment #3, and (c) monthly variations of the spatial distribution area of high concentration tracer.
Oceans 06 00073 g010
Figure 11. The mixture distribution of pollutant concentrations in Experiment #4 and Experiment #5 (Units: mg·L−1). (a) the result of surface discharge case in Experiment #4, (b) the result of submerged discharge case in Experiment #4, (c) the result of continuous discharge case in Experiment #5, and (d) the result of intermittent discharge case in Experiment #5.
Oceans 06 00073 g011
Table 1. Model experiments.
No.CaseDyeing Sigma LayerDepthForce
Exp. #1Exp. #1—natural bathymetry1, 15, 30real depthtidal forcing
Exp. #2Exp. #2—modified bathymetry1, 15, 30comparative depth (water depths exceeding 30 m were filled in as a flat bottom across the tidal passages)tidal forcing
Exp. #3Exp. #3—Jan.
Exp. #3—Feb.
Exp. #3—Mar.
Exp. #3—Apr.
Exp. #3—May.
Exp. #3—Jun.
Exp. #3—Jul.
Exp. #3—Aug.
Exp. #3—Sep.
Exp. #3—Oct.
Exp. #3—Nov.
Exp. #3—Dec.
1, 15, 30real depthtidal forcing and atmospheric forcing
Exp. #4Exp. #4—surface discharge1, 2, 3real depthtidal forcing
Exp. #4—submerged discharge28, 29, 30
Exp. #5Exp. #5—continuous discharge1, 15, 30real depthtidal forcing
Exp. #5—intermittent discharge1, 2, 14, 15, 29, 30
Disclaimer/Publisher’s Note: The statements, opinions and data contained in all publications are solely those of the individual author(s) and contributor(s) and not of MDPI and/or the editor(s). MDPI and/or the editor(s) disclaim responsibility for any injury to people or property resulting from any ideas, methods, instructions or products referred to in the content.