Article

Low Genetic Diversity and Decreased Effective Population Sizes of Acropora hyacinthus Populations Inhabiting Inshore and Offshore Reefs in the South China Sea

1
School of Marine Biology and Fisheries, Hainan University, Haikou 570228, China
2
School of Marine Science and Engineering, Hainan University, Haikou 570228, China
3
School of Ecology, Hainan University, Haikou 570228, China
4
Hainan Provincial Ecological and Environmental Monitoring Centre, Haikou 571126, China
5
State Key Laboratory of Marine Resource Utilization in South China Sea, Hainan University, Haikou 570228, China
6
Hainan International Joint Research Center for Coral Reef Ecology, Hainan University, Haikou 570228, China
*
Authors to whom correspondence should be addressed.
Oceans 2025, 6(4), 72; https://doi.org/10.3390/oceans6040072
Submission received: 15 April 2025 / Revised: 18 October 2025 / Accepted: 29 October 2025 / Published: 4 November 2025

Abstract

Coral reefs, with their high biodiversity and ecological service functions, face significant threats due to climate change, overfishing, and pollution. The South China Sea (SCS) hosts rich coral biodiversity, particularly Acropora hyacinthus, a critical species for reef restoration. However, the region’s coral reefs are increasingly degraded, highlighting the urgent need for conservation efforts. In the present study, the genetic diversity and population structure of A. hyacinthus were examined based on two types of data: double-digest restriction-site-associated DNA (ddRAD) sequencing data and mitochondrial putative control region DNA (mtCR) sequences. Coral tissue samples were collected from 74 colonies inhabiting two inshore reefs (Sanya) and three offshore reefs (Xisha islands), and 748 single nucleotide polymorphisms (SNPs) and 74 mtCR sequences were obtained and utilized for downstream analysis. The results were consistent in analyses and did not cluster into two geographical groups for the inshore and offshore sites. Phylogenetic analysis showed that individuals of A. hyacinthus inhabiting the five detected sites were likely cryptic species HyaD. Furthermore, AMOVA and pairwise FST estimations based on both data types revealed no differentiation among five populations and between inshore and offshore reefs, which could be due to the reproductive mode of broadcast spawning for this species. However, a prevalent low level of genetic diversity was observed when compared with nearby Taiwan regions and Japan, and the geographic history results showed that the effective population size (Ne) had been decreasing for the past 300 years. Thus, we speculated that the populations of A. hyacinthus inhabiting the SCS lack the potential to cope with future climate change adequately, and multiple conservation measures should be implemented based on considering genetic diversity.

1. Introduction

The coral reef ecosystem with extremely high biodiversity and productivity has important ecological service functions such as shoreline protection, providing fishery resources, and ecotourism value [1,2]. Coral reefs are primarily distributed in tropical and subtropical regions, notably across the Indo-Pacific, Red Sea, and Caribbean Sea, with renowned coral reef hotspots including the Great Barrier Reef, Coral Triangle, Belize Barrier Reef, Ningaloo Coast, South China Sea, and others [3].
The South China Sea (SCS), located in the central Indo-Pacific region, is renowned for its rich coral biodiversity. Despite its reef area being less than 17% of the Coral Triangle, the SCS hosts over 570 known species of reef-building corals, a diversity comparable to that of the Coral Triangle. Among these, Acropora spp. account for 17.2%, playing a crucial role in forming the immense calcium carbonate substructure that supports the thin living skin of the reef, making them an essential component of the coral reefs in the SCS [4,5]. The region’s coral reefs support a variety of marine life, providing habitat for fish, invertebrates, and other essential organisms that sustain the ecosystem [6]. However, the coral reef ecosystems in the SCS are facing various threats, such as climate change, overfishing, and water pollution, resulting in severe degradation of coral reef ecosystems [7,8]. Since the 1980s, nearly 80% of the coral reefs along China’s coastline have degraded [9]. The coral cover of the Luhuitou Reef in Hainan Province has sharply decreased from 90% in 1965 to 12% in 2009 [10]. The coral cover of Yongxing Island in the Xisha Islands has decreased from 90% in 1980 to 20% in 2008–2009 [11].
One of Acropora species, Acropora hyacinthus, which is characterized by its table-like morphology, has significant ecological values and is widely used in reef restoration efforts [12,13]. It could increase coral cover and restore degraded habitats in a relatively short time due to its faster growth rate. In addition, it could also provide shelters for other organisms and stabilize the substrates. The chromosomes of Acropora species varied between 24 and 52, and cytogenetic study showed that A. hyacinthus has 28 Chromosomes [5,14]. Hermaphrodite corals of A. hyacinthus have a broadcasting-spawning reproduction mode when they become sexually mature, which releases eggs and sperm into the water column and produces free-swimming larvae after successfully fertilized [12,15,16]. Generally, the average estimated time to settlement competency (TC50) for the larvae of A. hyacinthus exceeds five days and maintains a settlement competency of over 30% beyond 70 days [17]. In addition, in a large area of the tropical Pacific Ocean, six genetically defined cryptic species of A. hyacinthus (HyaA to F) were found [18]. Among the cryptic species of A. hyacinthus, HyaA, HyaB, HyaC, and HyaD have been identified in Taiwan Island, China, and Japan. HyaC is predominantly found in reef locations, while HyaD is widely distributed in marginal regions. Specifically, HyaD dominates the marginal reefs along the western and northern sides of the Kuroshio Current, likely driving the poleward range expansion of A. hyacinthus. In contrast, the more tropical lineages have remained stable within their original ranges. In addition, semi-incompatibility and hybridization between HyaC and HyaD from reef locations were detected, and the existence of hybridization partners was helpful for the increase of genetic diversity [19]. However, due to its high sensitivity to climate change and human activities, the long-term existence of A. hyacinthus was threatened. Therefore, A. hyacinthus has most recently been assessed for the IUCN Red List of Threatened Species in 2023 [20].
Currently, coral reef restoration techniques are predominantly based on asexual propagation. While this approach can rapidly increase coral cover in specific areas, it may reduce the genetic diversity of coral populations in those regions [21]. Under the prevailing pressures of climate change and other environmental stressors, maintaining a high level of genetic diversity for coral populations is critical, as it increases the likelihood of retaining adaptive alleles that can enhance the survival potential [22]. It was believed that populations with higher genetic diversity are more stable, productive, and resistant to disturbance or disease than populations with lower genetic diversity [23]. In A. hyacinthus, genetic diversity exists not only among colonies but also within individual colonies through intracolonial genetic mosaicism, and such variation can be transmitted to offspring via gametes, potentially increasing adaptive potential under environmental stress [24]. Recent work has further demonstrated that, even in controlled aquarium environments, careful broodstock selection and breeding management can preserve substantial standing genetic variation, thereby supporting genetic rescue and assisted gene flow strategies [23]. At the genomic level, Acropora species exhibit unique evolutionary adaptations, including expansions of stress response and symbiosis-related gene families, which may contribute to resilience under rising temperatures and ocean acidification [25]. Therefore, the analysis of the genetic characteristics of target corals can be used to evaluate their survival status and adaptability to the environment, providing effective theoretical support for the formulation of coral reef conservation and restoration strategies [26]. The genome of A. hyacinthus has been sequenced and made available across four different assemblies, providing a range of genomic data at various levels of completeness. The total genome size is approximately 450–500 Mb, with a GC content of around 39%. These assemblies include scaffold-level, chromosome-level, and alternative haplotype data. These resources are essential for advancing the understanding of A. hyacinthus genetics, aiding in studies related to its adaptation, conservation, and resilience to environmental pressures. Previous study revealed that the genetic diversity and connectivity of nine populations of Galaxea fascicularis in 12 different latitudes of SCS was reported based on the microsatellite markers, and results showed that low genetic diversity and limited gene flow existed in these populations, which suggested insufficient adaptability of G. fascicularis population to the future changing environments [26]. Wu et al. used microsatellite markers combined with ITS and COI to study the genetic features of five populations of Turbinaria peltata in the northern SCS, and results showed a low level of genetic diversity and significant genetic differentiation in detected populations, implying that T. peltata may be unable to deal with increasingly complex global changes [27]. Moderate genetic diversity based on microsatellite markers existed in ten populations of Pocillopora verrucosa in four SCS regions, which indicated a certain genetic potential of these populations in the context of climate change [28]. In addition, the high degree of genetic differentiation, which is mainly due to the brooding planulae reproduction mode, will increase the risk of local degradation or extinction [28]. Recently, due to the limited resolution of various molecular markers, double-digest restriction-site-associated DNA (ddRAD) sequencing was frequently used in more and more population genetics research. For example, by studying the genetic features of Porites divaricata populations inhabiting mangroves and nearby reefs, limited genetic diversity in mangrove populations and limited connectivity between the two different habitats were found [29]. This finding reminds us that the protection of coral reefs should focus on the protection of all habitats, not just the reefs.
In the present study, we first examined the genetic diversity, population structure, and effective population size of A. hyacinthus populations from inshore and offshore reefs in the SCS using ddRAD sequencing. Additionally, we further determined the genetic lineage within detected populations and analyzed the level of genetic diversity by comparing with populations from nearby Taiwan regions and Japan based on the mitochondrial putative control region (mtCR) sequences. This study aimed to determine whether inshore and offshore A. hyacinthus populations in the SCS differentiated for different degrees of human interference and evaluate the genetic potentials to cope with increasingly complex global changes in the hope of providing theoretical support for the protection and restoration of coral reef ecosystems in the SCS.

2. Materials and Methods

2.1. Sampling and DNA Extraction

In November 2022, a total of 74 coral samples of A. hyacinthus were collected from five coral reefs in the SCS, including two populations from inshore Wuzhizhou Island (WZ) and Fenjiezhou Island (FJ) in Sanya, and three populations from offshore Zhaoshu Island (ZS), Yongxing Island (YX) and Ganquan Island (GQ) in Xisha (Figure 1). Coral samples of 3–5 cm in size were collected with pliers at the depth of 3–5 m that were separated by at least 5 m. The coral sample numbers collected from each location are shown in Table 1. All coral samples were fixed with 95% ethanol and stored at −20 °C until DNA extraction. The genomic DNA was extracted according to the phenol-mimicking method [30]. Partial DNA samples were used in PCR for the amplification of mtCR sequences and the remaining DNA samples were sent to JieRui BioScience Co., Ltd. (Guangzhou, China) for ddRAD library preparation and Illumina sequencing.

2.2. Sequencing Analysis

2.2.1. ddRAD Sequencing Library Construction and Data Generation

This study generates SNP data using the double-digest (dd) RAD-based approach [31]. All qualified DNA samples were standardized to 20 ng/μL, then a total of 20 μL restriction endonuclease mixture (EcoR I + Pst I) was added and incubated at 37 °C and 65 °C to produce small DNA fragments that were purified after digestion using magnetic beads to remove impurities. Sticky ends of fragments were ligated with custom-designed adapters and ligation products were size selected (400–600 bp size range) in agarose. These selected fragments were further amplified using PCR. Finally, we removed residual primers and purified PCR libraries using magnetic beads, and library sequencing was conducted on the Illumina Xplus platform (San Diego, CA, USA) according to the standard operation procedure. The sequencing mode was 150 bp paired-end reads, and the average sequencing amount of a single sample was 0.5 GB raw data.

2.2.2. PCR Amplification and Sequencing of mtCR Fragment

A DNA fragment with about 748 nucleotides from mtCR was amplified via polymerase chain reaction (PCR) using forward primers (5′-CAGAGTAAGTCGTAACATAG-3′) and reverse primers (5′-AATTCCGGTGTGTGTGTTCTCT-3′) [18]. PCR was performed in 25 μL volumes on the TaKaRa PCR Thermal Cycler Dice™ (Shiga, Japan) using 1 μL extracted DNA, 2.5 μL 10 × buffer, 4 μL dNTP, 0.5 μL EX Taq enzyme (Takara EX Taq kit), and a final concentration of 10 μM for each primer The PCR amplification conditions were as follows: pre-denaturation at 95 °C for 2 min, 35 cycles of denaturation at 95 °C for 30 s, annealing at 51 °C for 90 s, extension at 72 °C for 90 s, and final extension at 72 °C for 10 min. All PCR products were detected by 1% agarose gel electrophoresis. The PCR products were sent to BGI Genomics Co., Ltd. (Shenzhen, China) for sequencing.

2.3. Data Analysis

2.3.1. Data Processing, SNP Calling, and Population Genetic Analysis of A. hyacinthus

The raw reads obtained from the Illumina platform were processed using Stacks 2.55 software [32]. Low-quality sequencing reads and bases were filtered using process_radtags with the parameters: process_radtags-1 xxx.R1.fq.gz-2 xxx.R2.fq.gz-b barcode.txt—renz-1 ecoRI—renz-2 pstI-c-q-r-o pro_out—len_limit 140-t 135. The—window-size was set to 0.15, and the—score-limit was set to 10, discarding reads with an average Phred score below this threshold. The reference genome of Acropora hyacinthus (GCA_020536085.1) was obtained from the NCBI GenBank database (https://www.ncbi.nlm.nih.gov/datasets/genome/GCA_020536085.1/), accessed on 1 August 2025. The number of sequence reads retained after preprocessing in each sample is summarized in Table S1. After that, sequence reads are assembled by mapping to the reference genome of A. hyacinthus using Bwa software (version 0.7.17-r1188). SAMtools version 1.5 was used to combine the sequence reads of all individuals into a BAM file, and SNP calling was performed on all individuals using the ref_map.pl program in the Stacks software [33]. Standard filtering applied in our analyses included SNPs that were present in at least 50% of individuals within each of the five populations.
Pairwise population summary statistics, including the frequency of private alleles (PA), observed heterozygosity (Ho), expected heterozygosity (He), Wright’s inbreeding coefficient (Fis), and average nucleotide diversity (π), were calculated for each population using the Populations program in Stacks software [32].
In this study, all analysis was performed based on the common sites obtained from all individuals after data filtering. It was first assessed by STRUCTURE software v2.3.4 [34], and the number of genetic clusters (K) was set from 1 to 10 with 5 iterations per K-value. A burn-in of 10,000 generations and 10,000 Markov chain Monte-Carlo (MCMC) chains were performed for each iteration. After that, the STRUCTURE results were uploaded to Structure Harvester to calculate the number of most appropriate clusters [35]. The optimal K was determined with the maximum Delta K and mean LnP (K). Principal component analysis (PCA) and posterior assignment probabilities (PMP) analysis results were obtained by package poppr v2.9.6 [36], and Discriminant analysis principal component (DAPC) was implemented using adegenet v2.1.1 package for the further examination of population subdivision. The function find.clusters from the adegenet package was used to identify the optimal number of clusters (K) [37]. Pairwise FST between populations was calculated by the GroupGenome package in R language, and gene flow Nm was estimated based on the formula Nm = (1 − FST)/(4 * FST) [38].
The demographic history of the effective population size of A. hyacinthus was inferred using Stairway Plot 2.1.1 based on folded site frequency spectra (SFS). The folded SFS was obtained by a custom python script easySFS.py with a down projection method (https://github.com/isaacovercast/easySFS, accessed on 1 August 2025) [39]. The mutation rate was set to 4 × 10⁻⁹ per base pair per generation according to Acropora millepora, and the generation time was set to 5 years based on the time of the full reproductive potential attained [40].

2.3.2. Genetic and Phylogenetic Analysis of A. hyacinthus Using mtCR Sequences

All mtCR sequences amplified from coral samples were first compared with the mitochondrial genome of A. hyacinthus to confirm the identification of field samples. After that, MEGA11 was used for multiple sequence alignment [41]. SeqMan7.1 was used for further sequence modification [42], and all sequences we obtained were deposited in the GenBank database (accession numbers PQ671336-PQ671409). The genetic diversity indices, including haplotype number (N), polymorphic loci (S), haplotype diversity (Hd), nucleotide diversity (Pi), and average nucleotide difference (K), were calculated by DNASP5.10 [43]. Arlequin3.5 was used to perform molecular variance analysis (AMOVA) on three geographic levels (SCS, the Taiwan region, and Japan) of A. hyacinthus by Φ statistics. Pairwise FST was also completed by Arlequin3.5 [44].
In addition, the Mantel test (with 9999 iterations) was performed using GenALEx6.5 to estimate the correlation between genetic distance and geographic distance (from Google Maps) [45]. Furthermore, we estimated a maximum likelihood (ML) tree of the concatenated matrix with IQ-TREE1.6.12 [46], searching for the best partition scheme using ModelFinder implemented within IQ-TREE [47], followed by 100 searches for the best ML tree inference and 1000 ultrafast bootstrap replicates. Additionally, to ascertain the genetic lineage of A. hyacinthus in the SCS, 88 mtCR sequences from the Taiwan regions including Aimen (Aim), Chinwan Inner Bay (CIB), Shertaosan (She), Londong (Lon), Sanshiantai (San), Kenting (Ken), Dongchi (Don); and 65 mtCR sequences from Japan including Miyako (MIY), Shirahama (Shi), Yokonami (Yok), Amakusa (AMA) were obtained from GenBank databases (Table S2), and all these sequences were applied in the construction of phylogenetic tree [19].

3. Results

3.1. ddRAD Sequencing Data

3.1.1. Sequencing Data and Genetic Diversity

A total of 166,942,093 raw reads were obtained from the ddRAD sequencing data, the number of filtered reads after the process_radags program step was 73,925,501. The number of tags retained from each sample ranged from 367,451 to 8,218,788 (average number of tags: 2,589,606 ± 1,955,842). After filtering with the program “population”, a total of 79,075 loci containing 748 variant sites were retained for further analysis. The Transition/Transversion (Ts/Tv) ratio of the final SNP panel was 1.345, with the call rate of the SNPs exceeding 51.67%, and the coverage of the SNPs was greater than 55.45.
The number of polymorphic RAD-loci ranged from 155 (GQ) to 308 (WZ) among five populations. The frequency of private alleles (PA) ranged from 0.0004 (GQ) to 0.0014 (ZS), which was low in all five populations we detected (Table 1). In addition, the average observed heterozygosity (Ho) was less than the expected heterozygosity (He) in all populations. The Ho and He values ranged from 0.03011 (ZS) to 0.4962 (GQ) and from 0.5573 (YX) to 0.08080 (WZ), indicating a deficiency of heterozygotes among populations. Furthermore, the nucleotide diversity (π) ranged from 0.05869 (YX) to 0.08619 (WZ). The inbreeding coefficient (Fis) was positive for all populations, ranging from 0.0513 (GQ) to 0.1728 (WZ), suggesting the presence of inbreeding. Thus, the genetic diversity of all populations was low according to the results mentioned above, and no obvious difference existed between inshore and offshore sites.

3.1.2. Population Connectivity

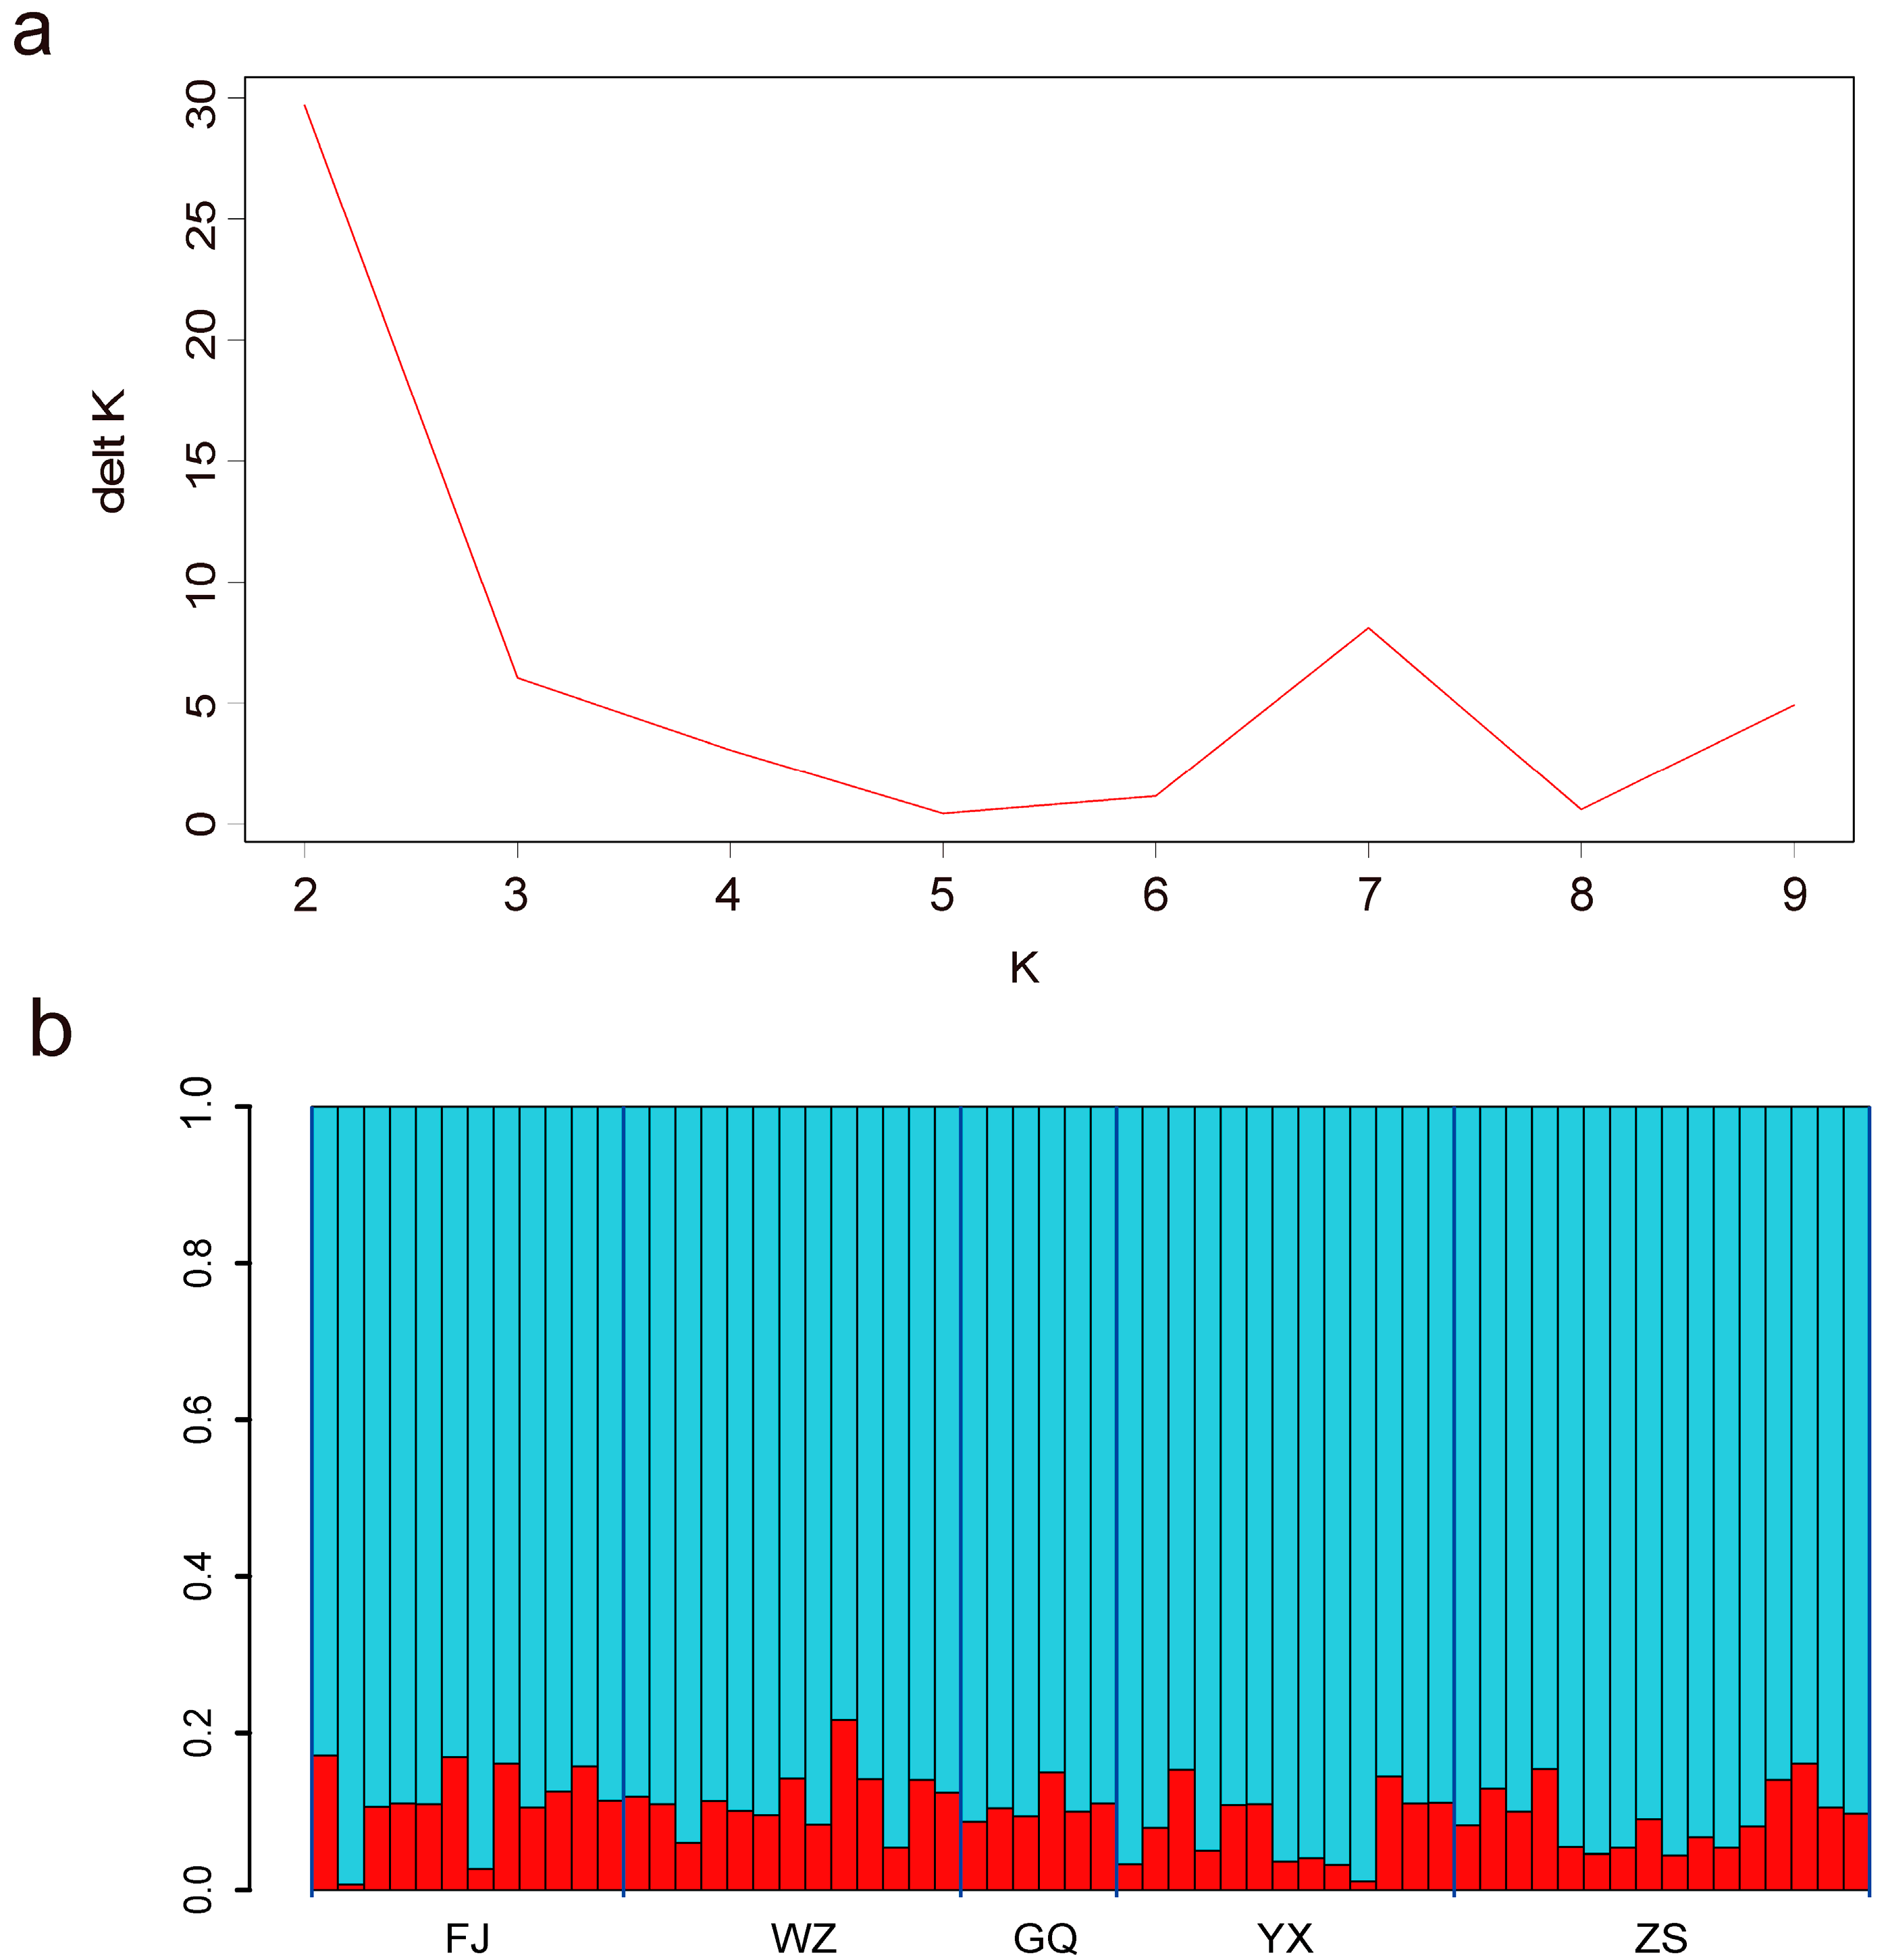
STRUCTURE analysis based on 748 SNPs showed that K = 2 was the optimal value of delta K (Figure 2a,b), and the optimal LnP(K) value also occurred at K = 2, inferring that all samples can be divided into two genetic clusters. However, K = 2 shows that one of them is possibly a ghost cluster [48] (never achieve a membership (= ancestry) coefficient (Q) > 0.5 in any individual of the data set) with low membership coefficients (Figure 2b, showing K  =  2 only).
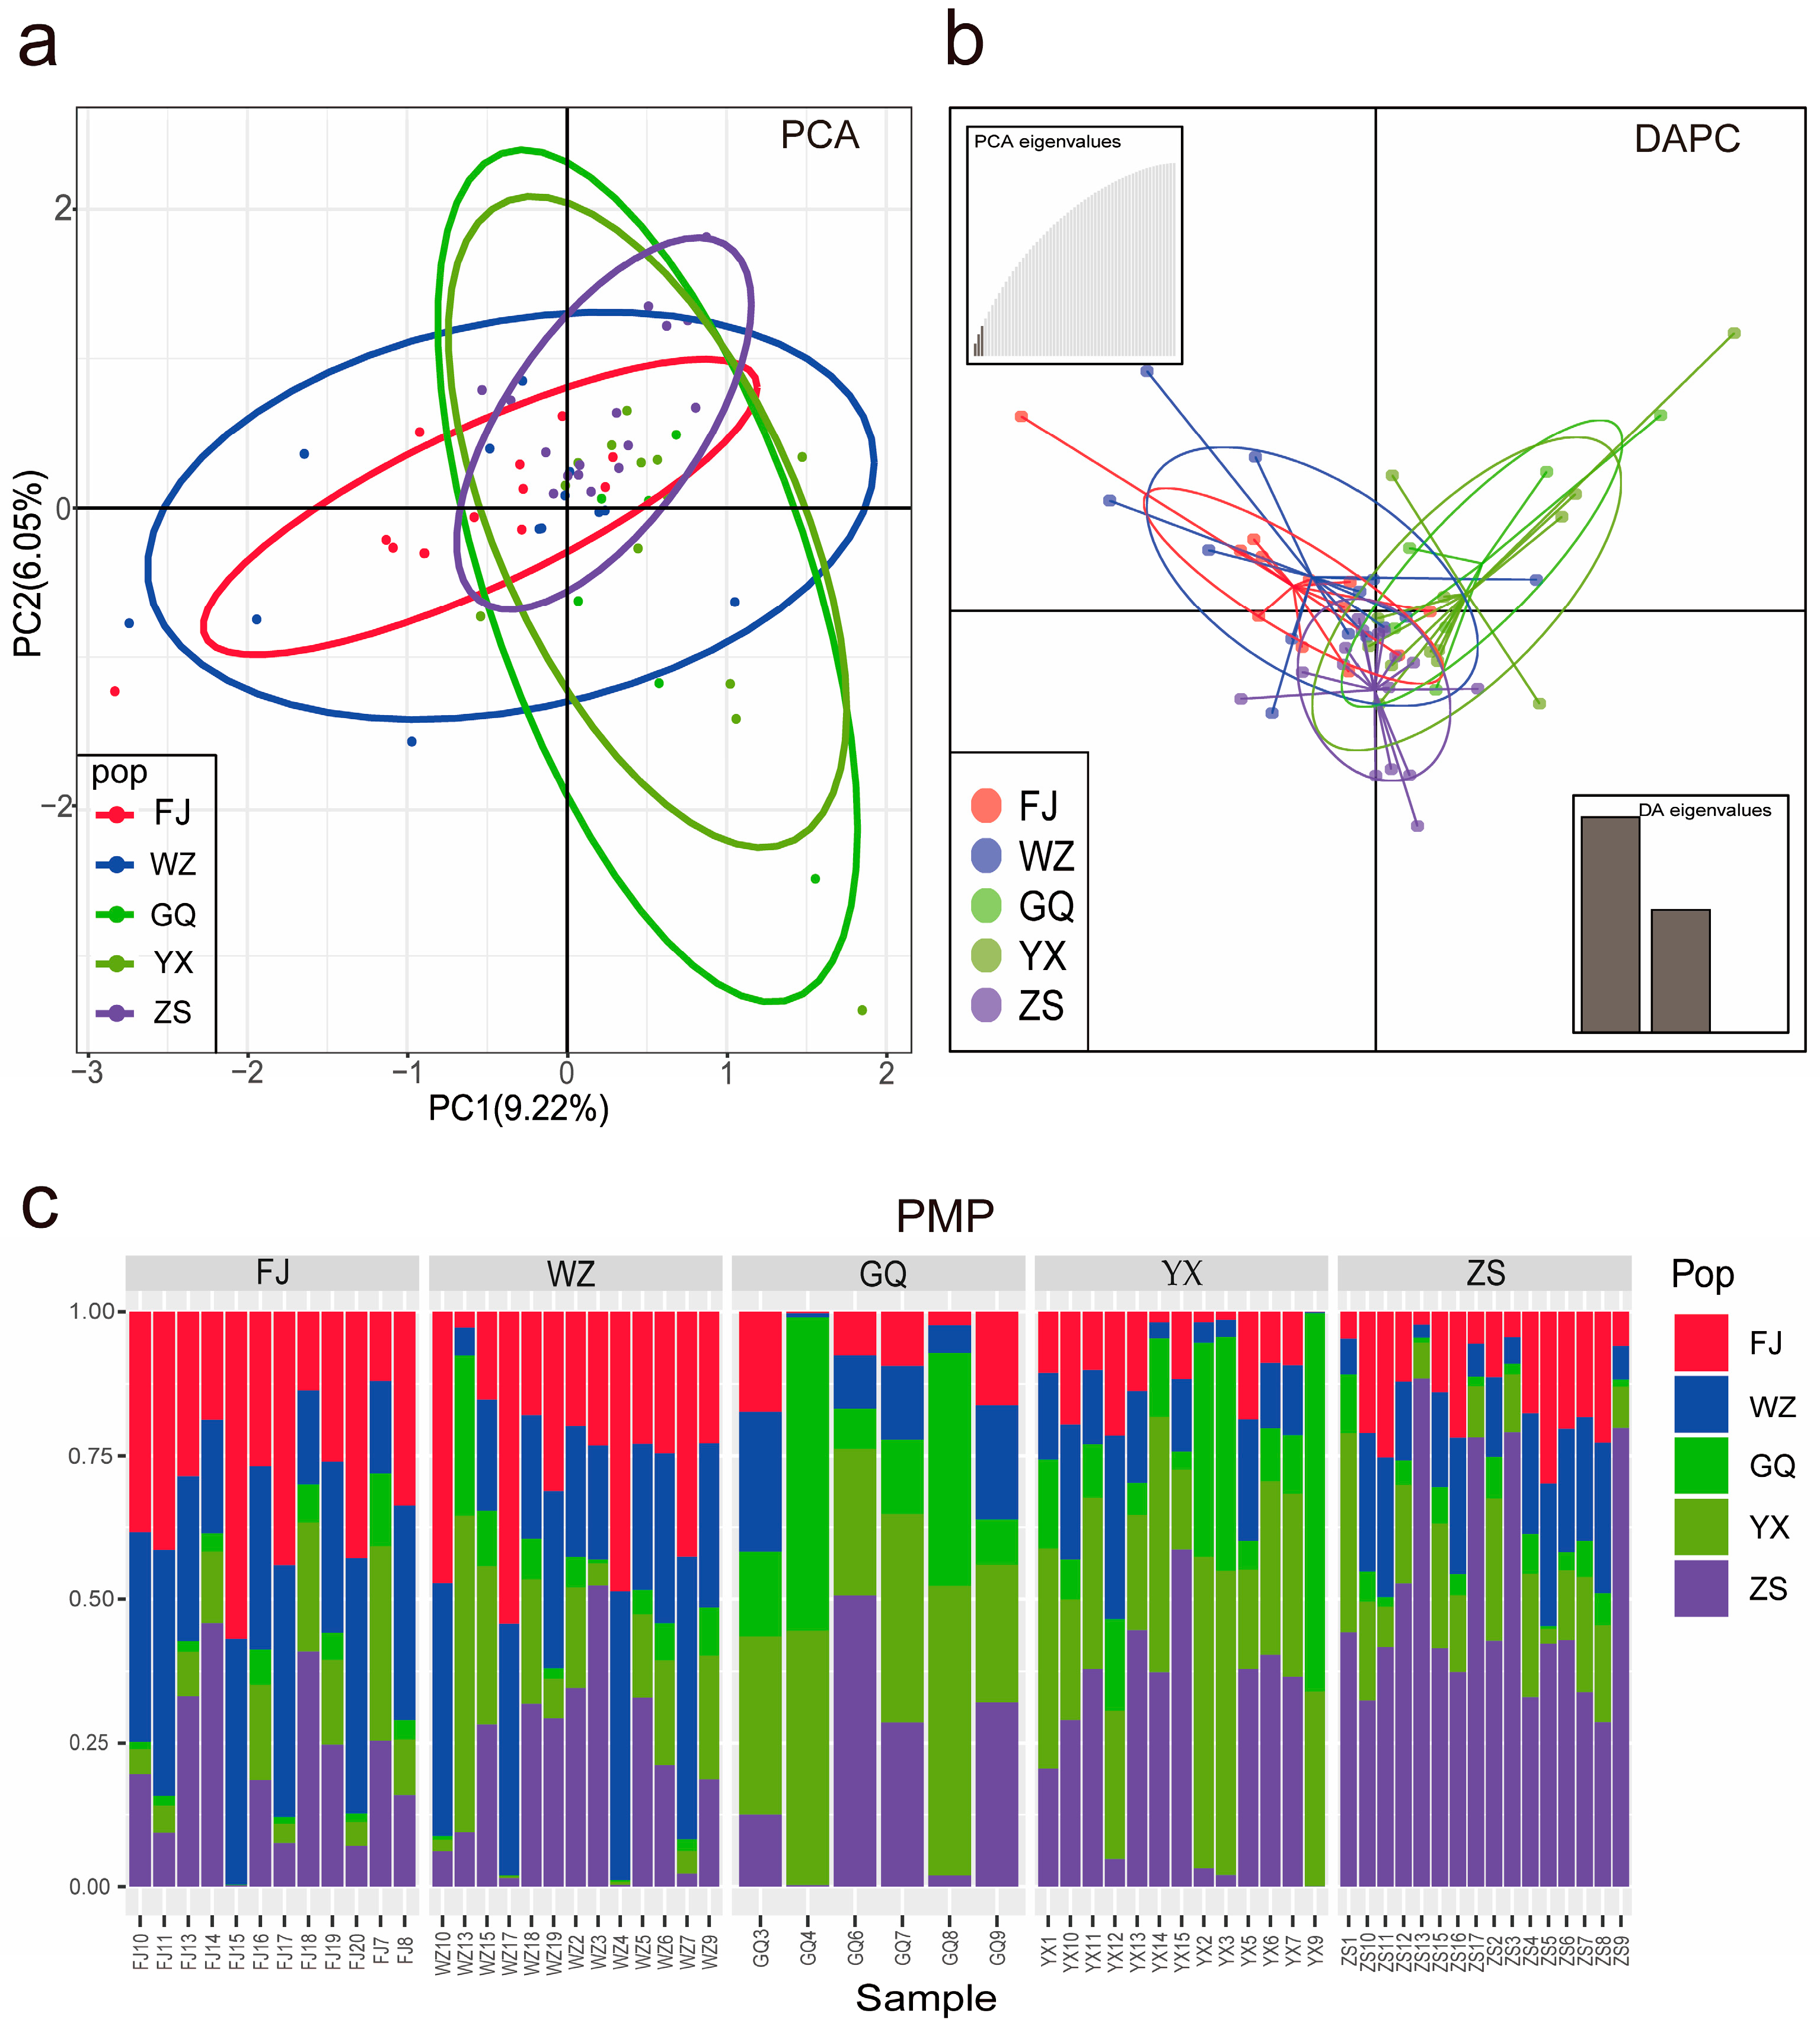
The PCA results showed that the most individuals of A. hyacinthus strongly overlapped each other, indicating low genetic differentiation between populations (Figure 3a). Moreover, the Discriminant Analysis of Principal Components (DAPC) also demonstrated that only one cluster was detected among five populations (K = 1), and almost all individuals overlapped extensively, indicating very close genetic proximity between these populations (Figure 3b). Furthermore, the analysis of posterior membership probability (PMP) supported the results obtained from STRUCTURE analysis and DAPC that one subpopulation had the highest likelihood (Figure 3c).
Genetic differentiation among five populations was also assessed using FST pairwise comparisons. As shown in Table 2, pairwise FST values ranged 0.04196 (ZS-YX) to 0.07755 (FJ-GQ). Moreover, pairwise Nm calculating results based on FST demonstrated a moderate degree of gene flow among all populations (Nm > 1), which could serve to homogenize the gene pools (Table 2).

3.1.3. Demographic History

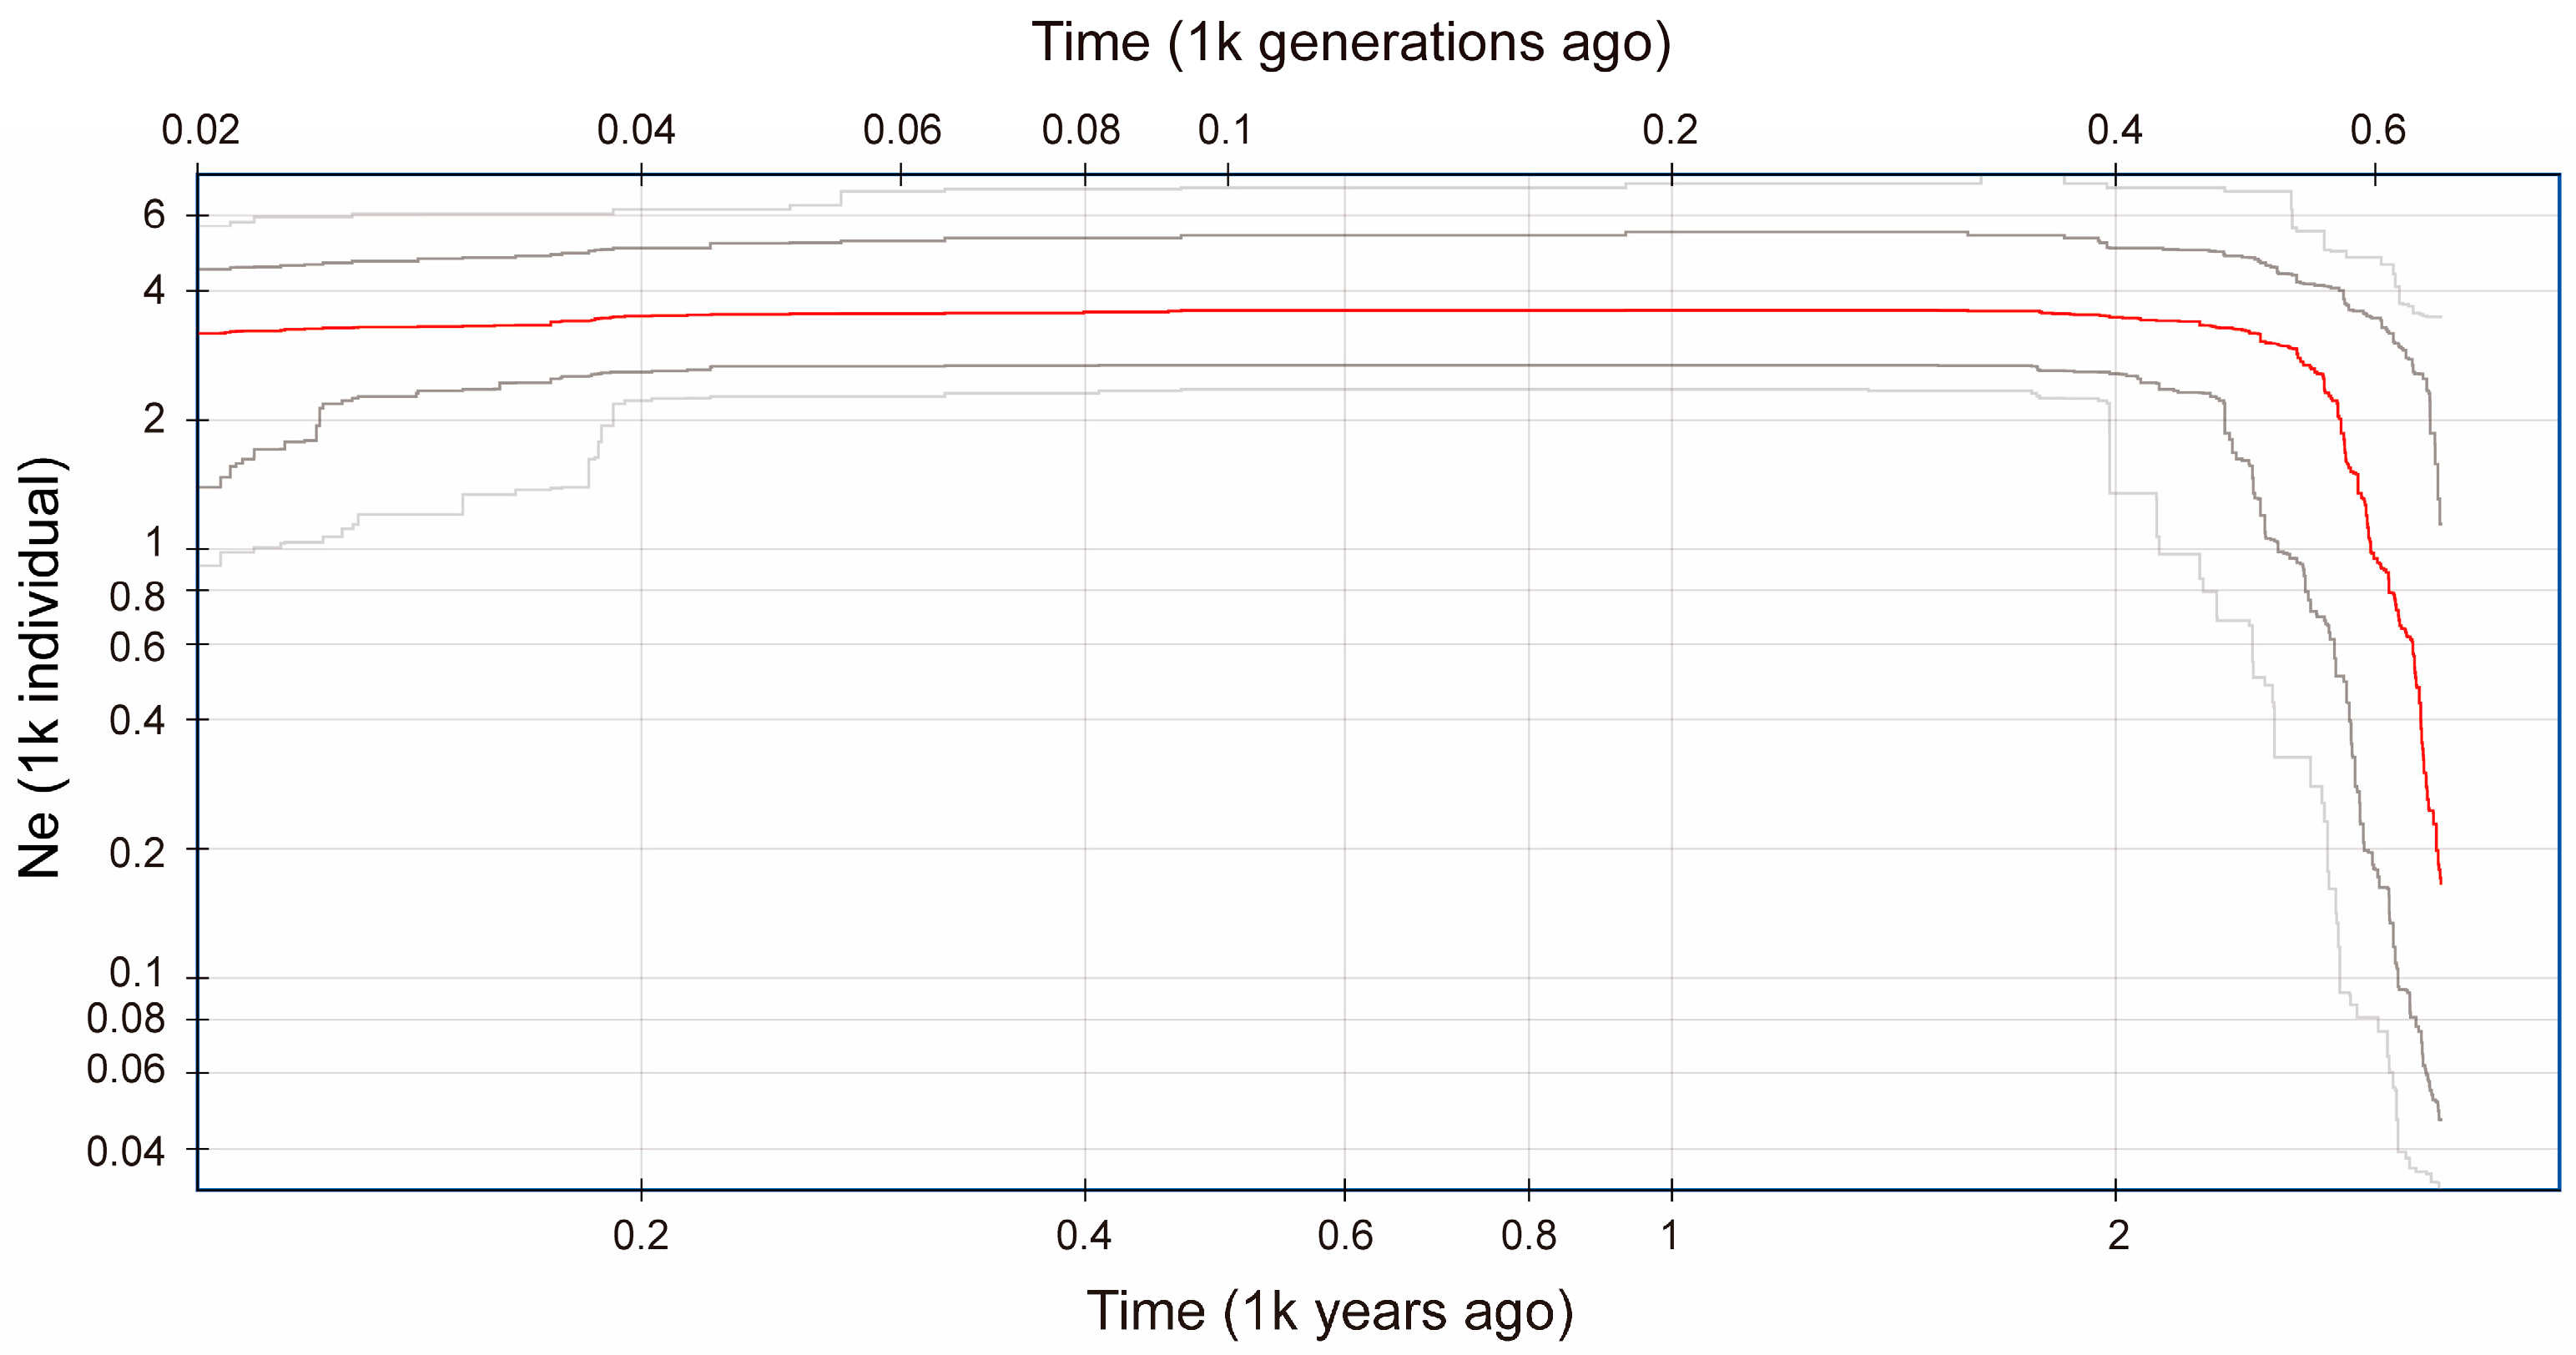
Based on the site frequency spectrum of the 748 variant sites, the effective population size (Ne) of A. hyacinthus was estimated to have expanded quickly since ca. 2700 years ago (YA), reaching a maximum level of 1000 YA, and then started to continuously decrease 300 years ago (Figure 4).

3.2. Mitochondrial Putative Control Region Sequences

3.2.1. Sequence Data

BLAST search in BioEdit v7.2.6.1 obtained mtCR sequences (except for one FJ3 sample, 97%) with high matches (>98%) to the mitochondrion complete genome of A. hyacinthus deposited in GenBank (KF448531.1). After sequence editing, alignment, and trimming, a dataset of 456-bp long mtCR sequence was constructed from 74 samples of A. hyacinthus in the SCS. In addition, 54 mtCR sequences (456-bp) from A. hyacinthus in the Taiwan region and 51 sequences (456-bp) from Japan were jointly used for the genetic diversity and population structure analyses.

3.2.2. Phylogenetic Analysis

To identify the genetic lineages of A. hyacinthus in the SCS, we first performed a phylogenetic analysis based on the mtCR sequences that we obtained, combined with sequences of HyaC (48 samples) and HyaD (105 samples) of the Taiwan region and Japan. The result showed that the ML tree consisted of four clades, and the vast majority of individuals from the SCS were clustered together in clade I, gathering 32 individuals of HyaD and 13 individuals of HyaC obtained from the Taiwan region and Japan. In addition, clade II exclusively consisted of 56 individuals of HyaD and ZS6 sample of the SCS and showed a close phylogenetic relationship with clade I. Clade III and clade IV were composed of the remaining individuals of HyaC and HyaD (Figure 5). Thus, we inferred that individuals of A. hyacinthus from the SCS have a close phylogenetic relationship with HyaD from the Taiwan region and Japan. We further compared the level of genetic diversity and analyzed the population structure of A. hyacinthus in the SCS in conjunction with individuals of HyaD from the Taiwan region and Japan.

3.2.3. Genetic Diversity

A total of four haplotypes with 14 polymorphic sites were detected from the mtCR sequences of 74 samples in the SCS. Among them, two haplotypes were region-specific haplotypes, and two haplotypes were common among populations. For instance, Hap_2 and Hap_4 were specific haplotypes of FJ and ZS populations, respectively. In addition, Hap_1 and Hap_3 were shared among more than two populations, especially Hap_1 existed in each population, accounting for 93.24% of all sampled individuals. Results of haplotype and nucleotide diversity showed Hd ranged from 0.292–0.295 and Pi ranged from 0.00293–0.00332, while WZ, YX, and GQ were 0 (Table 3). When sequences obtained from the Taiwan region and Japan were included for analysis, 10 haplotypes with 19 polymorphic sites were identified (Table 3). Compared with populations from the SCS, populations of the Taiwan region and Japan showed a relatively high haplotype diversity (ranging from 0.600–0.837 and 0.658–0.782, respectively) and high nucleotide diversity (ranging from 0.01338–0.01642 and 0.01152–0.01514, respectively). More specifically, the genetic diversity of the Taiwan region was slightly higher than Japan populations in terms of haplotype and nucleotide diversity.

3.2.4. Population Structure

AMOVA based on mtCR showed no genetic differentiation between populations of inshore and offshore sites in the SCS (ΦCT = −0.02152, p > 0.05). Genetic variation was almost explained by variance within populations (100.78%) (p > 0.05). Additionally, AMOVA based on the combination of the dataset of the SCS vs. Taiwan region revealed that there was significant genetic differentiation among populations and within populations (ΦSC/ST > 0.05, p < 0.05), and most variation resided within populations (81.73%, p < 0.05). Similarly, analysis based on the dataset of the SCS vs. Japan also showed significant genetic differentiation among populations and within populations (ΦSC/ST > 0.05, p < 0.05), and most variation resided within populations (77.50%, p < 0.05) (Table 4).
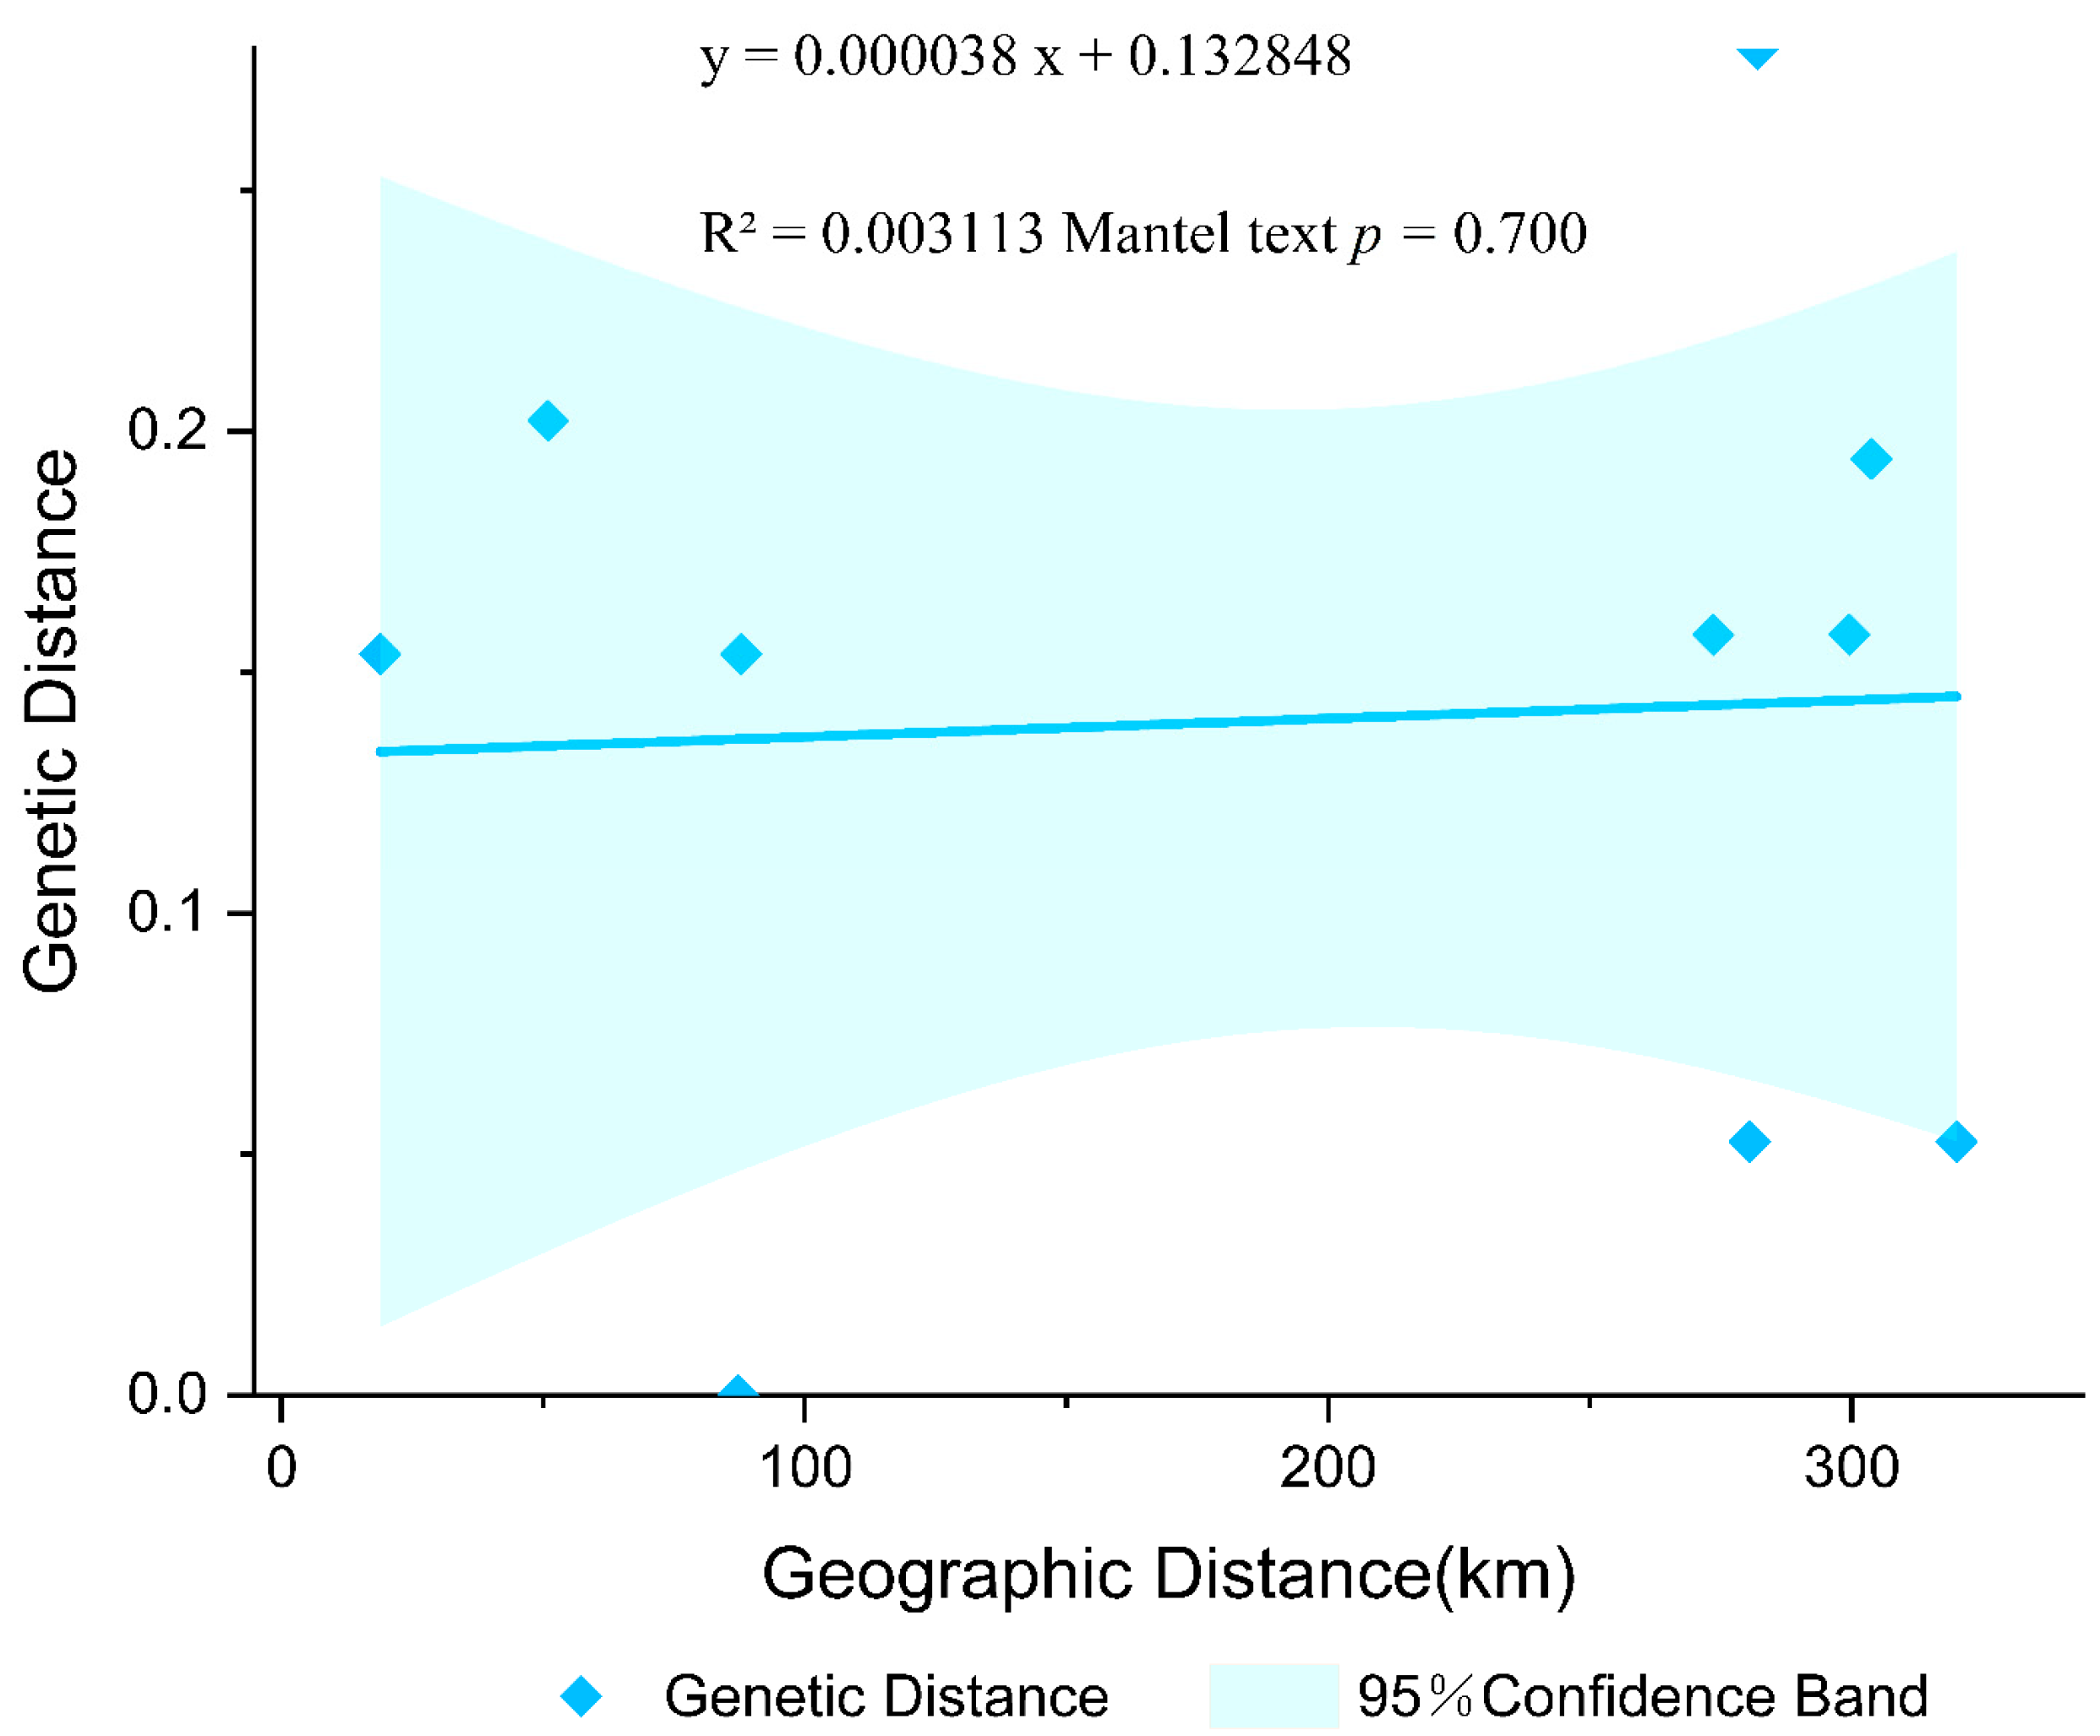
All pairwise FST values (ranging from −0.047 to 0.499) between five populations in the SCS were low and non-significant (p > 0.05), indicating that there was a low degree of genetic differentiation among all detected populations in the SCS (Table 5). The correlation between geographical distance (km) vs. pairwise genetic distance did not reveal any patterns of isolation by distance for populations (Mantel test, R2 = 0.003113, p > 0.05; Figure 6). Interestingly, pairwise FST values were high (FST > 0.25; Table 5), and significant population differentiation resided in most pairwise comparisons between the SCS vs. Taiwan region and the SCS vs. Japan, except for the pairwise comparison of San-ZS and San-GQ.

4. Discussion

4.1. The Lineages of A. hyacinthus Used in This Study

In this study, the genetic homogeneity among the five populations in the SCS was demonstrated based on 748 SNPs, with no population structure observed, suggesting that these A. hyacinthus populations we examined likely constitute a single subpopulation. Moreover, phylogenetic analysis based on the mtCR sequences further showed that the HyaD population in the Taiwan region and Japan were genetically close to populations we detected in the SCS, indicating this subpopulation in the SCS was likely the HyaD population.

4.2. Genetic Structure and Connectivity

In the present study, the AMOVA results calculated based on mtCR did not show significant genetic differentiation between inshore and offshore sites, which was consistent with the calculated low pairwise FST (Table 4). In addition, the results based on SNPs were consistent with the mtCR sequences, which showed the genetic homogeneity between five populations and no population structure existed. The Mantel test results based on mtCR showed there was no significant correlation between the geographical distance and genetic distance of the five A. hyacinthus populations (Figure 6), and all calculated Nm values based on SNPs were higher than 1, suggesting that the lack of genetic structure in A. hyacinthus populations might be due to strong gene flow. This was similar to the conclusion found by Huang et al. that the gene flow level of the adjacent populations of Porites lutea in the SCS was high [49].
The level of genetic differentiation or genetic homogeneity of a population is influenced by many factors, such as larval dispersal capabilities, present-day physical oceanographic features, and historical events [50,51,52,53]. Reef-building corals mainly have two kinds of sexual reproduction strategies, broadcast spawning and brooding [54]. For most broadcasting corals, planktonic larvae could swim freely for a relatively long time, even longer than 70 days [16], while brooded larvae could settle in 1–2 days after leaving the parent body [55]. In addition, A. hyacinthus of hermaphroditic broadcast spawning usually has a very high fecundity, with its larvae maintaining a settlement competency for an extended period [14,16]. It was speculated that the high yield and strong migration ability of the coral larvae contribute to the strong connectivity among the populations of A. hyacinthus in the SCS. However, more detailed information on the duration of the larval (pre-settlement) phase of A. hyacinthus is needed to draw robust conclusions. Furthermore, the South China Sea, the marginal sea of the northwestern Pacific Ocean, has a special geographical location and a complex marine dynamic process. The surface currents in the SCS are changed by the monsoonal winds, which flow from southwest to northeast in summer (about mid-May to mid-September) and reverse direction in winter (about October to mid-March of the next year) [56]. In the SCS, Acropora typically spawn in lunar February and April, but primarily in lunar March [57], coinciding with the period when ocean currents change direction. During this time, the migration direction of coral larvae may be multi-directional, resulting in high genetic homogeneity among populations. Meanwhile, the Kuroshio intrusion through Luzon Strait is known to act as a dispersal barrier to some marine organisms, including Epinephelus fasciatus [58], Tridacna maxima [59], and A. hyacinthus [19]. Thus, we speculated the significant genetic differentiation among populations between the SCS and the Taiwan regions, and Japan mainly due to Kuroshio current, and this was evident in the calculated pairwise FST result (Table 5), which revealed a low level of gene exchange among these reefs.
Furthermore, we speculated that the glacial cycle during the Pleistocene also resulted in a high level of genetic homogeneity and a low level of genetic diversity in the populations we tested in the SCS. The climate change of the Pleistocene glacial/interglacial cycles has influenced the habitats and population size of many marine organisms [60,61]. For example, at the time of the Last Glacial Maximum (LGM), the sea level was about 120–140 m lower than now, large areas of the continental shelf of the SCS (containing sampling locations WZ and FJ) became dry, the SCS became a semi-enclosed bay, connected to the Pacific Ocean only through the Bashi Channel [62]. Therefore, populations from different geographic sites have promoted the mixing under this circumstance. When the interglacial period comes, the climate rebounds, and offsprings of surviving A. hyacinthus could expand from the refuge, thus expanding the range of geographic and demographic. In the present study, the population size has increased sharply since ca. 2700 years ago, which occurred after the Last Glacial Maximum. Thus, we speculated that Glacial–interglacial changes enhance the historical gene flow between populations, while the small population size limited the abundance of genetic variations. A similar conclusion has been obtained in other coral populations of broadcast spawner and other marine animals in the SCS [49,63].

4.3. Low Genetic Diversity and Limited Adaptive Potential of A. hyacinthus in the SCS

The present study is the first population genetics study of A. hyacinthus in the SCS using ddRAD combined with a mitochondrial marker. On the one hand, the lower level of Ho compared with He, indicated the low genetic diversity in populations among inshore and offshore sites based on the result of genome-wide SNP markers (Table 1). However, the genetic diversity (He) ranged from 0.05573 (YX) to 0.08080 (WZ) according to 748 SNPs, which is higher than A. hyacinthus complex from Japan (ranging from 0.0020–0.0045, 2bRAD approach) [64]. This significantly different result was mainly due to the different sequencing methods used (ddRAD vs. 2bRAD) [65]. On the other hand, the mtDNA sequences (mtCR) in the present study revealed low haplotype diversity (mean 0.130 ± 0.053) and nucleotide diversities (mean 0.00134 ± 0.00079), suggesting a generally lower genetic diversity in both inshore and offshore populations of A. hyacinthus in the SCS relative to the populations in the Taiwan region and Japan (Table 3). It was noteworthy that the sympatry of semi-compatible cryptic lineages in Japan raised genetic diversity [19].
The genetic variation of a population represents the ability of a population to change environmental conditions and is important for determining the fitness of a population in its environment [66]. Therefore, for A. hyacinthus, there was relatively lower genetic diversity in the SCS when compared with populations from other northwestern Pacific reefs, indicating that the adaptation potential of this species in the SCS may be relatively low. We hypothesized that the lower level of genetic diversity observed in A. hyacinthus compared with Taiwan regions and Japan is related to the reduction in the effective population size in the SCS (Figure 4). Specifically, destructive fishing, pollution, coastal development, and other human activities in the SCS could be major factors driving the loss of genetic variation among individuals [9]. It was reported that since 1980, the average coverage of coral reefs along the coast of South China and around Hainan Island has decreased from more than 60% to 20% [67]. Although Xisha Island is not open for tourism, the infrastructure construction activities were once very active, and the live coral coverage in Xisha Island decreased by nearly 80% between 1980 and 2008 [59]. As a result, populations substantially reduced from natural levels are unlikely to maintain constant ranges of genetic variability [68]. Another major factor that could lead to low genetic diversity in this study was bleaching events. In recent years, the frequent high-temperature climate has caused moderate to severe bleaching of coral reefs in Nansha Islands, Xisha Islands, southern and northwestern Hainan Island, and Guangxi [69,70,71,72], thus contributing to the decline of reef-building corals. A reduction in population size often leads to a loss of genetic diversity, which reduces reproduction and survival and further reduces population sizes [73,74]. The positive feedback loop between small population size and low genetic diversity, termed “the vortex effect”, may ultimately lead to extinction [75,76].

4.4. Implications for Conserving A. hyacinthus Populations in the SCS

Reef-building corals support crucial ecological roles in coral reef ecosystems and provide a source of income to coastal communities but are under threat and require intervention. The conservation of corals faces mounting challenges, such as the degradation and loss of habitats, climate warming, and pollution. Here, we demonstrated the genetic data to provide considerations for the proper management of an important reef species, A. hyacinthus. The study showed no population structure and a high level of genetic homogeneity. Thus, all A. hyacinthus populations inhabiting the inshore and offshore reefs in the SCS should be managed as a single protection unit when planning conservation strategies. However, the low genetic variations and small population size we detected revealed that the long-term survival of this species in the SCS is at stake. We suggest that the population data collection should be further expanded in the SCS to confirm this conclusion, expand the discovery of cryptic lineages in the A. hyacinthus, and the population dynamic should be closely monitored. In that event, fluctuations and threats of sensitive branch corals, such as the outbreak of crown-of-thorns starfish, could be monitored effectively, and we can adjust conservation strategies accordingly. In addition, effective methods such as large-scale asexual/sexual captive propagation and coral cryobanks should be applied for germplasm resource conservation [77]. Especially, scaling up sexual propagation was identified as one of six priorities to advance coral restoration due to the great potential of improving genetic diversity [78]. For the sexual breeding of A. hyacinthus in the SCS, we recommend that broodstock selection to maximize the genetic diversity and adaptive capacity of populations should be put in first place [79].

5. Conclusions

The present study based on ddRAD sequencing data and mtCR sequences showed Acropora hyacinthus populations in both inshore and offshore sites had high genetic homogeneity, and no genetic structure was observed. Phylogenetic analysis further revealed that individuals from the SCS had a close relationship with HyaD individuals from the Taiwan region and Japan, indicating that individuals of A. hyacinthus inhabiting the five detected sites were likely cryptic species HyaD. However, this study also found that populations of A. hyacinthus in the SCS had low genetic diversity, which is much lower than that in the Taiwan region and Japan. In addition, we also observed that the effective population size of the A. hyacinthus population has been continuously decreasing for the past 300 years, which might be due to human activity disturbance and climate change. Such low genetic variation and reduced population size may critically limit the long-term adaptive potential in the face of ongoing climate change and local stressors. To safeguard the persistence of A. hyacinthus in the SCS, conservation strategies must prioritize the enhancement and maintenance of genetic diversity. We recommend (i) implementing long-term monitoring of population dynamics and threats; (ii) searching for more cryptic species and assessing the feasibility exploration of hybridization between them; (iii) scaling up sexual propagation efforts, which have high potential to increase genetic variation; (iv) selecting genetically diverse and locally adapted broodstock for breeding programs; and (v) establishing and expanding coral cryobanks to preserve germplasm resources for future restoration. Integrating these strategies into regional reef management plans will be critical for sustaining the adaptive capacity and long-term survival of A. hyacinthus in the SCS.

Supplementary Materials

The following supporting information can be downloaded at https://www.mdpi.com/article/10.3390/oceans6040072/s1, Table S1: The number of sequence reads retained after preprocessing in each sample based on the ddRAD sequencing data; Table S2: Accession number corresponding to each location extracted from GenBank.

Author Contributions

All authors contributed to the study’s conception and design. The samples were collected by J.K., X.L. (Xiangbo Liu), J.L., Y.R., D.H. and R.C. Material preparation and data collection were performed by Y.D., L.Z. and S.M. The first draft of the manuscript was written by Y.D., and Y.Z. designed this study. X.L. (Xiubao Li) framed the research and carried out supervision and funding acquisition. All authors have read and agreed to the published version of the manuscript.

Funding

This research was funded by the National Natural Science Foundation of China (42306124 and 42161144006 or 3511/21) and the Innovative Talent Foundation of Hainan Province (KJRC2023C39).

Institutional Review Board Statement

The Research Ethics Committee has confirmed that no ethical approval is required.

Data Availability Statement

All mtCR sequence data were deposited at NCBI GenBank under the following accession number: PQ671336-PQ671409. ddRAD raw data was deposited to the NCBI SRA database with BioProject PRJNA1193811.

Acknowledgments

We were grateful to our instructors and all members of the laboratory for their constructive suggestions and technical support.

Conflicts of Interest

All authors have no relevant financial or non-financial interests to disclose.

References

  1. Nakajima, Y.; Nishikawa, A.; Iguchi, A.; Sakai, K. Gene Flow and Genetic Diversity of a Broadcast-Spawning Coral in Northern Peripheral Populations. PLoS ONE 2010, 5, e11149. [Google Scholar] [CrossRef]
  2. Elliff, C.I.; Silva, I.R. Coral Reefs as the First Line of Defense: Shoreline Protection in Face of Climate Change. Mar. Environ. Res. 2017, 127, 148–154. [Google Scholar] [CrossRef]
  3. Reaka, M.L.; Lombardi, S.A. Hotspots on Global Coral Reefs. In Biodiversity Hotspots: Distribution and Protection of Conservation Priority Areas; Zachos, F.E., Habel, J.C., Eds.; Springer: Berlin/Heidelberg, Germany, 2011; pp. 471–501. ISBN 978-3-642-20992-5. [Google Scholar]
  4. Huang, D.; Licuanan, W.Y.; Hoeksema, B.W.; Chen, C.A.; Ang, P.O.; Huang, H.; Lane, D.J.W.; Vo, S.T.; Waheed, Z.; Affendi, Y.A.; et al. Extraordinary Diversity of Reef Corals in the South China Sea. Mar. Biodivers. 2015, 45, 157–168. [Google Scholar] [CrossRef]
  5. Taguchi, T.; Tagami, E.; Mezaki, T.; Vacarizas, J.M.; Canson, K.L.; Avila, T.N.; Bataan, D.A.U.; Tominaga, A.; Kubota, S. Karyotypic Mosaicism and Molecular Cytogenetic Markers in the Scleractinian Coral Acropora pruinosa Brook, 1982 (Hexacorallia, Anthozoa, Cnidaria). Coral Reefs 2020, 39, 1415–1425. [Google Scholar] [CrossRef]
  6. Tuwo, A.; Tresnati, J. Coral Reef Ecosystem. In Advances in Biological Sciences and Biotechnology; Integrated Publications: Delhi, India, 2021; pp. 75–104. ISBN 978-81-945787-5-8. [Google Scholar]
  7. Xiao, J.; Wang, W.; Wang, X.; Tian, P.; Niu, W. Recent Deterioration of Coral Reefs in the South China Sea Due to Multiple Disturbances. PeerJ 2022, 10, e13634. [Google Scholar] [CrossRef]
  8. McCook, L.; Almany, G.; Berumen, M.; Day, J.; Green, A.; Jones, G.; Leis, J.; Planes, S.; Russ, G.; Sale, P.; et al. Management under Uncertainty: Guide-Lines for Incorporating Connectivity into the Protection of Coral Reefs. Coral Reefs 2009, 28, 353–366. [Google Scholar] [CrossRef]
  9. Hughes, T.P.; Huang, H.; Young, M.A.L. The Wicked Problem of China’s Disappearing Coral Reefs. Conserv. Biol. 2013, 27, 261–269. [Google Scholar] [CrossRef]
  10. Zhao, M.; Yu, K.; Zhang, Q.; Shi, Q.; Price, G.J. Long-Term Decline of a Fringing Coral Reef in the Northern South China Sea. J. Coast. Res. 2012, 28, 1088–1099. [Google Scholar] [CrossRef]
  11. Shi, Q.; Liu, G.H.; Yan, H.Q.; Zhang, H.L. Black Disease (Terpios Hoshinota): A Probable Cause for the Rapid Coral Mortality at the Northern Reef of Yongxing Island in the South China Sea. Ambio 2012, 41, 446–455. [Google Scholar] [CrossRef]
  12. Liu, X.; Zhu, W.; Chen, R.; Rinkevich, B.; Shafir, S.; Xia, J.; Zhu, M.; Chen, R.; Wang, A.; Li, X. Framed Reef Modules: A New and Cost-Effective Tool for Coral Restoration. Restor. Ecol. 2024, 32, e13997. [Google Scholar] [CrossRef]
  13. Boström-Einarsson, L.; Babcock, R.C.; Bayraktarov, E.; Ceccarelli, D.; Cook, N.; Ferse, S.C.A.; Hancock, B.; Harrison, P.; Hein, M.; Shaver, E.; et al. Coral Restoration—A Systematic Review of Current Methods, Successes, Failures and Future Directions. PLoS ONE 2020, 15, e0226631. [Google Scholar] [CrossRef]
  14. Kenyon, J.C. Models of Reticulate Evolution in the Coral Genus Acropora Based on Chromosome Numbers: Parallels with Plants. Evolution 1997, 51, 756–767. [Google Scholar] [CrossRef]
  15. Jamodiong, E.A.; Maboloc, E.A.; Villanueva, R.D.; Cabaitan, P.C. Gametogenesis and Inter-Annual Variability in the Spawning Pattern of Acropora hyacinthus in Northwestern Philippines. Zool. Stud. 2018, 57, e46. [Google Scholar] [CrossRef]
  16. Leinbach, S.E.; Speare, K.E.; Rossin, A.M.; Holstein, D.M.; Strader, M.E. Energetic and Reproductive Costs of Coral Recovery in Divergent Bleaching Responses. Sci. Rep. 2021, 11, 23546. [Google Scholar] [CrossRef]
  17. Randall, C.J.; Giuliano, C.; Stephenson, B.; Whitman, T.N.; Page, C.A.; Treml, E.A.; Logan, M.; Negri, A.P. Larval Precompetency and Settlement Behaviour in 25 Indo-Pacific Coral Species. Commun. Biol. 2024, 7, 142. [Google Scholar] [CrossRef]
  18. Ladner, J.T.; Palumbi, S.R. Extensive Sympatry, Cryptic Diversity and Introgression throughout the Geographic Distribution of Two Coral Species Complexes. Mol. Ecol. 2012, 21, 2224–2238. [Google Scholar] [CrossRef]
  19. Suzuki, G.; Keshavmurthy, S.; Hayashibara, T.; Wallace, C.C.; Shirayama, Y.; Chen, C.A.; Fukami, H. Genetic Evidence of Peripheral Isolation and Low Diversity in Marginal Populations of the Acropora hyacinthus Complex. Coral Reefs 2016, 35, 1419–1432. [Google Scholar] [CrossRef]
  20. Ssg, I.N.L. “Acropora Hyacinthus” IUCN Red List of Threatened Species, 2023. Available online: https://www.iucnredlist.org (accessed on 31 July 2025).
  21. Henry, J.A.; O’Neil, K.L.; Pilnick, A.R.; Patterson, J.T. Strategies for Integrating Sexually Propagated Corals into Caribbean Reef Restoration: Experimental Results and Considerations. Coral Reefs 2021, 40, 1667–1677. [Google Scholar] [CrossRef]
  22. López-Nandam, E.H.; Payne, C.Y.; Delbeek, J.C.; Dunker, F.; Krol, L.; Larkin, L.; Lev, K.; Ross, R.; Schaeffer, R.; Yong, S.; et al. Kinship and Genetic Variation in Aquarium-Spawned Acropora hyacinthus Corals. Front. Mar. Sci. 2022, 9, 961106. [Google Scholar] [CrossRef]
  23. Aguirre, J.D.; Marshall, D.J. Genetic Diversity Increases Population Productivity in a Sessile Marine Invertebrate. Ecology 2012, 93, 1134–1142. [Google Scholar] [CrossRef]
  24. Schweinsberg, M.; González-Pech, R.; Tollrian, R.; Lampert, K. Transfer of Intracolonial Genetic Variability through Gametes in Acropora hyacinthus Corals. Coral Reefs 2014, 33, 77–87. [Google Scholar] [CrossRef]
  25. Shinzato, C.; Khalturin, K.; Inoue, J.; Zayasu, Y.; Kanda, M.; Kawamitsu, M.; Yoshioka, Y.; Yamashita, H.; Suzuki, G.; Satoh, N. Eighteen Coral Genomes Reveal the Evolutionary Origin of Acropora Strategies to Accommodate Environmental Changes. Mol. Biol. Evol. 2021, 38, 16–30. [Google Scholar] [CrossRef]
  26. Huang, W.; Chen, Y.; Wu, Q.; Feng, Y.; Wang, Y.; Lu, Z.; Chen, J.; Chen, B.; Xiao, Z.; Meng, L.; et al. Reduced Genetic Diversity and Restricted Gene Flow of Broadcast-Spawning Coral Galaxea fascicularis in the South China Sea Reveals Potential Degradation under Environmental Change. Mar. Pollut. Bull. 2023, 193, 115147. [Google Scholar] [CrossRef]
  27. Wu, Q.; Huang, W.; Chen, B.; Yang, E.; Meng, L.; Chen, Y.; Li, J.; Huang, X.; Liang, J.; Yap, T.-K.; et al. Genetic Structure of Turbinaria Peltata in the Northern South China Sea Suggest Insufficient Genetic Adaptability of Relatively High-Latitude Scleractinian Corals to Environment Stress. Sci. Total. Environ. 2021, 775, 145775. [Google Scholar] [CrossRef]
  28. Li, M.; Huang, W.; Wu, Q.; Feng, Y.; Chen, Y.; Yu, K.; Chen, B.; Yang, E.; Meng, L.; Huang, X.; et al. High Genetic Differentiation and Moderate Genetic Diversity of the Degenerative Branching Coral Pocillopora verrucosa in the Tropical South China Sea. Sci. Total. Environ. 2022, 819, 153076. [Google Scholar] [CrossRef]
  29. Lord, K.S.; Lesneski, K.C.; Buston, P.M.; Davies, S.W.; D’Aloia, C.C.; Finnerty, J.R. Rampant Asexual Reproduction and Limited Dispersal in a Mangrove Population of the Coral Porites divaricata. Proc. R. Soc. B 2023, 290, 20231070. [Google Scholar] [CrossRef]
  30. Pääbo, S.; Wilson, A.C. Polymerase Chain Reaction Reveals Cloning Artefacts. Nature 1988, 334, 387–388. [Google Scholar] [CrossRef]
  31. Peterson, B.K.; Weber, J.N.; Kay, E.H.; Fisher, H.S.; Hoekstra, H.E. Double Digest RADseq: An Inexpensive Method for de Novo SNP Discovery and Genotyping in Model and Non-Model Species. PLoS ONE 2012, 7, e37135. [Google Scholar] [CrossRef]
  32. Catchen, J.; Hohenlohe, P.A.; Bassham, S.; Amores, A.; Cresko, W.A. Stacks: An Analysis Tool Set for Population Genomics. Mol. Ecol. 2013, 22, 3124–3140. [Google Scholar] [CrossRef]
  33. Li, H.; Handsaker, B.; Wysoker, A.; Fennell, T.; Ruan, J.; Homer, N.; Marth, G.; Abecasis, G.; Durbin, R.; 1000 Genome Project Data Processing Subgroup. The Sequence Alignment/Map Format and SAMtools. Bioinformatics 2009, 25, 2078–2079. [Google Scholar] [CrossRef]
  34. Pritchard, J.K.; Stephens, M.; Donnelly, P. Inference of Population Structure Using Multilocus Genotype Data. Genetics 2000, 155, 945–959. [Google Scholar] [CrossRef]
  35. Earl, D.A.; vonHoldt, B.M. STRUCTURE HARVESTER: A Website and Program for Visualizing STRUCTURE Output and Implementing the Evanno Method. Conserv. Genet. Resour. 2012, 4, 359–361. [Google Scholar] [CrossRef]
  36. Zn, K.; Jf, T.; Nj, G. Poppr: An R Package for Genetic Analysis of Populations with Clonal, Partially Clonal, and/or Sexual Reproduction. PeerJ 2014, 2, e281. [Google Scholar] [CrossRef]
  37. Jombart, T. Adegenet: A R Package for the Multivariate Analysis of Genetic Markers. Bioinformatics 2008, 24, 1403–1405. [Google Scholar] [CrossRef]
  38. Slatkin, M.; Barton, N.H. A Comparison of Three Indirect Methods for Estimating Average Levels of Gene Flow. Evolution 1989, 43, 1349–1368. [Google Scholar] [CrossRef]
  39. Liu, X.; Fu, Y.-X. Stairway Plot 2: Demographic History Inference with Folded SNP Frequency Spectra. Genome Biol. 2020, 21, 280. [Google Scholar] [CrossRef]
  40. Fuller, Z.; Mocellin, V.; Morris, L.; Cantin, N.; Shepherd, J.; Sarre, L.; Peng, J.; Liao, Y.; Pickrell, J.; Andolfatto, P.; et al. Population Genetics of the Coral Acropora millepora: Toward Genomic Prediction of Bleaching. Science 2020, 369, eaba4674. [Google Scholar] [CrossRef] [PubMed]
  41. Tamura, K.; Stecher, G.; Kumar, S. MEGA11: Molecular Evolutionary Genetics Analysis Version 11. Mol. Biol. Evol. 2021, 38, 3022–3027. [Google Scholar] [CrossRef] [PubMed]
  42. Swindell, S.R.; Plasterer, T.N. SEQMAN. In Sequence Data Analysis Guidebook; Swindell, S.R., Ed.; Springer: Totowa, NJ, USA, 1997. [Google Scholar] [CrossRef]
  43. Librado, P.; Rozas, J. DnaSP v5: A Software for Comprehensive Analysis of DNA Polymorphism Data. Bioinformatics 2009, 25, 1451–1452. [Google Scholar] [CrossRef] [PubMed]
  44. Excoffier, L.; Laval, G.; Schneider, S. Arlequin (Version 3.0): An Integrated Software Package for Population Genetics Data Analysis. Evol. Bioinform. Online 2007, 1, 47–50. [Google Scholar] [CrossRef]
  45. Peakall, R.; Smouse, P.E. GenAlEx 6.5: Genetic Analysis in Excel. Population Genetic Software for Teaching and Research—An Update. Bioinformatics 2012, 28, 2537–2539. [Google Scholar] [CrossRef]
  46. Nguyen, L.-T.; Schmidt, H.A.; von Haeseler, A.; Minh, B.Q. IQ-TREE: A Fast and Effective Stochastic Algorithm for Estimating Maximum-Likelihood Phylogenies. Mol. Biol. Evol. 2015, 32, 268–274. [Google Scholar] [CrossRef]
  47. Lanfear, R.; Calcott, B.; Ho, S.Y.W.; Guindon, S. Partitionfinder: Combined Selection of Partitioning Schemes and Substitution Models for Phylogenetic Analyses. Mol. Biol. Evol. 2012, 29, 1695–1701. [Google Scholar] [CrossRef]
  48. Puechmaille, S.J. The Program Structure Does Not Reliably Recover the Correct Population Structure When Sampling Is Uneven: Subsampling and New Estimators Alleviate the Problem. Mol. Ecol. Resour. 2016, 16, 608–627. [Google Scholar] [CrossRef]
  49. Huang, W.; Li, M.; Yu, K.; Wang, Y.; Li, J.; Liang, J.; Luo, Y.; Huang, X.; Qin, Z.; Wang, G.; et al. Genetic Diversity and Large-Scale Connectivity of the Scleractinian Coral Porites lutea in the South China Sea. Coral Reefs 2018, 37, 1259–1271. [Google Scholar] [CrossRef]
  50. van der Ven, R.M.; Triest, L.; De Ryck, D.J.R.; Mwaura, J.M.; Mohammed, M.S.; Kochzius, M. Population Genetic Structure of the Stony Coral Acropora tenuis Shows High but Variable Connectivity in East Africa. J. Biogeogr. 2016, 43, 510–519. [Google Scholar] [CrossRef]
  51. van der Ven, R.M.; Heynderickx, H.; Kochzius, M. Differences in Genetic Diversity and Divergence between Brooding and Broadcast Spawning Corals across Two Spatial Scales in the Coral Triangle Region. Mar. Biol. 2021, 168, 17. [Google Scholar] [CrossRef]
  52. Li, J.-J.; Hu, Z.-M.; Gao, X.; Sun, Z.-M.; Choi, H.-G.; Duan, D.-L.; Endo, H. Oceanic Currents Drove Population Genetic Connectivity of the Brown Alga Sargassum Thunbergii in the North-West Pacific. J. Biogeogr. 2017, 44, 230–242. [Google Scholar] [CrossRef]
  53. Tisthammer, K.H.; Forsman, Z.H.; Toonen, R.J.; Richmond, R.H. Genetic Structure Is Stronger across Human-Impacted Habitats than among Islands in the Coral Porites lobata. PeerJ 2020, 8, e8550. [Google Scholar] [CrossRef] [PubMed]
  54. Ward, S. Evidence for Broadcast Spawning as Well as Brooding in the Scleractinian Coral Pocillopora damicornis. Mar. Biol. 1992, 112, 641–646. [Google Scholar] [CrossRef]
  55. Knittweis, L.; Kraemer, W.E.; Timm, J.; Kochzius, M. Genetic Structure of Heliofungia Actiniformis (Scleractinia: Fungiidae) Populations in the Indo-Malay Archipelago: Implications for Live Coral Trade Management Efforts. Conserv. Genet. 2009, 10, 241–249. [Google Scholar] [CrossRef]
  56. Hu, J.; Kawamura, H.; Hong, H.; Qi, Y. A Review on the Currents in the South China Sea: Seasonal Circulation, South China Sea Warm Current and Kuroshio Intrusion. J. Oceanogr. 2000, 56, 607–624. [Google Scholar] [CrossRef]
  57. Sun, Y.; Zhang, Y.; Jiang, L.; Yu, X.; Huang, L.; Yuan, T.; Yang, J.; Lian, J.; Liu, C.; Ang, P.; et al. Coral Spawning Patterns on the Luhuitou Fringing Reef in Hainan Island of the Northern South China Sea. Front. Mar. Sci. 2024, 11, 1418942. [Google Scholar] [CrossRef]
  58. Kuriiwa, K.; Chiba, S.N.; Motomura, H.; Matsuura, K. Phylogeography of Blacktip Grouper, Epinephelus Fasciatus (Perciformes: Serranidae), and Influence of the Kuroshio Current on Cryptic Lineages and Genetic Population Structure. Ichthyol. Res. 2014, 61, 361–374. [Google Scholar] [CrossRef]
  59. Neo, M.L.; Liu, L.-L.; Huang, D.; Soong, K. Thriving Populations with Low Genetic Diversity in Giant Clam Species, Tridacna Maxima and Tridacna Noae, at Dongsha Atoll, South China Sea. Reg. Stud. Mar. Sci. 2018, 24, 278–287. [Google Scholar] [CrossRef]
  60. Kennett, J.P.; Ingram, B.L. A 20,000-Year Record of Ocean Circulation and Climate Change from the Santa Barbara Basin. Nature 1995, 377, 510–514. [Google Scholar] [CrossRef]
  61. Bond, G.; Showers, W.; Cheseby, M.; Lotti, R.; Almasi, P.; deMenocal, P.; Priore, P.; Cullen, H.; Hajdas, I.; Bonani, G. A Pervasive Millennial-Scale Cycle in North Atlantic Holocene and Glacial Climates. Science 1997, 278, 1257–1266. [Google Scholar] [CrossRef]
  62. Wang, P. Response of Western Pacific Marginal Seas to Glacial Cycles: Paleoceanographic and Sedimentological Features1. Mar. Geol. 1999, 156, 5–39. [Google Scholar] [CrossRef]
  63. Yan, S.; Catanese, G.; Brown, C.; Wang, M.; Yang, C.; Yang, T. Phylogeographic Study on the Chub Mackerel (Scomber Japonicus) in the Northwestern Pacific Indicates the Late Pleistocene Population Isolation. Mar. Ecol. 2015, 36, 753–765. [Google Scholar] [CrossRef]
  64. Fifer, J.E.; Yasuda, N.; Yamakita, T.; Bove, C.B.; Davies, S.W. Genetic Divergence and Range Expansion in a Western North Pacific Coral. Sci. Total Environ. 2022, 813, 152423. [Google Scholar] [CrossRef]
  65. Robledo, D.; Palaiokostas, C.; Bargelloni, L.; Martínez, P.; Houston, R. Applications of Genotyping by Sequencing in Aquaculture Breeding and Genetics. Rev. Aquacult. 2018, 10, 670–682. [Google Scholar] [CrossRef] [PubMed]
  66. Abdul-Rahman, F.; Tranchina, D.; Gresham, D. Fluctuating Environments Maintain Genetic Diversity through Neutral Fitness Effects and Balancing Selection. Mol. Biol. Evol. 2021, 38, 4362–4375. [Google Scholar] [CrossRef]
  67. Yu, K. Coral Reefs in the South China Sea: Their Response to and Records on Past Environmental Changes. Sci. China Earth Sci. 2012, 55, 1217–1229. [Google Scholar] [CrossRef]
  68. McManus, J. The Spratly Islands: A Marine Park Alternative. Naga–ICLARM Quart. 1992, 15, 4–8. [Google Scholar]
  69. Li, S.; Yu, K.; Chen, T.; Shi, Q.; Zhang, H. Assessment of Coral Bleaching Using Symbiotic Zooxanthellae Density and Satellite Remote Sensing Data in the Nansha Islands, South China Sea. Chin. Sci. Bull. 2011, 56, 1031–1037. [Google Scholar] [CrossRef]
  70. Li, X.; Liu, S.; Huang, H.; Huang, L.; Jing, Z.; Zhang, C. Coral Bleaching Caused by an Abnormal Water Temperature Rise at Luhuitou Fringing Reef, Sanya Bay, China. Aquat. Ecosyst. Health Manage. 2012, 15, 227–233. [Google Scholar] [CrossRef]
  71. Zhu, W.; Xia, J.; Ren, Y.; Xie, M.; Yin, H.; Liu, X.; Huang, J.; Zhu, M.; Li, X. Coastal Corals during Heat Stress and Eutrophication: A Case Study in Northwest Hainan Coastal Areas. Mar. Pollut. Bull. 2021, 173, 113048. [Google Scholar] [CrossRef]
  72. Lyu, Y.; Zhou, Z.; Zhang, Y.; Chen, Z.; Deng, W.; Shi, R. The Mass Coral Bleaching Event of Inshore Corals Form South China Sea Witnessed in 2020: Insight into the Causes, Process and Consequence. Coral Reefs 2022, 41, 1351–1364. [Google Scholar] [CrossRef]
  73. Lacy, R.C. Importance of Genetic Variation to the Viability of Mammalian Populations. J. Mammal. 1997, 78, 320–335. [Google Scholar] [CrossRef]
  74. Frankham, R. Genetics and Extinction. Biol. Conserv. 2005, 126, 131–140. [Google Scholar] [CrossRef]
  75. Peters, R.L. Conservation Biology: The Science of Scarcity and Diversity. Ecol. Restor. 1987, 5, 23–24. [Google Scholar] [CrossRef]
  76. Hughes, A.R.; Inouye, B.D.; Johnson, M.T.J.; Underwood, N.; Vellend, M. Ecological Consequences of Genetic Diversity. Ecol. Lett. 2008, 11, 609–623. [Google Scholar] [CrossRef] [PubMed]
  77. Toh, E.-C.; Liu, K.-L.; Tsai, S.; Lin, C. Cryopreservation and Cryobanking of Cells from 100 Coral Species. Cells 2022, 11, 2668. [Google Scholar] [CrossRef] [PubMed]
  78. Vardi, T.; Hoot, W.; Levy, J.; Shaver, E.; Winters, R.S.; Banaszak, A.; Baums, I.; Chamberland, V.; Cook, N.; Gulko, D.; et al. Six Priorities to Advance the Science and Practice of Coral Reef Restoration Worldwide. Restor. Ecol. 2021, 29, e13498. [Google Scholar] [CrossRef]
  79. Banaszak, A.T.; Marhaver, K.L.; Miller, M.W.; Hartmann, A.C.; Albright, R.; Hagedorn, M.; Harrison, P.L.; Latijnhouwers, K.R.W.; Mendoza Quiroz, S.; Pizarro, V.; et al. Applying Coral Breeding to Reef Restoration: Best Practices, Knowledge Gaps, and Priority Actions in a Rapidly-Evolving Field. Restor. Ecol. 2023, 31, e13913. [Google Scholar] [CrossRef]
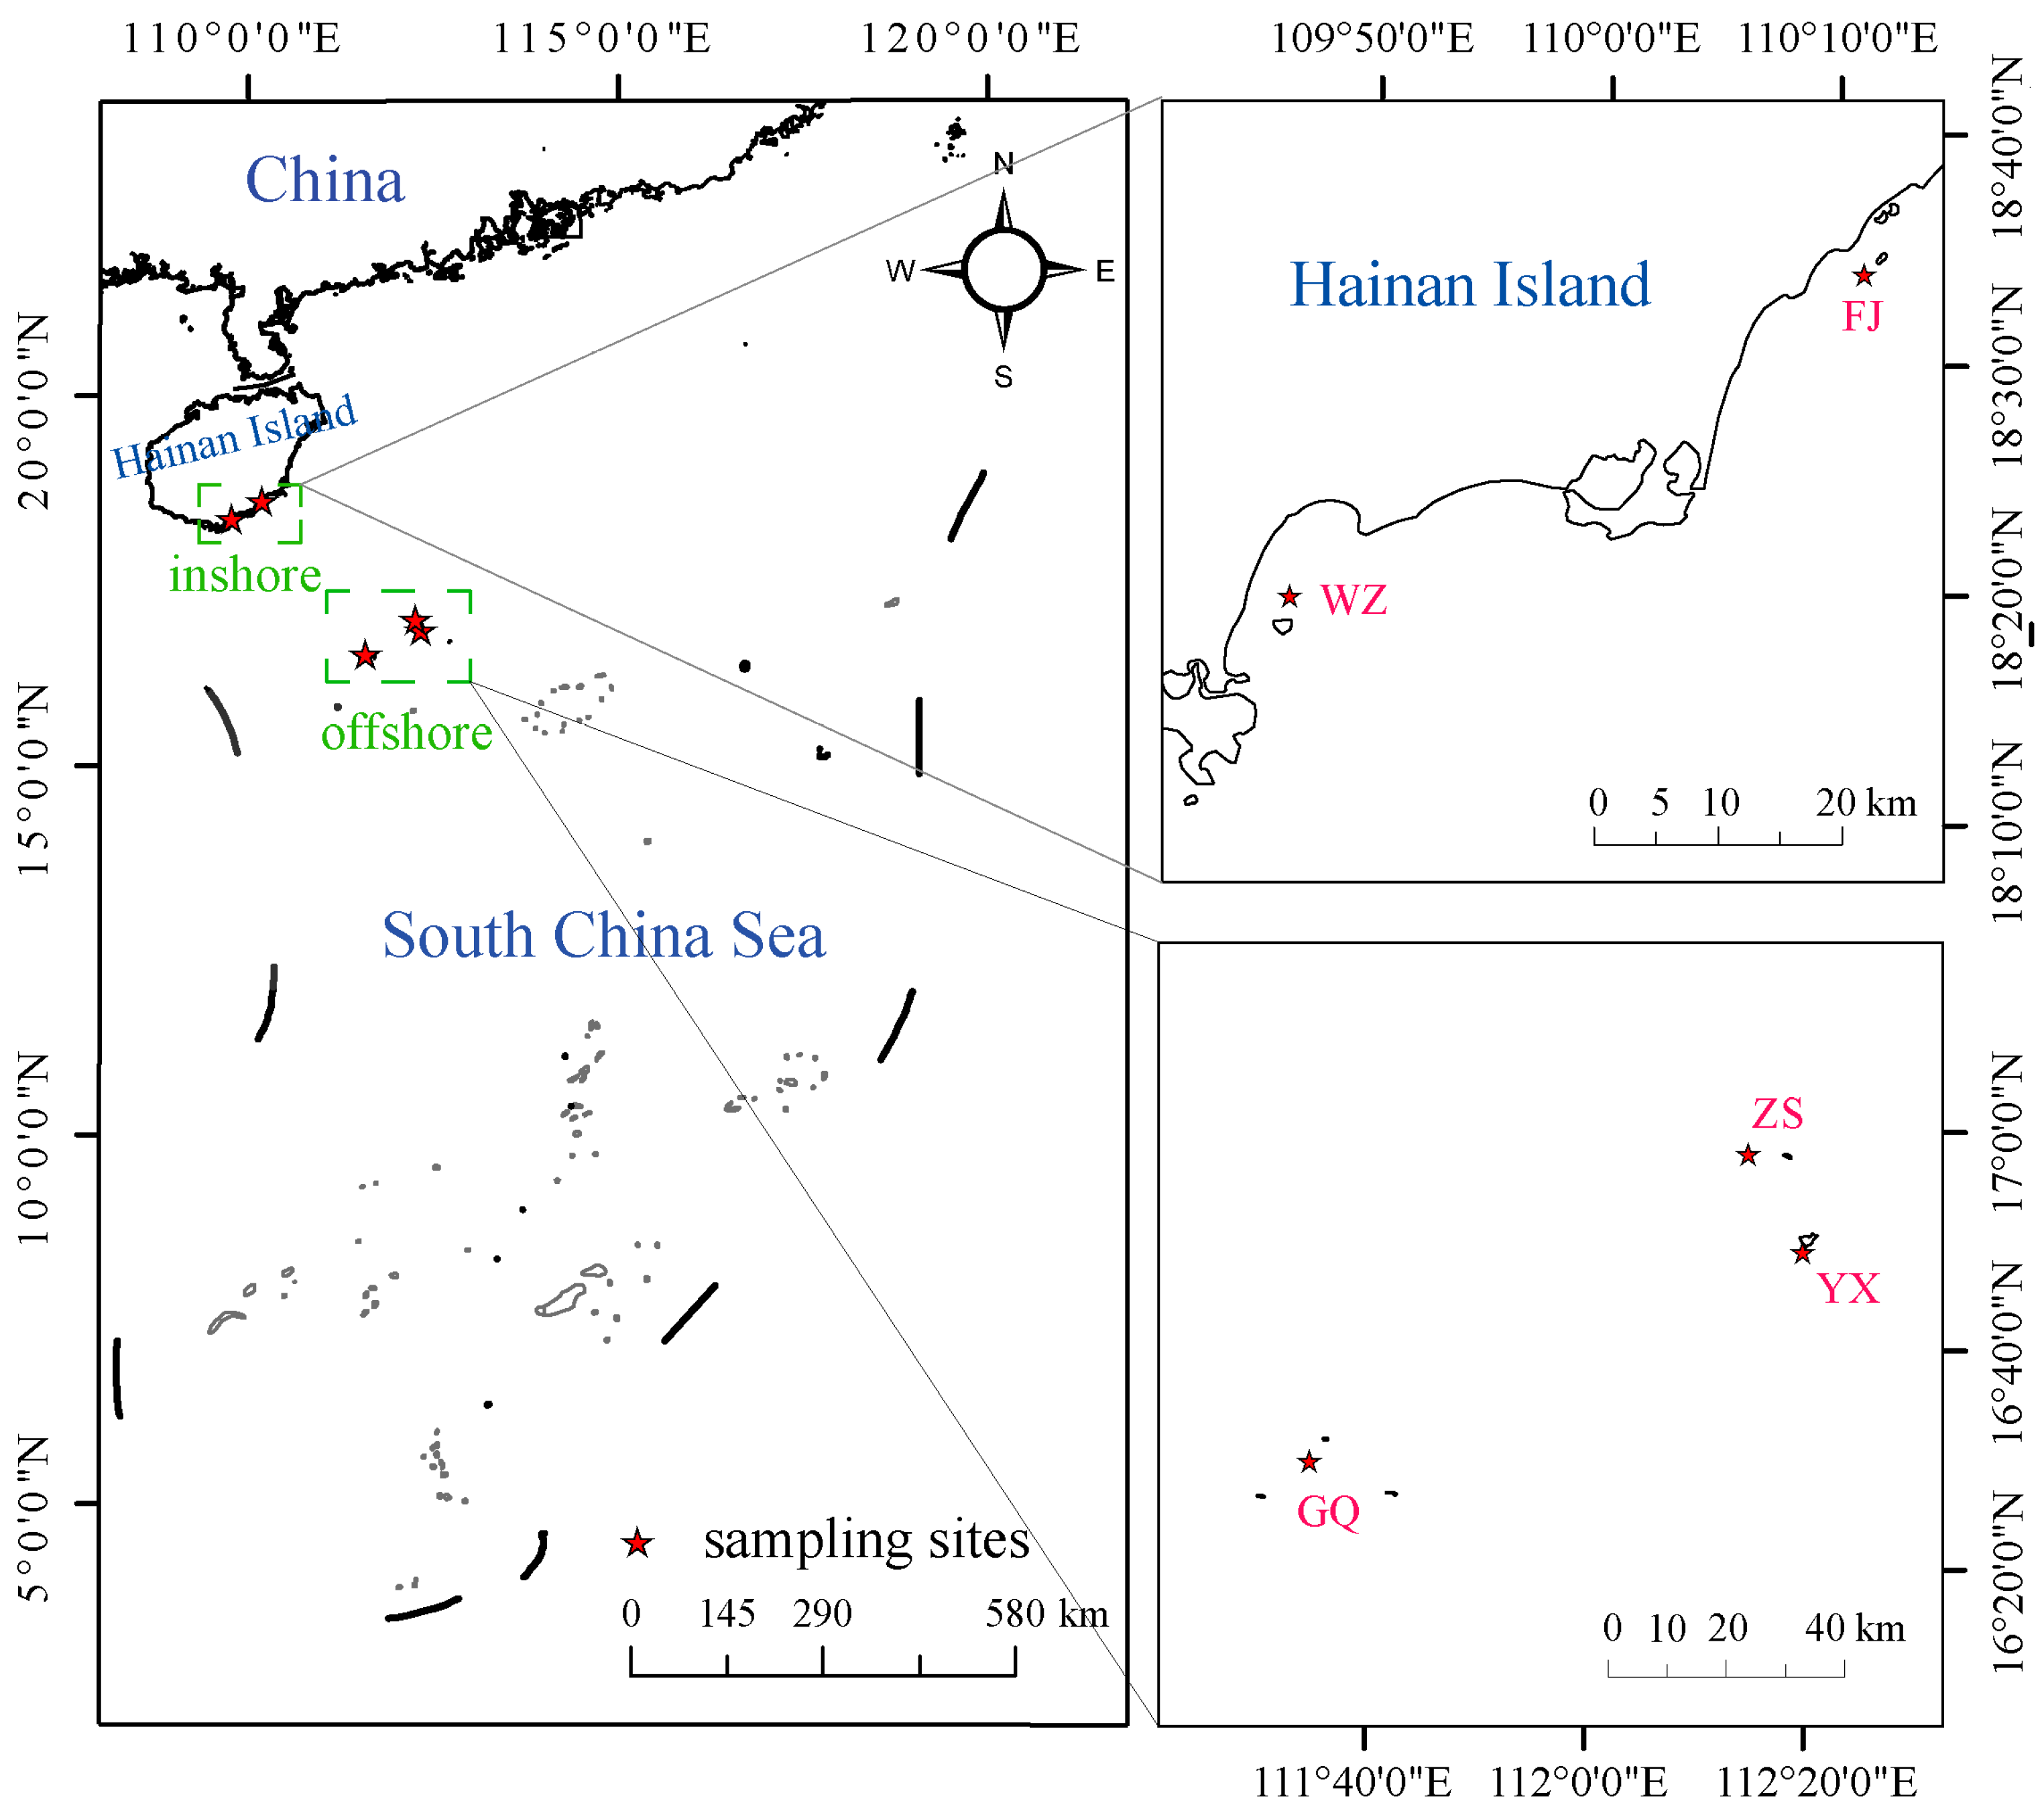
Figure 1. The map of the study locations indicates the sampling sites. WZ, Wuzhizhou Island (18.3333° N, 109.7667° E); YX, Yongxing Island (16.8167° N, 112.3333° E); FJ, Fenjiezhou Island (18.5667° N, 110.1833° E); ZS, Zhaoshu Island (16.9667° N, 112.2500° E); GQ, Ganquan Island (16.5000° N, 111.5833° E). Basemap: National Catalogue Service for Geographic Information (China).
Oceans 06 00072 g001
Figure 2. Genetic structure of five A. hyacinthus populations based on ddRAD sequencing data (K = 2). (a) Delta K values were determined by Structure Harvester for various numbers of populations assumed (K). (b) Population structure at K = 2.
Oceans 06 00072 g002
Figure 3. Principal components analysis (PCA) and Discriminant analysis of principal components (DAPC). (a) Represent the result of Principal components analysis (PCA). (b) Represent the result of Discriminant analysis of principal components (DAPC). (c) Stacked bar plots showed the posterior assignment probabilities of individuals to their predetermined populations and were constructed using previously calculated DAPC population membership assignments.
Oceans 06 00072 g003
Figure 4. Estimates of the effective population sizes (Ne) of A. hyacinthus. The red line represents the inferred effective population size trajectory based on folded Site Frequency Spectrum, while the gray lines indicate the confidence intervals from multiple simulation results.
Oceans 06 00072 g004
Figure 5. ML tree of mtCR of Acropora hyacinthus in the SCS, the Taiwan region and Japan. The outgroup of the tree was Acropora loripes. Different groups of Acropora hyacinthus samples were indicated by distinct font colors (blue, SCS; green, HyaC; orange, HyaD). Aim_Tai_C, CIB_Tai_C, She_Tai_C, and MIY_Japan_C represent HyaC individuals collected from the Aimen, Chinwan Inner Bay, and Shertaosan Miyako, respectively. Lon_Tai_D, San_Tai_D, Ken_Tai_D, Don_Tai_D, Shi_Japan_D, Yok_Japan_D, and AMA_Japan_D represent HyaD individuals collected from the Londong, Sanshiantai, Kenting, Dongchi, Shirahama, Yokonami, and Amakusa, respectively. The accession numbers for all these DNA sequences are displayed in Table S2.
Oceans 06 00072 g005
Figure 6. Relationship between genetic distance and geographic distance of A. hyacinthus in the SCS based on the mtCR.
Oceans 06 00072 g006
Table 1. Population genetic diversity statistics for ddRAD sequencing data of A. hyacinthus. Pop, populations; N, sampling size; PA, Frequency of private alleles; Ho, Observed heterozygosity; He, Expected heterozygosity; π, Nucleotide diversity; Fis, Inbreeding coefficient.
LocationPOPNPAHoHeπFis
InshoreWZ130.00130.039510.080800.086190.1728
FJ120.00110.038430.072690.077790.1368
OffshoreZS160.00140.030110.060770.063660.1600
YX130.00120.032110.055730.058690.1251
GQ60.00040.049620.065370.076090.0513
Table 2. Pairwise FST values and pairwise Nm values among all five sampling sites across the SCS based on 748 SNPs.
FST/NmFJWZGQYXZS
FJ 5.36042.97374.40384.8909
WZ0.04456 3.64174.49565.2385
GQ0.077550.06424 3.94043.5761
YX0.053720.052680.05966 5.7081
ZS0.048630.045550.065340.04196
Table 3. Genetic diversity estimates from A. hyacinthus populations based on mitochondrial putative control region sequences and Taiwan plus Japan datasets. Pop, populations; N, Number of haplotypes; H, Haplotypes; S, Number of polymorphic sites; Hd, Haplotype diversity; Pi, Nucleotide diversity.
LocationPopNSHd ± SDPi ± SDH
SCS 74140.130 ± 0.0530.00134 ± 0.000794
WZ1900.000 ± 0.0000.00000 ± 0.00000Hap_1 (19)
FJ19110.292 ± 0.1270.00293 ± 0.00217Hap_1 (16) Hap_2 (1)
Hap_3 (2)
ZS1390.295 ± 0.1560.00332 ± 0.00244Hap_1 (11) Hap_3 (1)
Hap_4 (1)
YX1600.000 ± 0.0000.00000 ± 0.00000Hap_1 (16)
GQ700.000 ± 0.0000.00000 ± 0.00000Hap_1 (7)
Taiwan 54190.848 ± 0.0270.01650 ± 0.0007810
Ken19180.743 ± 0.0720.01338 ± 0.00155Hap_1 (8) Hap_3 (1)
Hap_4 (6) Hap_5 (1)
Hap_7 (2) Hap_8 (1)
Don25190.837 ± 0.0420.01642 ± 0.00146Hap_1 (3) Hap_4 (1)
Hap_5 (4) Hap_6 (8)
Hap_7 (1) Hap_9 (4)
Hap_10 (4)
Lon5120.800 ± 0.1640.01542 ± 0.00421Hap_1 (2) Hap_2 (2)
Hap_5 (1)
San5110.600 ± 0.1750.01451 ± 0.00424Hap_1 (3) Hap_6 (2)
Japan 51170.701 ± 0.0320.01336 ± 0.001154
Shi20170.658 ± 0.0650.01383 ± 0.00154Hap_1 (8) Hap_4 (2)
Hap_5 (1) Hap_6 (9)
Yok13170.782 ± 0.0690.01514 ± 0.00270Hap_1 (2) Hap_4 (3)
Hap_5 (3) Hap_6 (5)
AMA18110.699 ± 0.0430.01152 ± 0.00156Hap_1 (6) Hap_4 (5)
Hap_6 (7)
Mean 179190.640 ± 0.0350.01327 ± 0.0007010
Table 4. Analysis of molecular variance (AMOVA) for different groupings based on mtCR sequences in the SCS, the Taiwan region, and Japan (HyaD). ΦCT, variance among groups relative to total variance; ΦSC, variance among within groups; ΦST variance within populations. * Significant values at p < 0.05.
GroupSource of VariationdfSum of SquaresVariance ComponentsPercentage of VariationΦ-Statistics
Inshore vs. OffshoreAmong groups10.131−0.00652 Va−2.15ΦCT = −0.02152
Among populations31.0900.00414 Vb1.37ΦSC = 0.01338
Within populations6921.0770.30546 Vc100.78ΦST = −0.00785
SCS vs. TaiwanAmong groups15.6620.03173 Va3.85ΦCT = 0.03847
Among populations718.5820.11893 Vb14.42ΦSC = 0.14995 *
Within populations123107.8740.67421 Vc81.73ΦST = 0.18265 *
SCS vs. JapanAmong groups16.4900.06006 Va9.47ΦCT = −0.09473
Among populations611.9560.08258 Vb13.02ΦSC = 0.14387 *
Within populations14772.2380.49141 Vc77.50ΦST = 0.22497 *
Table 5. Pairwise FST for mtCR sequences. * Significant values at p < 0.05.
SCSTaiwanJapan
WZFJYXZSGQLonSanKenDonShiYokAMA
WZ
FJ0.02564
YX0.000000.01459
ZS0.04994−0.038740.03465
GQ0.00000−0.047240.00000−0.04111
Lon0.75103 *0.55375 *0.72091 *0.51570 *0.55696 *
San0.57271 *0.34515 *0.53171 *0.229640.331210.20561
Ken0.42739 *0.32991 *0.40294 *0.25139 *0.30311 *0.21738 *−0.07688
Don0.57824 *0.50893 *0.55847 *0.45853 *0.47943 *0.150120.124290.11652 *
Shi0.50473 *0.42003 *0.48116 *0.34618 *0.38530 *0.26786 *−0.08060−0.001610.07601
Yok0.67571 *0.58128 *0.65082 *0.51638 *0.54110 *0.202170.088640.08237−0.045000.02330
AMA0.62061 *0.53066 *0.59775 *0.45619 *0.50280 *0.36387 *−0.011510.021280.08765 *−0.037620.02323
Disclaimer/Publisher’s Note: The statements, opinions and data contained in all publications are solely those of the individual author(s) and contributor(s) and not of MDPI and/or the editor(s). MDPI and/or the editor(s) disclaim responsibility for any injury to people or property resulting from any ideas, methods, instructions or products referred to in the content.