Article

Combining Adequate BRUV Deployment Times with Individual Photo-Identification Improves Monitoring of Shark Populations in the Caribbean

1
Department of Environment, Cayman Islands Government, George Town KY1-1002, Cayman Islands
2
Centre for Marine Biodiversity and Biotechnology, Heriot-Watt University, Edinburgh EH14 4AS, UK
3
Marine Conservation International, South Queensferry, Edinburgh EH30 9WN, UK
4
Faculty of Science and Technology, University of Algarve, Campus de Gambelas, 8000 Faro, Portugal
*
Author to whom correspondence should be addressed.
Oceans 2025, 6(4), 70; https://doi.org/10.3390/oceans6040070
Submission received: 28 July 2025 / Revised: 16 September 2025 / Accepted: 16 October 2025 / Published: 22 October 2025

Abstract

Sharks play a key role in coral reef ecosystems, but Caribbean populations are concerningly low. When monitoring endangered species, it is critical to use minimally invasive tools and protocols that are adequate for local species and the environment. This study investigated the adequate deployment time of baited remote underwater videos (BRUVs) for shark studies in the Cayman Islands and whether the use of photo-identification to recognise individuals (MaxIND) on BRUVs could improve abundance estimates (in comparison to MaxN) and the analysis of shark behaviour. From 2015 to 2018, a total of 557 BRUVs were deployed with recording times ranging from 3.8 to 211.03 min. The results showed that (1) of the total number of individual sharks recorded on videos, 95% of individuals were recorded within the first 110 min (slight variations between species), (2) MaxIND values were 1.1–1.5 times greater than that of MaxN (ratios varying with species) and (3) time of first arrival (Tarrive) was similar for all recorded species but time spent in front of the camera’s field of view (Tvisit) and activity levels (count of entries in camera’s field of view) varied between species. The results provide key information to improve the localised monitoring of rare/endangered species and can inform conservation management.

1. Introduction

The widespread decline in some shark populations globally has been mainly the result of overexploitation and habitat degradation [1,2,3]. Coastal shark populations have been particularly impacted and are concerningly low in the Caribbean compared to some other regions [4,5,6]. This concern has promoted shark conservation in the wider Caribbean [7,8,9,10,11,12] prompted by evidence that the loss of large predators such as sharks may trigger a cascade of effects modifying the entire ecosystem [13,14,15,16,17]. Conservation measures (e.g., quotas, Marine Protected Areas (MPAs) and species protection) can have positive impacts on local shark populations [6,12,18,19,20]. However, for shark conservation management to be effective long-term, it is key to monitor populations with minimally invasive tools and adequate protocols that encompass species-specific behaviour and local environmental settings [21,22,23,24].
Baited remote underwater videos (BRUVs) are a non-invasive approach to studying sharks [18,23,25,26,27,28]. Their numerous benefits, such as being cost-effective, repetitive, having minimal impact on habitat and requiring relatively little manpower, having few deployment constraints and generating statistically robust data [6,24,29,30,31,32], make BRUVs a common research method for studying the diversity and relative abundance of sharks in a range of spatiotemporal scales [6,28,33,34,35].
Various metrics that eliminate double counting [36] are used to estimate relative abundance. The most common metric is MaxN also known as Nmax [9,32,37,38,39], defined as the maximum number of a particular species seen in a single frame during the entire video record [36,38,40]. However, MaxN is considered a conservative estimate of abundance [38,40] that is likely to underestimate abundance at higher levels of true abundance (hyperstability) [24,41,42,43]. Recently this issue has been addressed and MaxIND (or TotN, [24], Nmax-A [18] and IndN [44]), an abundance metric that uses individual photo-identification (photo-ID) [45,46,47,48], has been applied most recently to rays [43] and sharks [27,44].
Individuals on BRUVs are often seen from multiple angles and distances allowing for the detection of distinguishing features for individual identification in some species [18,27,43,49]. Stobart et al. [24] identified lobster (Palinurus elephas) using size, body pattern and damaged antennae and found that MaxIND, unlike MaxN, did not reach saturation at high densities. The use of natural markings (e.g., species-specific spot patterns on the tail and pectoral fins, skin discolorations or scars) and sex to identify individual elasmobranchs on BRUVs found that MaxIND can improve the precision of abundance estimates for rare/endangered species. MaxIND abundance estimates were 1.1–2.5 times greater than MaxN values with ratios varying between species [43,44].
Despite the improved precision of abundance estimates, this approach has not as yet been widely used, partly due to the increased time required for analysis and technological shortcomings such as insufficient resolution of the cameras used (e.g., Sony and Canon camcorders [18,50]), making it unfeasible to distinguish between individuals of the same species [23]. Lately, the affordability of cameras with increased resolution such as GoPros (https://gopro.com/, accessed on 27 July 2025) not only allows for the application of MaxIND but also the study of individual behaviour patterns of sharks on BRUVs.
The adequate recording time of BRUVs can vary depending on the study location [36,37,39,51,52,53,54,55,56]. The adequate recording time for BRUVs in Caribbean ecosystems has not yet been assessed, despite its use to study reef sharks in Belize [18,57,58,59], the Dutch Caribbean [50,60], Turks and Caicos [39], Cuba [57], the Cayman Islands [9,27,28,44] and The Bahamas [23,61,62].
Previous studies have quantified fish and shark behaviour from BRUVs such as T1st or TA (time of first arrival) [39,63], which can vary with the relative distance an individual is from the BRUVs when first deployed [36,41], the attractiveness of the bait [64,65], the olfactory ability of species [66] and/or relative abundance of a species [24,63,67,68]. The notation of the time of entry and of exit of individuals into the camera’s field of view (FOV), TITO (time in—time out, [69] can also be useful to study individual behaviour patterns [39]. At the time of writing, TITO has only been used to derive a value for ‘residency time’ (e.g., total time a species was in close proximity to the unit) but it has also been suggested as an indicator for boldness of a species [69,70,71]. Recently, behaviours such as ‘duration of visit’ (= total time spent in the camera’s FOV) and descriptions of reactions by shark species towards the BRUV unit were reported from the Turks and Caicos [39], but activity level (= number of re-entries into the camera’s FOV) on BRUVs has yet to be studied in detail.
In the Cayman Islands, 18 coastal shark species have been recorded [9,28,72,73,74]. All shark species within Cayman waters are protected by legislative species protection (since 2015) and long-established coastal Marine Protected Areas (MPAs, since 1986) [75]. Despite the conservation measures, it is worth noting that the initial MPAs were designed to protect SCUBA divers from fishing activities in areas with high diving pressure, not to protect areas with high biodiversity (pers. com. John Bothwell, DoE), since when the MPA network has been expanded [75]. Previous research suggested that local sharks are affected by human behaviours such as fishing activities (incidental by-catch), SCUBA diving and boat traffic [72]. Furthermore, it is likely that degradation of the local habitat [76,77,78,79] continues, driven by the culmination of population growth across all three Cayman Islands and the broader impacts of global climate change [80]. While Cayman’s coastal shark populations seem stable, they remain low [27,28,72] and the potential isolation of coastal shark populations at remote locations [34,81,82] makes those in the Cayman Islands particularly vulnerable to local extinctions. Therefore, accurate monitoring of local shark populations is essential to ensure the long-term conservation of these threatened species.
This study aimed to optimise the BRUVs monitoring of coastal shark populations in the Cayman Islands. Non-invasive mono-BRUVs were used to (1) identify the adequate recording time (=time at which 95% of all recorded individual sharks were recorded), (2) examine differences between MaxN and MaxIND and (3) assess species-specific behaviours on BRUVs. It was expected that (1) the optimal recording time exceeds the common practice of 60 min [36], (2) estimates of MaxN and MaxIND would be different from each other and (3) that time of first arrival, duration of visit and activity level would differ between species. The results provide information to enhance monitoring of rare and endangered species in the Cayman Islands and inform conservation management in the wider Caribbean.

2. Materials and Methods

2.1. Study Area

Baited remote underwater videos (BRUVs) were deployed on Grand Cayman (19.3222° N, 81.2409° W) and Little Cayman (19.6897° N, 80.0367° W) from May 2015–November 2018. The three Cayman Islands (Grand Cayman, Little Cayman and Cayman Brac) are located in the western Caribbean Sea with a total land area of 264 km2 (Figure 1). Each island has a narrow coastal shelf (maximum width: 1.5 km) with shallow lagoons and two distinct reef terraces (shallow reef: 5–15 m, deep reef: 16–25 m) leading to almost vertical slopes reaching to more than 2000 m depth [83]. The marine environment is dominated by seagrass beds, fringing mangrove forests, beach rock, sandy bottom and coral reefs including soft coral, hard coral and sponges, that all in turn provide habitat for a diversity of tropical reef fish [79,84,85,86,87,88,89] and sharks [9,72,73,74].
During this study, 45% and 50% of the total coastal shelf on Grand Cayman and Little Cayman, respectively, were protected by MPAs (MPAs were extended in 2021).

2.2. Data Collection

Mono-BRUV units (one horizontally facing camera) were deployed twice a year over a four-year period, 2015–2018 (Table 1) on fore-reef areas (10–25 m depth) and in lagoons (0.5–6 m depth), totalling 21 survey areas (Grand Cayman 13, Little Cayman 8; Table S1). Areas and BRUV sites were selected to reflect the diversity of habitats, geographic areas and protection status (MPA, non-MPA) (Figure 1).
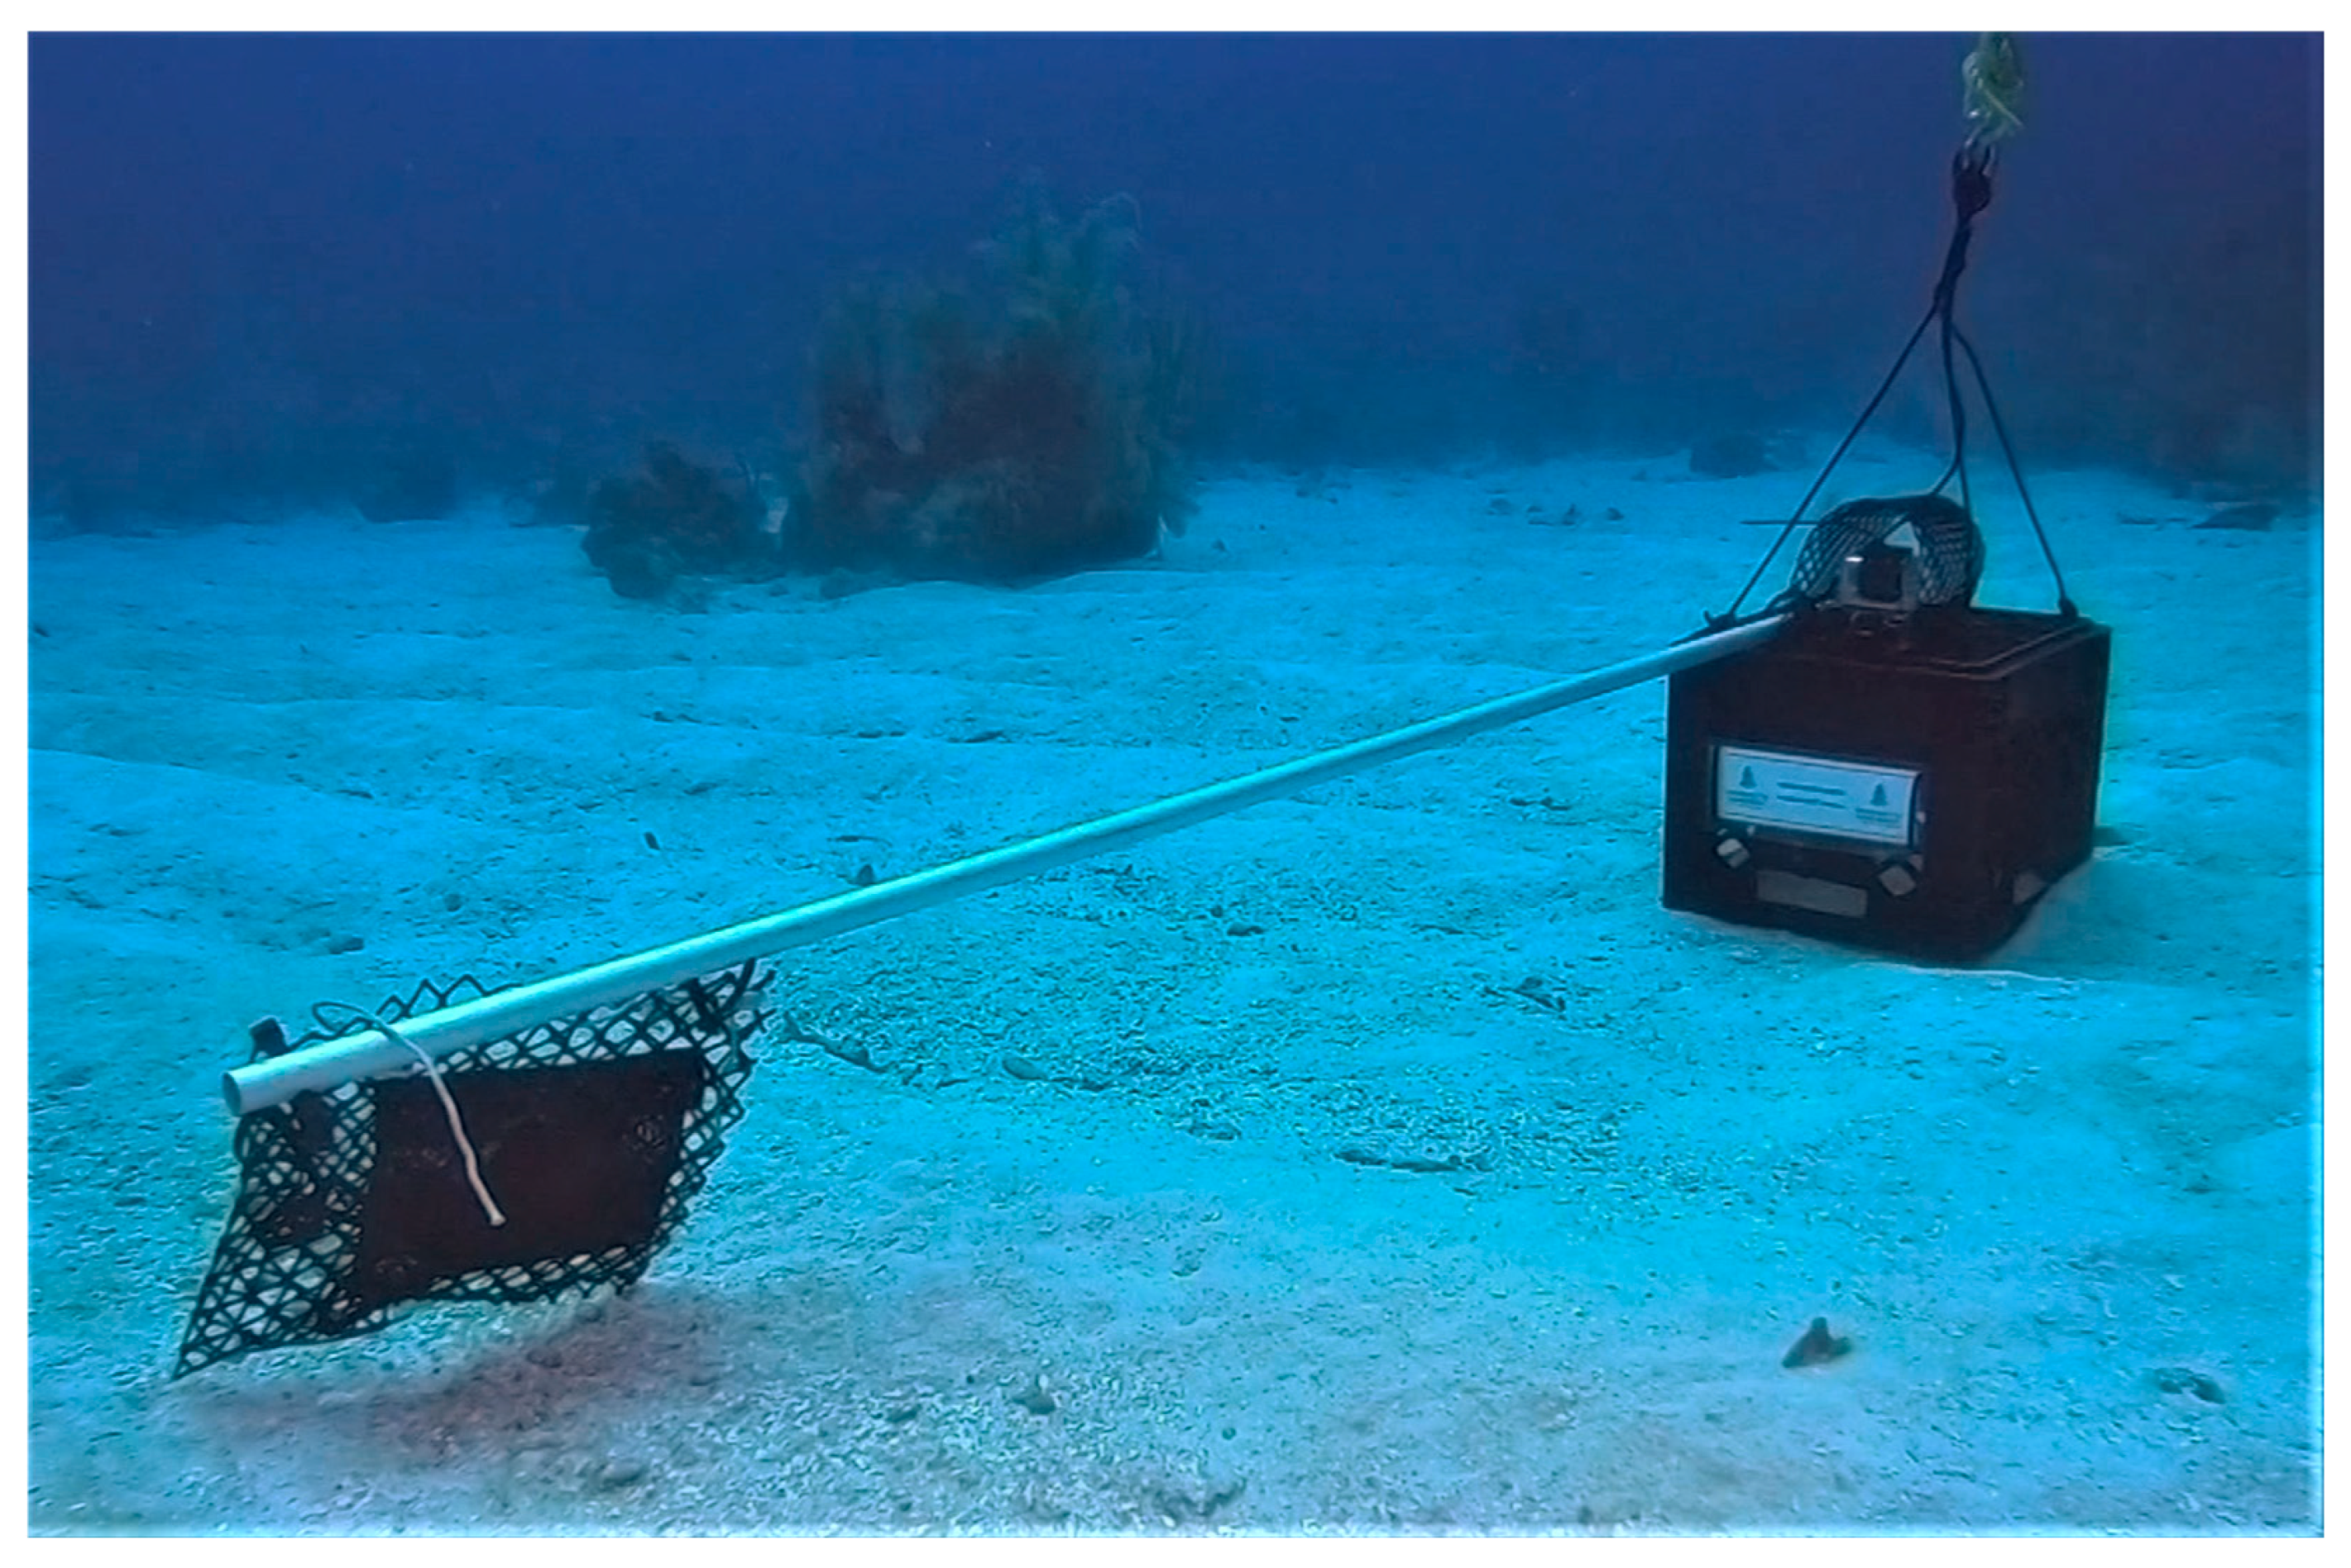
Detailed descriptions of BRUV design and deployment can be viewed in Koher et al. [27]. In brief, an inverted plastic crate, weighted with ~3.5 kg dive weights, to which a GoPro camera (Hero 3 or 4) and a mesh bait bag containing approximately 300 g of sliced Atlantic mackerel (Scomber scombrus) at the end a 1.5 m PVC pole was placed with a rope, that was attached to the unit, onto sandy bottom near reef and marked with a hard surface float (Figure 2).
BRUV deployments were conducted during daylight hours (8:00–17:00). At each deployment, four BRUV units were deployed consecutively, within an approximately 30 min period, each separated by 500–1000 m from the previous one. Fresh bait was used for each BRUV deployment. At each BRUV unit, the date/time, location (latitude/longitude) and depth (m) were recorded from the boat, above the unit, using a watch, handheld GPS (Garmin Ltd., Olathe, KS, USA) and handheld depth sounder (Vexilar Inc., Minneapolis, MN, USA). During recording the boat kept a distance of at least 500 m from all four units to reduce any effects of boat noise and presence on the behaviour of any shark present. Battery packs were used to extend recording times to at least 90 min (or until battery failure or exhaustion of available space on memory card). After a minimum of 2 hrs of recording time was complete, BRUVs were retrieved and cameras removed. All recorded videos (n = 605) were viewed independently by three trained observers using either VLC (version 3.0.21; VideoLAN, Paris, France), Windows media (version 12; Microsoft Corporation, Redmond, WA, USA) or Apple Quick Time player (version 7.7.9; Apple Inc., Cupertino, CA, USA), depending on software availability on laptops or desktop computers.

2.3. Video Analysis

Sharks were identified to species level, where possible. All shark species, except the closely related Caribbean reef shark (Carcharhinus perezi) and blacktip shark (Carcharhinus limbatus), had distinct morphometrics and were easily identified using a reference guide with relevant information from mainly two sources [91,92]. Individuals not identified to species level were excluded from the analysis.

2.3.1. Recording Times

Recording times of each video were defined as the time from when the BRUV unit settled on the seabed until the unit left the seabed or the video recording stopped (i.e., either the battery depleted, or the memory card filled before the BRUV unit was retrieved).

2.3.2. Abundance Metrics: MaxN and MaxIND

For each BRUV deployment, both MaxN and MaxIND were determined for each shark species. MaxN was the maximum number of individuals seen together in a single frame at any one time during the entire video. Individual identification for MaxIND was made through the application of photo-identification (see [27]). Individual sharks were mostly identified by their dorsal fin shape, injuries (or scars) and skin discolouration together with their size and sex [27]. MaxIND was the total count of every individual shark seen during the entire video, regardless of whether an individual could be positively identified (unlike Kohler et al. [27], rejecting individuals marked as “no ID possible”). Counting every individual recorded on videos, provided it was clear that the shark was a different individual even if it was not clear which one, intended to obtain the best estimate of the total number of sharks recorded on the BRUV.

2.3.3. Biological Estimates

Individual sharks were classified into maturity stages (immature, mature), based on estimated total length (TL), and the sex (female, male, ‘no visible claspers’ (NVC)) were recorded [27].

2.3.4. Behaviour

For each shark, Tarrive (time of first arrival), the time of first departure and the time of any re-entry and subsequent departure thereafter were noted. Tvisit (total time spent in FOV) was calculated by summing the differences for each re-entry of a shark. The individual activity level was defined as the total count of re-entries made by a shark during the video.

2.4. Statistical Analysis

Prior to hypothesis testing, data were tested to determine whether assumptions of normality and homogeneity of variances were met. A Shapiro–Wilks normality test (α = 0.05) showed that, despite log, square-root and z score transformations, all data distributions were significantly different (p < 0.05) from normal; in consequence, non-parametric tests were performed on untransformed data. Homogeneity of variances, for each statistical analysis, was tested using a Levene’s test (α = 0.05). If the Levene’s test was significant (p < 0.05), the assumption of homogeneity of variances was rejected and the subsequent statistical test for hypothesis testing was set to assume unequal variances. Statistical test results were considered significant at the 0.05 level (p < 0.05) and, unless p < 0.001, the exact p-value is reported. If a test was significant, the null hypothesis (H0) was rejected and the alternative hypothesis (H1) accepted. All statistical analyses were performed in R (R v3.6.1) using packages ‘car’ and ‘dunn.test’; maps were visualised using ESRI’s ArcGIS Desktop v10.4, and graphs were plotted using Microsoft Excel (v1911).

2.4.1. Adequate Recording Time

Only videos that recorded sharks (n = 499) were used to assess adequate recording time (time at which 95% of individuals were recorded, derived from De Vos et al. [55]), using the declining arrival rate of new individuals (i.e., an accumulation curve) over the entire length of each video. For each species, based on MaxIND and Tarrive, individuals were binned into 10 min intervals. The number of videos (i.e., sample size) per 10 min interval differed because not all videos ran for the maximum of 211.03 min (Table 1). To account for unequal numbers of videos per time interval, the cumulative abundance of an interval was calculated as the number of individuals across all videos multiplied by the pooled mean. The cumulative abundance was expressed as proportion, plotted against time and the adequate recording time identified.

2.4.2. MaxN and MaxIND

Only videos that recorded a minimum of 90 min (n = 557) were standardised to 90 min video length and were used to examine whether mean values from MaxN and MaxIND were significantly different, with a particular focus on testing whether MaxIND was typically greater than MaxN, implying that there are often more sharks present at a BRUV unit than the maximum number visible on screen at any one time. The null hypothesis that abundance values of a species were not significantly different between MaxN and MaxIND was tested using a non-parametric, two-way paired Wilcoxon signed-rank test.

2.4.3. Shark Behaviour

The null hypothesis that Tarrive, Tvisit and activity level were not significantly different between species was tested using a non-parametric, two-way Kruskal–Wallis rank sum test and possible significant differences between species were identified using a post hoc Dunn test. Across all species, a non-parametric, two-way Mann–Whitney U test was used to test the null hypothesis that metrics were not significantly different between sexes and maturity stages.

3. Results

Over the period 2015–2018 (n = 557 BRUVs, 90 min video length), six species were recorded on BRUVs: nurse shark (Ginglymostoma cirratum, sum MaxN = 166), Caribbean reef shark (Carcharhinus perezi, sum MaxN = 136), lemon shark (Negaprion brevirostris, sum MaxN = 14), blacktip shark (Carcharhinus limbatus, sum MaxN = 8), great hammerhead shark (Sphyrna mokarran, sum MaxN = 6) and tiger shark (Galeocerdo cuvier, sum MaxN = 5).

3.1. Assessment for Adequate Recording Time

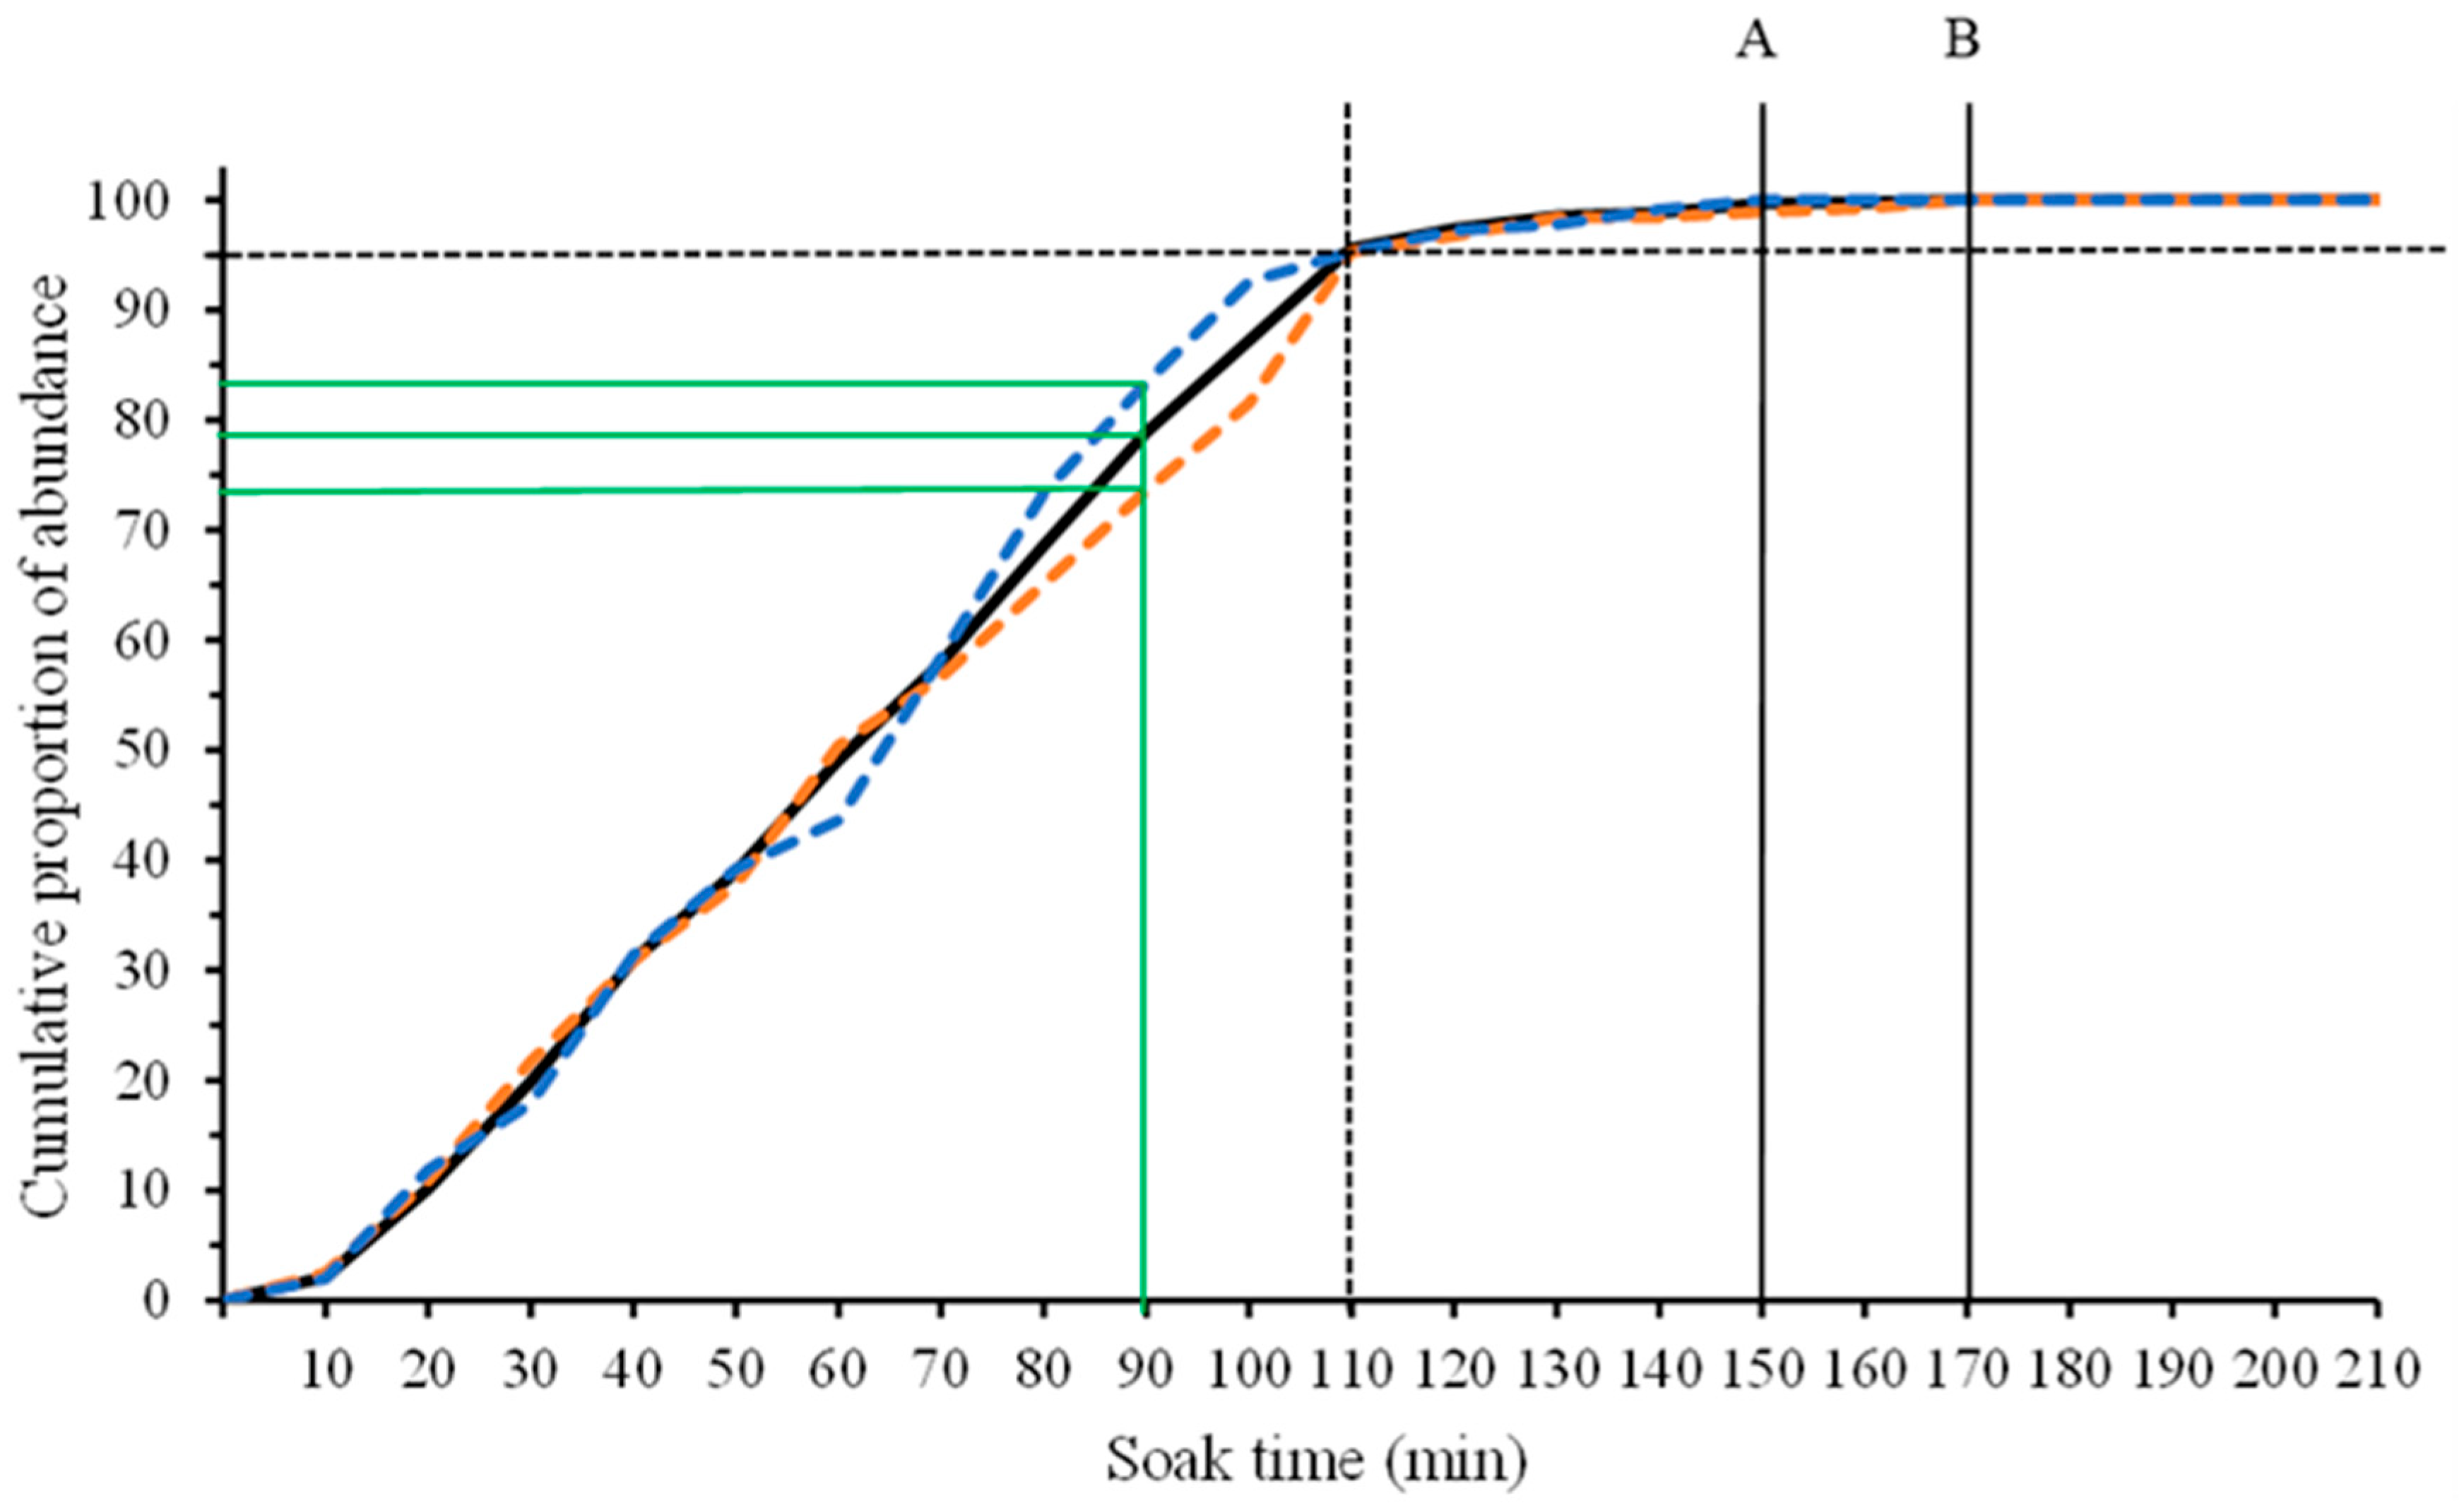
Over the entire video lengths (mean ± SE = 110.20 ± 0.96 min, 3.8–211.03 min), for all species (6), the mean arrival time (Tarrive) was greater than one hour (Table 1). The accumulation curve (Figure 3) showed that 95% of sharks were recorded at 110 min.
The maximum number (=100%) of Caribbean reef sharks and of nurse sharks was reached at 150 min and 170 min, respectively (Figure 3). The recording time of 90 min recorded approximately 75–85% of all recorded sharks (Figure 3). The common practice of BRUV deployments with 60 min recording time recorded only approximately 45–50% of total recorded sharks (Figure 3).

3.2. Comparison of MaxN and MaxIND

For 90 min recording times, MaxIND values were significantly greater than those for MaxN for both Caribbean reef and nurse sharks (paired Wilcoxon signed-rank test: Caribbean reef sharks V = 210, p < 0.001; nurse sharks V = 561, p < 0.001, Figure 4). The values of both metrices for the other species were too low to analyse (Figure 4). Both MaxN and MaxIND recorded the same numbers of great hammerheads, of blacktip and of tiger sharks. For lemon sharks, MaxIND recorded one more individual than MaxN.
This finding demonstrates that for two key species out of six, more individual sharks visited a BRUV unit than are assumed, when the maximum number visible on the screen at any one time is taken as the total count of sharks present.

3.3. Behaviour of Sharks on BRUVs

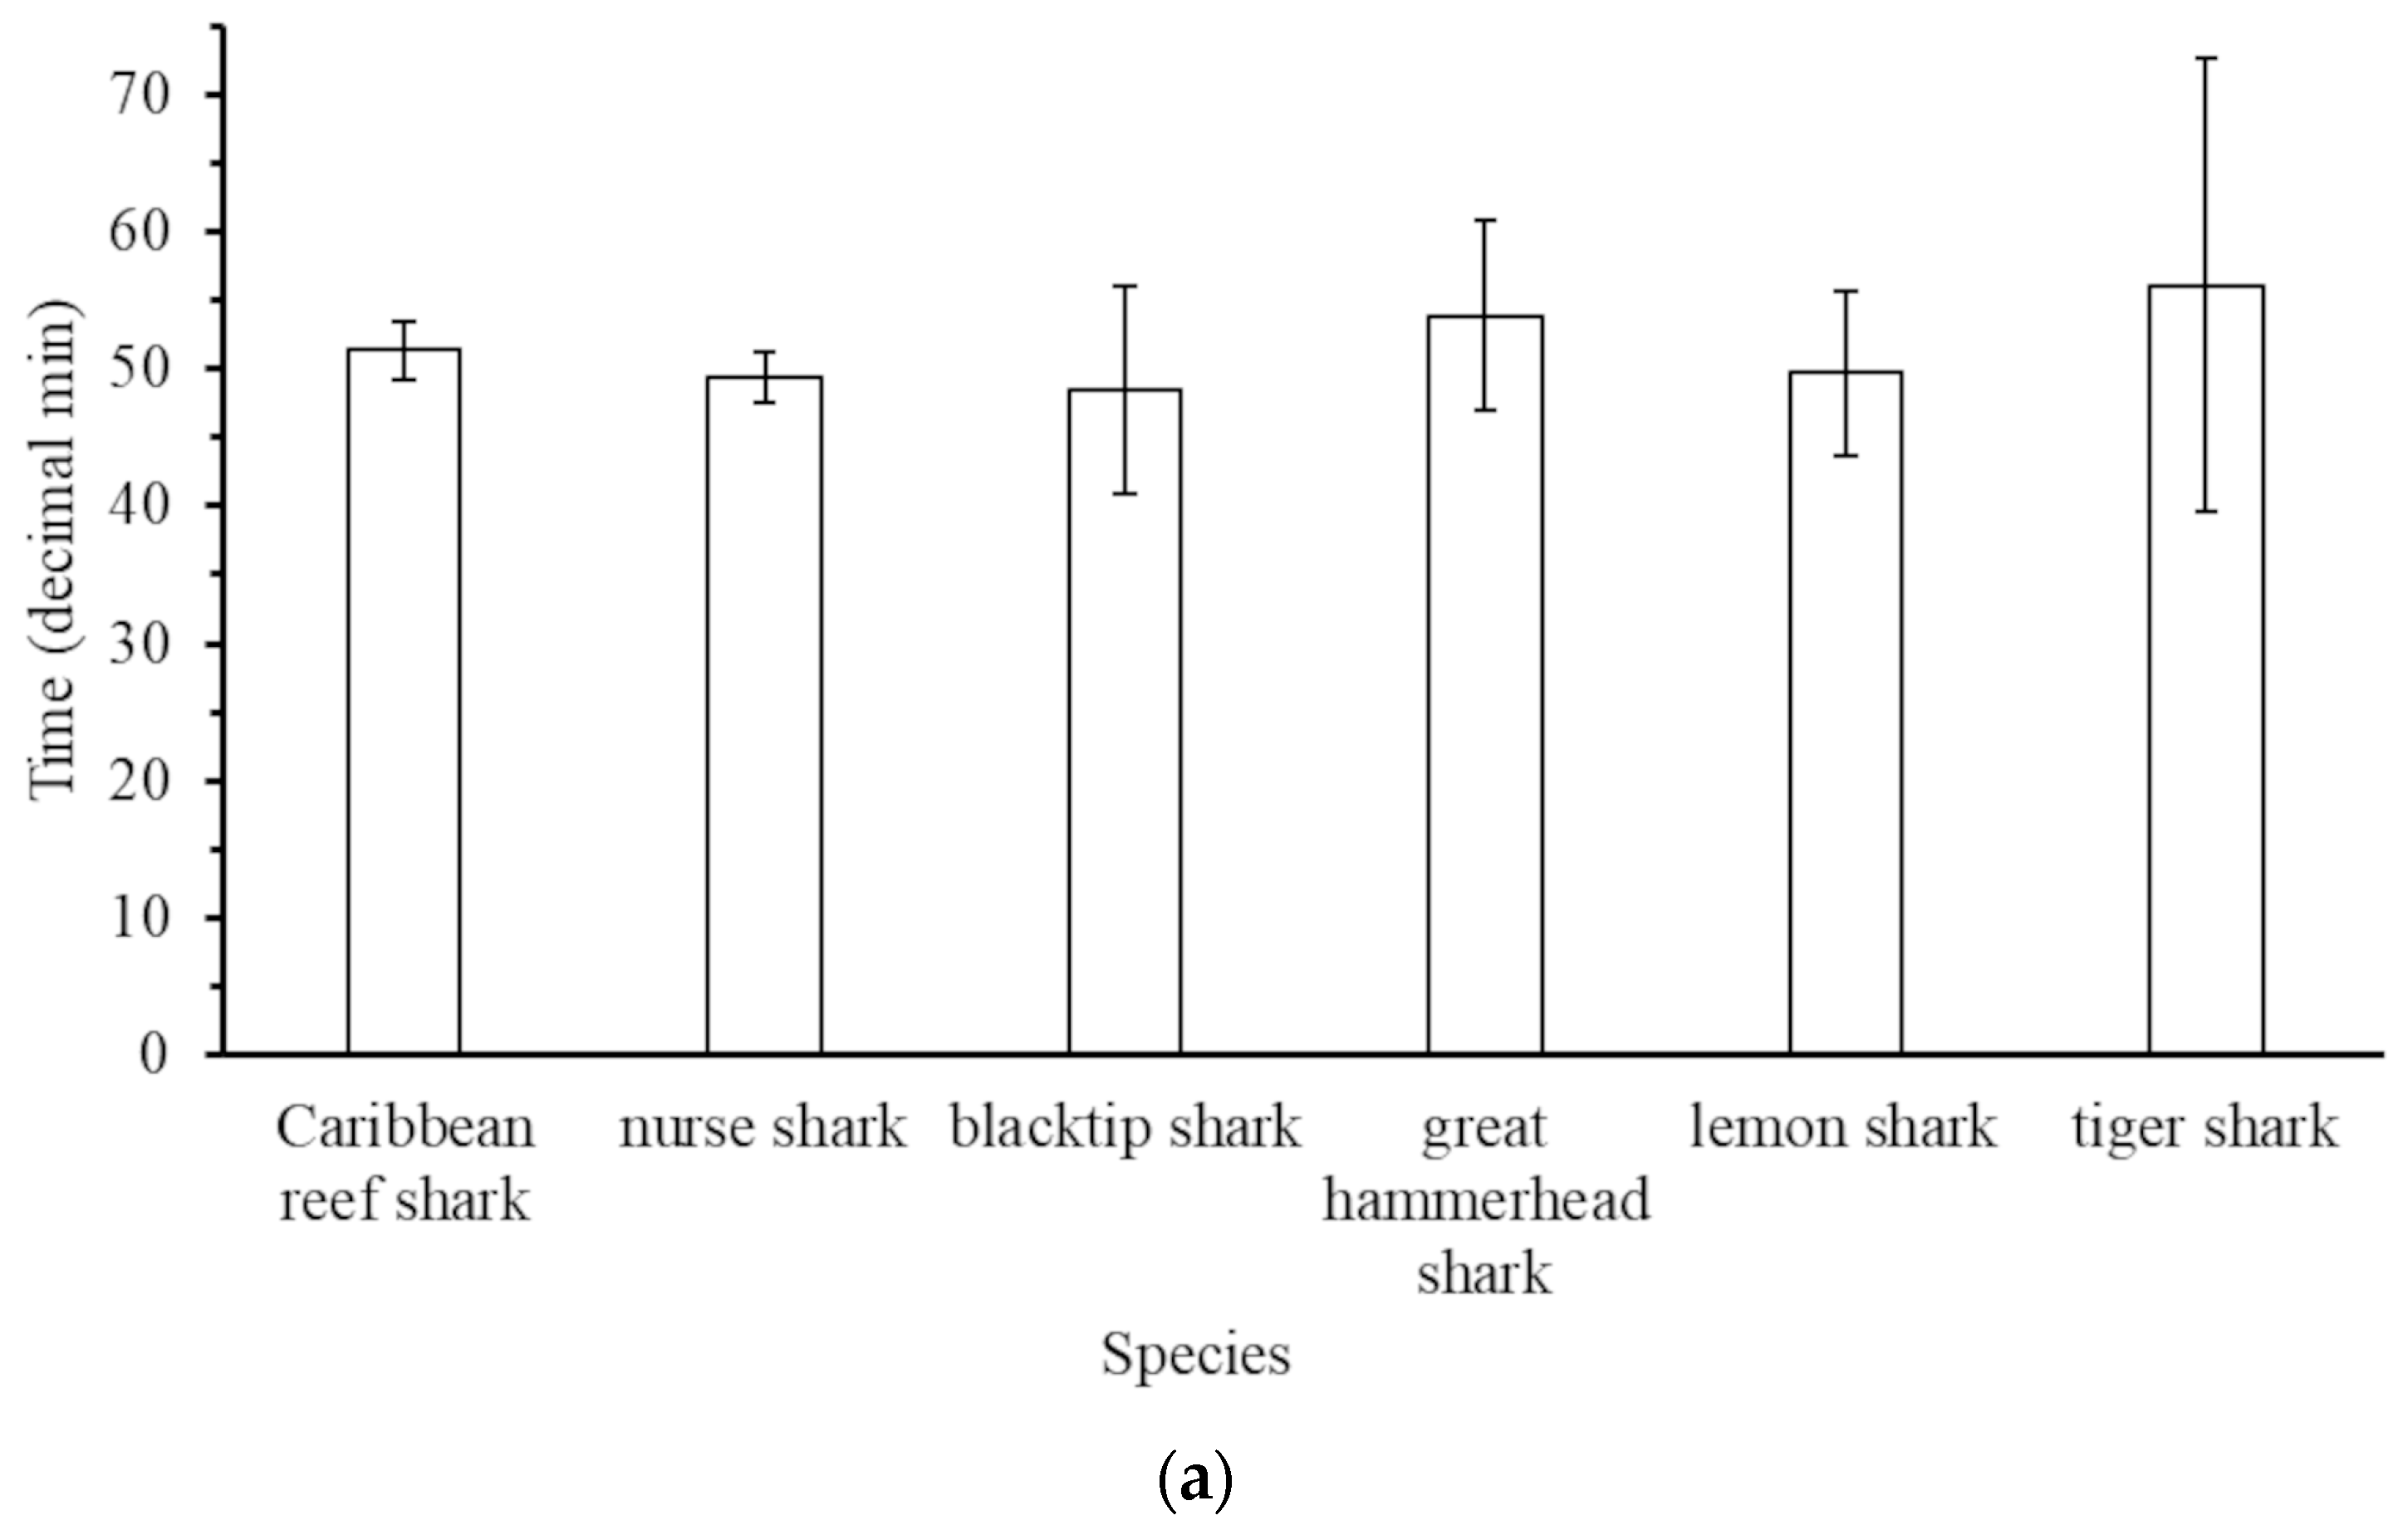
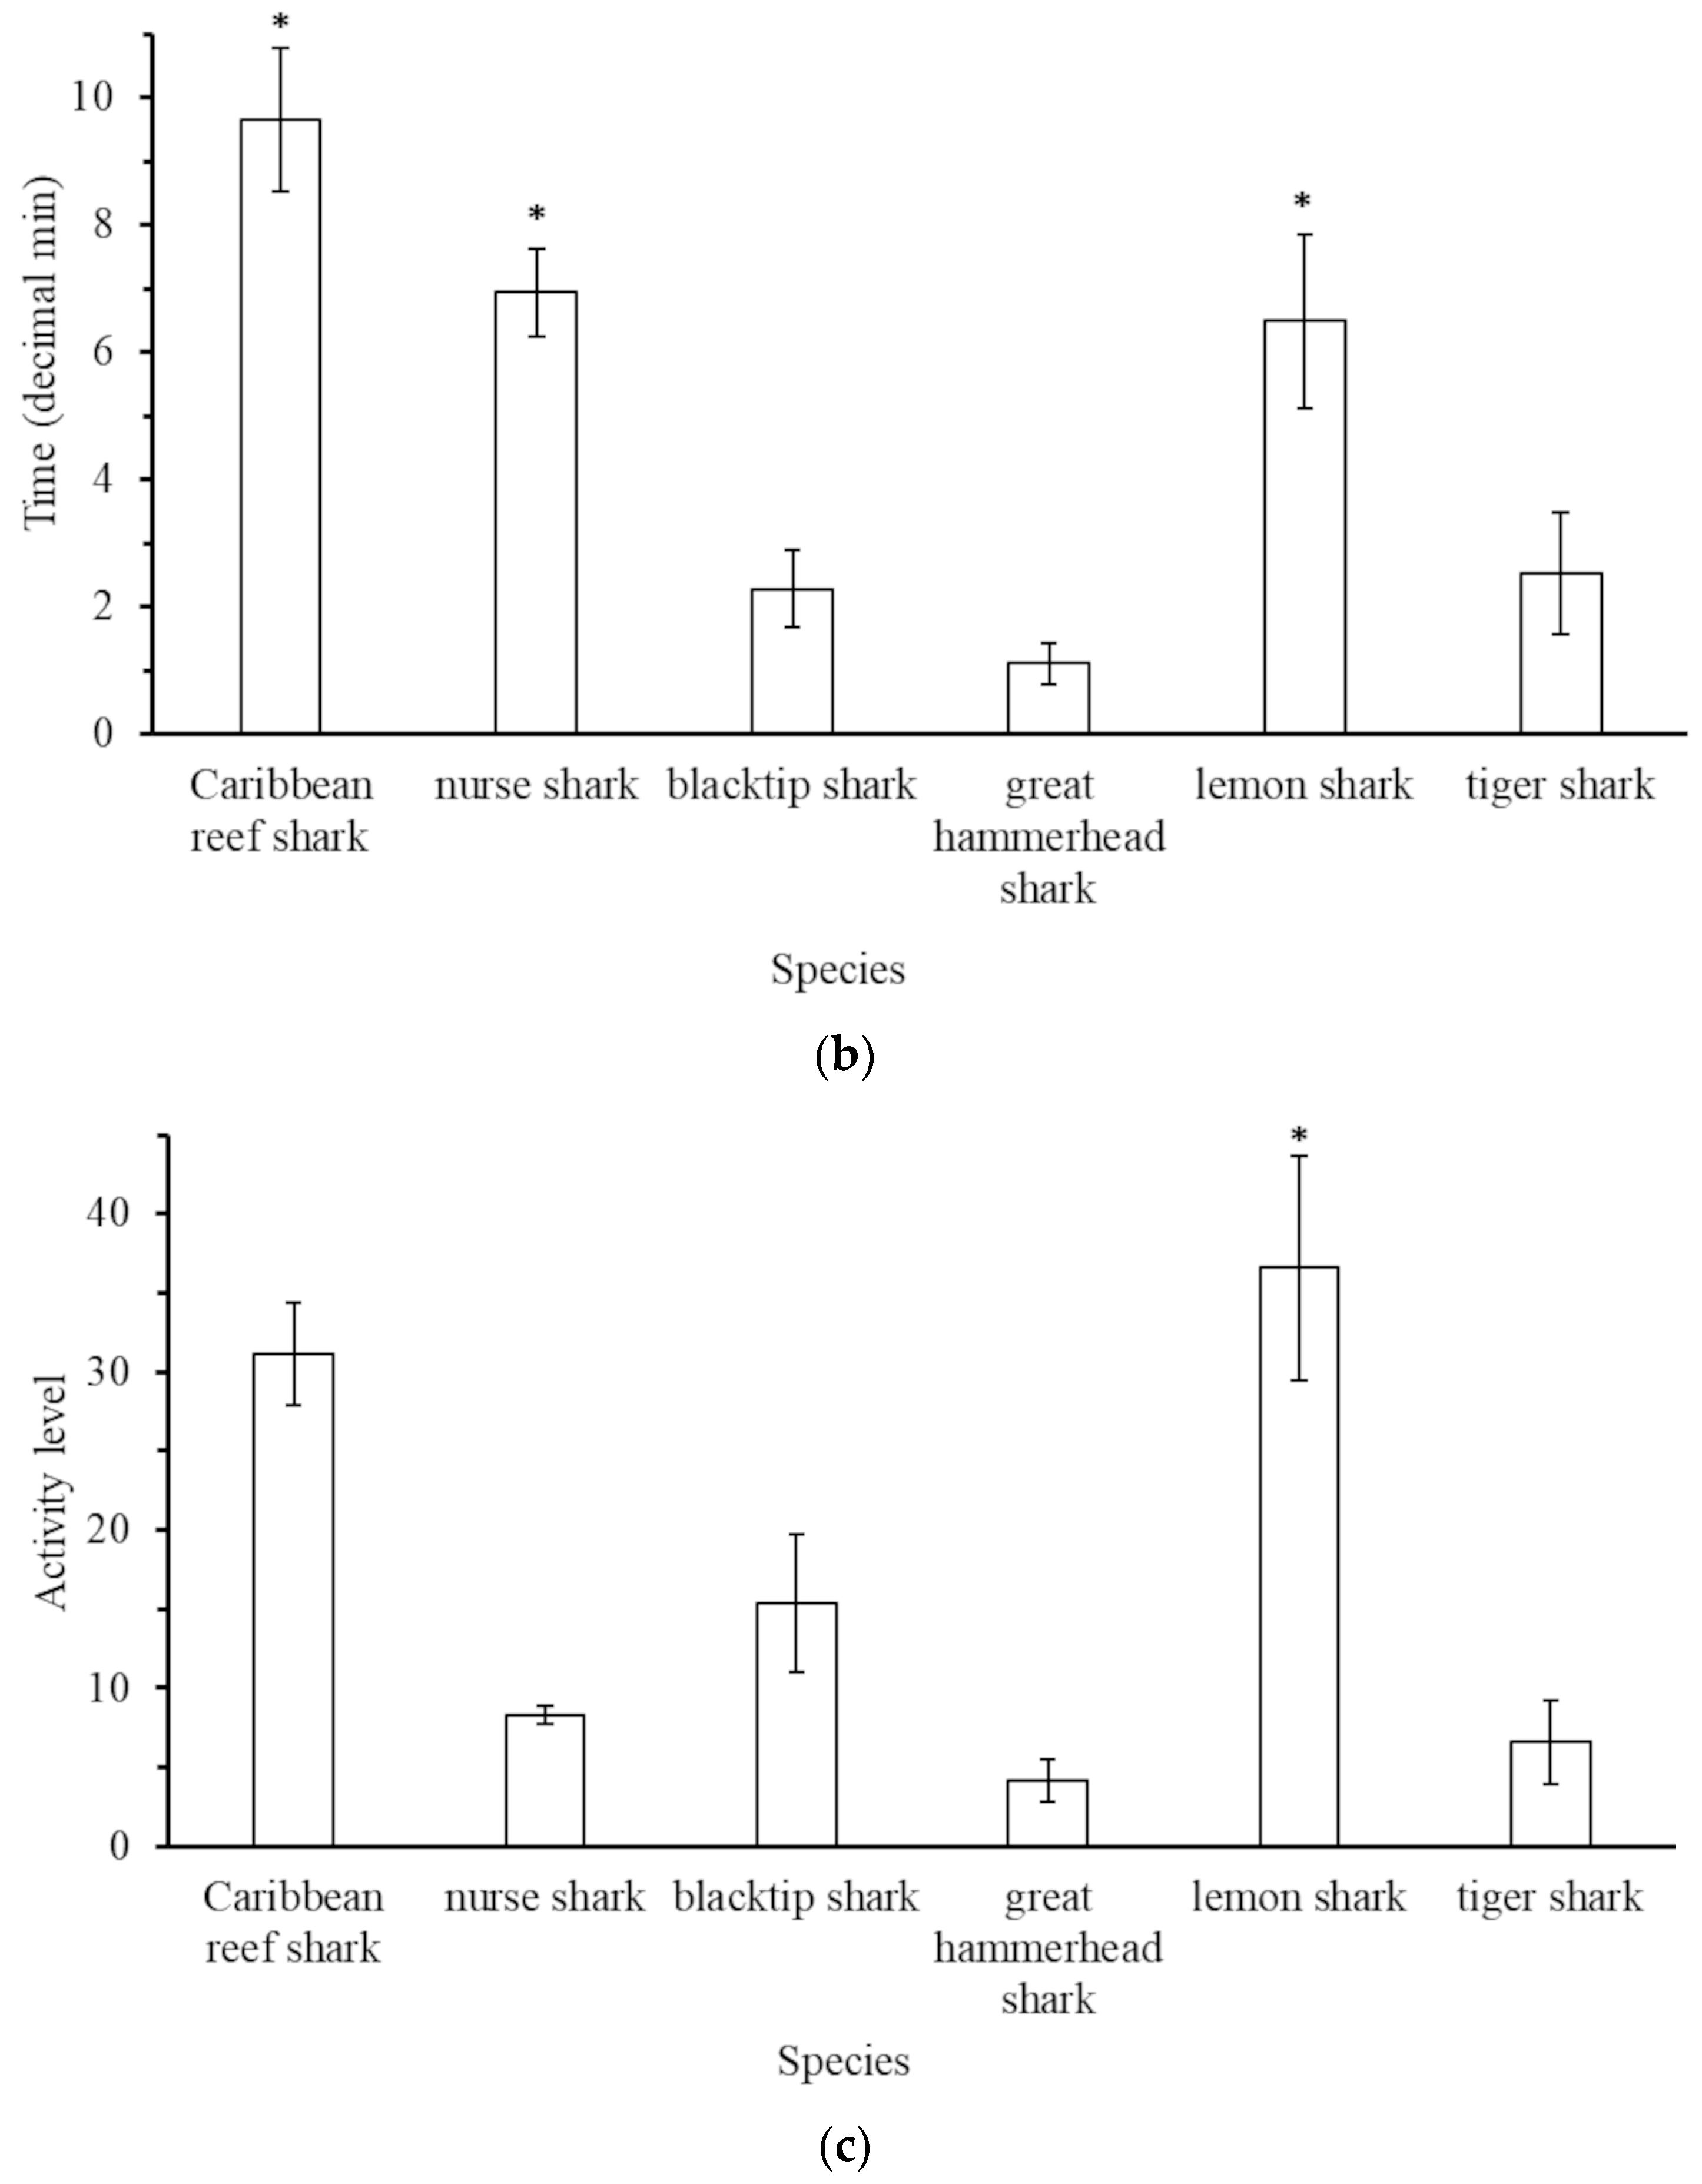
Across all species (6), the mean (± SE) and range of Tarrive, Tvisit and activity level are reported in Table 1. Generally, species had no effect on the time of first arrival (Tarrive, Kruskal–Wallis rank sum test: χ2 = 1.127, df = 5, p = 0.952, Figure 5a) however time of visit (Tvisit) and activity level varied significantly (Kruskal–Wallis rank sum test: Tvisit χ2 = 11.242, df = 5, p = 0.047; activity level χ2 = 37.528, df = 5, p < 0.001, Figure 5b,c) across species. Post hoc Dunn comparison of Tvisit and activity level (Table S2) showed that (1) Caribbean reef shark, nurse shark and lemon shark stayed significantly longer near the BRUV unit than did blacktip and great hammerhead shark (Figure 5b), (2) the activity level of lemon sharks was significantly greater than that of the other species (Figure 5c) and (3) Caribbean reef sharks were significantly more active than nurse sharks (Figure 5c).
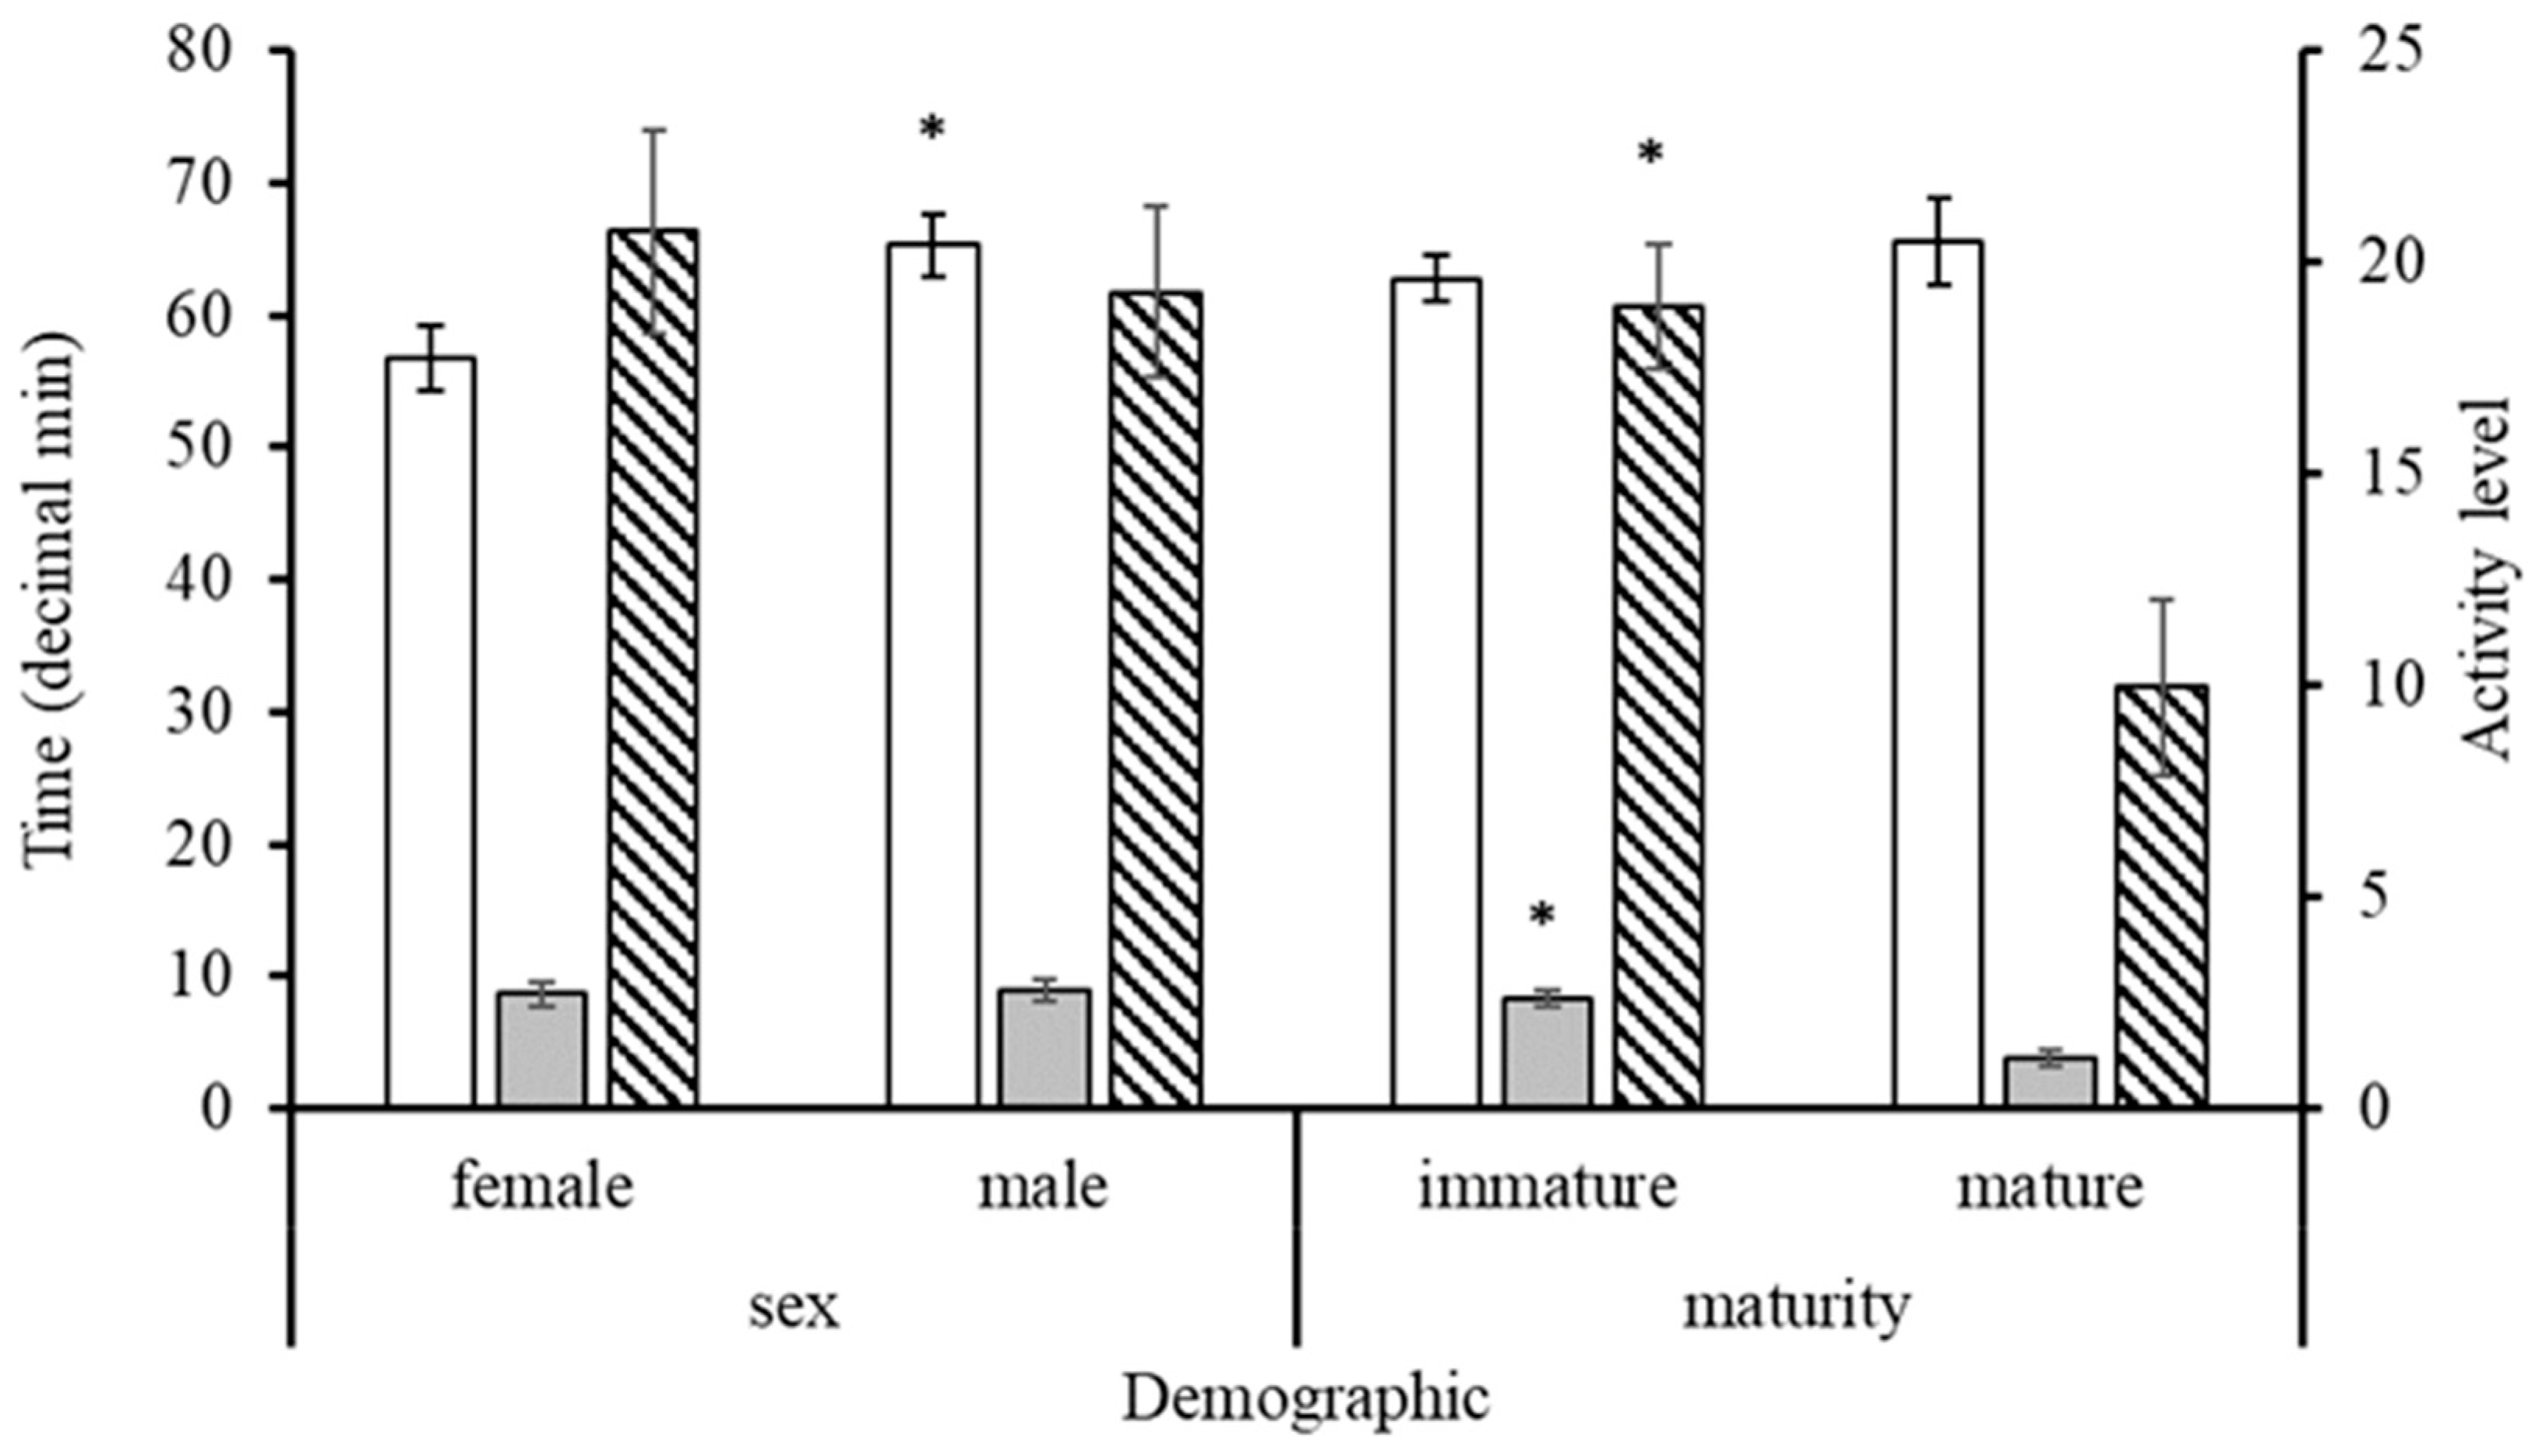
Female Caribbean reef sharks arrived significantly earlier in the recording than males (Mann–Whitney U test: W = 1117, p= 0.003), and while female nurse sharks also arrived earlier than males, this difference was not significant (Mann–Whitney U test: W = 2832, p = 0.697). Although not statistically significant, immature Caribbean reef sharks arrived earlier than mature sharks (Mann–Whitney U test: W = 1711, p = 0.399), contrasting nurse sharks where both maturity stages arrived at similar times (Mann–Whitney U test: W = 2184.5, p = 0.968). For all species combined (6), females and immature sharks arrived significantly earlier in the recording than males and mature sharks, respectively (Mann–Whitney U test: sex W = 13,594, p = 0.007; maturity W = 17,361, p = 0.474, Figure 6). Also, immature sharks stayed significantly longer and were significantly more active than mature individuals at the BRUV unit (Mann–Whitney U test: Tvisit W = 24,987, p < 0.001; activity level W = 23,622, p < 0.001) while sex had no effect on duration of stay (Mann–Whitney U test: Tvisit W = 15,471, p = 0.435) nor activity (Mann–Whitney U test: activity level W = 16,576, p = 0.739) of sharks (Figure 6). Differences between sex and maturity could not be analysed for each of the other species because numbers of sightings on BRUVs were too low.

4. Discussion

BRUVs are now a common tool for monitoring and studying shark populations [40]. Recording time (time elapsed between when the BRUV unit settled on the seabed and when the unit left the seabed or the video recording stopped) of BRUVs and the use of metrics (e.g., MaxN, MaxIND) can influence abundance estimates [37,43,44] and the precision of these estimates [52]. While adequate recording times depend on the research objective, there is also evidence that it may differ between locations [37,52,53,67,93]. Previous studies have deployed BRUVs for prolonged (>60 min) recording times (e.g., 90 min; [18]) but have not compared abundances over increased recording time within the region. This study was the first to assess an adequate recording time for BRUV deployments likely applicable to in the wider Caribbean. This study used species first arrival times, differences between MaxN and MaxIND and behaviours of individual sharks on BRUVs over longer recording times (>60 min), to propose an adequate BRUV recording time and use of abundance metric for the effective study of local shark populations in the Cayman Islands.

4.1. Adequate BRUV Recording Time

Overall, sharks in this study arrived relatively late in the recording (mean = 62.84 min SE ± 1.53), similar to sharks in the Arabian Gulf (59.1 min SD ± 41.4; [94]). There is only limited research using abundances of species [52,53,93] to determine the optimal time required to record species. Most studies used species richness and species accumulation curves to assess adequate recording time for BRUVs [37,39,51,55]. Comparisons that were based on MaxN showed no differences in abundances of reef species (fish and sharks) on BRUVs set in temperate rocky reefs and estuaries with increasing recording time 30–90 min [52,53] and concluded that 60 min would be appropriate to monitor local species. In the Coral Triangle and Pacific Ocean, recording times of 77 min were optimal for recording shark species on BRUVs (also based on MaxN); however, 60 min were effective for the majority of those species in shallow coral reef habitats [93]).
Shorter arrival times of reef fish and sharks are linked to areas with higher density populations because there will be more individuals able to move towards or approach the unit more readily [67,93]. In the Pacific, shorter recording times were able to record rarer species [93] but, in general, shorter recording times may miss individuals of species at lower abundances [53,93]. The longer times required to record similar proportions of sharks in this study, compared to species in the Pacific might be due to the generally higher abundances of sharks in the Pacific than in the Caribbean [4]. Another factor in this study might be the local bathymetry. The Cayman Islands are surrounded by very deep (>2000 m) water and sharks might be coming from deeper waters adjacent to the coastal shelf. This would make their arrival time later in the recording compared to other areas that may have relatively shallow waters near the BRUV units. While both MaxN and MaxIND give an indication of species-specific density at a study area, it is difficult to compare optimal recording times between these metrics.
In the present study, the 95% peak of species abundances was reached at around 110 min recording time which is likely due to lower densities present in this study than elsewhere. Alternatively, the use of MaxIND might also explain the 95% peak later in the recording compared to studies that suggested shorter recording times based on MaxN. Unless multiple individuals are circling the BRUV unit with only one individual being seen on the screen at any one time (MaxIND > MaxN), it is likely that MaxN tends to peak earlier in the recording than MaxIND. For example, if there are three individuals but only one is seen at any time on the screen, MaxN will peak at the first arrival of the first individual, while MaxIND will peak after the first arrival of the third individual. Hence, recording times using different abundance metrics should be carefully compared.
It is worth noting that prolonged recording times can benefit certain research objectives by recording a greater percentage of individuals in the populations (e.g., population estimates via photo-ID; [27]). However, these longer deployments also increase the time required in the field and for analysis. Considering this trade-off, a recording time of a minimum of 90 min (recording 75–85% of individuals) would be reasonable to study sharks using BRUVs in the Cayman Islands.

4.2. Comparison of Abundance Metrics

While MaxN is commonly used, the results confirm the hypothesis that MaxN can underestimate the true abundance of species, suggesting that MaxIND is more accurate [42,43,44] for the identification of changes in abundance [24]. In this study, MaxIND gave abundances for Caribbean reef and nurse shark that were 1.2 times greater than using MaxN. The results are similar to findings in two species of bluespotted rays where abundances were 2.4 (Neotrygon orientalis) and 1.1 (Taeniura lymma) times greater using MaxIND [43].
The use of MaxIND, however, is not suitable for every shark species as the method is limited to species and/or age classes showing distinctive individual features. In this study, the identification of individuals was easier for nurse sharks than for Caribbean reef sharks because nurse sharks tended to have more distinctive natural markings (e.g., birth marks, skin discolorations, dorsal fin shape). While for some individuals the shape of the first dorsal fin, birth marks on the body and the line pattern on the cheeks (where the grey side and the white ventral side meet) could be used for identification as well, identification relied more on markings gained from external forces such as scars and the remains of hooks. This method may also be less suitable for very young sharks as they tend to have less distinctive markings, making the identification of individuals more challenging [27,95]. Thus, MaxN likely remains the more appropriate abundance metric when individuals cannot be identified.
Nevertheless, the present study demonstrated that MaxIND can be used to investigate a wider range of research questions than MaxN alone. Kohler et al. [27] demonstrated that the identification of individuals beyond single deployments is possible and that the re-identification of individuals over multiple survey trips (and years) can be a useful tool to obtain population estimates based on mark–recapture methods. The benefits of MaxIND to a study need to be carefully evaluated as the time required for analysis is much greater than when applying MaxN alone. Technology, such as software aiding in pattern recognition and identification [95,96], may be able to reduce the time for analysis. The improved accuracy of MaxIND over MaxN may be especially beneficial in studies that focus on populations of rare species (e.g., endangered species), where the survival of known individuals may be of concern, and small differences in abundance may have consequences for conservation management [28,97].

4.3. Observed Behaviour of Sharks

This study also demonstrated that the detailed tracking of individual behaviour patterns (activity level, visit duration and time of first arrival) can be a useful tool for assessing species-specific behaviour on BRUVs. Shorter arrival times may indicate higher population densities of species [24,63,67,68,98], social behaviour [99] and/or a stronger olfactory capability of species [66,100]. Although caution must be taken when using arrival times as an index for abundance, since individual size and speed are positively related, especially for highly mobile species as such sharks [101], it nevertheless seems reasonable to compare arrival times between different reef shark species.
Compared to the only known report of mean arrival times for reef sharks, the results suggest that the overall shark abundance in Cayman is much lower than those of reefs sharks at Palmyra Atoll [98,102], known for its very high shark abundances, as individuals were four times slower to arrive in this study. Interestingly, in the present study, species had no effect on mean arrival time on BRUVs indicating that species were similarly attracted to the bait and/or that olfactory abilities did not differ significantly between species sighted on BRUVs. However, as abundance estimates using MaxN differed significantly between species [103], arrival time may not be an appropriate measure of the relative abundance for species at low densities like in Cayman.
At the time of writing, the visit duration and the activity level of sharks on BRUVs had not been quantified by previous studies elsewhere. The results demonstrated that even though the analysis is time-consuming, the quantification of visit duration and activity level of sharks on BRUVs can provide new insights to species and demographic specific behaviour. In general, species that are strongly reef associated such as lemon, Caribbean reef and nurse shark were more active and stayed longer at the unit than those species less reef attached (i.e., blacktip, great hammerhead and tiger shark). Blacktip and tiger sharks generally moved on relatively shortly after arriving which might be due to species-specific nature (e.g., more cautious) and/or larger home ranges (e.g., Caribbean reef shark [104], tiger shark [105]). Great hammerhead sharks showed greatest interest in the bait itself, with some individuals even attempting to remove the bait bag; however, they moved on relatively quickly either with the bait (only one case) or after the attempt failed.
Lemon sharks were most active as indicated by frequent entries and exits which likely reflects behaviour associated with the habitat in which they were recorded. Lemon sharks were mostly recorded near mangroves inside lagoons where immature sharks swam repeatedly between the mangroves and shallow sand flats. The relative activity of nurse sharks (less active) and Caribbean reef sharks (highly active) confirmed previously reported species-specific activity of nurse sharks [72,84,90,106] and of closely related reef sharks [107], respectively. The metabolism and lifestyle of species depend on their method of respiration. For example, less active species such as nurse sharks mostly oxygenate their gills via buccal pumping (ventilating gills by active pumping of water while resting [108]) while more active species such as Caribbean reef sharks utilise predominantly ram ventilation. Therefore, it was not surprising that while both species showed great interest in the bait, nurse sharks were often observed to lie under and/or suck on the bait bag (some attempted to remove the bag) and to rest under a reef ledge in close proximity to the unit, with occasional trips outside of the camera’s field of view (FOV), while Caribbean reef sharks were never observed resting and instead swam continuously, often leaving and re-entering the camera’s FOV many times during the recording.
Female Caribbean reef sharks (immature and mature) in this study arrived earlier in the recording than males (immature and mature), indicating that males had to swim greater distances to the BRUV unit. In one area (S of Grand Cayman), even though males were more abundant than females, the arrival time of male Caribbean reef sharks was double of that observed for females. This supports the hypothesis that male reef sharks have larger home ranges than females [82,104]. Furthermore, it could also be evidence for potential sexual segregation in this species. Female areas might have been closer to the BRUV unit than the male areas.
Larger sharks in this study appeared to be more cautious and more hesitant to approach the unit while immature sharks arrived earlier in the recording, stayed for longer and were more active. The earlier arrival of immature sharks in the recording is likely due to a combination of their home range size [36,40,41,104], attraction to the bait [109] and habitat use [104,110,111]. Smaller individuals tend to occupy the upper coastal shelf, including shallow reef and mangroves, where there is more cover to avoid larger predators [104,110,111]. Therefore, this finding likely reflected repeated return trips between the BRUV unit and a nearby refuge. It is also likely that the bait presents a more attractive feeding opportunity to immature than to mature sharks due to their inexperience in foraging during the early life stages and because larger sharks consume bigger prey [112,113,114]. Furthermore, larger sharks have greater home ranges and generally occupy deeper depths than immature sharks [104,115,116], making it more likely that larger individuals had to swim a greater distance to reach the BRUV unit.
The tracking of individual behaviour patterns can be useful to collect species-specific or individual information to answer particular shark conservation concerns such as (1) solutions to human–shark conflicts (e.g., levels of attraction of sharks to different bait that people might use in an area with high human-in-water activity, such as Cayman’s popular tourist attraction “Stingray City”) and (2) the specific behaviour within demographics (male vs. female, immature vs. mature) in the presence of bait scent (e.g., risk assessment of demographics in areas where fish are cleaned and sharks might encounter fishing activities). These valuable insights can help shark conservation management develop evidence-based solutions to local conservation issues.
Finally, the use of current, high resolution underwater cameras could improve identification of individuals through increased resolution of footage, and environmental data loggers (e.g., https://www.star-oddi.com/products/data-loggers, accessed on 27 July 2025) could collect additional in situ data (e.g., water temperature). If sufficient resources are available, the time required for analysis could possibly be reduced through the use of commercially or freely available face recognition software (e.g., by Bolger et al. [117], Hiby and Lovell [118], and Wild Book https://wildme.org/#/wildbook, accessed on 27 July 2025).

5. Conclusions

The findings in this study demonstrated that (1) it took longer than 60 min to record 85% of recorded individuals on BRUVs, (2) MaxIND abundance estimates were significantly greater than MaxN for the two locally dominant species (Caribbean reef shark and nurse shark) and (3) detailed tracking of individual behaviour patterns (activity level, visit duration and time of first arrival) can be a useful tool for assessing species-specific behaviour on BRUVs. Based on these findings, it is recommended to use (1) BRUVs recording times of preferably 120 min but minimum 90 min and (2) MaxIND abundance metric for at least the most abundant species, if not all recorded species, for the adequate monitoring of near-coastal shark species in the Caribbean. Optionally, depending on local research priorities, the assessment of individual behaviours can inform human–shark conflict resolutions and species-specific management such as sexual segregation, demographics and reproductive behaviour [9]. Prolonged recording times (>90 min) were implemented in more recent BRUV studies and have proven successful in recording new local records of deep-water sharks [73,74] and detecting small increases in critically endangered hammerhead species [28]. MaxIND can improve the abundance estimates for the most abundant species, if species have distinct markings, but MaxN will likely be sufficient for less common species because it is more unlikely that two different individuals will be present simultaneously around the BRUV unit. Recently, the implementation of MaxIND for Caribbean reef shark and nurse shark enabled the tracking of individuals around the Cayman Islands and individual sighting histories were modelled to estimate local population parameters for each species [27].
These findings from the Cayman Islands can be applied to BRUV studies across the Caribbean. Previous studies used recording times of either 45–60 min [50,60] or 90 min [9,10,18,39,57] and only one reported species-specific behaviour patterns [39]. The results in the present study for the accumulative abundance of species over time provide support for the use of a minimum of 90 min deployment times. The more common use of longer deployment times than 60 min in the Caribbean could be linked to generally lower shark populations across the Caribbean. While a recent global sharks assessment initiative (Global FinPrint https://globalfinprint.org/, accessed on 27 July 2025) used 60 min BRUV recording times, it did highlight that species in the Caribbean are less abundant than species in the Pacific and Indian Ocean [6,12]. This makes the monitoring of shark populations across the Caribbean more challenging and the recommendations in this study could help shark conservation management in other Caribbean nations with the collection of useful information from minimally invasive BRUVs.

Supplementary Materials

The following supporting information can be downloaded at https://www.mdpi.com/article/10.3390/oceans6040070/s1, Table S1: Timetable of BRUV surveys in the Cayman Islands (2015–2018); Table S2: Post-hoc Dunn test results of pairwise comparison of Tvisit and activity level between shark species from BRUVs in the Cayman Islands. Test statistic (Z) and p-values are reported and significant differences, at the 0.05 level, are marked with *.

Author Contributions

Conceptualization, J.K., M.G. and R.O.; methodology, J.K. and M.G.; software, J.K. and M.G.; validation, J.K. and M.G.; formal analysis, J.K.; investigation, J.K., M.G. and R.O.; resources, M.G., R.O. and T.A.; data curation, J.K., M.G., K.M. and A.V.; writing—original draft preparation, J.K.; writing—review and editing, M.G., R.O., K.M., A.V. and T.A.; visualisation, J.K.; supervision, M.G., R.O. and T.A.; project administration, M.G., T.A.; funding acquisition, M.G., R.O. and T.A. All authors have read and agreed to the published version of the manuscript.

Funding

This research was funded by the UK Department of Environment, Food and Rural Affairs (DEFRA), grant number DPLUS036, and by donations from the Cayman Islands Brewery’s White Tip Lager programme.

Institutional Review Board Statement

The animal study protocol was approved by the National Conservation Council of the Cayman Islands. The study was conducted in accordance with the local legislation and institutional requirements.

Informed Consent Statement

Not applicable.

Data Availability Statement

The original contributions presented in this study are included in the article/Supplementary Material. Further inquiries can be directed to the corresponding author(s).

Acknowledgments

We especially thank Gina Ebanks-Petrie, for her support of this study, Jeremy Olynik for assistance with ArcGIS maps, and other DoE staff for support with the fieldwork. We also thank Catriona Millar, Pete Davis, Helena Delgado Nordmann, Carrie Duchak, Marique Cloete, Graham Ryan, Steff Mcdermot and April Miller for assistance in the field with BRUV deployments, as well as Megan Ehman for assistance with video analyses. We thank the Cayman Islands Brewery Ltd. for their continued long-standing support of DoE’s shark research and conservation efforts in the Cayman Islands.

Conflicts of Interest

The funders had no role in the design of the study; in the collection, analyses, or interpretation of data; in the writing of the manuscript; or in the decision to publish the results.

References

  1. Baum, J.K.; Myers, R.A.; Kehler, D.G.; Worm, B.; Harley, S.J.; Doherty, P.A. Collapse and conservation of shark populations in the Northwest Atlantic. Science 2003, 299, 389–392. [Google Scholar] [CrossRef]
  2. Pacoureau, N.; Rigby, C.L.; Kyne, P.M.; Sherley, R.B.; Winker, H.; Carlson, J.K.; Fordham, S.V.; Barreto, R.; Fernando, D.; Francis, M.P.; et al. Half a century of global decline in oceanic sharks and rays. Nature 2021, 589, 567–571. [Google Scholar] [CrossRef]
  3. Stevens, J.D.; Bonfil, R.; Dulvy, N.K.; Walker, P.A. The effects of fishing on sharks, rays, and chimaeras (chondrichthyans), and the implications for marine ecosystems. ICES J. Mar. Sci. 2000, 57, 476–494. [Google Scholar] [CrossRef]
  4. MacNeil, M.A.; Chapman, D.D.; Heupel, M.; Simpfendorfer, C.A.; Heithaus, M.; Meekan, M.; Harvey, E.; Goetze, J.; Kiszka, J.; Bond, M.E.; et al. Global status and conservation potential of reef sharks. Nature 2020, 583, 801–806. [Google Scholar] [CrossRef] [PubMed]
  5. Ward-Paige, C.A.; Mora, C.; Lotze, H.K.; Pattengill-Semmens, C.; McClenachan, L.; Arias-Castro, E.; Myers, R.A. Large-Scale Absence of Sharks on Reefs in the Greater- Caribbean: A Footprint of Human Pressures. PLoS ONE 2010, 5, e11968. [Google Scholar] [CrossRef] [PubMed]
  6. Clementi, G.; Babcock, E.; Valentin-Albanese, J.; Bond, M.; Flowers, K.; Heithaus, M.R.; Whitman, E.; Bergmann, M.V.Z.; Guttridge, T.; O’sHea, O.; et al. Anthropogenic pressures on reef-associated sharks in jurisdictions with and without directed shark fishing. Mar. Ecol. Prog. Ser. 2021, 661, 175–186. [Google Scholar] [CrossRef]
  7. Gallagher, A.J.; Amon, D.J.; Bervoets, T.; Shipley, O.N.; Hammerschlag, N.; Sims, D.W. The Caribbean needs big marine protected areas. Science 2020, 367, 749–750. [Google Scholar] [CrossRef] [PubMed]
  8. O’Bryhim, J.R.; Parsons, E.C.M.; Gilmore, M.P.; Lance, S.L. Evaluating support for shark conservation among artisanal fishing communities in Costa Rica. Mar. Policy 2016, 71, 1–9. [Google Scholar] [CrossRef]
  9. Ormond, R.; Gore, M.; Bladon, A.; Dubock, O.; Kohler, J.; Millar, C. Protecting Cayman Island sharks: Monitoring, movement and motive. In Proceedings of the 69th Gulf Caribb Fish Inst, Grand Cayman, Cayman Islands, 7–11 November 2016; pp. 14–27. [Google Scholar]
  10. Talwar, B.S.; Anderson, B.; Avalos-Castillo, C.G.; Blanco-Parra, M.d.P.; Briones, A.; Cardeñosa, D.; Carlson, J.K.; Charvet, P.; Cotton, C.F.; Crysler, Z.; et al. Extinction risk, reconstructed catches and management of chondrichthyan fishes in the Western Central Atlantic Ocean. Fish Fish. 2022, 23, 1150–1179. [Google Scholar] [CrossRef]
  11. Finucci, B.; Cheok, J.; Ebert, D.A.; Herman, K.; Kyne, P.M.; Dulvy, N.K. Ghosts of the deep—Biodiversity, fisheries, and extinction risk of ghost sharks. Fish Fish. 2021, 22, 391–412. [Google Scholar] [CrossRef]
  12. Dwyer, R.G.; Krueck, N.C.; Udyawer, V.; Heupel, M.R.; Chapman, D.; Pratt, H.L.; Garla, R.; Simpfendorfer, C.A. Individual and Population Benefits of Marine Reserves for Reef Sharks. Curr. Biol. 2020, 30, 480–489. [Google Scholar] [CrossRef] [PubMed]
  13. Bond, M.E.; Valentin-Albanese, J.; Babcock, E.A.; Hussey, N.E.; Heithaus, M.R.; Chapman, D.D. The trophic ecology of Caribbean reef sharks (Carcharhinus perezi) relative to other large teleost predators on an isolated coral atoll. Mar. Biol. 2018, 165, 67. [Google Scholar] [CrossRef]
  14. Roff, G.; Doropoulos, C.; Rogers, A.; Bozec, Y.-M.; Krueck, N.C.; Aurellado, E.; Priest, M.; Birrell, C.; Mumby, P.J. The Ecological Role of Sharks on Coral Reefs. Trends Ecol. Evol. 2016, 31, 395–407. [Google Scholar] [CrossRef] [PubMed]
  15. Mitchell, M.D.; Harborne, A.R. Non-consumptive effects in fish predator—Prey interactions on coral reefs. Coral Reefs 2020, 39, 867–884. [Google Scholar] [CrossRef]
  16. Hammerschlag, N.; Barley, S.C.; Irschick, D.J.; Meeuwig, J.J.; Nelson, E.R.; Meekan, M.G. Predator declines and morphological changes in prey: Evidence from coral reefs depleted of sharks. Mar. Ecol. Prog. Ser. 2018, 586, 127–139. [Google Scholar] [CrossRef]
  17. Rasher, D.B.; Hoey, A.S.; Hay, M.E. Cascading predator effects in a Fijian coral reef ecosystem. Sci. Rep. 2017, 7, 15684. [Google Scholar] [CrossRef]
  18. Bond, M.E.; Babcock, E.A.; Pikitch, E.K.; Abercrombie, D.L.; Lamb, N.F.; Chapman, D.D. Reef Sharks Exhibit Site-Fidelity and Higher Relative Abundance in Marine Reserves on the Mesoamerican Barrier Reef. PLoS ONE 2012, 7, e32983. [Google Scholar] [CrossRef]
  19. Jaiteh, V.F.; Lindfield, S.J.; Mangubhai, S.; Warren, C.; Fitzpatrick, B.; Loneragan, N.R. Higher Abundance of Marine Predators and Changes in Fishers’ Behavior Following Spatial Protection within the World’s Biggest Shark Fishery. Front. Mar. Sci. 2016, 3, 43. [Google Scholar] [CrossRef]
  20. Ward-Paige, C.A.; Worm, B. Global evaluation of shark sanctuaries. Glob. Environ. Chang. 2017, 47, 174–189. [Google Scholar] [CrossRef]
  21. Hilborn, R.; Amoroso, R.O.; Anderson, C.M.; Baum, J.K.; Branch, T.A.; Costello, C.; de Moor, C.L.; Faraj, A.; Hively, D.; Jensen, O.P.; et al. Effective fisheries management instrumental in improving fish stock status. Proc. Natl. Acad. Sci. USA 2020, 117, 2218–2224. [Google Scholar] [CrossRef] [PubMed]
  22. MacKeracher, T.; Diedrich, A.; Simpfendorfer, C.A. Sharks, rays and marine protected areas: A critical evaluation of current perspectives. Fish Fish. 2019, 20, 255–267. [Google Scholar] [CrossRef]
  23. Brooks, E.J.; Sloman, K.A.; Sims, D.W.; Danylchuk, A.J. Validating the use of baited remote underwater video surveys for assessing the diversity, distribution and abundance of sharks in the Bahamas. Endanger. Species Res. 2011, 13, 231–243. [Google Scholar] [CrossRef]
  24. Stobart, B.; Díaz, D.; Álvarez, F.; Alonso, C.; Mallol, S.; Goñi, R. Performance of baited underwater video: Does it underestimate abundance at high population densities? PLoS ONE 2015, 10, e0127559. [Google Scholar] [CrossRef]
  25. Meekan, M.G.; Cappo, M. Non-Destructive Techniques for Rapid Assessment of Shark Abundance in Northern Australia; Australian Institute of Marine Science: Townsville, Australia, 2004; pp. 1–29. [Google Scholar]
  26. Shipley, O.N.; Brownscombe, J.W.; Danylchuk, A.J.; Cooke, S.J.; O’Shea, O.R.; Brooks, E.J. Fine-scale movement and activity patterns of Caribbean reef sharks (Carcharhinus perezi) in the Bahamas. Environ. Biol. Fishes 2018, 101, 1097–1104. [Google Scholar] [CrossRef]
  27. Kohler, J.; Gore, M.; Ormond, R.; Austin, T. First estimates of population size and home range of Caribbean reef and nurse sharks using photo-identification and BRUVS. Front. Mar. Sci. 2023, 10, 1230896. [Google Scholar] [CrossRef]
  28. Gore, M.; Kohler, J.; Ormond, R.; Gallagher, A.; Fernandes, T.; Austin, T.; Pattengill-Semmens, C. Renewed occurrence of schooling scalloped hammerhead (Sphyrna lewini) and of great hammerhead (S. mokarran) sharks in the Cayman Islands. Front. Mar. Sci. 2024, 11, 1347285. [Google Scholar] [CrossRef]
  29. Bouchet, P.J.; Meeuwig, J.J. Drifting baited stereo-videography: A novel sampling tool for surveying pelagic wildlife in offshore marine reserves. Ecosphere 2015, 6, 137. [Google Scholar] [CrossRef]
  30. Letessier, T.B.; Mouillot, D.; Bouchet, P.J.; Vigliola, L.; Fernandes, M.C.; Thompson, C.; Boussarie, G.; Turner, J.; Juhel, J.-B.; Maire, E. Remote reefs and seamounts are the last refuges for marine predators across the Indo-Pacific. PLoS Biol. 2019, 17, e3000366. [Google Scholar] [CrossRef]
  31. Roskar, G.; Mccallister, M.P.; Ajemian, M.J. Performance of Two Survey Gears Targeting Elasmobranchs in a Shallow, Subtropical Estuary. Mar. Coast. Fish. Dyn. Manag. Ecosyst. Sci. 2020, 12, 50–63. [Google Scholar] [CrossRef]
  32. Sebastian, P.; Stean, S.J.; Erawan, A.I.R.; Gotama, R.; Swarya, I.N.; Sparks, L.D.; Prasetijo, R.; Prasetyo, A.P. Quantifying the influence of environmental factors on elasmobranch distribution and abundance in a high-use marine protected area. Mar. Environ. Res. 2025, 210, 107317. [Google Scholar] [CrossRef] [PubMed]
  33. Acuña-Marrero, D.; de la Cruz-Modino, R.; Smith, A.N.H.; Salinas-de-León, P.; Pawley, M.D.M.; Anderson, M.J. Understanding human attitudes towards sharks to promote sustainable coexistence. Mar. Policy 2018, 91, 122–128. [Google Scholar] [CrossRef]
  34. Goetze, J.S.; Langlois, T.J.; McCarter, J.; Simpfendorfer, C.A.; Hughes, A.; Leve, J.T.; Jupiter, S.D. Drivers of reef shark abundance and biomass in the Solomon Islands. PLoS ONE 2018, 13, e0200960. [Google Scholar] [CrossRef]
  35. Tickler, D.M.; Letessier, T.B.; Koldewey, H.J.; Meeuwig, J.J. Drivers of abundance and spatial distribution of reef-associated sharks in an isolated atoll reef system. PLoS ONE 2017, 12, e0177374. [Google Scholar] [CrossRef] [PubMed]
  36. Cappo, M.; Speare, P.; De’Ath, G. Comparison of baited remote underwater video stations (BRUVS) and prawn (shrimp) trawls for assessments of fish biodiversity in inter-reefal areas of the Great Barrier Reef Marine Park. J. Exp. Mar. Biol. Ecol. 2004, 302, 123–152. [Google Scholar] [CrossRef]
  37. Unsworth, R.K.F.; Peters, J.R.; McCloskey, R.M.; Hinder, S.L. Optimising stereo baited underwater video for sampling fish and invertebrates in temperate coastal habitats. Estuar. Coast. Shelf Sci. 2014, 150, 281–287. [Google Scholar] [CrossRef]
  38. Willis, T.J.; Millar, R.B.; Babcock, R.C. Detection of spatial variability in relative density of fishes: Comparison of visual census, angling, and baited underwater video. Mar. Ecol. Prog. Ser. 2000, 198, 249–260. [Google Scholar] [CrossRef]
  39. Bruns, S.; Henderson, A.C. A baited remote underwater video system (BRUVS) assessment of elasmobranch diversity and abundance on the eastern Caicos Bank (Turks and Caicos Islands); an environment in transition. Environ. Biol. Fishes 2020, 103, 1001–1012. [Google Scholar] [CrossRef]
  40. Whitmarsh, S.K.; Fairweather, P.G.; Huveneers, C. What is Big BRUVver up to? Methods and uses of baited underwater video. Rev. Fish. Biol. Fish. 2017, 27, 53–73. [Google Scholar] [CrossRef]
  41. Campbell, M.D.; Pollack, A.G.; Gledhill, C.T.; Switzer, T.S.; Devries, D.A. Comparison of relative abundance indices calculated from two methods of generating video count data. Fish. Res. 2015, 170, 125–133. [Google Scholar] [CrossRef]
  42. Kilfoil, J.P.; Wirsing, A.J.; Campbell, M.D.; Kiszka, J.J.; Gastrich, K.R.; Heithaus, M.R.; Zhang, Y.; Bond, M.E. Baited Remote Underwater Video surveys undercount sharks at high densities: Insights from full-spherical camera technologies. Mar. Ecol. Prog. Ser. 2017, 585, 113–121. [Google Scholar] [CrossRef]
  43. Sherman, C.S.; Chin, A.; Heupel, M.R.; Simpfendorfer, C.A. Are we underestimating elasmobranch abundances on baited remote underwater video systems (BRUVS) using traditional metrics? J. Exp. Mar. Biol. Ecol. 2018, 503, 80–85. [Google Scholar] [CrossRef]
  44. Gore, M.; Ormond, R.; Clarke, C.; Kohler, J.; Millar, C.; Brooks, E. Application of Photo-Identification and Lengthened Deployment Periods to Baited Remote Underwater Video Stations (BRUVS) Abundance Estimates of Coral Reef Sharks. Oceans 2020, 1, 274–299. [Google Scholar] [CrossRef]
  45. Castro, A.L.F.; Rosa, R.S. Use of natural marks on population estimates of the nurse shark, Ginglymostoma cirratum, at Atol das Rocas Biological Reserve, Brazil. Environ. Biol. Fishes 2005, 72, 213–221. [Google Scholar] [CrossRef]
  46. Domeier, M.L.; Nasby-Lucas, N. Annual re-sightings of photographically identified white sharks (Carcharodon carcharias) at an eastern Pacific aggregation site (Guadalupe Island, Mexico). Mar. Biol. 2007, 150, 977–984. [Google Scholar] [CrossRef]
  47. Dudgeon, C.L.; Noad, M.J.; Lanyon, J.M. Abundance and demography of a seasonal aggregation of zebra sharks Stegostoma fasciatum. Mar. Ecol. Prog. Ser. 2008, 368, 269–281. [Google Scholar] [CrossRef]
  48. Lester, E.; Meekan, M.; Barnes, P.; Raudino, H.; Rob, D.; Waples, K.; Speed, C. Multi-year patterns in scarring, survival and residency of whale sharks in Ningaloo Marine Park, Western Australia. Mar. Ecol. Prog. Ser. 2020, 634, 115–126. [Google Scholar] [CrossRef]
  49. Harasti, D.; Lee, K.A.; Laird, R.; Bradford, R.; Bruce, B. Use of stereo baited remote underwater video systems to estimate the presence and size of white sharks (Carcharodon carcharias). Mar. Freshw. Res. 2016, 68, 1391–1396. [Google Scholar] [CrossRef]
  50. Stoffers, T.; de Graaf, M.; Winter, H.; Nagelkerke, L. Distribution and ontogenetic habitat shifts of reef-associated shark species in the northeastern Caribbean. Mar. Ecol. Prog. Ser. 2021, 665, 145–158. [Google Scholar] [CrossRef]
  51. Espinoza, M.; Cappo, M.; Heupel, M.R.; Tobin, A.J.; Simpfendorfer, C.A. Quantifying shark distribution patterns and species-habitat associations: Implications of Marine Park zoning. PLoS ONE 2014, 9, e106885. [Google Scholar] [CrossRef]
  52. Gladstone, W.; Lindfield, S.; Coleman, M.; Kelaher, B. Optimisation of baited remote underwater video sampling designs for estuarine fish assemblages. J. Exp. Mar. Biol. Ecol. 2012, 429, 28–35. [Google Scholar] [CrossRef]
  53. Harasti, D.; Malcolm, H.; Gallen, C.; Coleman, M.A.; Jordan, A.; Knott, N.A. Appropriate set times to represent patterns of rocky reef fishes using baited video. J. Exp. Mar. Biol. Ecol. 2015, 463, 173–180. [Google Scholar] [CrossRef]
  54. Thompson, G.G.; Withers, P.C. Effect of species richness and relative abundance on the shape of the species accumulation curve. Austral Ecol. 2003, 28, 355–360. [Google Scholar] [CrossRef]
  55. De Vos, L.; Götz, A.; Winker, H.; Attwood, C.G. Optimal BRUVs (baited remote underwater video system) survey design for reef fish monitoring in the Stilbaai Marine Protected Area. Afr. J. Mar. Sci. 2014, 36, 1–10. [Google Scholar] [CrossRef]
  56. White, J.; Simpfendorfer, C.A.; Tobin, A.J.; Heupel, M.R. Application of baited remote underwater video surveys to quantify spatial distribution of elasmobranchs at an ecosystem scale. J. Exp. Mar. Biol. Ecol. 2013, 448, 281–288. [Google Scholar] [CrossRef]
  57. Baremore, I.E.; Polanco-Vásquez, F.; Hacohen-Domené, A.; Castellanos, D.W.; Graham, R.T. Short-term movement of a night shark (Carcharhinus signatus) in the western Caribbean with notes on the species’ distribution and threats in the region. Environ. Biol. Fishes 2019, 102, 519–526. [Google Scholar] [CrossRef]
  58. Bond, M.E.; Valentin-Albanese, J.; Babcock, E.A.; Heithaus, M.R.; Grubbs, R.D.; Cerrato, R.; Peterson, B.J.; Pikitch, E.K.; Chapman, D.D. Top predators induce habitat shifts in prey within marine protected areas. Oecologia 2019, 190, 375–385. [Google Scholar] [CrossRef]
  59. Flowers, K.I.; Babcock, E.A.; Papastamatiou, Y.P.; Bond, M.E.; Lamb, N.; Miranda, A.; Nuñez, R.; Valentin-Albanese, J.; Clementi, G.M.; Kelley, M.C.; et al. Varying reef shark abundance trends inside a marine reserve: Evidence of a Caribbean reef shark decline. Mar. Ecol. Prog. Ser. 2022, 683, 97–107. [Google Scholar] [CrossRef]
  60. Leurs, G.; De Graaf, M.; Hassell-Knijff, D.; Izioka, L.A.K.; Van Looijengoed, W.; Schlochtern, M.P.M.Z.; Bervoets, T.; Nagelkerke, L.A.J.; Winter, H.V. An integrated baseline assessment of reef-associated sharks around Saba (Dutch Caribbean), combining three methods: Stereo-BRUVs, telemetry and citizen science. R. Soc. Open Sci. 2025, 12, 241754. [Google Scholar] [CrossRef] [PubMed]
  61. Maljković, A.; Côté, I.M. Effects of tourism-related provisioning on the trophic signatures and movement patterns of an apex predator, the Caribbean reef shark. Biol. Conserv. 2011, 144, 859–865. [Google Scholar] [CrossRef]
  62. Phenix, L.M.; Tricarico, D.; Quintero, E.; Bond, M.E.; Brandl, S.J.; Gallagher, A.J. Evaluating the effects of large marine predators on mobile prey behavior across subtropical reef ecosystems. Ecol. Evol. 2019, 9, 13740–13751. [Google Scholar] [CrossRef]
  63. Priede, I.G.; Merrett, N.R. Estimation of abundance of abyssal demersal fishes; a comparison of data from trawls and baited cameras. J. Fish Biol. 1996, 49, 207–216. [Google Scholar] [CrossRef]
  64. Ghazilou, A.; Shokri, M.R.; Gladstone, W. Animal v. plant-based bait: Does the bait type affect census of fish assemblages and trophic groups by baited remote underwater video (BRUV) systems? J. Fish Biol. 2016, 88, 1731–1745. [Google Scholar] [CrossRef]
  65. Wraith, J.; Lynch, T.; Minchinton, T.E.; Broad, A.; Davis, A.R. Bait type affects fish assemblages and feeding guilds observed at baited remote underwater video stations. Mar. Ecol. Prog. Ser. 2013, 477, 189–199. [Google Scholar] [CrossRef]
  66. Bassett, D.K.; Montgomery, J.C. Investigating nocturnal fish populations in situ using baited underwater video: With special reference to their olfactory capabilities. J. Exp. Mar. Biol. Ecol. 2011, 409, 194–199. [Google Scholar] [CrossRef]
  67. Coghlan, A.R.; Mclean, D.L.; Harvey, E.S.; Langlois, T.J. Does fish behaviour bias abundance and length information collected by baited underwater video? J. Exp. Mar. Biol. Ecol. 2017, 497, 143–151. [Google Scholar] [CrossRef]
  68. Devine, B.M.; Wheeland, L.J.; Fisher, J.A.D. First estimates of Greenland shark (Somniosus microcephalus) local abundances in Arctic waters. Sci. Rep. 2018, 8, 974. [Google Scholar] [CrossRef] [PubMed]
  69. Cappo, M.; Stowar, M.; Syms, C.; Johansson, C.; Cooper, T. Fish-habitat associations in the region offshore from James Price Point—A rapid assessment using Baited Remote Underwater Video Stations (BRUVS). J. R. Soc. West. Aust. 2011, 94, 303–321. Available online: https://researchonline.jcu.edu.au/21403/ (accessed on 27 July 2025).
  70. Schobernd, Z.H.; Bacheler, N.M.; Conn, P.B. Examining the utility of alternative video monitoring metrics for indexing reef fish abundance. Can. J. Fish. Aquat. Sci. 2014, 71, 464–471. [Google Scholar] [CrossRef]
  71. Smale, D.A.; Barnes, D.K.A.; Fraser, K.P.P.; Mann, P.J.; Brown, M.P. Scavenging in Antarctica: Intense variation between sites and seasons in shallow benthic necrophagy. J. Exp. Mar. Biol. Ecol. 2007, 349, 405–417. [Google Scholar] [CrossRef]
  72. Kohler, J.; Gore, M.; Ormond, R.; Austin, T.; Olynik, J. The Sharklogger Network–monitoring Cayman Islands shark populations through an innovative citizen science program. PLoS ONE 2025, 20, e0319637. [Google Scholar] [CrossRef]
  73. Gallagher, A.J.; Shipley, O.N.; De Silva, C.; Kohler, J.K.; Fernandes, T.F.; Austin, T.; Ormond, R.F.; Gore, M.A. First records of the blurred lantern shark Etmopterus bigelowi from the Cayman Islands, Western Atlantic. Front. Mar. Sci. 2023, 10, 1165207. [Google Scholar] [CrossRef]
  74. Dixon, O.F.L.; Aldridge, S.E.; Kohler, J.K.; Veeder, A.; Chin, P.; Fernandes, T.F.; Austin, T.; Ormond, R.F.; Gore, M.A.; Vaz, D.F.B.; et al. First records of the roughskin dogfish Centroscymnus owstonii in the greater Antilles, central Caribbean Sea, Western Atlantic Ocean. J. Fish Biol. 2024, 106, 980–986. [Google Scholar] [CrossRef]
  75. Cayman Islands Government. The National Conservation Law, 2013 (Law 24 of 2013). Supplement No. 1 Published with Extraordinary Gazette No. 9. 5 February 2014. Available online: https://doe.ky/wp-content/uploads/2015/01/NationalConservationLaw-Es052014_web.pdf (accessed on 18 July 2025).
  76. Coelho, V.R.; Manfrino, C. Coral community decline at a remote Caribbean island: Marine no-take reserves are not enough. Aquat. Conserv. Mar. Freshw. Ecosyst. 2007, 17, 666–685. [Google Scholar] [CrossRef]
  77. Ebanks-Petrie, G. Assessment of Coastal Management on Grand Cayman, B.W.I. Master’s Thesis, University of Stirling, Stirling, UK, 1993. [Google Scholar]
  78. Novelo-Casanova, D.A.; Suárez, G. Natural and man-made hazards in the Cayman Islands. Nat. Hazards 2010, 55, 441–466. [Google Scholar] [CrossRef]
  79. Tebbett, S.B.; Hoey, A.S.; Depczynski, M.; Wismer, S.; Bellwood, D.R. Macroalgae removal on coral reefs: Realised ecosystem functions transcend biogeographic locations. Coral Reefs 2020, 39, 203–214. [Google Scholar] [CrossRef]
  80. Shi, W.; Liu, G. Potential mechanisms underpinning the impacts of ocean acidification on marine animals. In Ocean Acidification and Marine Wildlife; Academic Press: Cambridge, MA, USA, 2021; pp. 155–192. [Google Scholar] [CrossRef]
  81. Bernard, A.M.; Horn, R.L.; Chapman, D.D.; Feldheim, K.A.; Garla, R.C.; Brooks, J.; Gore, M.A.; Shivji, M.S. Genetic connectivity of a coral reef ecosystem predator: The population genetic structure and evolutionary history of the Caribbean reef shark (Carcharhinus perezi). J. Biogeogr. 2017, 44, 2488–2500. [Google Scholar] [CrossRef]
  82. Espinoza, M.; Heupel, M.R.; Tobin, A.J.; Simpfendorfer, C.A. Residency patterns and movements of grey reef sharks (Carcharhinus amblyrhynchos) in semi-isolated coral reef habitats. Mar. Biol. 2014, 162, 343–358. [Google Scholar] [CrossRef]
  83. Roberts, H.H. Reefs and Lagoons of Grand Cayman. In The Cayman Islands: Natural History and Biogeography; Kluwer Academic Publishers: Dordrecht, The Netherlands, 1994; pp. 75–104. [Google Scholar]
  84. Burgess, G.H.; Smith, S.H.; Lane, E.D. Fishes of the Cayman Islands. In The Cayman Islands: Natural History and Biogeography; Kluwer Academic Publishers: Dordrecht, The Netherlands, 1994; pp. 199–228. [Google Scholar]
  85. Logan, A. Reefs and Lagoons of Cayman Brac and Little Cayman. In The Cayman Islands: Natural History and Biogeography; Kluwer Academic Publishers: Dordrecht, The Netherlands, 1994; pp. 105–124. [Google Scholar]
  86. Van Horn, C.J.; Candelmo, A.C.; Heppell, S.A.; McCoy, C.R.M.; Pattengill-Semmens, C.V.; Waterhouse, L.; Cherubin, L.M.; Taylor, J.C.; Michaels, W.; Locascio, J.; et al. Hydrophone placement yields high variability in detection of Epinephelus striatus calls at a spawning site. Ecol. Appl. 2025, 35, e70081. [Google Scholar] [CrossRef]
  87. Wilson, K.C.; Semmens, B.X.; Gittings, S.R.; McCoy, C.; Pattengill-Semmens, C.V.; Širović, A. Grouper source levels and aggregation dynamics inferred from passive acoustic localization at a multispecies spawning site. J. Acoust. Soc. Am. 2022, 151, 3052–3065. [Google Scholar] [CrossRef]
  88. Aldridge, S.E.; Dixon, O.F.L.; de Silva, C.; Kohler, J.K.; Shipley, O.N.; Phillips, B.T.; Fernandes, T.F.; Austin, T.; Ormond, R.F.; Gore, M.A.; et al. Depth Range Extension for the Misty Grouper Hyporthodus mystacinus Documented via Deep-Sea Landers throughout the Greater Caribbean. Fishes 2024, 9, 114. [Google Scholar] [CrossRef]
  89. McCoy, C.; Dromard, C.R.; Turner, J.R. An Evaluation of Grand Cayman MPA Performance: A Comparative Study of Coral Reef Fish Communities. In Proceedings of the 62nd Gulf Caribb Fish Inst, Cumana, Venezuela, 2–6 November 2009; pp. 337–345. [Google Scholar]
  90. Whitney, N.M.; Lear, K.O.; Gaskins, L.C.; Gleiss, A.C. The effects of temperature and swimming speed on the metabolic rate of the nurse shark (Ginglymostoma cirratum, Bonaterre). J. Exp. Mar. Biol. Ecol. 2016, 477, 40–46. [Google Scholar] [CrossRef]
  91. Ebert, D.A.; Fowler, S.; Compagno, L. Sharks of the World. A Fully Illustrated Guide; Wild Nature Press: Plymouth, UK, 2013; p. 528. [Google Scholar]
  92. Humann, P.; DeLoach, N. Reef Fish Identification: Florida, Caribbean, Bahamas, 4th ed.; New World Publications: Jacksonville, FL, USA, 2014; p. 548. [Google Scholar]
  93. Currey-Randall, L.M.; Cappo, M.; Simpfendorfer, C.A.; Farabaugh, N.F.; Heupel, M.R. Optimal soak times for Baited Remote Underwater Video Station surveys of reef-associated elasmobranchs. PLoS ONE 2020, 15, e0231688. [Google Scholar] [CrossRef]
  94. Jabado, R.W.; Al Hameli, S.M.; Grandcourt, E.M.; Al Dhaheri, S.S. Low abundance of sharks and rays in baited remote underwater video surveys in the Arabian Gulf. Sci. Rep. 2018, 8, 15597. [Google Scholar] [CrossRef] [PubMed]
  95. Marshall, A.D.; Pierce, S.J. The use and abuse of photographic identification in sharks and rays. J. Fish Biol. 2012, 80, 1361–1379. [Google Scholar] [CrossRef]
  96. Siddiqui, S.A.; Salman, A.; Malik, M.I.; Shafait, F.; Mian, A.; Shortis, M.R.; Harvey, E.S. Automatic fish species classification in underwater videos: Exploiting pre-trained deep neural network models to compensate for limited labelled data. ICES J. Mar. Sci. 2018, 75, 374–389. [Google Scholar] [CrossRef]
  97. McConville, A.J.; Keane, I.A.; Coulson, T.; Bekenov, A.B.; Milner-Gulland, E.J. Reconstructing the observation process to correct for changing detection probability of a critically endangered species. Endanger. Species Res. 2009, 6, 231–237. [Google Scholar] [CrossRef]
  98. Bradley, D.; Papastamatiou, Y.P.; Caselle, J.E. No persistent behavioural effects of SCUBA diving on reef sharks. Mar. Ecol. Prog. Ser. 2017, 567, 173–184. [Google Scholar] [CrossRef]
  99. Southall, E.J.; Sims, D.W.; Witt, M.J.; Metcalfe, J.D. Seasonal space-use estimates of basking sharks in relation to protection and political-economic zones in the North-east Atlantic. Biol. Conserv. 2006, 132, 33–39. [Google Scholar] [CrossRef]
  100. Merrett, N.R.; Domanski, P.A. Observations on the Ecology of Deep-Sea Bottom-Living Fishes Collected off Northwest Africa: II. The Moroccan Slope (27°–34°N), with Special Reference to Synaphobranchus kaupi. Biol. Oceanogr. 1985, 3, 349–399. [Google Scholar] [CrossRef]
  101. Ward-Paige, C.; Flemming, J.M.; Lotze, H.K. Overestimating fish counts by non-instantaneous visual censuses: Consequences for population and community descriptions. PLoS ONE 2010, 5, e11722. [Google Scholar] [CrossRef]
  102. Gilmour, M.E.; Adams, J.; Block, B.A.; Caselle, J.E.; Friedlander, A.M.; Game, E.T.; Hazen, E.L.; Holmes, N.D.; Lafferty, K.D.; Maxwell, S.M.; et al. Evaluation of MPA designs that protect highly mobile megafauna now and under climate change scenarios. Glob. Ecol. Conserv. 2022, 35, e02070. [Google Scholar] [CrossRef]
  103. Kohler, J. The Comparative Abundance and Behaviour of Sharks in the Cayman Islands (BWI). Ph.D. Thesis, Heriot-Watt University, Edinburgh, UK, 2022. Available online: https://hdl.handle.net/10399/4769 (accessed on 27 July 2025).
  104. Kohler, J.; Gore, M.; Ormond, R.; Johnson, B.; Austin, T. Individual residency behaviours and seasonal long-distance movements in acoustically tagged Caribbean reef sharks in the Cayman Islands. PLoS ONE 2023, 18, e0293884. [Google Scholar] [CrossRef]
  105. Ferreira, L.C.; Thums, M.; Meeuwig, J.J.; Vianna, G.M.S.; Stevens, J.; McAuley, R.; Meekan, M.G. Crossing Latitudes-Long-Distance Tracking of an Apex Predator. PLoS ONE 2015, 10, e0116916. [Google Scholar] [CrossRef]
  106. Castro, J.I. The Biology of the Nurse Shark, Ginglymostoma cirratum, Off the Florida East Coast and the Bahama Islands. Environ. Biol. Fishes 2000, 58, 1–22. [Google Scholar] [CrossRef]
  107. Bernal, D.; Carlson, J.K.; Goldman, K.J.; Lowe, C.G. Energetics, metabolism, and endothermy in sharks and rays. In Biology of Sharks and Their Relatives, 2nd ed.; Carrier, J.C., Musick, J.A., Heithaus, M.C., Eds.; Taylor and Francis Group, LLC.: Boca Raton, FL, USA, 2012; pp. 211–237. [Google Scholar]
  108. Carlson, J.K.; Goldman, K.J.; Lowe, C.G. Metabolism, energetic demand, and endothermy. In Biology of Sharks and Their Relatives; Carrier, J.C., Musick, J.A., Heithaus, M.C., Eds.; CRC Press: Boca Raton, FL, USA, 2004; pp. 203–224. [Google Scholar]
  109. Dorman, S.R.; Harvey, E.S.; Newman, S.J. Bait effects in sampling coral reef fish assemblages with stereo-BRUVs. PLoS ONE 2012, 7, e41538. [Google Scholar] [CrossRef]
  110. Doan, M.D.; Kajiura, S.M. Adult blacktip sharks (Carcharhinus limbatus) use shallow water as a refuge from great hammerheads (Sphyrna mokarran). J. Fish Biol. 2020, 96, 1530–1533. [Google Scholar] [CrossRef]
  111. Springer, S. Social organization of shark populations. In Sharks, Skates and Rays; Mathewson, R., Rall, D., Eds.; Gilbert PW Johns Hopkins Press: Baltimore, MD, USA, 1967; pp. 149–174. [Google Scholar]
  112. Cortes, E. Standardized diet compositions and trophic levels of sharks. ICES J. Mar. Sci. 1999, 56, 707–717. [Google Scholar] [CrossRef]
  113. Roff, G.; Brown, C.J.; Priest, M.A.; Mumby, P.J. Decline of coastal apex shark populations over the past half century. Commun. Biol. 2018, 1, 223. [Google Scholar] [CrossRef] [PubMed]
  114. Simpfendorfer, C.A.; Goodreid, A.B.; McAuley, R.B. Size, sex and geographic variation in the diet of the tiger shark, Galeocerdo cuvier, from Western Australian waters. Environ. Biol. Fishes 2001, 61, 37–46. [Google Scholar] [CrossRef]
  115. Chapman, D.D.; Pikitch, E.K.; Babcock, E.A.; Shivji, M.S. Deep-diving and diel changes in vertical habitat use by Caribbean reef sharks Carcharhinus perezi. Mar. Ecol. Prog. Ser. 2007, 344, 271–275. [Google Scholar] [CrossRef]
  116. Schlaff, A.M.; Heupel, M.R.; Udyawer, V.; Simpfendorfer, C.A. Sex-based differences in movement and space use of the blacktip reef shark, Carcharhinus melanopterus. PLoS ONE 2020, 15, e0231142. [Google Scholar] [CrossRef] [PubMed]
  117. Bolger, D.T.; Morrison, T.A.; Vance, B.; Lee, D.; Farid, H. A computer-assisted system for photographic mark-recapture analysis. Methods Ecol. Evol. 2012, 3, 813–822. [Google Scholar] [CrossRef]
  118. Hiby, L.; Lovell, P. A note on an automated system for matching the callosity patterns on aerial photographs of southern right whales. J. Cetacean Res. Manag. 2001, 2, 291–295. [Google Scholar] [CrossRef]
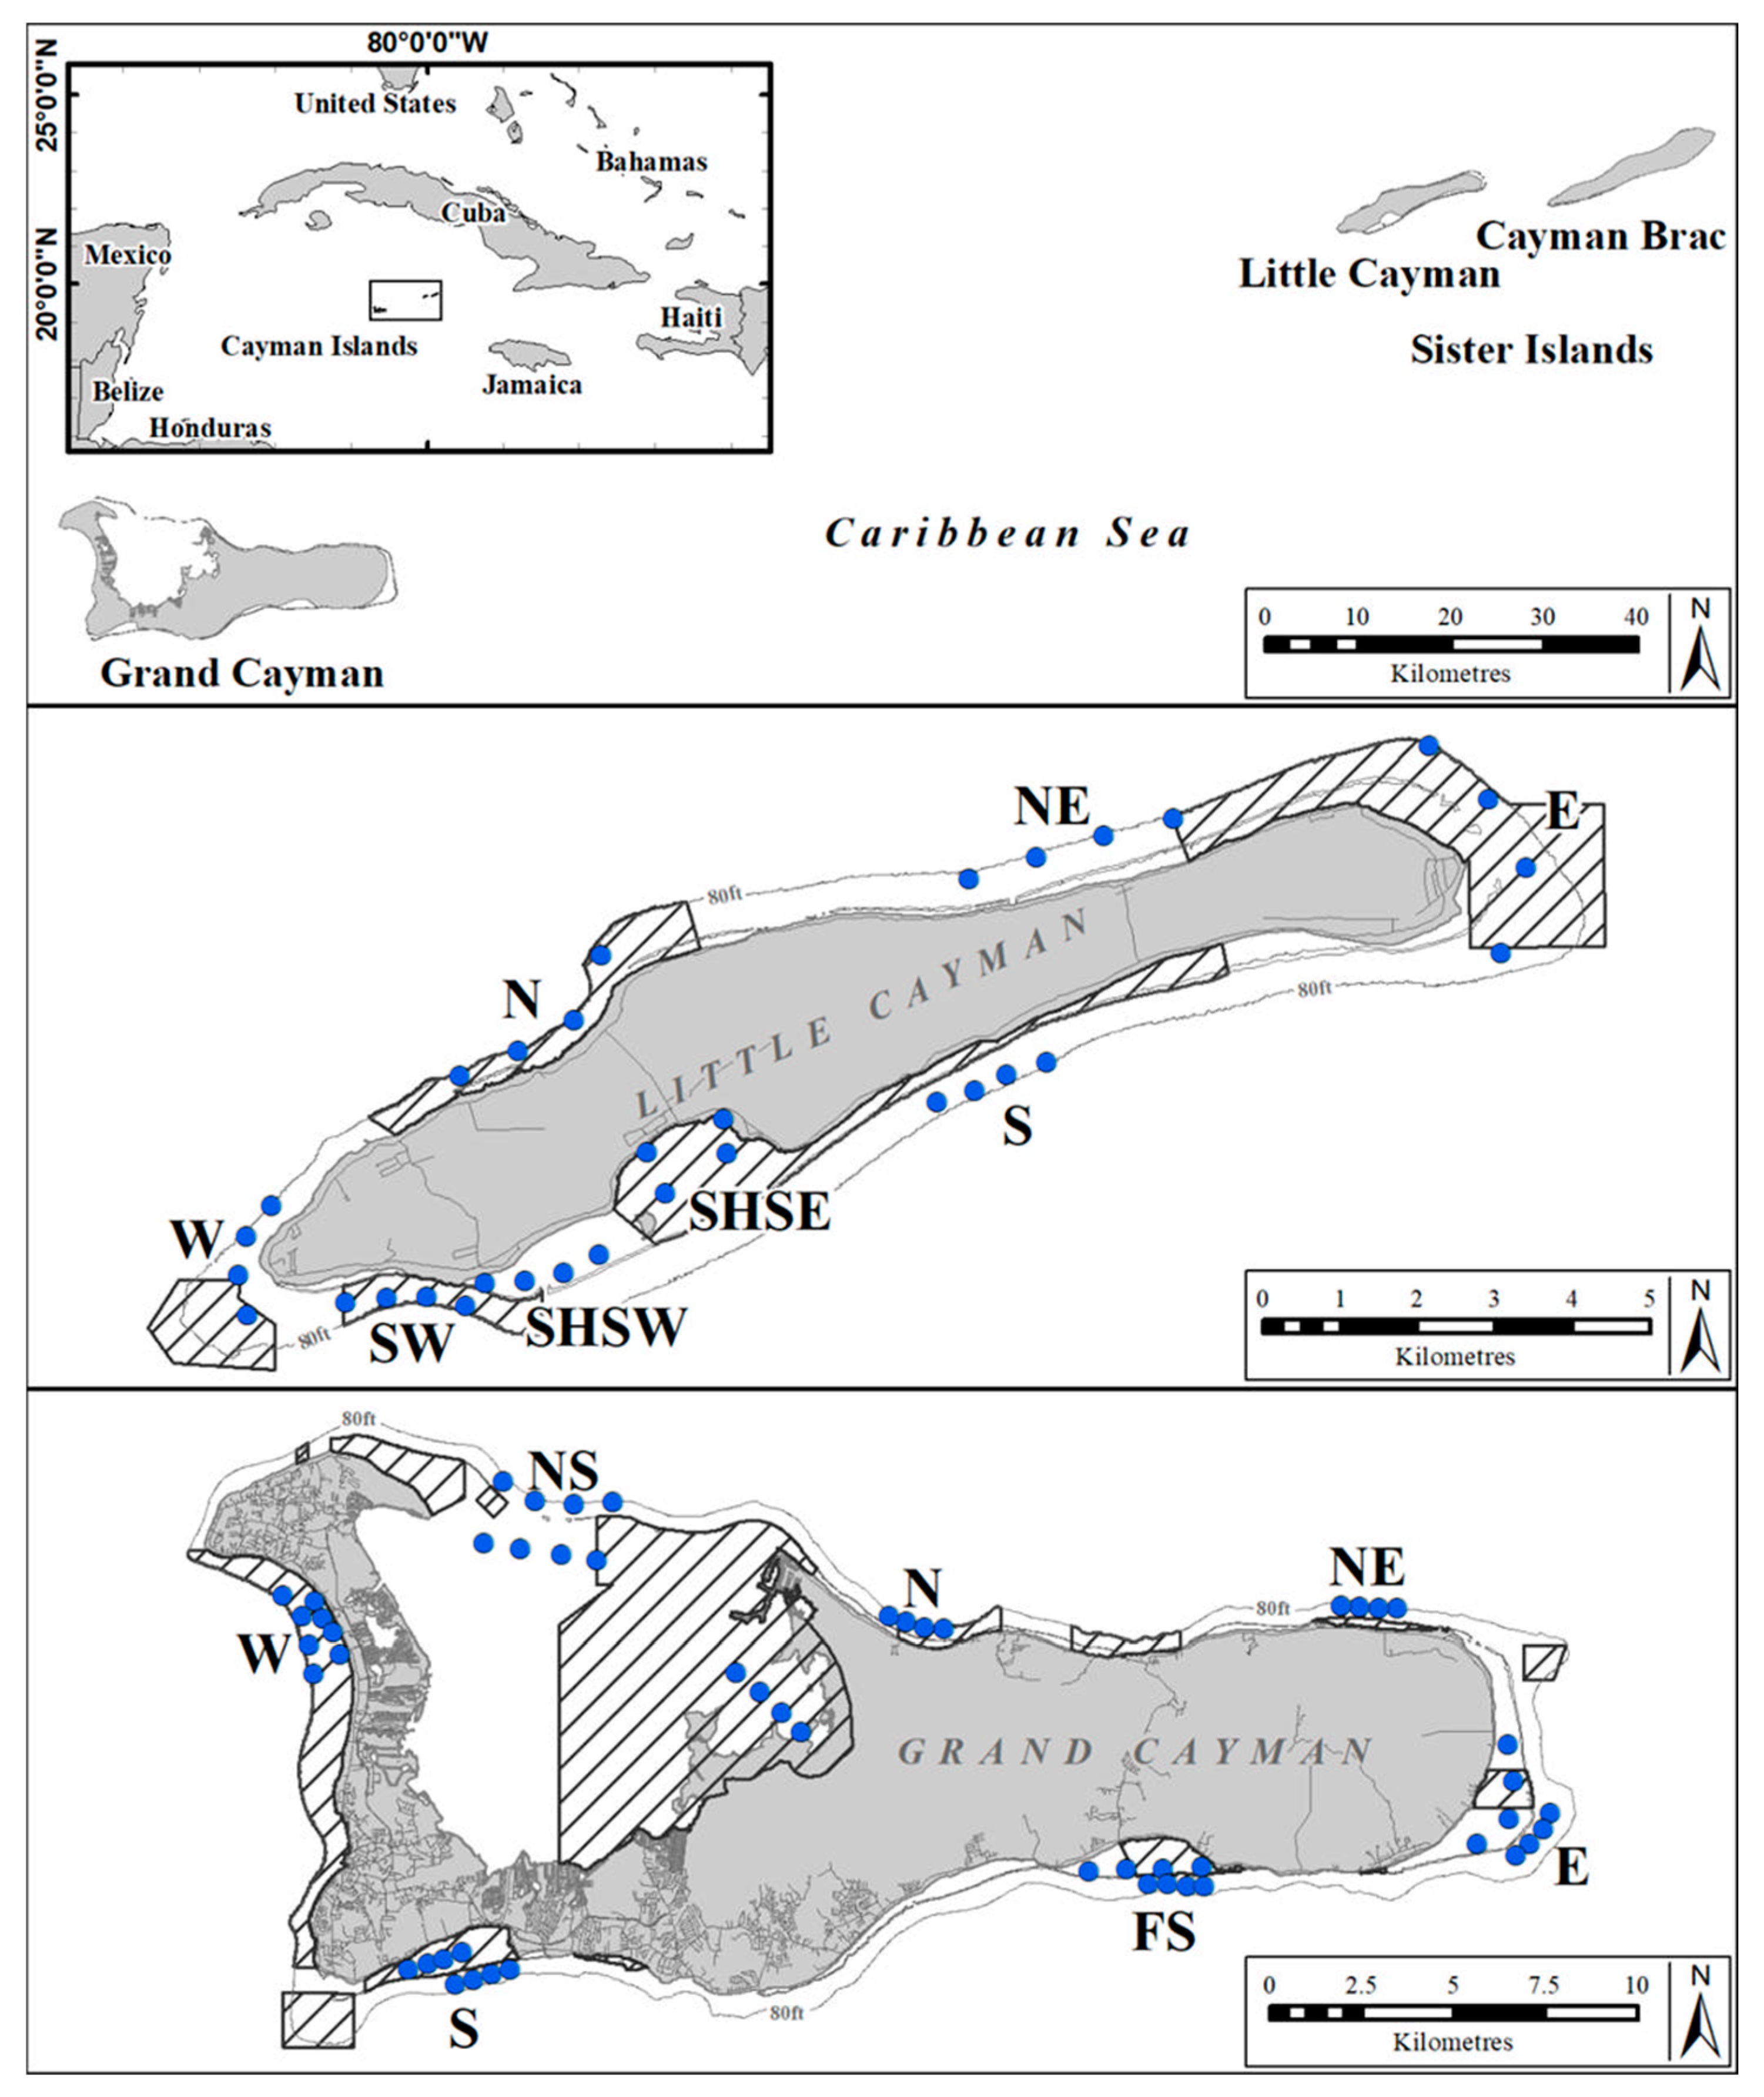
Figure 1. Standardised sampling areas (letters) and individual BRUV deployment sites (rows of four blue dots indicating four replicate BRUV deployments) on Grand Cayman (13 areas) and on Little Cayman (8 areas) used repeatedly throughout the study period (2015–2018). Cross-hatched areas indicate the extent of MPAs. Created by the Department of Environment, Cayman Islands Government. Insert layer’s geography was developed by Esri and sourced from Garmin International, Inc., the U.S. Central Intelligence Agency (The World Factbook) and the National Geographic Society for use as a world basemap [90].
Oceans 06 00070 g001
Figure 2. Design of Mono-BRUV unit deployed in the Cayman Islands.
Oceans 06 00070 g002
Figure 3. Cumulative proportions of all species combined (black), Caribbean reef shark (blue) and nurse shark (orange) recorded on BRUVs (n = 499) against recording time in the Cayman Islands (2015–2018). Green lines indicate the video time of 90 min and the corresponding % shark abundances, dashed black line marks 95% shark abundance and corresponding time, solid black line indicates 100% shark abundance with the corresponding time stamps for (A) Caribbean reef shark and (B) nurse shark.
Oceans 06 00070 g003
Figure 4. Mean (±SE) MaxN (white) and MaxIND (striped) of each shark species recorded on BRUVs (n = 557, 90 min) in the Cayman Islands (2015–2018). Significant differences (p < 0.05) are marked with *.
Oceans 06 00070 g004
Figure 5. Comparison for the species of shark recorded on BRUVs (n = 499, 211.03 min) of mean values (±SE) of (a) Tarrive, (b) Tvist and (c) activity level. Significant differences (p < 0.05) are marked with * and reported in Table S2.
Oceans 06 00070 g005aOceans 06 00070 g005b
Figure 6. Mean (±SE) Tarrive (white), Tvisit (grey) and activity level (striped) of shark demographics from BRUVs (n = 499, 211.03 min) in the Cayman Islands (2015–2018). Significant differences (p < 0.05) are marked with *.
Oceans 06 00070 g006
Table 1. Mean (±SE) and range of Tarrive, Tvisit and activity level of all sharks combined from BRUVs (n = 499, maximum length = 211.03 min) in the Cayman Islands (2015–2018).
Behaviour MetricMean (±SE)Range
Tarrive (min)62.84 (±1.53)1.23–164.12
Tvisit (min)6.92 (±0.48)0.07–84.23
Activity level 116.08 (±1.19)1–176
1 Count of re-entries of an individual shark.
Disclaimer/Publisher’s Note: The statements, opinions and data contained in all publications are solely those of the individual author(s) and contributor(s) and not of MDPI and/or the editor(s). MDPI and/or the editor(s) disclaim responsibility for any injury to people or property resulting from any ideas, methods, instructions or products referred to in the content.