Abstract
The Ionian Sea plays a crucial role as a crossroads for various Mediterranean water masses, making it a significant factor in the seawater budgets, biogeochemistry, and biodiversity of the subbasins of the Mediterranean Sea. In recent years, numerous theories have been proposed in an effort to better understand the complex hydrography and dynamics of the Ionian. These theories primarily focus on the variability of the basin’s near-surface circulation, which is characterized by a recurring reversal that occurs over a period of 10–13 years. This variability is often attributed to internal processes and/or boundary forcing, as waters of Atlantic origin enter the basin from its western boundary. In this study, we utilize temperature–salinity profiles and absolute dynamic topography data provided by the Copernicus database to examine long-term changes in the vertical structure of the basin and their relationships with changes in the horizontal near-surface circulation. Our findings show that the vertical dependency of the density field of the basin undergoes significant fluctuations over interannual and decadal time scales, which induce important buoyancy changes throughout the water column and determine changes in the structure of the first baroclinic mode. However, no changes in the basin-averaged hydrographic structure can be related to the near-surface current reversals. These reversals are mainly associated with deformations of the main isopycnal surface, intended as the region of maximum buoyancy over the water column, suggesting that they do not impact the hydrographic properties of the various Ionian water masses. Instead, they alter their routes and relative volumes within different parts of the basin.
1. Introduction
The Mediterranean Sea is a semi-enclosed mid-latitude basin with complex geography, as shown in Figure 1. It is divided into two main sub-basins, the Western Mediterranean (WMED) and the Eastern Mediterranean (EMED), connected by the Channel of Sicily. The general surface circulation of the basin is often described as an open thermohaline cell that connects the WMED and EMED. Atlantic waters (AW) enter the Mediterranean through the Strait of Gibraltar and undergo modifications while traveling towards the EMED (see Figure 1 top, pale blue line). For a comprehensive review of the Mediterranean’s general circulation, refer to the study by Malanotte-Rizzoli et al. [1]. In the easternmost Levantine basin, AW is transformed into Levantine intermediate water (LIW), one of the saltiest water masses, through air–sea heat and moisture fluxes. This water then crosses the entire basin below the surface and exits into the Atlantic Ocean through the Gibraltar Strait at depths ranging from 150 to 500 m (see Figure 1 top, green line). Both the WMED and EMED have deep convection cells in the Liguro-Provencal basin, the Adriatic Sea, the Aegean Sea, and the Levantine basin, where deep Mediterranean water masses are formed.
In this complex picture of the surface, intermediate, and deep circulation, the Northern Ionian (NI) serves as a crossroads for various Mediterranean masses, and its circulation plays a significant role in the seawater budgets [2,3], biogeochemistry [4], and biodiversity [5,6,7] of the adjacent sub-basins. The vertical structure of the Ionian is characterized by three layers: the first layer, extending from the surface to a depth of approximately 150 m, consists of AW; the second layer, spanning from 150 m to 500 m of depth, is an interface layer composed of LIW; and the third layer, from 500 m to the bottom, is made up of deep waters originating from the Adriatic and/or Aegean Seas (see, e.g., [8,9]). Under normal conditions, the prevailing source of Ionian deep waters is the Adriatic Sea. However, in the early 1990s, the main source of EMED deep waters shifted to the Aegean Sea, producing a volume of dense water significantly larger than that from the Adriatic. This phenomenon, commonly referred to as the Eastern Mediterranean Transient (EMT) [10], began in the late 1980s and lasted until the mid-1990s, but its impact on the deep Mediterranean circulation continued to be observed in the subsequent years [11]. Therefore, in the following, we will refer to Ionian deep waters (IdWs) in a broad sense, including waters originating from both the Adriatic and the Aegean.
Over the last decade and a half, intense research has been devoted to studying the Ionian circulation and its driving forces. These studies have revealed that the near-surface circulation in the NI is dominated by a large eddy system, commonly referred to as the Northern Ionian Gyre (NIG), which covers the entire northern part of the basin [12]. The circulation in this gyre has been observed to reverse over a decadal time scale [13,14]. Many theories have been proposed to explain this decadal switch in polarity of the NIG. The first theory suggests that NIG current reversals are linked to changes in the wind stress curl [15,16,17]. The second theory proposes that NIG reversals are caused by baroclinic (internal) vorticity production, induced by changes in the horizontal pressure gradient due to injections of Adriatic deep water (AdDW) [2,13]. Rubino et al. [18] and Gačić et al. [19], using tank experiments and numerical modeling, have demonstrated that the polarity switch of the NIG can indeed be induced by the injection of dense water on a sloping bottom. Another theory, proposed by Crisciani and Mosetti [20], explains the oscillation of the NI circulation as a result of a stochastic resonance. Recently, Eusebi Borzelli and Carniel [21] developed a theoretical two-layer model of the NI. Their work demonstrated that the release of potential energy resulting from the disruption of equilibrium between internal fluid pressure and external forcing can induce a damped oscillation with timescales that align with observations. In a separate study, Eusebi Borzelli et al. [22] focused on the role of the first baroclinic mode in determining the variability of the basin’s horizontal circulation. Their findings indicate that the only dynamically active interface is a layer located between the LIW core and the LIW-IdW interface at a depth of approximately 350–400 m, and that the NIG reversal is strongly linked to the circulation field associated with the first baroclinic mode.
Napolitano et al. [22] recently proposed another theory for the reversal of the NIG, according to which NIG reversals can be explained by the combined effect of reduced cyclonic winds, which are typical in the basin, and low kinetic energy levels of the Atlantic Ionian Stream (AIS). This highlights the crucial role played by boundary conditions along the western border of the Ionian Sea in the NIG transition.
All these theories stem from the observation that the wind stress over the Ionian basin is predominantly cyclonic and does not vary over the decadal time-scale [2,13,14,21,22]. This led the scientific community to underline the crucial role played by internal processes in determining the inversion of the near-surface current [2,13,14,18,19,20,21,22]. This research aims to contribute to this ongoing scientific discussion by examining the relationship between changes in the near-surface circulation and changes in the stratification regime of the basin using experimental data.
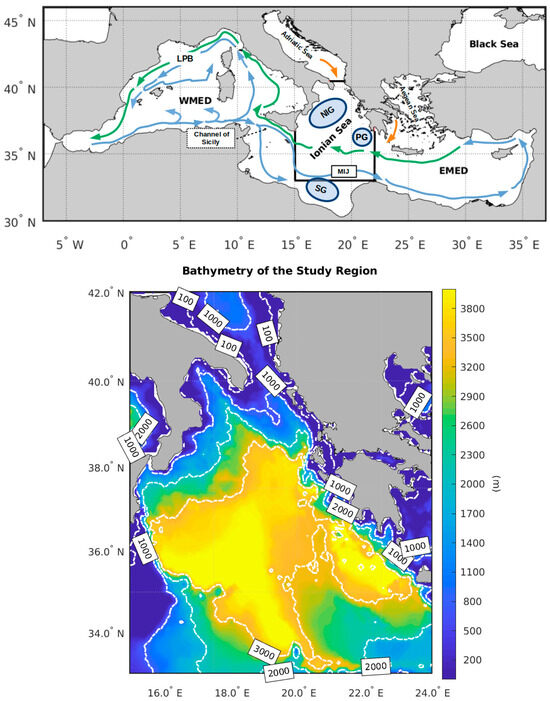
Figure 1.
(Top) geography, quasi-stationary currents, and water masses routes in the Mediterranean Sea. WMED: Western Mediterranean; EMED: Eastern Mediterranean; LPB: Liguro-Provencal basin. Pale blue arrows: surface Atlantic waters (AW); green arrows: Levantine intermediate waters (LIW); orange arrows: Adriatic and Aegean deep waters. Acronyms: MIJ, Mid-Ionian Jet; SG, Sidra Gyre (anti-cyclonic); PG, Pelops Gyre (anti-cyclonic); NIG, Northern Ionian Gyre (both cyclonic and anti-cyclonic, reversals take place over the decadal time scale). The black thick line delimits the study region. (Bottom) bathymetry of the study region. Modified from Eusebi Borzelli et al. [23].
In this study, we used absolute dynamic topography (ADT) data from orbiting altimeters, which have been collected and processed by the Copernicus Marine Environment Monitoring Service (CMEMS). We also utilized temperature–salinity (T-S) objective maps of the Ionian water column, which are derived from all available “in situ” observations in the Mediterranean and distributed by CMEMS. These data were used to investigate long-term changes in the vertical structure of the NI and how they relate to changes in the horizontal near-surface circulation. Our findings reveal significant fluctuations in the vertical structure of the basin over interannual and decadal time scales, resulting in important buoyancy changes throughout the water column and affecting the structure of the first two baroclinic modes. However, during the NIG transition, the only internal mechanism at play is the deformation of the main isopycnal surface, understood as the region of the water column where buoyancy is maximum, suggesting that the NIG transition does not significantly impact the hydrographic properties of the various Ionian water masses, but rather alters their routes and relative volumes within different parts of the basin.
2. Materials and Methods
2.1. Data
To provide a comprehensive reference on the variability of the NIG, we utilized daily ADT data with a spatial resolution of 0.125° × 0.125°. This data is collected globally by orbiting altimeters and distributed by the Copernicus Marine Environment Monitoring Service (CMEMS). For more information, please refer to https://data.marine.copernicus.eu/product/SEALEVEL_GLO_PHY_L4_MY_008_047/description (accessed on 5 June 2025). We extracted ADTs from the CMEMS data archive for the region between 33° N and 42° N, and 15° E and 24° E, during the period 1 January 1993–31 December 2024. These data underwent Empirical Orthogonal Function (EOF) analysis, as discussed in Section 2.4.
To investigate the long-term variability of the vertical structure of the NI, we utilized vertical T-S data from the Copernicus Marine Environment Monitoring Service (CMEMS) as part of the Multi Observation Global Ocean ARMOR3D analysis and multi-year reprocessing project. The data set includes global three-dimensional weekly objective maps of temperature and salinity with a horizontal resolution of 0.25° × 0.25° on 50 depth levels from the surface to the bottom (for more information, please refer to https://data.marine.copernicus.eu/product/MULTIOBS_GLO_PHY_TSUV_3D_MYNRT_015_012/description (accessed on 30 June 2025) for the time period 1 January 1993–11 June 2025). From this data set, we extracted T-S data for the region of 33°–42° N and 15°–24° E for the time period 1 January 1993–31 December 2024. We then used the CSIRO library of MATLAB release 2018a (V9.4) computational routines for seawater properties [24] to calculate seawater density.
In the following, anomalies were computed by taking as a baseline climatology the period January 1993–December 2022.
Note that the spatial resolution of the Multi Observation Global Ocean ARMOR3D and Altimeter ADT data sets used in our research is too coarse to resolve the mesoscale features of the basin. The weekly ARMOR3D and daily altimeter ADT have a spatial resolution of 0.25° × 0.25° and 0.125° × 0.125°, respectively. This corresponds to approximately 20 × 27 km2 and 10 × 14 km2. However, the typical value for the Rossby radius of deformation in the Ionian Sea is 10 km. Therefore, even with the most up-to-date data sets, which are recognized as official standards for describing the variability of the Ionian Sea’s horizontal and vertical structure, it is not possible to analyze mesoscale features in the basin. As a result, our research is limited to analyzing the long-term variability of the horizontal and vertical structure of the basin using these data sets.
2.2. Linear Dynamical Modes
Density profiles deduced from the Multi Observation Global Ocean ARMOR3D T-S profiles were used to perform the linear dynamical modes decomposition.
Following Wunsch and Stammer [25], the horizontal velocity field was expressed as a linear superposition of modes of the form
where pn, sometimes denoted as “p modes”, are solutions of the eigenvalue problem
In Equation (2), N2 = −(g/ρ)∙dρ/dz is the buoyancy frequency, n = 0, 1…, with n = 0 indicating the barotropic mode, and 1/c2n are real-valued, positive eigenvalues, with cn indicating the velocity of the nth baroclinic mode.
Expanding the vertical component as
we get the equation for the vertical modes hn, often denoted as “h-modes”, i.e.,
Solving (2) or (4) is equivalent since p-modes and h-modes are related by the following relationship (see [26], p. 160)
where is the depth-averaged density.
To obtain a series of maps depicting the velocity of the first baroclinic mode, we solved the eigenvalue problem (2) with rigid upper and lower boundary conditions at each date and location within the observation domain. This was achieved by setting N2(x,y,z,t) = −[g/ρ(x,y,z,t)]∙∂ρ(x,y,z,t)/∂z. The resulting maps provide a representation of the spatiotemporal variability of the first baroclinic mode velocity in the Ionian region. In order to determine how changes in stratification across the Ionian basin affect the baroclinic modes, we solved the eigenvalue problem (2) for each date of the observation period, using N2(z,t) = −[g/σ(z,t)]∙∂σ(z,t)/∂z, where σ represents the basin-averaged density.
2.3. Depth of the Main Isopycnal Surface
The depth of the main isopycnal surface was determined using the approach proposed in [27]. To summarize, firstly, the ocean’s vertical structure was assumed to consist of two layers, and the density profiles were fitted with a step function. This involved dividing each profile into two sub-segments of varying length and calculating the average density for each segment. The resulting step function representations were then compared to the original profile, and the one with the lowest root-mean-square was selected as the best step function representation of the water column (see also [28]). This process was repeated for each date of the observation period, providing spatial distributions of density in the surface (ρ1(x,y,t)) and bottom (ρ2(x,y,t)) layers and a “first approximation” data set of the main isopycnal surface depth (H1°(x,y,t)). In the final calculation of the depth of the main isopycnal surface, we excluded all points in which H1°(x,y,t) was less than 60 m (with 60 m supposed to be the maximum depth of the mixed layer) and ρ1(x,y,t) ≥ ρ2(x,y,t). This was done to avoid spurious results due to density changes in the mixed layer and instabilities in the water column. To obtain the final data set of the main isopycnal surface depth (H1(x,y,t)), we used the formula H1 = c12/gꞌ, where gꞌ = (ρ2 − ρ1)/ρ2 using maps of the first baroclinic mode velocity calculated as discussed in Section 2.2 and the reduced gravity computed as discussed above.
2.4. Empirical Orthogonal Function Analysis
The dimensionless EOF analysis [29] of daily ADT, weekly velocity of the first baroclinic mode, and depth of the main pycnocline maps was conducted over the region 33°–42° N, 15°–24° E using the approach discussed in [30]. Using this approach, we have
where S is the field object of the EOF analysis, the symbol <> indicates temporal averaging, Yn and λn are the eigenvectors and dimensional eigenvalues of the data covariance matrix, and αn are the EOFs temporal amplitudes or principal components (PCs), defined as
Note that, according to this representation, EOFs and their PCs are dimensionless.
3. Results
It is known that the NIG variability is described by the second EOF of the ADT [14,21]. In Figure 2, we can see the second EOF (Figure 2a) and the corresponding second principal component (PC) (Figure 2b) of the ADT time series. As supported by previous studies [14,21,23], non-linear fitting of the ADT presented in Figure 2b (red line) reveals that the NIG inversion can be described as a damped oscillation of the ADT with a period of 12.2 years and a damping time of 10.4 years. The observation period can be divided into six distinct sub-periods: January 1993 to May 1998, characterized by predominantly anti-cyclonic circulation; June 1998 to July 2004, characterized by predominantly cyclonic circulation; August 2004 to September 2010, characterized by predominantly anti-cyclonic circulation; October 2010 to March 2017, characterized by predominantly cyclonic circulation; and April 2017 until the end of the observation period, in which the NIG polarity switches rather rapidly between the cyclonic and the anti-cyclonic phase.
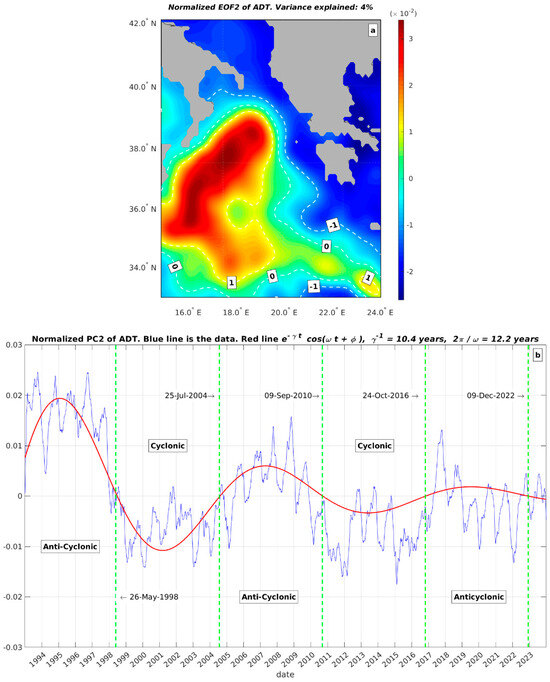
Figure 2.
Empirical orthogonal function analysis of daily ADT data: (a) blue dots represent PC2 (i.e., the coefficient of EOF2); the red line indicates its fit to the function e −(t/τ) cos(2π·t/T + φ); fitted values are T = 12.2 years, τ = 10.4 years. (b) EOF2.
Figure 3a displays the average velocity of the first baroclinic mode over the observation period, while Figure 3b shows the average depth of the main isopycnal surface. The top panel of Figure 1 provides a reference for the NIG and Pelops Gyre (PG). The data in Figure 3a indicates that these two features do not significantly impact the average velocity of the first baroclinic mode, which is primarily characterized by a north–east gradient. The values range from 1.1–1.2 m/s over the AIS and decrease to 0.7–0.8 m/s in the northeastern part of the basin near the border with the Adriatic Sea. While the NIG does not have a significant impact on the depth of the main isopycnal surface (Figure 3b), except for a slight decrease near the NIG center, with values of 270–280 m, the PG causes a significant deepening of the main isopycnal surface, with values reaching 340 m in the center of the gyre. However, there is also a northeastern gradient in the depth of the main isopycnal surface, with higher values over the AIS (370 m) and lower values (310 m) near the border with the Adriatic.
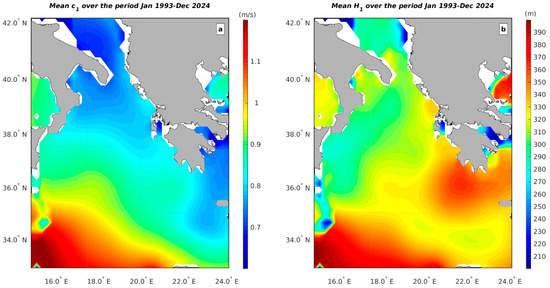
Figure 3.
Average values of the first internal mode velocity (a) and the depth of the main pycnocline (b) computed over the period January 1993–December 2024.
The EOF analysis of the first baroclinic mode velocity and the depth of the main isopycnal surface reveals that the NIG reversals leave their signature on the second EOF mode of the first baroclinic mode velocity and the third mode of the depth of the main isopycnal surface. Figure 4a,b show the EOF2 and PC2 of the first baroclinic mode velocity, respectively, while Figure 4c,d depict the EOF3 and PC3 of the depth of the main isopycnal surface. From Figure 4a,b, it is possible to see that the NIG variability can be associated with a damped oscillation in the velocity of the first baroclinic mode with an e-folding time of 32.1 years and a period of 12.1 years, with higher values during the anti-cyclonic phase and lower values during the cyclonic phase. The variability of the velocity of the first baroclinic mode is primarily related to changes in the depth of the main isopycnal surface, which can be described by a damped oscillation with an e-folding time of 14.2 years and a period of 12.5 years (Figure 4c,d). During the anti-cyclonic phase, the isopycnal surface is deeper, while it is shallower during the cyclonic phase.
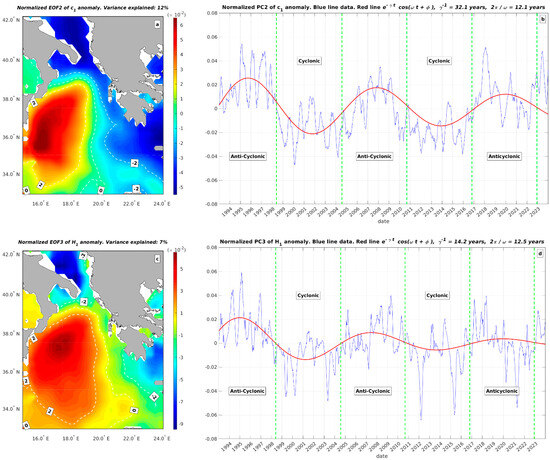
Figure 4.
EOF analysis of the first internal mode and depth of the main pycnocoline anomalies: (a) EOF2 of the first internal mode velocity. (b) PC2 of the first internal mode velocity. (c) EOF3 of the main pycnocline depth anomaly. (d) PC3 of the main isopycnal surface depth anomaly.
Figure 5a shows a time–depth plot of the basin-averaged density anomaly from the surface down to 800 m, while Figure 5b illustrates the time–depth of the buoyancy frequency anomaly derived from the basin-averaged density. The most prominent signal in both figures is the EMT, which caused a significant increase in the density of the water column prior to 2001. This resulted in an increased buoyancy in the region of the water column above 250–300 m. However, the basin-averaged density also shows variations over shorter time scales, which determine sub-annual and interannual changes in buoyancy.
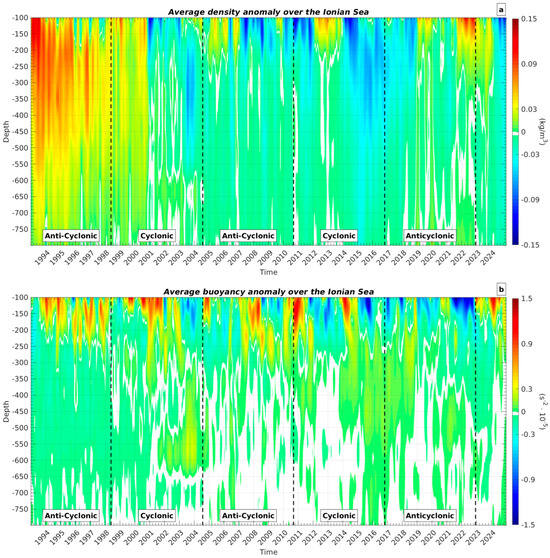
Figure 5.
Time-depth plot of the density anomaly (a) and buoyancy frequency anomaly (b) averaged over the study region.
Previous research by Eusebi Borzelli et al. [23] showed that more than 85% of the overall kinetic energy (i.e., eddy plus mean flow) of the horizontal circulation in the Ionian Sea can be attributed to the first baroclinic mode. Therefore, our discussion on how changes in the vertical structure of the Ionian water column affect the basin’s horizontal circulation will focus on the first baroclinic mode. Figure 6a displays the first horizontal baroclinic mode (the “p-mode”), while Figure 6b depicts the first vertical baroclinic mode (the “h-mode”). Both figures show that there are no significant differences in the vertical structure of the first baroclinic mode in relation to the horizontal circulation regime. However, the EMT does leave its signature on the structure of the first baroclinic mode. During the period when the EMT was active (as shown in Figure 5a), the overall density of the water column was higher than normal, resulting in lower buoyancy values (Figure 5b) and a less stable water column. This led the first baroclinic mode to determine an increased vertical advection (Figure 6b) and decreased horizontal circulation.
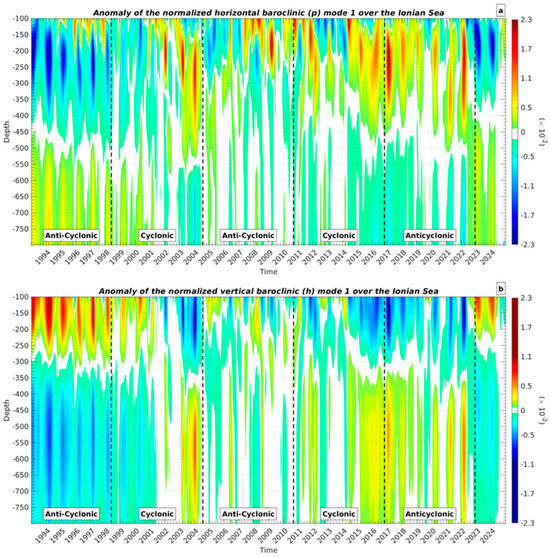
Figure 6.
Time–depth plot of horizontal (p) and vertical (h) baroclinic modes: (a) p-mode 1; (b) h-mode 1.
4. Discussion and Conclusions
In this study, we have examined the variability of horizontal circulation in the NI using ADT data from orbiting altimeters in relation to changes in the stratification regimes of the basin, which were described by all available observations of the Ionian vertical structure and synthetically represented by the ARMOR3D data set. Our findings show that the NIG circulation does not result in significant spatial changes in the temporal mean of the first baroclinic mode and the depth of the main isopycnal surface. This is due to the nearly periodic transitions of the NIG circulation. Interestingly, the temporal average values of the first baroclinic mode velocity and the depth of the main isopycnal surface exhibit a pattern of high values, which can be associated with the AIS. Additionally, a similar pattern of high values in the depth of the main isopycnal surface has been observed in the region occupied by the PG. It is worth noting that in a double-layered fluid system, the potential energy stored in the water column can be expressed as gꞌ∙H12/2 ≈ c12∙H1/2. This observation suggests that both the AIS and the PG act as nearly stationary potential energy reserves for the Ionian basin.
The recurrent switch of polarity in the NI near-surface circulation over time scales of approximately 12 years is also evidenced by an oscillation with the same period of the first baroclinic mode velocity and of the depth of the main isopycnal surface. In agreement with data presented in the available literature, we have shown that the pycnocline depth in the NI oscillates around a mean value of approximately 300 m [23,31,32], slightly below the LIW core [9]. This oscillation, which determines high values in the depth of the main pycnocline during the anti-cyclonic phase and low values during the cyclonic phase, is in phase with the oscillation of the surface layer, and it is in agreement with a double-layer description of the NI dynamics. The oscillation in the depth of the main isopycnal surface is damped with a damping rate of approximately 14 years, slightly higher but still in line with the damping rate of the surface layer oscillation. These results suggest the crucial role played by changes in the depth of the main pycncline in the NIG reversals, which are not accompanied by changes in the basin-averaged structure of the water column. To explain this issue, it can be acknowledged that, following Eusebi Borzelli and Carniel [21], the potential energy stored in the water column of the NI depends on the shape of the isopycnal surfaces. In the NI, isopycnal surfaces are systematically deformed by the action of a nearly stationary cyclonic rotating wind. In this situation, the water column accumulates potential energy, which is unavailable due to the effect of the continuously rotating wind. When the internal fluid pressure exceeds the force of the wind or the wind decreases, the equilibrium is disrupted and the potential energy is released, causing the system to start oscillating. This model, which provided results in line with the observations, is supported by the observations of Napolitano et al. [22], who showed that the NIG inversion from cyclonic to anti-cyclonic that took place in 2004 occurred in a situation where the cyclonic rotating wind decreased.
During the NIG transition, the only internal mechanism at play is the deformation of the main isopycnal surface. However, there are no observable changes in the basin-averaged properties of water masses. This suggests that the NIG transition does not significantly impact the hydrographic properties of the various Ionian water masses, but rather alters their routes and relative volumes within different parts of the basin.
The most significant feature that modifies the hydrographic properties of Ionian water masses and shapes the average vertical structure of the basin is the EMT, which causes an increase in density throughout the water column before 2001. This increase in density leads to an increase in buoyancy in the layer above 250–300 m. However, in addition to the EMT, the basin-averaged density also shows variability over shorter time scales. These variations can be summarized as sporadic, short-lasting (i.e., lasting less than a year) positive or negative density anomalies in the region of the water column above 150 m. For example, in Figure 5a, we can see these anomalies occurring during the periods of 2005–2007, 2012–2013, and 2022. This region of the water column is typically occupied by waters of Atlantic origin, which experience changes in temperature, salinity, and density (see, e.g., [1,22]) due to interactions with other water masses and local atmospheric conditions. Therefore, we attribute these short-lived surface density anomalies to changes in the properties of Atlantic waters flowing into the Ionian from the Strait of Sicily.
One intriguing finding presented in this research is that the depth of the main isopycnal surface exhibits a damped oscillation with a damping rate of 14 years, while the damping rate of the first baroclinic mode velocity is 32 years. This indicates that, throughout the observation period, the oscillation of the first baroclinic mode velocity remains undamped. To properly interpret this result, it is important to take into account potential factors that could contribute to an increase in reduced gravity. These factors may include a long-term rise in surface temperature of the basin and/or a buoyancy flow carried by the AIS. In fact, Napolitano et al. [22] have highlighted the significant impact of the AIS as a source of energy and buoyancy in the NI, which in turn affects its own dynamics. Figure 7 shows an increasing trend of the reduced gravity from 2011 to 2024. This variation could explain the discrepancy between the damping rates of the main isopycnal surface depth and the first baroclinic mode velocity. However, further research is necessary to definitively address this issue and verify the specific sources of buoyancy.
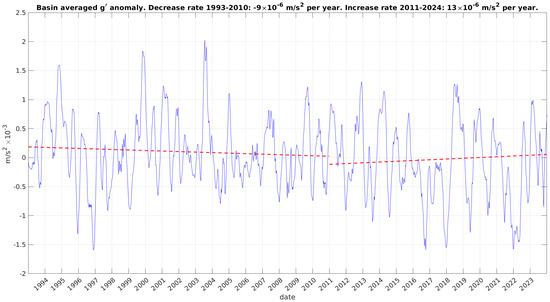
Figure 7.
Basin-averaged reduced gravity anomaly. Red lines represent the linear fits.
In summary, we have shown that NIG inversions can be accurately described by a double-layer ocean system, where the fluctuation in the depth of the main isopycnal surface determines the inversion of the near-surface current. According to the data presented here, changes in the distribution of the different Ionian water masses do not play a significant role in modulating the stability of the Ionian water column. However, further research will be needed to evaluate the role of the AIS, the Adriatic, and the Aegean as “buoyancy distributors” into the Ionian basin.
Author Contributions
Conceptualization, G.L.E.B. and E.N.; methodology, E.N., R.I. and M.V.S.; G.L.E.B.; validation, R.I.; formal analysis, M.V.S.; investigation, G.L.E.B. and E.N.; data curation, G.L.E.B.; writing—original draft preparation, G.L.E.B.; writing—review and editing, E.N., M.V.S. and R.I.; visualization, G.L.E.B.; supervision, G.L.E.B. All authors have read and agreed to the published version of the manuscript.
Funding
This research received no external funding.
Data Availability Statement
Data used in this research can be downloaded by authorized users, adhering to European Union (EU) regulations on geophysical data exchange (see https://eur-lex.europa.eu/homepage.html (accessed on 14 October 2025) at the following website: https://data.marine.copernicus.eu/product/MULTIOBS_GLO_PHY_TSUV_3D_MYNRT_015_012/description (accessed on 30 June 2025), https://data.marine.copernicus.eu/product/SEALEVEL_GLO_PHY_L4_MY_008_047/description (accessed on 30 June 2025).
Acknowledgments
G.L.E.B. wishes to acknowledge Adelina, Carletto, Felix, Maga Rita, and Musetto for the continuous support and provision of the computational facility.
Conflicts of Interest
The authors declare no conflicts of interest.
References
- Malanotte-Rizzoli, P.; Artale, V.; Borzelli-Eusebi, G.L.; Brenner, S.; Crise, A.; Gacic, M.; Kress, N.; Marullo, S.; D’ALcalà, M.R.; Sofianos, S.; et al. Physical forcing and physical/biochemical variability of the Mediterranean Sea: A review of unresolved issues and directions for future research. Ocean Sci. 2014, 10, 281–322. [Google Scholar] [CrossRef]
- Gačić, M.; Borzelli, G.L.E.; Civitarese, G.; Cardin, V.; Yari, S. Can internal processes sustain reversals of the ocean upper circulation? The Ionian Sea example. Geophys. Res. Lett. 2010, 37, L09608. [Google Scholar] [CrossRef]
- Gačić, M.; Civitarese, G.; Borzelli, G.L.E.; Kovačević, V.; Poulain, P.-M.; Theocharis, A.; Menna, M.; Catucci, A.; Zarokanellos, N. On the relationship between the decadal oscillations of the northern Ionian Sea and the salinity distributions in the eastern Mediterranean. J. Geophys. Res. Ocean. 2011, 116, C12002. [Google Scholar] [CrossRef]
- Civitarese, G.; Gačić, M.; Lipizer, M.; Borzelli, G.L.E. On the impact of the Bimodal Oscillating System (BiOS) on the biogeochemistry and biology of the Adriatic and Ionian Seas (Eastern Mediterranean). Biogeosciences 2010, 7, 3987–3997. [Google Scholar] [CrossRef]
- Batistić, M.; Garić, R.; Molinero, J. Interannual variations in Adriatic Sea zooplankton mirror shifts in circulation regimes in the Ionian Sea. Clim. Res. 2014, 61, 231–240. [Google Scholar] [CrossRef]
- Dragicevic, B.; Skoko, S.M.; Dulcic, J. Fish and fisheries of the eastern Adriatic Sea in the light of climate change. In Trends in Fisheries and Aquatic Animal Health; Bentham Science Publishers: Sharjah, United Arab Emirates, 2017; pp. 1–22. [Google Scholar] [CrossRef]
- Novi, L.; Bracco, A.; Falasca, F. Uncovering marine connectivity through sea surface temperature. Sci. Rep. 2021, 11, 1–9. [Google Scholar] [CrossRef] [PubMed]
- Budillon, G.; Bue, N.L.; Siena, G.; Spezie, G. Hydrographic characteristics of water masses and circulation in the Northern Ionian Sea. Deep. Sea Res. Part II Top. Stud. Oceanogr. 2010, 57, 441–457. [Google Scholar] [CrossRef]
- Bensi, M.; Rubino, A.; Cardin, V.; Hainbucher, D.; Mancero-Mosquera, I. Structure and variability of the abyssal water masses in the Ionian Sea in the period 2003–2010. J. Geophys. Res. Ocean. 2013, 118, 931–943. [Google Scholar] [CrossRef]
- Roether, W.; Klein, B.; Manca, B.B.; Theocharis, A.; Kioroglou, S. Transient Eastern Mediterranean deep waters in response to the massive dense-water output of the Aegean Sea in the 1990s. Prog. Oceanogr. 2007, 74, 540–571. [Google Scholar] [CrossRef]
- Incarbona, A.; Martrat, B.; Mortyn, P.G.; Sprovieri, M.; Ziveri, P.; Gogou, A.; Jordà, G.; Xoplaki, E.; Luterbacher, J.; Langone, L.; et al. Mediterranean circulation perturbations over the last five centuries: Relevance to past Eastern Mediterranean Transient-type events. Sci. Rep. 2016, 6, 29623. [Google Scholar] [CrossRef]
- Larnicol, G.; Ayoub, N.; Le Traon, P. Major changes in Mediterranean Sea level variability from 7 years of TOPEX/Poseidon and ERS-1/2 data. J. Mar. Syst. 2002, 33–34, 63–89. [Google Scholar] [CrossRef]
- Borzelli, G.L.E.; Gačić, M.; Cardin, V.; Civitarese, G. Eastern Mediterranean Transient and reversal of the Ionian Sea circulation. Geophys. Res. Lett. 2009, 36, L15108. [Google Scholar] [CrossRef]
- Civitarese, G.; Gačić, M.; Batistić, M.; Bensi, M.; Cardin, V.; Dulčić, J.; Garić, R.; Menna, M. The BiOS mechanism: History, theory, implications. Prog. Oceanogr. 2023, 216, 103056. [Google Scholar] [CrossRef]
- Molcard, A.; Pinardi, N.; Iskandarani, M.; Haidvogel, D. Wind driven general circulation of the Mediterranean Sea simulated with a Spectral Element Ocean Model. Dyn. Atmos. Ocean. 2002, 35, 97–130. [Google Scholar] [CrossRef]
- Grbec, B.; Morovic, M.; Zore-Armanda, M. Mediterranean Oscillation and its relationship to salinity fluctuation in the Adriatic Sea. Acta Adriat. 2003, 44, 61–76. [Google Scholar]
- Pinardi, N.; Zavatarelli, M.; Adani, M.; Coppini, G.; Fratianni, C.; Oddo, P.; Simoncelli, S.; Tonani, M.; Lyubartsev, V.; Dobricic, S.; et al. Mediterranean Sea large-scale low-frequency ocean variability and water mass formation rates from 1987 to 2007: A retrospective analysis. Prog. Oceanogr. 2015, 132, 318–332. [Google Scholar] [CrossRef]
- Rubino, A.; Gačić, M.; Bensi, M.; Kovačević, V.; Malačič, V.; Menna, M.; Negretti, M.E.; Sommeria, J.; Zanchettin, D.; Barreto, R.V.; et al. Experimental evidence of long-term oceanic circulation reversals without wind influence in the North Ionian Sea. Sci. Rep. 2020, 10, 1905. [Google Scholar] [CrossRef] [PubMed]
- Gačić, M.; Ursella, L.; Kovačević, V.; Menna, M.; Malačič, V.; Bensi, M.; Negretti, M.-E.; Cardin, V.; Orlić, M.; Sommeria, J.; et al. Impact of dense-water flow over a sloping bottom on open-sea circulation: Laboratory experiments and an Ionian Sea (Mediterranean) example. Ocean Sci. 2021, 17, 975–996. [Google Scholar] [CrossRef]
- Crisciani, F.; Mosetti, R. Is the bimodal oscillating Adriatic-Ionian circulation a stochastic resonance? Bollett. Geofis. Teor. Appl. 2016, 57, 275–285. [Google Scholar]
- Borzelli, G.L.E.; Carniel, S. A reconciling vision of the Adriatic-Ionian Bimodal Oscillating System. Sci. Rep. 2023, 13, 1–9. [Google Scholar] [CrossRef]
- Napolitano, E.; Carillo, A.; Struglia, M.; Iacono, R.; Palma, M.; Borzelli, G.E.; Sannino, G. The role of the Atlantic-Ionian stream in the long-term variability of the surface circulation in the Northern Ionian Sea: Results from a hindcast simulation. Prog. Oceanogr. 2025, 234, 103472. [Google Scholar] [CrossRef]
- Borzelli, G.L.E.; Napolitano, E.; Carillo, A.; Struglia, M.V.; Palma, M.; Iacono, R. Hydrographic vs. Dynamic Description of a Basin: The Example of Baroclinic Motion in the Ionian Sea. Oceans 2024, 5, 383–397. [Google Scholar] [CrossRef]
- Morgan, P.P. SEWATER: A Library of MATLAB Computational Routines for the Properties of Sea Water: Version 1.2. Report No.: 222. 1994. Available online: http://hdl.handle.net/102.100.100/239771?index=1 (accessed on 1 April 2022).
- Wunsch, C.; Stammer, D. Atmospheric loading and the oceanic “inverted barometer” effect. Rev. Geophys. 1997, 35, 79–107. [Google Scholar] [CrossRef]
- Gill, A. Atmosphere-Ocean Dynamics; Academic Press: Cambridge, MA, USA, 1982; Volume 30, p. 662. [Google Scholar]
- Borzelli, G.L.E.; Sullivan, A. Kelvin Wave Propagation over a Sloping Interface and Relationships with El Niño Southern Oscillation. J. Atmos. Sci. Res. 2024, 7, 1–18. [Google Scholar] [CrossRef]
- Borzelli, G.L.E.; Carniel, S. Where the winds clash: What is really triggering El Niño initiation? npj Clim. Atmos. Sci. 2023, 6, 119. [Google Scholar] [CrossRef]
- Preisendorfer, R.W. Principal Component Analysis in Meteorology and Oceanography; Elsevier: Amsterdam, The Netherlands, 1988; 425p. [Google Scholar]
- Borzelli, G.L.E.; Carniel, S.; Carniel, C.E.; Russo, A. The Atlantic Niño Mode: A Thermodynamic or a Dynamic Phenomenon? J. Geophys. Res. Ocean. 2024, 129, e2024JC021067. [Google Scholar] [CrossRef]
- Klein, B.; Roether, W.; Manca, B.B.; Bregant, D.; Beitzel, V.; Kovacevic, V.; Luchetta, A. The large deep water transient in the Eastern Mediterranean. Deep. Sea Res. Part I: Oceanogr. Res. Pap. 1999, 46, 371–414. [Google Scholar] [CrossRef]
- Ioannone, A.; Catucci, A.; Grasso, M.; Borzelli, G.L.E. Decadal variability and scales of the sea surface structure in the northern Ionian. Cont. Shelf Res. 2011, 31, 37–46. [Google Scholar] [CrossRef]
Disclaimer/Publisher’s Note: The statements, opinions and data contained in all publications are solely those of the individual author(s) and contributor(s) and not of MDPI and/or the editor(s). MDPI and/or the editor(s) disclaim responsibility for any injury to people or property resulting from any ideas, methods, instructions or products referred to in the content. |
© 2025 by the authors. Licensee MDPI, Basel, Switzerland. This article is an open access article distributed under the terms and conditions of the Creative Commons Attribution (CC BY) license (https://creativecommons.org/licenses/by/4.0/).