Article

Seasonal Macroplastic Distribution and Composition: Insights from Safety Nets for Coastal Management in Recreational Waters of Zhanjiang Bay, China

1
College of Chemistry and Environmental Science, Guangdong Ocean University, Zhanjiang 524088, China
2
Analytical and Testing Centre, Guangdong Ocean University, Zhanjiang 524088, China
*
Author to whom correspondence should be addressed.
Oceans 2025, 6(4), 64; https://doi.org/10.3390/oceans6040064
Submission received: 5 July 2025 / Revised: 1 September 2025 / Accepted: 30 September 2025 / Published: 9 October 2025

Abstract

Macroplastic pollution is a growing environmental concern, threatening the marine environment. Despite growing awareness of marine plastic pollution, few studies have assessed the effectiveness of in situ technologies such as safety nets for macroplastic interception. This study aims to evaluate the effectiveness of safety net (SN) systems in intercepting macroplastic debris in the different zones of recreational Yugang Park Beach (YPB), Zhanjiang Bay, China. Safety nets were installed at stations representing different hydrodynamic conditions, and macroplastic debris (2.5–80 cm) was collected and analyzed for size, color, and shape characteristics. Two survey comparisons revealed a higher debris density in the winter survey (1.8 ± 0.3 items m2) than in the summer survey (1.5 ± 0.3 items m2). Most debris fell within the 10–40 cm range, with transparent low-density polyethylene plastic bags being the dominant type, particularly in the winter survey (80.7%). Statistical analysis indicated that plastic size was likely related to net retention characteristics, while tidal influences accounted for a major portion of spatial variability in debris accumulation. These findings suggest that SN systems are effective tools for macroplastic interception and could inform evidence-based coastal management strategies to reduce plastic pollution in similar coastal environments.

1. Introduction

Plastic litter is receiving increasing attention worldwide. Plastics have been used extensively in people’s lives in recent decades. In 2014, global plastic production was estimated at more than 300 million tons, and this is expected to triple by 2050 [1]. However, plastic waste is ubiquitous, with nearly 79% discarded into landfills or natural environments and only 9% recycled [2]. Plastics are often reported as a significant component of marine debris/marine litter [3]. According to studies, it is estimated that more than 5 trillion pieces of plastic litter are floating in the global ocean [4]. The current state of plastic pollution in the global marine ecosystem has become an issue of concern [5].
Macroplastic (>5 mm) represents a grave and escalating threat to marine ecosystems and human well-being [6]. These larger items cause immediate and significant harm through entanglement of wildlife, ingestion leading to internal injuries, gut blockage, and starvation in marine animals and birds, disruption of habitats, and posing direct hazards to navigation, fishing, and tourism [7]. It is important to note that macroplastic is often a source of secondary microplastic pollution (<5 mm) [8]. Once in the ocean, plastics are broken down into smaller particles by physical abrasion, photochemical weathering, and biological processes over a long period [9]. Compared to macroplastics, microplastics can be more easily absorbed into organisms’ tissues and may introduce a new suite of biological effects [10]. This process potentially results in the leaching of harmful additives, the accumulation of toxins, and the infiltration of food webs, the consequences of which are still being fully elucidated [11]. A substantial body of current research highlights that the immediate socio-economic costs, including cleanup, damage to vessels, loss of fisheries/aquaculture, and tourism impacts, are demonstrably more pronounced and quantifiable for macroplastics [12]. Moreover, plastic pollution directly induces physical health risks to larger organisms, including humans, via vectors such as contaminated seafood. This emphasises the critical importance of addressing the primary source [13].
Beaches, acting as transitional zones between land and sea, have been significantly impacted by human activities [14]. These activities have resulted in the transportation of land-based macroplastic waste into marine environments. The spatial distribution of plastic debris on beaches is influenced by multiple factors, including air and ocean currents, surface runoff, human activities, and sand properties [15,16]. Furthermore, research confirms that the presence and density of plastic debris in recreational bays are significantly influenced by hydrodynamic conditions, seasonal storms, and proximity to urban areas [17]. However, prevention of marine debris is challenging due to its non-point source nature, the almost endless number of entry points, and the diversity of materials [18]. Although microplastics have received significant attention in ecological assessments, macroplastics also play an important role due to their visibility, size, and impact on larger marine organisms and coastal aesthetics [19]. Regular cleanup of large plastic waste can play a critical role in preventing the accumulation of plastic debris in the environment and reducing the risk of its fragmentation into smaller particles [20].
Addressing plastic pollution requires a comprehensive approach across the entire plastic life cycle, including upstream policies to reduce plastic production, promote reusable alternatives, and improve waste management and recycling systems. Among these interventions, interception efforts, particularly in river systems and coastal areas, play a critical role in intercepting plastics before they reach the ocean and in mitigating ecological and economic impacts [21,22,23]. Nets are regarded as the most common tool for plastics interception and collection. Safety nets (SNs) are origionally to prevent swimming drowning and the invasion of large marine animals at the beach. In addition, it also play key role in interception floating debris in aquatic environments before it disperses into open waters. These nets are typically composed of mesh materials stretched across targeted areas such as river mouths, coastal inlets, or recreational beaches [3]. Their application in freshwater systems, especially rivers, has shown promising results in intercepting macroplastics. Recent research has evaluated the effectiveness of capture devices in riverine systems such as floating booms and community-operated traps, but their performance under dynamic tidal conditions and wave action in coastal settings remains poorly understood [21]. Studies have shown that the net system can reduce plastic pollution in river waters, but further research is needed to assess its effectiveness under complex hydrodynamic conditions on open beaches. Factors such as net positioning relative to tidal flow, seasonal changes, and potential clogging by organic debris can all influence safety nets’ (SNs) performance among low-, medium-, and high-tide zones [22]. Furthermore, there is a knowledge gap in how such technologies can be optimized to support broader coastal management strategies, particularly in high-tourism, high-pollution areas. Therefore, the effectiveness of safety nets in capturing macroplastics in the recreational coastal waters of Zhanjiang Bay is examined and recommendations for more sustainable environmental management policies are provided.
This study investigates the effectiveness of safety nets as a macroplastic interception intervention in a highly urbanized, tourism-intensive coastal environment [23,24,25]. Specifically, we conducted two survey samplings and analysis of macroplastic debris retained in safety nets installed across multiple tidal zones, with the aim of (1) identifying spatial distribution patterns, (2) characterizing the size, shape, and composition of macroplastic items, and (3) estimating the total quantity of retained macroplastics. Through this case study, we aim to generate broader insights into how safety nets perform under varying hydrodynamic conditions and in areas with substantial human activity and land-based plastic pollution. The findings are expected to inform the development of effective, site-adaptable mitigation strategies for macroplastic pollution in other similar coastal ecosystems.

2. Materials and Methods

2.1. Study Area and Sampling Stations

Yugang Park Beach (YPB) is located on the western part of Zhanjiang Bay (ZJB) and covers an area of about 200,000 m2. YPB was officially opened to the public in 2007 following the completion of its construction and has since become a leisure spot for nearby residents and a tourist destination. However, the increase in the number of tourists and land-based plastic waste discharge have led to the retention of a lot of plastic waste on the beach. And because plastic materials are light and float easily [26], they tend to leave plastic litter in the ocean on the beach through tides, passing boats, or other natural influences. YPB experiences semi-diurnal tides and is significantly affected by monsoons. Therefore, this study was conducted on 7 January 2021 (winter survey) and 7 July 2021 (summer survey) from 8 locations in SN of the YPB (Figure 1).
Determination of the stations is carried out based on the purposive sampling method. The purposive sampling method is a non-random sampling method for determining sampling by identifying special characteristics that are relevant to the research objectives, so that it is expected to answer the research problems [27]. Sampling was carried out in 3 water zones, namely supra-tidal, inter-tidal, and sub-tidal. The point of placement of the macroplastic sampling station during supra-tidal conditions is close to the beach gazebo and close to traders selling around the beach. In addition, in sub-tidal conditions, it is taken at the lowest ebb, while inter-tidal conditions are in the middle between supra-tidal and sub-tidal, which are parallel to the coastline. In this study, two sampling points were taken in the high-tide area (S1, S8) and the middle-tide area (S2, S7) of YPB Sea and Sky Bathing Beach for the interception of plastic waste by “SN”. And since the longest side of “SN” is in the low-tide area, four sampling sites are selected in the low-tide area (S3, S4, S5, and S6). The two adjacent sites were separated by 20 m. A total of 8 sampling sites were arranged. For clarity, in this study, S1 and S8 were categorized as supra-tidal sites, S2 and S7 as inter-tidal sites, and S3–S6 as sub-tidal sites. This classification ensured that all tidal levels were represented for subsequent comparison of litter density. Sampling was carried out using the shoreline survey methodology, which is an observation method carried out directly on the coast during low tide [28].

2.2. Sample Collection

The materials used in this study are macroplastics as the main material or object of research and clean water to clean the obtained samples. The area of each site was a square quadrangle of 2 × 2 m. Field sampling was performed at low tide, which was in real time. The ground at the site was observed with the naked eye, and the observed plastic items were collected. The plastic items were stored in a clean, sealed plastic bag, and the collection site, time, site number, and latitude and longitude were marked on the bag with an oil-based pen and brought back to the laboratory for subsequent analysis.

2.3. Laboratory Analysis

The samples were taken back to the laboratory for identification, and then the plastic items were rinsed with water to remove sand and marine organisms attached to the surface. After cleaning, they were placed on a clean iron plate and wrapped in a large Ziploc bag without sealing the bag. They were dried outdoors for 10 h to remove excess water. The samples were removed one by one from the sealed bag, restored to their original shape, and weighed on a balance with a sensitivity of 0.01 g, and the mass of each sample was recorded [21]. The plastic samples were then photographed to record their dimensions, and all plastic samples were visually inspected, and their plastic type was determined [27]. An item with an identifiable packaging and plastic code was listed to determine its chemical nature [28]. In addition, the maximum diameter length of plastic samples was measured according to the longest diameter measurement method, and the number, size, shape, color, and type of samples were recorded for each location. Plastic samples are expressed as items·km−2 and kg·km−2 per site and total.
Macroplastic items were visually classified into five categories: plastic bags, foam, film, debris, and other. Plastic bags were identified as thin, flexible items used for carrying goods, typically with handles or seams. Foam items were recognized by their lightweight, spongy structure, commonly from disposable containers or insulation materials. Films included soft, stretchable plastic sheets such as food wrap or thin packaging. Debris was defined as irregular plastic fragments without a clear original form. The “other” category included shaped plastic items such as toys, caps, or packaging trays that did not fit into the main categories.
Furthermore, representative macroplastic samples from each category (plastic bag, foam, film, debris, and other) were analyzed using a Fourier Transform Infrared (FTIR) spectrometer in attenuated total reflectance (ATR) mode. Before analysis, samples were cleaned and air-dried. Spectral data were recorded in the range (2) of 4000–500 cm−1 with a resolution of 4 cm−1 and 32 scans per sample. The obtained spectra were compared against the reference library provided by the instrument software. A similarity match threshold of 60–70% was considered acceptable, with priority given to the best-matching material. In cases where degradation, additives, or environmental exposure may have altered the spectrum, matches above 60% were considered valid but interpreted cautiously. This decision is supported by previous studies that suggest flexible thresholds in field-based plastic identification due to spectral interference from aging or additives.

2.4. Quantification of Macroplastic Debris

Macroplastic debris data were expressed in terms of abundance (items·m−2) and mass (g·m−2). Differences in debris accumulation across stations were used to infer the relative effectiveness of the nets under varying environmental pressures and tidal influences. In addition to site-level comparisons, the average litter density (items·m−2) was calculated for each tidal zone by pooling data from sites within that zone (supra-tidal: S1, S8; inter-tidal: S2, S7; sub-tidal: S3–S6). This allowed standardized comparisons across zones. The total area of the SN was expressed as follows:
S = i = 1 8 S i
where S is the cumulative area of SN (m2) and S i is the separate area (m2) of each section.
Therefore, the total amount of macroplastic debris on the SN for each survey can be estimated using the following Equation (2):
N = i = 1 8 S i × n i
where S i is a separate small area on the SN, the center of the sampling station (m2), n i is the number of plastic debris per sampling site (items m−2), and N is the total number of large plastic debris on the SN (items).

2.5. Statistical Analysis

T-tests were used to compare the two surveys’ differences in macroplastic abundance and mass, while one-way ANOVA tested differences across tidal zones. All statistical analyses were performed using SPSS version 27.0. The site map was created using Google Earth Pro. Moreover, Origin 2021 (Version 21.0.0.123) software was employed to plot the spatial distribution, composition, and FTIR spectra of the macroplastics. A one-way analysis of variance (ANOVA) was used to test for significant differences in debris abundance and mass among tidal zones and between two surveys. Pearson correlation analysis was conducted to examine the differences between the two surveys. All results were considered statistically significant at p < 0.05 and highly significant at p < 0.01.

3. Results

3.1. Spatiotemporal Pattern of Macroplastic Debris on the SN of the YPB

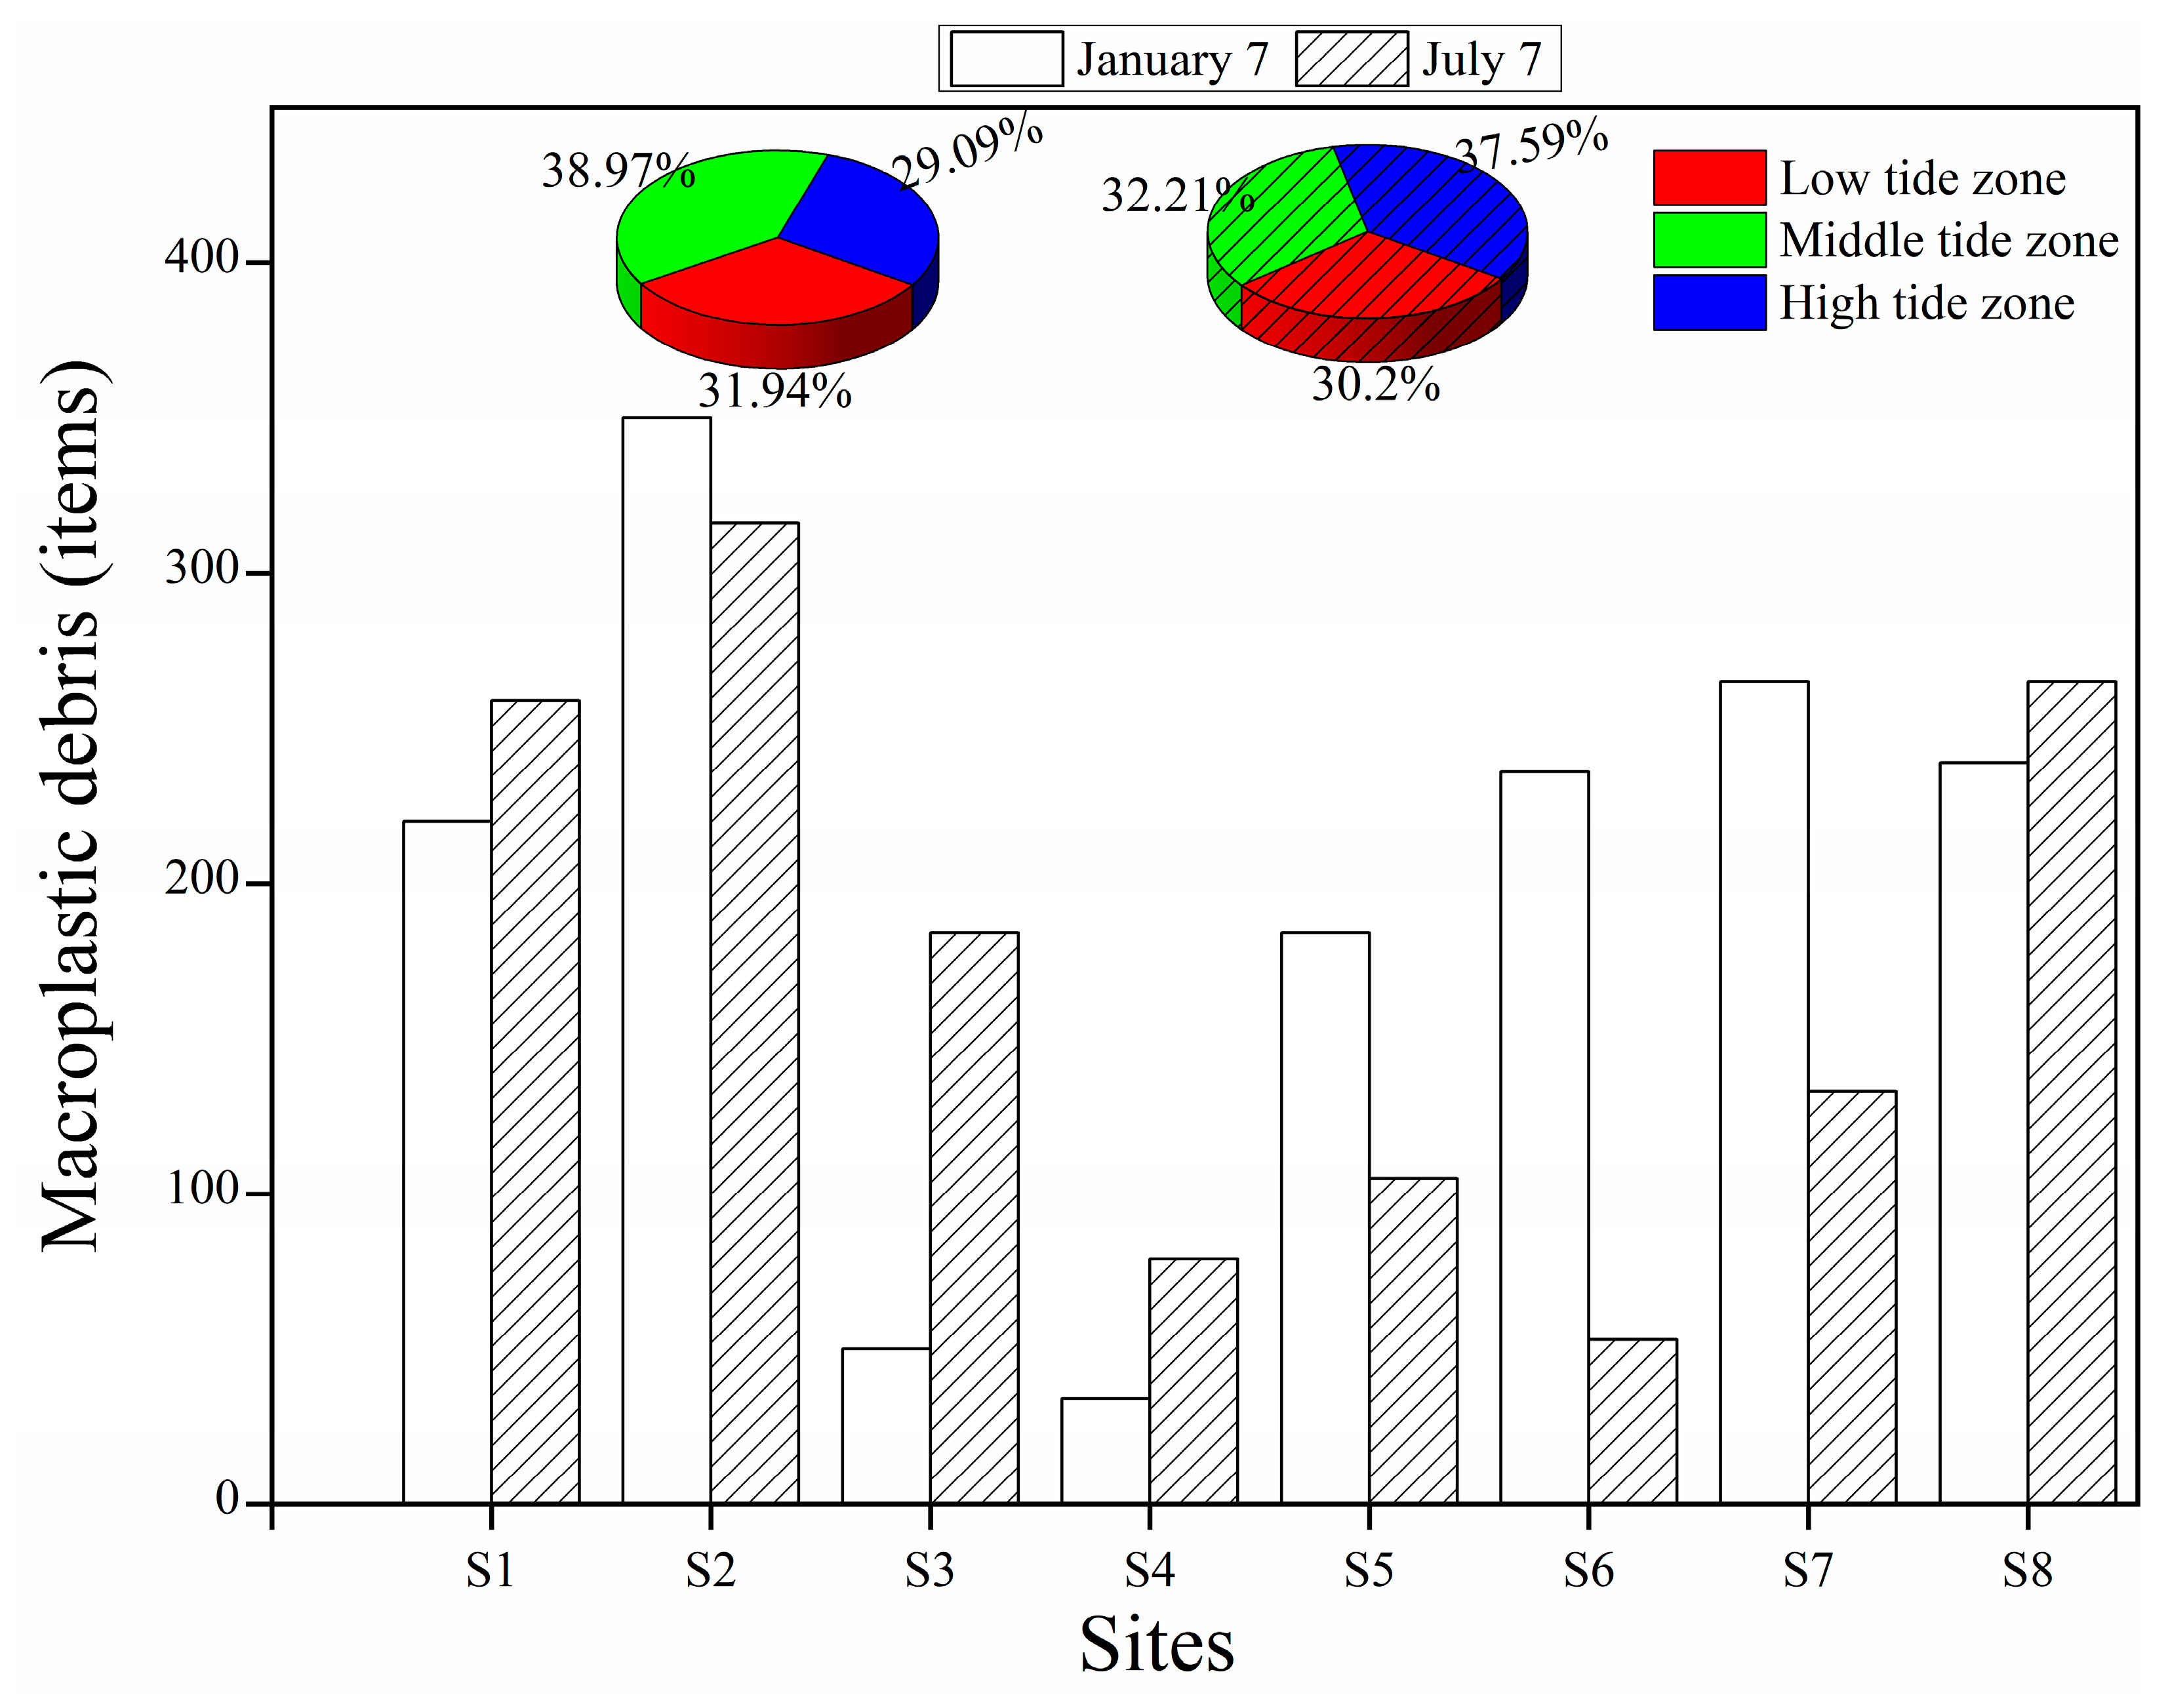
The results showed the spatial and temporal distribution of large plastic debris on the SN of YPB (Figure 2). The mean abundance of large plastic debris was a higher in winter survey (1.8 ± 0.3 items·m−2) than in summer survey (1.5 ± 0.3 items·m−2). However, the area density of large plastic debris in summer survey (14.2 ± 4.6 g·m−2) was close to that in winter survey (14.2 ± 7.2 g·m−2). The abundance of macroplastic debris was highest in the mid-tide zone (S2) during both winter survey (3 items m−2) and summer survey (2.7 items·m−2, mid-tidal region), but its area density was not the highest in winter survey (12.7 g·m−2) and summer survey (23.1 g·m−2). S4 in winter survey (0.3 items·m−2, low tide zone) had the lowest numerical abundance and the lowest area density (1 g·m−2) among the winter survey sampling sites; S6 in summer survey (0.5 items·m−2, low tide zone) had the lowest numerical abundance and the highest area density (33 g·m−2) among the summer survey sampling sites. The maximum area density in winter survey occurred in the mid-tide zone S7 (60.1 g·m−2, mid-tidal area); the minimum area density in summer survey occurred in S5 (0.3 g·m−2).

3.2. Spatiotemporal Size, Colour, and Shape Composition of Macroplastic Debris on the SN of the YPB

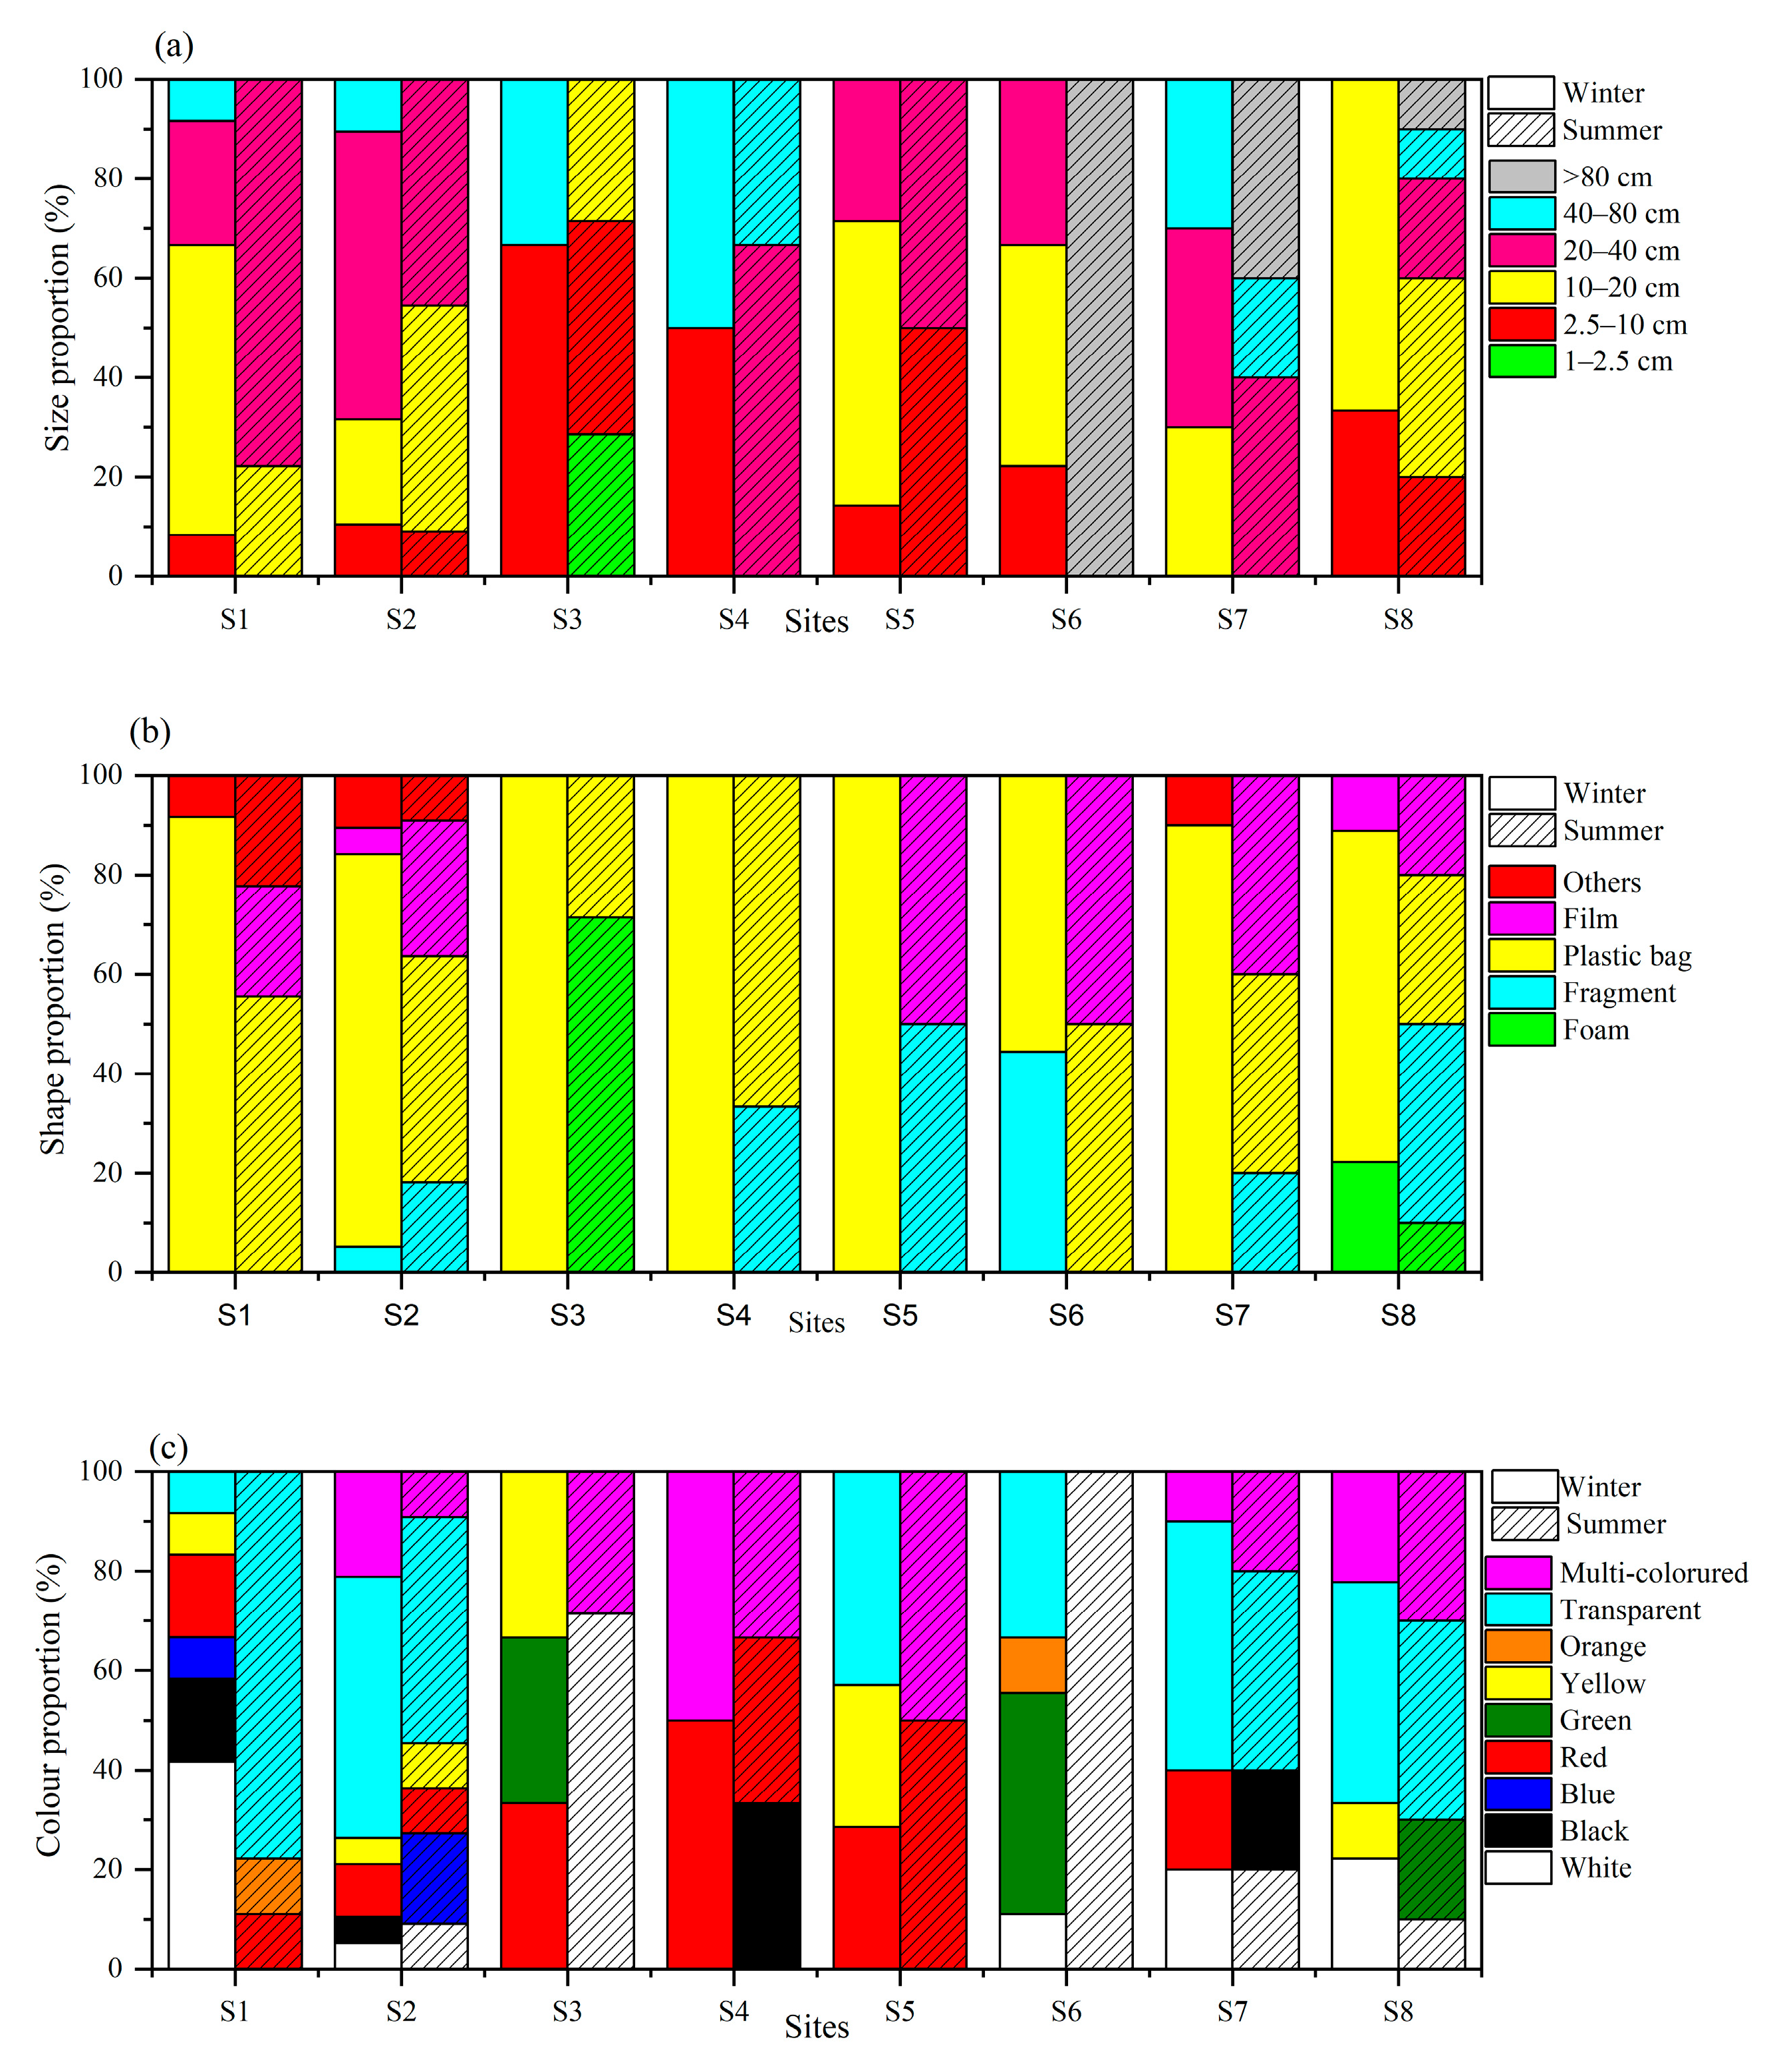
Macroplastic debris was classified into six categories, which were based on the size of the collected samples: 1–2.5 cm, 2.5–10 cm, 10–20 cm, 20–40 cm, 20–80 cm, and >80 cm (Figure 3a). The size of the samples was mainly concentrated in 10–20 cm (winter survey: 41.5% in total; summer survey: 25.4% in total) and 20–40 cm (winter survey: 30.9% in total; summer survey: 39.2% in total). As previously mentioned, no plastics with sizes 1–2.5 were found at any of the winter survey and summer survey sites, except for S3 in the summer survey. At the sites with low abundance (S3 and S4 in the winter survey and S4 and S6 in the summer survey), the size composition was lower. In particular, at S3 in the winter survey, a discontinuous distribution of sizes between 2.5 and 10 cm and 40 and 80 cm occurs. The site locations in the other seasons show a general pattern: the dimensional intervals in each category are connected without a fault distribution.
Plastic items were classified into five categories based on shape, adapted from the NOAA protocol: fragments, foam, film, lines, and bags. Although plastic bags are technically film-based, they were separated due to their unique structure and high frequency in coastal debris streams (Figure 3b). The winter survey and summer survey samples were dominated by plastic bags. Plastic bags (80.7%) dominated the winter survey samples; in particular, S2 and S7 both accounted for 20% of the total abundance. However, the percentage of plastic bags in the summer survey samples (39.2%) decreased by 48.6% compared to the winter survey season. Foam (11.7% of the total), debris (19.6% of the total), and film (23.5% of the total) were much higher in the summer survey samples than in the winter survey ones. The presence of thin film samples could be found in S1, S2, S5, S6, S7, and S8 in the summer survey, while in the winter survey, only S2 was present. The presence of fragment samples can be found in S2, S4, S5, S7, and S8 in the summer survey, while in the winter survey, it is only found in S2 and S6. In the winter survey, “other” includes “a lighter and a plastic toy”, while in the summer survey, “other” includes “plastic boxes”. The term ‘debris’ in this study refers only to macroplastic items (2.5–80 cm in size). Non-plastic debris was not included in the analysis.
Based on the results of the study, a total of nine colors of plastic debris were identified (Figure 3c). Transparent plastic dominated in the winter survey (37.9% of the total) and summer survey (35.2% of the total) samples. This was followed by the white plastic in winter survey and summer survey, with 15.2% and 19.6% of the total. However, it was also found that the proportion of multicolored plastics in the summer survey was the same as the proportion of white plastics. In this study, multicolor, transparent, and white were widely distributed. In contrast, blue and orange were the least observed in the winter survey, accounting for 2.8% of the winter survey samples, and yellow and orange were the least observed in the summer survey, accounting for 3.9% of the summer survey samples. This also reflects that the main colors of plastic waste in YPB coastal waters are multicolored, transparent, and white.

3.3. Analysis of Typical Macroplastic Samples by Fourier Transform Infrared Spectrometer

To better understand the main chemical composition of the samples, FTIR spectra were used in the study and investigation of eight representative samples (n = 80) utilized FTIR spectra. The findings indicated that polyethylene (PE) was the most prevalent polymer type (43%), followed by polypropylene (PP, 37%) and polystyrene (PS, 11%) (foam: A; other: B; film: C; fragments: D; plastic bags: E, F, G, H) (Figure 4). Sample A was a white disposable foam lunch box with an IR spectrum that matched 67.9% with polystyrene in the database. Sample B is a transparent disposable take-out box with a 39.8% match to Berkeley polypropylene. Sample C is a transparent film with a 62.6% match to 2-decyl-tetradecane. Sample D is a white plastic strip with a 47.0% match to Berkeley polypropylene. Because plastic bags made up the highest percentage of all samples, there were four different colors of plastic bags in the test sample. Sample E is a red plastic bag with a 42.0% match to polystyrene. Sample F is a red plastic bag with a 66.4% match to the color masterbatch polyethylene. Sample G is a blue plastic bag with a match of 32.2% with LDPE. Sample H is a multi-colored food packaging bag, with a match of 41.6% with olefin fibers. However, the matches of the substance standard spectra corresponding to the sample detection spectra were not high because of the high integrity of the samples and the additives in the plastics that affected the maximum absorption of the main components in the IR spectra. Therefore, the material with the best match obtained in the study was used as the main chemical component of the sample. Also, in the results of the study, the main chemical composition of the four plastic bags of the same category was different. Samples A and E have the same main chemical composition, while samples G and F have similar main chemical compositions, both of which are polymerized through ethylene bonds and are softer and tougher to the touch. Samples B and D have the same main chemical composition and are tougher to the touch.

3.4. Quantifying the Total Amount of Macroplastic Debris on the SN of the YPB

The total number of macroplastic debris items present on the SN of the YPB was quantified for each survey by multiplying the amount of plastic found in each unit of area by that area and then adding up the results according to Equation (2). It was estimated that 1578 and 1394 macroplastic debris were present in the winter survey and summer survey, respectively (Figure 3). The total amount of macroplastic debris did not differ significantly between tidal zones (p > 0.05). Mean litter densities were 1.62 ± 0.4 items·m−2 (supra-tidal), 1.74 ± 0.3 items·m−2 (inter-tidal), and 1.53 ± 0.2 items·m−2 (sub-tidal). Although averages suggested slightly higher accumulation in the intertidal zone, these differences were not statistically significant. This can be verified from the figure (M: S2, S7; H: S1, S8) (Figure 5). Large plastic debris is significantly higher in the high-tide zone in the summer survey than in the winter survey. However, the opposite is true for the mid-tide zone. Furthermore, in the low-tide zone, large plastic debris was higher in S3 and S4 in the summer survey than in the winter survey, but lower in S5 and S6 than in the winter survey.
These findings suggest that the spatial distribution of macroplastics in YPB is not random but is largely controlled by tidal dynamics, hydrodynamic energy, and seasonal factors. Higher concentrations in the mid-tide zone during the winter survey may be linked to stronger tidal currents and limited offshore transport, whereas the accumulation in the high-tide zone during the summer survey could be attributed to increased tourist activity and prevailing monsoon winds pushing floating debris landward. Together, these processes highlight the combined influence of natural and anthropogenic factors on the shifting accumulation of plastics across tidal zones.

4. Discussion

4.1. Macroplastic Debris Pollution Levels on the SN of the YPB

In this study, we primarily focus on assessing macroplastic retention in a single location (YPB) using standardized safety nets (SNs). Any comparisons with other studies refer to different geographic locations that may differ in environmental and methodological conditions (see Table 1). Therefore, such comparisons are only used to provide general context, not direct performance benchmarking. The relatively lower abundance of macroplastic debris at YPB compared to locations such as northern Lake Victoria may be attributed to multiple factors, including the presence of safety net interception systems, less intense fishing or boating activity, and lower inland waste input. YPB is also located in a semi-enclosed bay with weaker hydrodynamic exchange, which may limit large-scale accumulation from offshore sources [22,29], according to the “Bulletin on the State of China’s Marine Ecology and Environment in 2020” published by the Ministry of Ecology and Environment of the People’s Republic of China. The abundance of beach litter in China (0.22 pieces·m−2) is 7.23–8.23 times higher than the abundance of plastic litter intercepted by the YPB’s SN. The area density of beach litter in China (1.24 g·m−2) is 11.46 times higher than that of YPB’s SN [28]. Local anthropogenic impacts and changes in the marine environment, coupled with additional inland meteorological processes (wind and rain), have the potential to directly influence shoreline litter accumulation in these urban systems [22,30]. Plastic debris on the SN had higher quantitative abundance and mass-based measurements (g·m−2) in the winter survey and summer survey compared to the beaches of the Paraná River in Argentina and Iskenderun Bay, Turkey [30,31]. The abundance of YPB was also much higher in the summer survey compared to the Veleka estuary on the Bulgarian Black Sea coast [30]. Compared to the 2-Varna strait on the Bulgarian Black Sea coast [31], its abundance is only one-half of that. YPB’s SN has a strong capacity to intercept plastic litter and clean up the ocean. At the same time, it also shows that there is still much room for improvement in environmental protection in the area, and people’s awareness of ecological protection needs to be improved [32].

4.2. Spatiotemporal Patterns of Macroplastic Distribution

As demonstrated in Section 3.1, field observations suggested slightly higher macroplastic counts in the mid-tide zone; however, statistical tests indicated no significant differences among tidal zones (p > 0.05). This phenomenon is most likely the result of the interplay of tidal and sedimentary processes. The mid-tide zone is submerged and exposed by seawater for equal periods each day, with hydrodynamic energy intermediate between that of the high-tide and low-tide zones. The mid-tide zone is particularly vulnerable to sedimentation, as the flow of tidal currents, carrying microplastics, slows down upon reaching this area, thereby reducing its transport capacity. A significant quantity of suspended microplastics accumulate in this area, where the water’s energy begins to diminish. In the event of a tide receding, the current may not possess sufficient strength to carry all of them back to the sea. This phenomenon may indicate that the mid-tide zone could function as a temporary trap for debris, although further data are required to confirm this pattern. Conversely, the low-tide zone has been found to have the highest kinetic energy and is the least conducive to sedimentation, resulting in the lower macroplastic concentrations. While the high-tide zone also has high kinetic energy, sedimentation opportunities are limited. This is because, although the high-tide zone has low energy and is easily covered by sediments, the infrequent and brief arrival of seawater here means it has fewer opportunities to capture macroplastics compared to the mid-tide zone.
However, these observed differences among tidal zones were not statistically significant (p > 0.05). Thus, interpretations regarding debris buildup across zones should be considered preliminary and require further investigation with additional data. Furthermore, it has been determined that a significant proportion of commonly utilised plastics (e.g., polyethylene and polypropylene) possess a density that is less than that of seawater, a property that results in their buoyant behaviour upon contact with water. During perio ds of high tide, these organisms are more likely to move with the water’s surface, which can result in their displacement to the upper parts of the tidal flats, particularly the mid-tide and high-tide zones. In the low-tide zone, where the water is deeper, floating plastics are less likely to come into contact with the seabed. Concurrently, the distribution of these organisms can be influenced by tidal flat topography and biological factors. The mid-tide zone and high-tide zone contain greater levels of vegetation, biological traces, and microbial biofilms. These particles have been observed to increase surface roughness, thereby acting as a “net” to effectively trap microplastics that have been carried in by the tide.
The spatiotemporal variation in macroplastic debris observed in this study may be influenced by a combination of seasonal tourism activity, tides, and monsoons [33]. In the winter survey, plastic debris abundance was higher, potentially attributed to the increased number of tourists during the summer months [29] while there was a potential for more extensive cleaning initiatives during that season. Additionally, although overall tourist numbers may be lower in the winter survey, the ZJB region is subject to northerly winds (northwest or northeast winds) during winter, which are not conducive to the transport of macroplastic debris towards the sea (southward) [33]. R. Geyer et al. showed that meteorological and hydrodynamic factors influence the distribution of plastic debris in the marine environment. In this study, stronger tidal currents in the winter survey contributed to increased accumulation of macroplastics in the middle of the tidal zone.

4.3. Composition of Size, Color, and Shape of Entrapped Macroplastics

In terms of size, most of the macroplastics trapped in the safety nets were in the range of 10–40 cm, with the largest proportion found in the size range of 20–40 cm. The dominant colors found were transparent and white plastic, indicating that plastic from single-use packaging and plastic bags were the main sources of pollution. In terms of shape, plastic bags dominated the macroplastic samples trapped, with a percentage reaching 65% in the winter survey and 42% in the summer survey. There is research that is in line with this, which states that plastic bags are more easily carried by ocean currents and have a low level of degradation in the marine environment [37].
The dominance of smaller macroplastic items (10–40 cm) in this study may reflect a combination of environmental degradation and physical fragmentation of larger plastic debris before reaching the safety net system. Prolonged exposure to UV radiation, wave action, and mechanical abrasion in coastal waters can break down larger items such as bags, containers, or packaging into smaller pieces [34]. It is also possible that the design of the safety nets influenced the observed size distribution. While the SN effectively retained many mid-sized items, very small macroplastics near the lower threshold (2.5–10 cm) may have passed through the mesh, especially during strong tidal flow. However, the complete absence of microplastics (<2.5 cm) in our dataset supports the functional lower limit of retention by the SN system used in this study. Transparent plastic was the most dominant color observed in both the winter survey and summer survey. This may be attributed to the widespread use of single-use packaging materials such as bags, wrappers, and disposable containers, which are often manufactured from clear low-density polyethylene (LDPE). Such items are commonly used in food services, street vending, and coastal tourism areas around YPB, increasing their likelihood of entering the marine environment. Their lightweight and buoyant properties also increase their transportability via wind and tide. In addition, transparent items may be less visually detected and collected by beach cleaning efforts, allowing them to persist longer in the environment [20]. Analysis of the size, color, and shape composition of macroplastics is important for understanding the sources and distribution pathways of plastic pollution in ZJB. This information can help identify human activities that contribute significantly to pollution, such as fisheries, tourism, or industry. Thus, more targeted management strategies can be designed to reduce the entry of macroplastics into the marine environment [14]. In addition, understanding the physical characteristics of trapped macroplastics can contribute to the development of more effective safety net designs. For example, adjusting the pore size of the net can increase the efficiency of capturing fragments of a certain size. This approach will improve the effectiveness of plastic pollution mitigation efforts in ZJB and its surrounding waters [35].

4.4. Chemical Composition Analysis of Macroplastics

The use of an FTIR analysis showed that most macroplastic samples consisted of polyethylene (LDPE and HDPE), polypropylene, and polystyrene. The presence of large amounts of LDPE indicates that flexible plastics such as bags and food packaging are the main contributors to macroplastic pollution at the study site. There is research stating that low-density polyethylene (LDPE) is one of the most common types of plastic found in coastal environments because it is lightweight and easily carried by currents. The data from this study showed that more than 70% of the samples analyzed contained LDPE, while the rest consisted of polystyrene and polypropylene [36].
A study of the chemical composition of macroplastics trapped in safety nets in the waters of ZJB, China, identified various types of synthetic polymers. FTIR spectroscopy analysis revealed the dominance of polymers such as polyethylene (PE), polypropylene (PP), and polystyrene (PS) in the collected samples. These polymers are commonly used in everyday products such as plastic bags, food packaging, and household appliances [29]. In addition, other polymers such as polyethylene terephthalate (PET) and polyvinyl chloride (PVC) were also found in smaller amounts. PET is often used in beverage bottles and textile fibers, while PVC is widely used in construction materials and pipes. The diversity of these polymer types reflects the various sources of plastic pollution in the region [2].
Further analysis showed that most of the trapped macroplastics had undergone physical and chemical degradation. These degradation processes, triggered by exposure to ultraviolet light, oxidation, and the mechanical action of waves, cause changes in the chemical structure of the polymer. As a result, macroplastics become more fragile and susceptible to fragmentation into smaller particles, such as microplastics [38]. Understanding the chemical composition of macroplastics is essential for identifying the main sources of pollution and designing effective management strategies. For example, the dominance of PE and PP indicates the need to reduce the use of single-use plastic bags and improve the management of packaging waste. In addition, this information can help in the development of recycling technologies specific to the most abundant polymer types [14].

4.5. Implications for Coastal Management

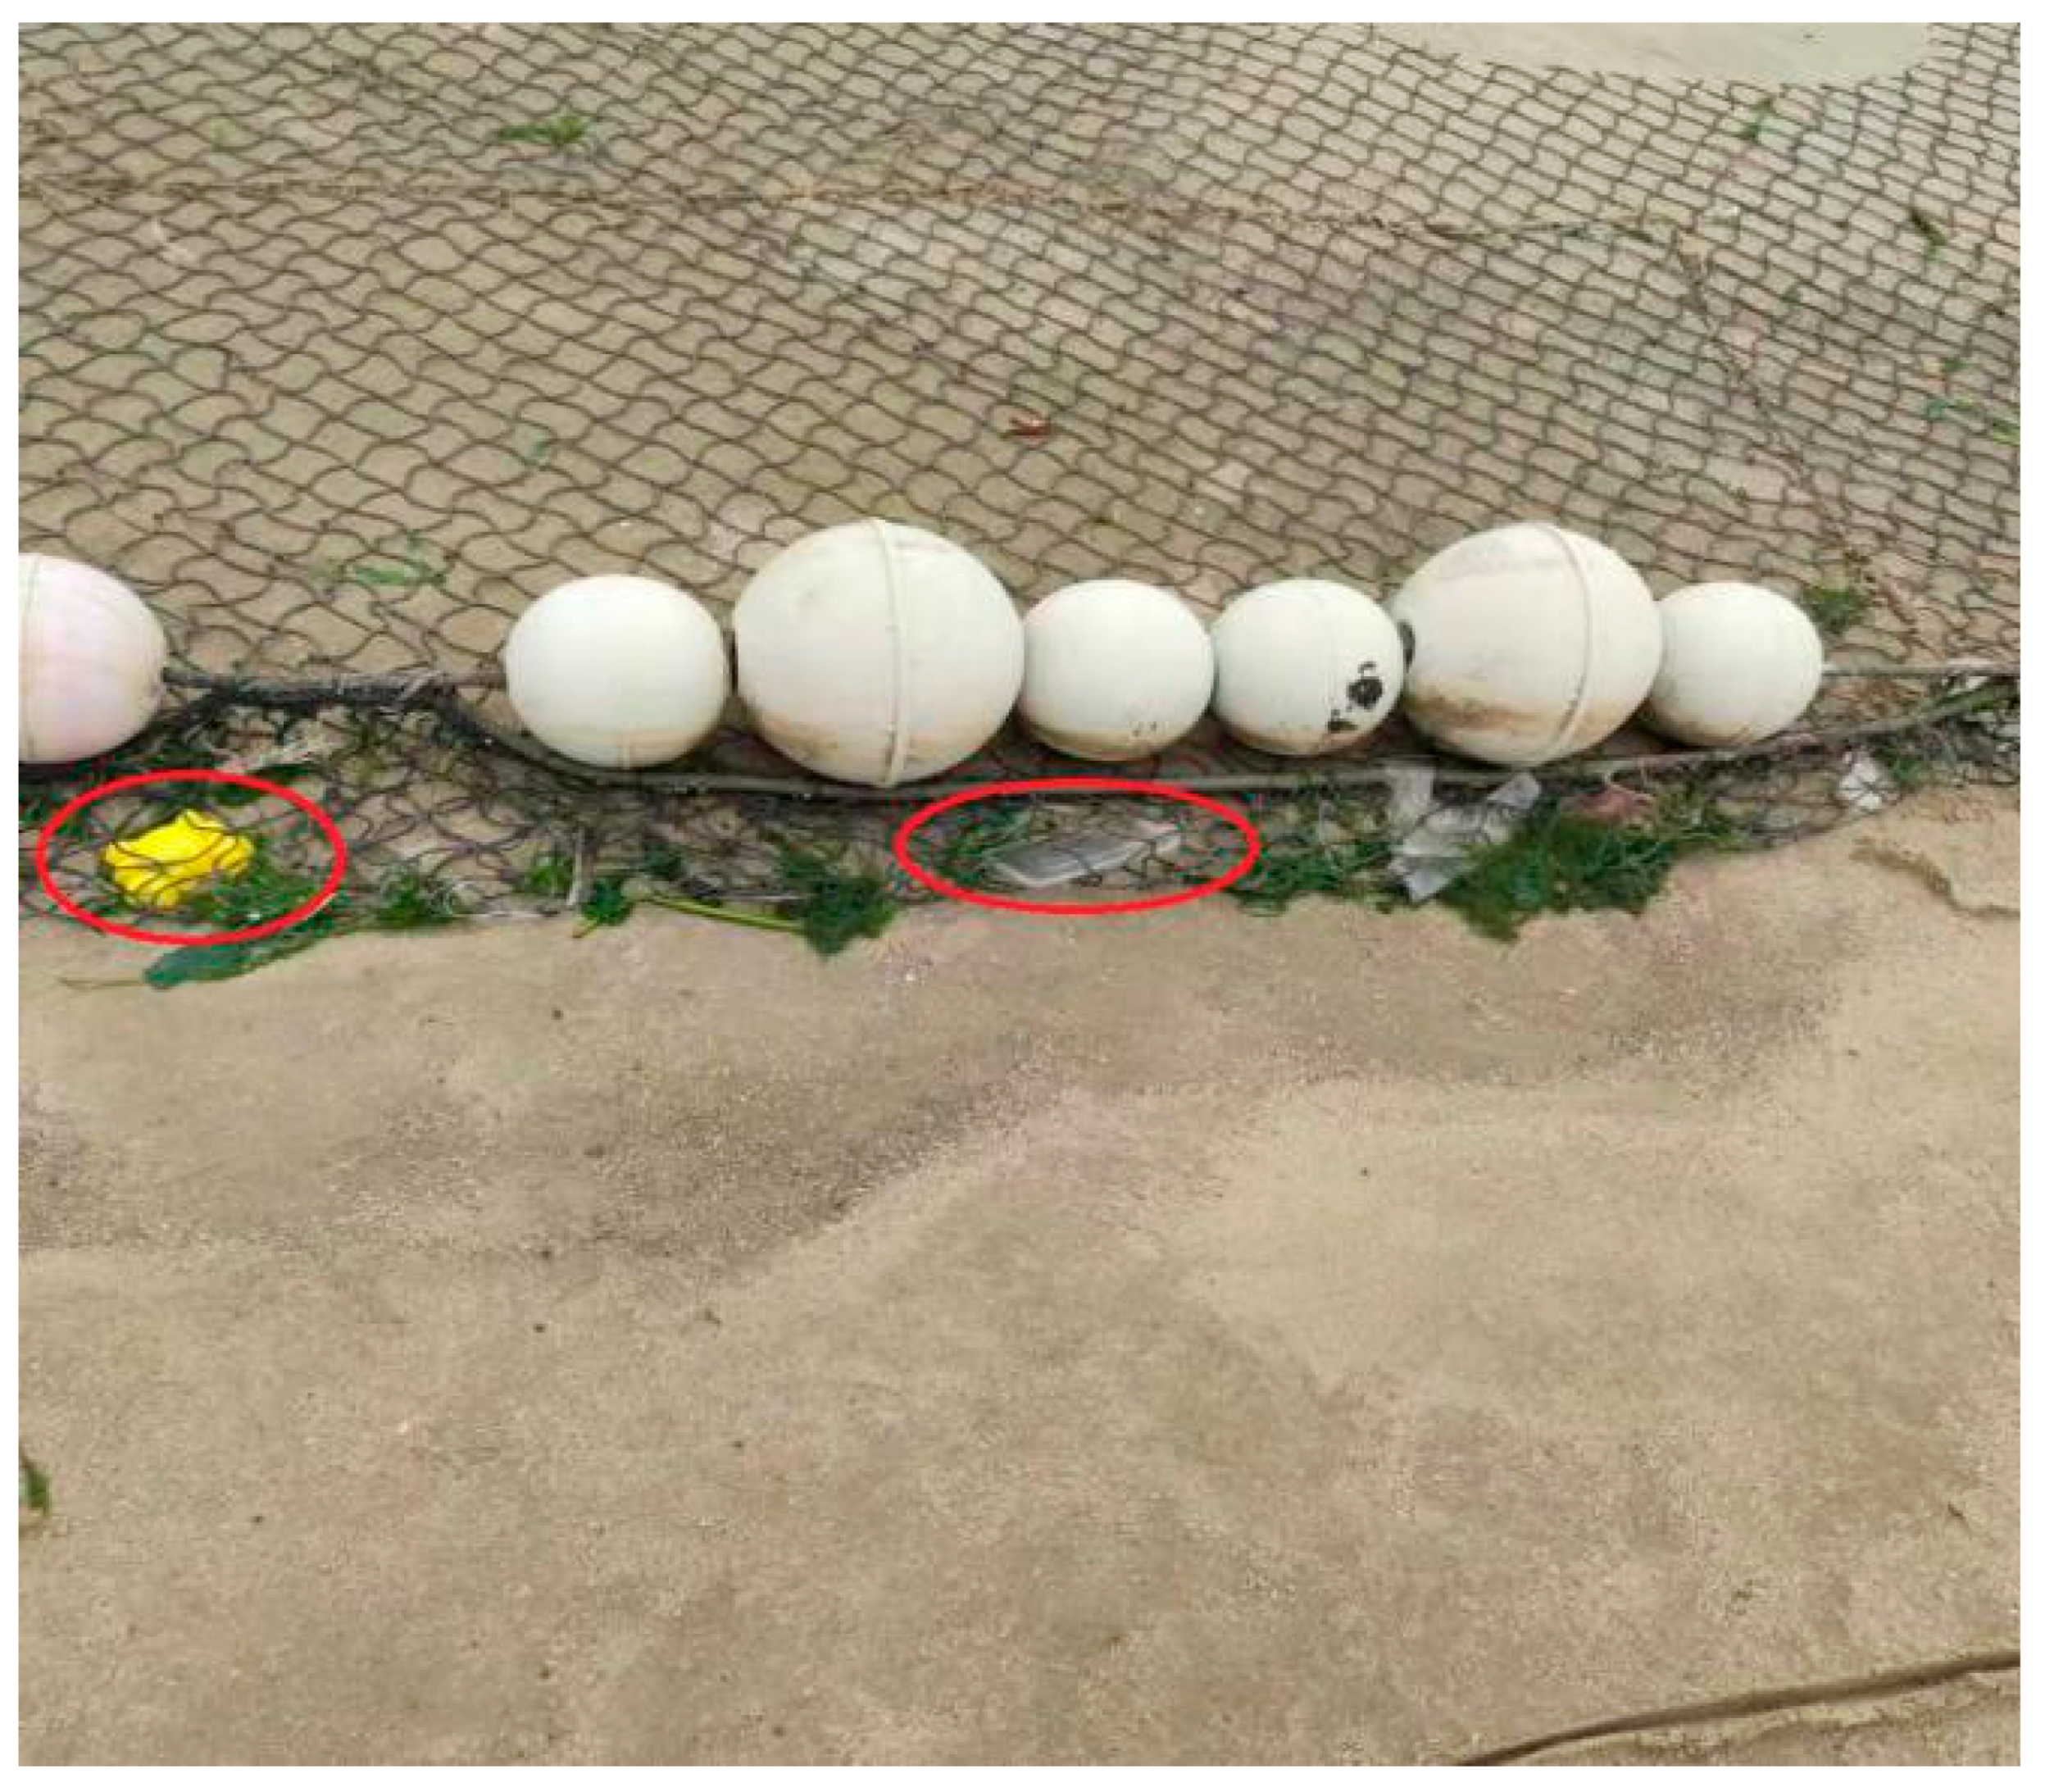
As can be seen in Figure 6 below, the yellow crab-like toys and the transparent disposable lunch box lids are garbage produced by people playing in YB.
The results of this study indicate that the use of safety nets as one method of mitigating plastic pollution has a fairly high effectiveness, especially if installed in strategic locations with strong currents. However, this effectiveness can be influenced by various environmental factors such as season, current direction, and the size of plastic waste. To improve the effectiveness of coastal management and plastic pollution mitigation, a policy-based approach is needed, including strict regulations on single-use plastics, especially plastic bags and food packaging, which are the main sources of pollution, improving coastal waste management by placing more efficient waste processing facilities around ZJB, educating the public about the impacts of plastic pollution, which can raise awareness of the importance of reducing single-use plastic consumption, and improving mitigation technology, such as the use of nets with adjustable hole sizes to capture more macroplastics without disrupting the marine ecosystem. Our findings suggest that plastic bags and wrappers dominate macroplastic debris in YPB. Such results underscore the potential effectiveness of local bans or levies on single-use bags similar to those implemented in other coastal cities [14]. As shown in other studies, debris characterization through trash traps can serve as a policy feedback tool by documenting the success [21].
The results of this study provide important insights for coastal management in ZJB and other coastal areas facing similar issues. Further studies are needed to disseminate the long-term impacts of the use of safety nets and the effectiveness of combinations of other mitigation technologies in addressing plastic pollution in coastal waters. The implementation of safety nets also requires consideration of proper design and placement to maximize fishing efficiency without disrupting fishing activities and navigation. In addition, routine maintenance and management of trapped waste are important aspects to ensure long-term effectiveness. Collaboration between local governments, fishing communities, and environmental organizations is essential in this regard. Overall, a holistic approach combining macroplastic capture, source prevention, appropriate infrastructure design, and community education is needed for effective coastal management of ZJB. These efforts are expected to reduce the negative impacts of plastic pollution on marine ecosystems and the well-being of local communities. Multi-stakeholder collaboration and comprehensive policies are key to success in addressing this challenge [39].
Based on the findings of this study, the following tiered recommendations are proposed to support coastal management in recreational waters like YPB: Short-term strategies (0–1 year): conduct regular clean-up operations targeting mid- and high-tide zones, especially during winter survey, when macroplastic accumulation is highest; place clear signage and waste bins near recreational areas to reduce plastic littering from tourists and vendors; and train local community volunteers or park staff in plastic debris monitoring and safe collection techniques. Medium-term strategies (1–3 years): Install or upgrade safety net (SN) systems at additional tidal zones and optimize mesh size to balance debris capture and ecological flow; improve stormwater drainage systems to include pre-filtration traps that reduce plastic inflow from surrounding urban areas; and introduce seasonal restrictions or waste-management policies for food stalls and beach vendors operating in peak plastic emission periods. Long-term strategies (3+ years): Develop community education programs focusing on plastic pollution impacts, source reduction, and citizen science monitoring; integrate plastic debris control into local marine spatial planning and zoning regulations; and foster multi-stakeholder partnerships (e.g., government, universities, and NGOs) for long-term monitoring, policy formulation, and innovation in plastic capture technologies [40]. These strategies reflect a holistic approach to reducing macroplastic accumulation and preventing its degradation into microplastics. A combination of behavioral, infrastructural, and regulatory interventions is essential to protect recreational coastal waters like YPB.

5. Conclusions

This study provides insight into the types and spatial distribution of macroplastic debris captured by safety nets deployed at a popular bathing beach in southern China. While the data illustrate accumulation patterns across tidal zones and over seasonal timeframes, they do not quantify net efficacy or retention performance. Future research should incorporate experimental variation in net design (e.g., mesh size, orientation, and flow conditions) to assess performance more rigorously and inform optimized mitigation strategies. The results showed that the amount of macroplastics trapped was higher in the winter survey than in the summer survey, with the dominant macroplastic size being in the range of 10–40 cm. Transparent plastic samples dominated in both seasons, with plastic bags being the most common macroplastic type. Although our observations suggest higher concentrations in the mid-tide zone, followed by high- and low-tide zones, these differences were not statistically significant. Hence, this finding should be considered preliminary and needs validation through further sampling. Summer tourism activities are more intense, matched with higher cleaning intensity, which may be an important factor in the lower total amount of macroplastics in the summer survey compared to the winter survey. Implications of this study for coastal management include the need for evidence-based policies that combine plastic capture technology with prevention strategies. The use of safety nets has been shown to reduce the accumulation of macroplastics on beaches but requires regular maintenance and a system for managing the captured waste. In addition, public education and collaboration with various stakeholders are important steps to improve the effectiveness of plastic pollution mitigation strategies. Overall, this study confirms that safety nets can serve as an effective tool for mitigating plastic pollution when implemented with a holistic coastal management approach. A combination of technology, regulatory policies, and community engagement is needed to reduce the impact of plastic pollution on marine ecosystems and coastal sustainability in ZJB. Future work should focus on extended monitoring and larger datasets to rigorously test the hypothesis of tidal zone-specific debris accumulation.

Author Contributions

Methodology, C.B.S. and J.X.; Software, C.B.S. and J.X.; Validation, J.X. and S.K.; Formal analysis, C.B.S. and J.X.; Resources, P.Z. and J.Z.; Data curation, C.B.S.; Writing—original draft, C.B.S., P.Z. and J.X.; Writing—review & editing, C.B.S., P.Z., and C.B.S.; Supervision, P.Z. and J.Z.; Project administration, P.Z., S.K. and J.Z.; Funding acquisition, P.Z. and J.Z. All authors have read and agreed to the published version of the manuscript.

Funding

Guangdong Provincial Graduate Education Innovation Program Project: Research on the Reform of Graduate Seawater Analytical Chemistry Teaching Empowered by Digital Technology under the Interdisciplinary Field of Oceanography (2025JGXM_084); Guangdong Ocean University Graduate Education Innovation Program Project: Ideological and Political Construction Project of Graduate Courses in the New Era “Chemical Oceanography” (202523); Research and Development Projects in Key Areas of Guangdong Province (2020B1111020004); Guangdong Basic and Applied Basic Research Foundation (2023A1515012769); and Guangdong Ocean University Fund Project (R18021).

Data Availability Statement

The original contributions presented in this study are included in the article. Further inquiries can be directed to the corresponding author.

Acknowledgments

We thank the anonymous reviewers for their careful review and valuable suggestions regarding the manuscript, and our funders.

Conflicts of Interest

The authors declare no conflict of interest.

References

  1. Olatayo, K.I.; Mativenga, P.T.; Marnewick, A.L. Comprehensive evaluation of plastic flows and stocks in South Africa. Resour. Conserv. Recy. 2021, 170, 105567. [Google Scholar]
  2. Maharana, D.; Saha, M.; Dar, J.Y.; Rathore, C.; Sreepada, R.; Xu, X.-R.; Koongolla, J.B.; Li, H.-X. Assessment of plastics along the west coast of India: Abundance, distribution, polymer type and toxicity. Chemosphere 2020, 246, 125708. [Google Scholar] [PubMed]
  3. Jokar, Z.; Banavi, N.; Taghizadehfard, S.; Hassani, F.; Solimani, R.; Azarpira, N.; Dehghani, H.; Dezhgahi, A.; Sanati, A.M.; Farjadfard, S.; et al. Marine litter along the shores of the Persian Gulf, Iran. Heliyon 2024, 10, e30853. [Google Scholar] [CrossRef] [PubMed]
  4. Suaria, G.; Avio, C.G.; Mineo, A.; Lattin, G.L.; Magaldi, M.G.; Belmonte, G.; Moore, C.J.; Regoli, F.; Aliani, S. The Mediterranean plastic soup: Synthetic polymers in Mediterranean surface waters. Nat. Publ. Group 2016, 6, 37551. [Google Scholar]
  5. Li, Y.; Zhang, Q.; Baartman, J.; van Wijnen, J.; Beriot, N.; Kroeze, C.; Wang, M.; Xu, W.; Ma, L.; Wang, K.; et al. The Plastic Age: River pollution in China from Crop Production and Urbanization. Environ. Sci. Technol. 2023, 57, 12019–12032. [Google Scholar] [CrossRef]
  6. Eriksen, M.; Lebreton, L.C.M.; Carson, H.S.; Thiel, M.; Moore, C.J.; Borerro, J.C.; Reisser, J. Plastic pollution in the world’s oceans: More than 5 trillion plastic pieces weighing over 250,000 Tons a float at sea plastic pollution is ubiquitous throughout the marine environment. PLoS ONE 2014, 9, e111913. [Google Scholar]
  7. Allison, N.L.; Dale, A.C.; Narayanaswamy, B.E.; Turrell, W.R. Investigating local trawl fishing as a source of plastic beach litter. Mar. Pollut. Bull. 2024, 205, 116627. [Google Scholar] [CrossRef]
  8. Andrady, A.L. The plastic in microplastics: A review. Mar. Pollut. Bull. 2017, 119, 12–22. [Google Scholar] [CrossRef]
  9. Acampora, H.; Schuyler, Q.A.; Townsend, K.A.; Hardesty, B. Comparing plastic ingestion in juvenile and adult stranded short-tailed shearwaters (Puffinus tenuirostris) in eastern Australia. Mar. Pollut. Bull. 2013, 78, 63–68. [Google Scholar]
  10. Xiao, Z.; Yu, S.; Li, Y.; Ruan, S.; Bing, L.; Huang, Q.; Zhang, L.; Chen, X.; Tang, D. Materials Science & Engineering R Materials development and potential applications of transparent ceramics: A review. Mater. Sci. Eng. 2020, 139, 100564. [Google Scholar]
  11. Bradney, L.; Wijesekara, H.; Palansooriya, K.N.; Obadamudalige, N.; Bolan, N.S.; Ok, Y.S.; Rinklebe, J.; Kim, K.-H.; Kirkham, M. Particulate plastics as a vector for toxic trace-element uptake by aquatic and terrestrial organisms and human health risk. Environ. Int. 2019, 131, 104937. [Google Scholar] [CrossRef]
  12. GESAMP. Sources, fate and effects of microplastics in the marine environment: A global assessment. GESAMP Rep. Stud. 2016, 90, 1020–4873. [Google Scholar]
  13. Alvarado-Zambrano, D.; Rivera-Hernández, J.R.; Green-Ruiz, C. Macroplastic and microparticle pollution in beach sediments from Urias Coastal Lagoon (Northwest Mexico). Toxics 2024, 12, 439. [Google Scholar] [CrossRef]
  14. Bergmann, M.; Gutow, L.; Klages, M. Marine Anthropogenic Litter; Springer: Berlin/Heidelberg, Germany, 2015; 447p. [Google Scholar]
  15. Axelsson, C.; van Sebille, E. Prevention through policy: Urban macroplastic leakages to the marine environment during extreme rainfall events. Mar. Pollut. Bull. 2017, 124, 211–227. [Google Scholar] [CrossRef]
  16. Kasavan, S.; Yusoff, S.; Fakri, M.F.R.; Siron, R. Plastic pollution in water ecosystems: A bibliometric analysis from 2000 to 2020. J. Clean. Prod. 2021, 313, 127946. [Google Scholar] [CrossRef]
  17. Wu, W.; Biber, P.; Mishra, D.R.; Ghosh, S. Sea-level rise thresholds for stability of salt marshes in a riverine versus a marine-dominated estuary. Sci. Total Environ. 2020, 718, 137181. [Google Scholar]
  18. Yu, R.-S.; Yang, Y.-F.; Singh, S. Global analysis of marine plastics and implications of control measure strategies. Front. Mar. Sci. 2023, 10, 1305091. [Google Scholar] [CrossRef]
  19. Abelouah, M.R.; Ben-Haddad, M.; Alla, A.A.; Rangel-Buitrago, N. Marine litter in the central Atlantic coast of Morocco. Ocean Coast. Manag. 2021, 214, 105940. [Google Scholar] [CrossRef]
  20. Savoca, M.S.; Abreo, N.A.; Arias, A.H.; Baes, L.; Baini, M.; Bergami, E.; Brander, S.; Canals, M.; Choy, C.A.; Corsi, I.; et al. Monitoring plastic pollution using bioindicators: A global review and recommendations for marine environments. Environ. Sci. Adv. 2024, 4, 10–32. [Google Scholar] [CrossRef]
  21. Fruergaard, M.; Laursen, S.N.; Larsen, M.N.; Posth, N.R.; Niebe, K.B.; Bentzon-Tarp, A.; Svenningsen, S.K.; Lia, N.; Trinh, B.-S.; Tran-Thi, P.T.; et al. Abundance and sources of plastic debris on beaches in a plastic hotspot, Nha Trang, Viet Nam. Mar. Pollut. Bull. 2023, 186, 114394. [Google Scholar]
  22. Núñez, P.; Pérez-García, L.; Rezaee, S.M.; Bárcena, J.F.; García, A. Experimental study of buoyant macro- and mesoplastic trapping by Spartina maritima. Mar. Pollut. Bull. 2025, 216, 118005. [Google Scholar] [CrossRef]
  23. Nawarat, K.; Reyns, J.; Vousdoukas, M.I.; Duong, T.M.; Kras, E.; Ranasinghe, R. Coastal hardening and what it means for the world’s sandy beaches. Nat. Commun. 2024, 15, 10626. [Google Scholar] [CrossRef]
  24. Blettler, M.C.; Agustini, E.; Abrial, E.; Piacentini, R.; Garello, N.; Wantzen, K.M.; Vega, M.G.; Espinola, L.A. The challenge of reducing macroplastic pollution: Testing the effectiveness of a river boom under real environmental conditions. Sci. Total Environ. 2023, 870, 161941. [Google Scholar]
  25. Richon, C.; Kvale, K.; Lebreton, L.; Egger, M. Legacy oceanic plastic pollution must be addressed to mitigate possible long-term ecological impacts. Microplastics Nanoplastics 2023, 3, 25. [Google Scholar] [CrossRef]
  26. Leslie, H.A.; van Velzen, M.J.; Brandsma, S.H.; Vethaak, A.D.; Garcia-Vallejo, J.J.; Lamoree, M.H. Discovery and quantification of plastic particle pollution in human blood. Environ. Int. 2022, 163, 107199. [Google Scholar] [CrossRef]
  27. Egessa, R.; Nankabirwa, A.; Basooma, R.; Nabwire, R. Occurrence, distribution and size relationships of plastic debris along shores and sediment of northern Lake Victoria. Environ. Pollut. 2020, 257, 13442. [Google Scholar] [CrossRef]
  28. Wang, Z.; Zhao, H.; Zhao, L. Distribution characteristics and pollution sources analysis of polycyclic aromatic hydrocarbons and Phthalate Esters in the. Water 2024, 16, 948. [Google Scholar] [CrossRef]
  29. Zhang, P.; Wei, S.; Zhang, J.; Zhong, H.; Wang, S.; Jian, Q. Seasonal distribution, composition, and inventory of plastic debris on the Yugang Park Beach in Zhanjiang Bay, South China Sea. Int. J. Environ. Res. Public Health 2022, 19, 4886. [Google Scholar]
  30. Brewster, C.W.; Morse, M.R.; Fournier, R.J.; Joseph, L.; Baechler, B.R.; de Frond, H.; McCauley, D.J. Assessing macroplastic debris collected from eight diverse river systems across four continents: Insights from synchronous three-year community-led research efforts. J. Environ. Manag. 2025, 391, 126354. [Google Scholar]
  31. Anna, S.; Rozalina, C. Macroplastic distribution (Single-use plastics and some Fishing gear) from the northern to the southern Bulgarian Black Sea coast. Reg. Stud. Mar. Sci. 2020, 37, 101329. [Google Scholar] [CrossRef]
  32. Tramoy, R.; Ledieu, L.; Ricordel, S.; Astrié, D.; Tassin, B.; Gasperi, J. Macrolitter dataset from a highly frequented roadway in Nantes. France. Data Br. 2022, 42, 108237. [Google Scholar]
  33. Garello, N.; Blettler, M.C.; Espínola, L.A.; Wantzen, K.M.; Gonz’alez-Fern’, D.; Rodrigues, S. The role of hydrodynamic fluctuations and wind intensity on the distribution of plastic debris on the sandy beaches of Paran’a River, Argentina. Environ. Pollut. 2021, 291, 118168. [Google Scholar] [PubMed]
  34. de Deus, B.C.T.; Costa, T.C.; Altomari, L.N.; Brovini, E.M.; de Brito, P.S.D.; Cardoso, S.J. Coastal plastic pollution: A global perspective. Mar. Pollut. Bull. 2024, 203, 116478. [Google Scholar] [CrossRef]
  35. Tavares, D.C.; Moura, J.F.; Ceesay, A.; Merico, A. Density and composition of surface and buried plastic debris in beaches of Senega. Sci. Total Environ. 2020, 737, 139633. [Google Scholar]
  36. Gündoğdu, S.; Çevik, C. Mediterranean dirty edge: High level of meso and macroplastics pollution on the Turkish coast. Environ. Pollut. 2019, 255, 113351. [Google Scholar] [CrossRef]
  37. Kurniawan, R.; Saputra, I.A.; Purnomo, H. Composition of macroplastics in Teluk Penyu, Cilacap. AACL Bioflux 2024, 17, 1499–1509. [Google Scholar]
  38. Markić, A.; Iveša, N.; Budiša, A.; Kovačić, I.; Burić, P.; Pustijanac, E.; Buršić, M.; Banai, B.; Legin, D.P.; Palatinus, A.; et al. Fragmented marine plastics as the prevalent litter type on a small island beach in the Adriatic. Mar. Pollut. Bull. 2024, 203, 116467. [Google Scholar] [CrossRef]
  39. Balthazar-Silva, D.; Turra, A.; Moreira, F.T.; Camargo, R.M.; Oliveira, A.L.; Barbosa, L.; Gorman, D. Rainfall and tidal cycle regulate seasonal inputs of microplastic pellets to Sandy Beaches. Front. Environ. Sci. 2020, 8, 123. [Google Scholar] [CrossRef]
  40. Wu, X.; Zhao, X.; Chen, R.; Liu, P.; Liang, W.; Wang, J.; Shi, D.; Teng, M.; Wang, X.; Gao, S. Size-dependent long-term weathering converting floating polypropylene macro- and microplastics into nanoplastics in coastal seawater environments. Water Res. 2023, 242, 120165. [Google Scholar] [PubMed]
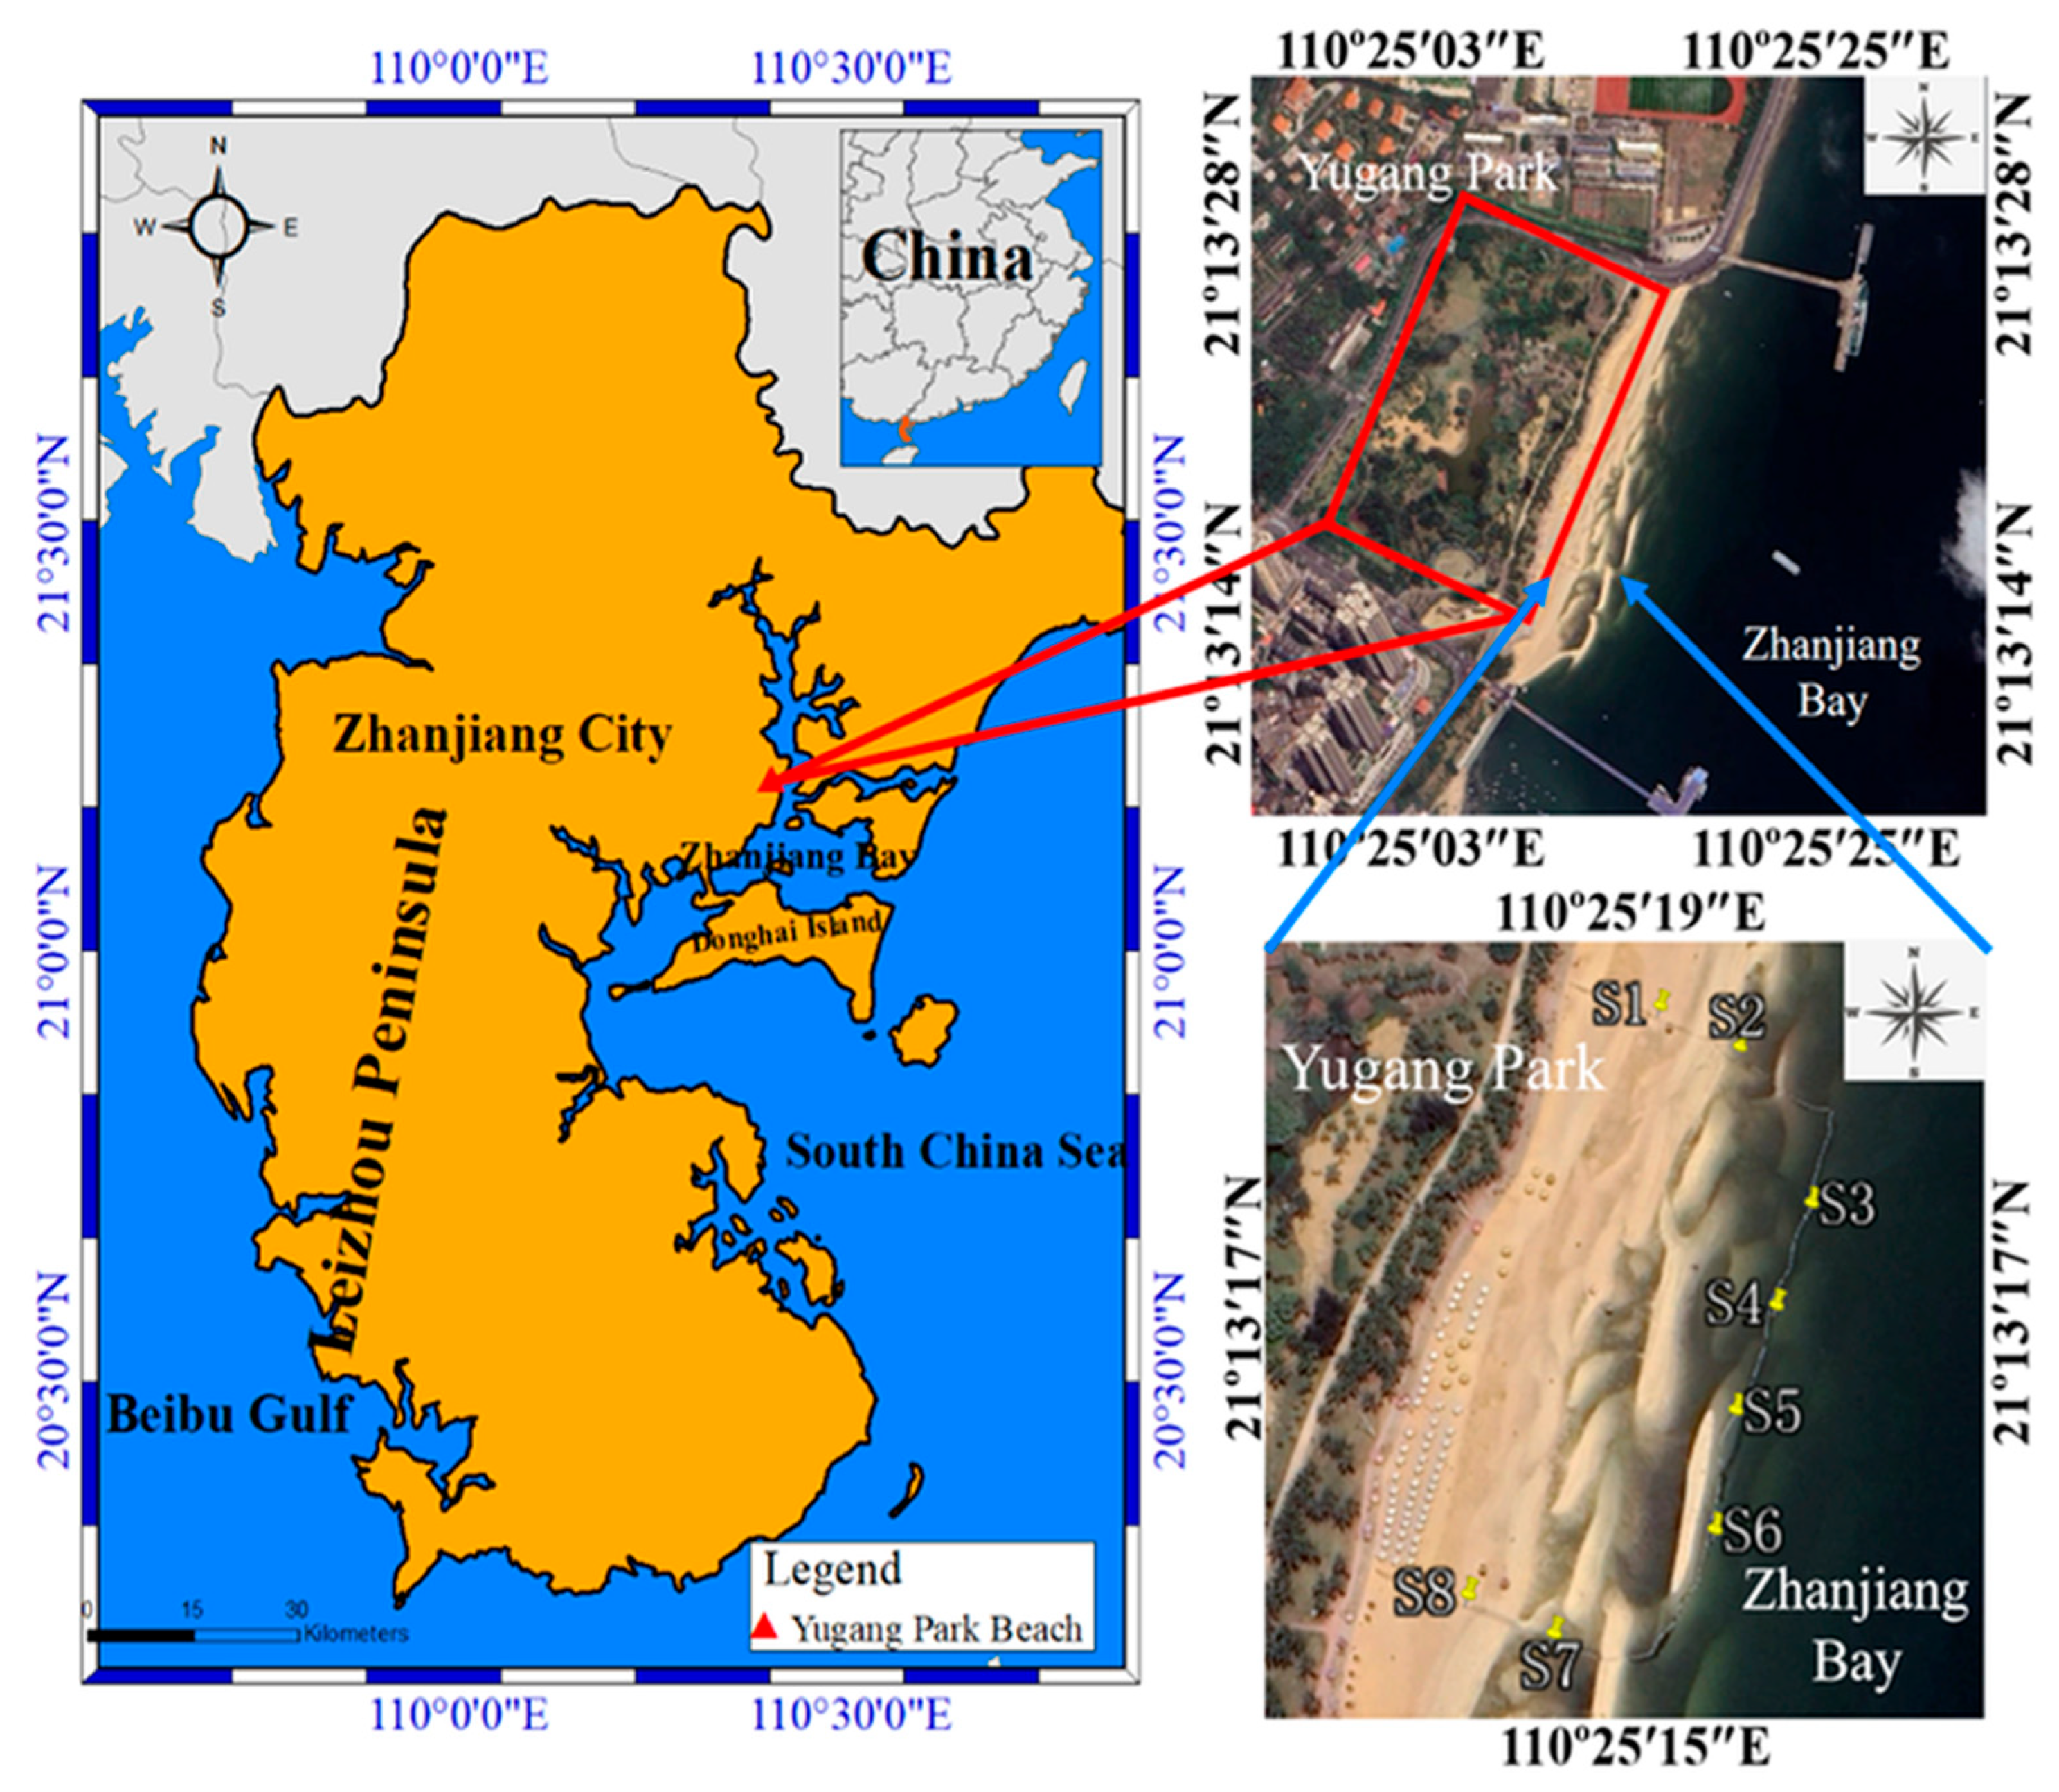
Figure 1. Geographical location of sampling stations in Yugang Park Bay (YPB), Zhanjiang, China. SN means safety net. Map created using Google Earth Pro, including scale bar and north orientation. Available online: https://earth.google.com (accessed on 15 July 2021).
Oceans 06 00064 g001
Figure 2. Spatiotemporal pattern of macroplastic debris on the SN of the YPB. The bar chart shows the number of microplastics, while the line chart shows their weight.
Oceans 06 00064 g002
Figure 3. Spatiotemporal size (a), shape (b), and color (c) composition of macroplastic debris on the SN of the YPB.
Oceans 06 00064 g003
Figure 4. Typical identified macroplastics and their compositions. Photos and FTIR data collected by the authors.
Oceans 06 00064 g004
Figure 5. Quantifying the total amount of macroplastic debris on the SN of the YPB.
Oceans 06 00064 g005
Figure 6. Identification of the source of some plastic waste. Photos taken by authors during field sampling at YPB.
Oceans 06 00064 g006
Table 1. Comparison with the abundance of macroplastic debris on other beaches around the world.
Geographical AreaPeriodPlastic SizeAbundanceReference
N° Item
(m2)
Weight
(g·m−2)
Beaches of Paran’a
River (Argentina)
Autumn (2018)macroplastic0.8 ± 0.29.96 ± 2.6[33]
Winter (2018)0.70 ± 0.38.82 ± 1.1
Spring (2018)1.79 ± 0.526.09 ± 6.9
Summer (2019)0.36 ± 0.24.89 ± 0.6
River Veleka mouth (The Bulgarian Black Sea coast)Summer (-)macroplastic0.12-[31]
Channel 2-Varna (The Bulgarian Black Sea coast)-macroplastic3.40-
All China Beach Area2020Beach trash0.221.24[34]
Fishing landing beaches
in northern Lake Victoria
July, October (2018)macroplastic18.1-[27]
Recreational beaches
in northern Lake Victoria
3.8-
Beaches in in Senegal, West AfricaFeburary (2019)plastic debris (>5 mm)1.92-[35]
Iskenderun Bay, Turkey13th Maymacroplastic12.30.80[36]
Yugang Park Beach, Zhanjiang Bay, ChinaSummer survey (2021)macroplastic1.5914.22This study
Winter survey (2021)1.8114.21
Only macroplastic debris data were used for direct comparison. Entries reporting microplastics or general beach trash are included for reference only and are not directly comparable.
Disclaimer/Publisher’s Note: The statements, opinions and data contained in all publications are solely those of the individual author(s) and contributor(s) and not of MDPI and/or the editor(s). MDPI and/or the editor(s) disclaim responsibility for any injury to people or property resulting from any ideas, methods, instructions or products referred to in the content.