Article

Dynamics of Oxygen and the Physicochemical Response in Two Comparative Hypoxia Regions

1
College of Environmental and Resource Science, Fujian Normal University, Fuzhou 350117, China
2
Leibniz Institute for Baltic Sea Research, Warnemünde, 18119 Rostock, Germany
3
Mediterranean Institute for Advanced Studies, IMEDEA (CSIC-UIB), 07190 Esporles, Spain
4
Fujian Provincial Academy of Environmental Sciences, Fuzhou 350013, China
5
Key Laboratory of Pollution Control and Resource Recycling of Fujian Province, Fujian Normal University, Fuzhou 350117, China
6
Fujian Environmental Monitoring Internet of Things Laboratory, Fujian Normal University, Fuzhou 350117, China
*
Author to whom correspondence should be addressed.
Oceans 2025, 6(3), 54; https://doi.org/10.3390/oceans6030054
Submission received: 22 May 2025 / Revised: 15 August 2025 / Accepted: 20 August 2025 / Published: 29 August 2025

Abstract

The oxygen depletion in worldwide oceans and inland waters is becoming an increasingly prevalent problem. Here, two comparative study sites, Baltic Proper (BP) and Shuikou Reservoir (SR), were selected to identify the dynamics of dissolved oxygen (DO) and the related physicochemical response by conducting five field investigations over a one-year period. The DO concentrations were 0–9.9 mg L−1 and 0.3–8.7 mg L−1 in BP and SR, with average oxygen change rates of −0.016~0.014 mg L−1 d−1 and −0.022~0.018 mg L−1 d−1, respectively. Such oxygen dynamics were highly related to salinity, temperature, turbidity, and chlorophyll-a than nitrogen and phosphorus. The persistent hypoxia (i.e., DO < 2 mg L−1) emerged below 63 m in BP during all sampling months where the reversal points of Brunt–Väisälä frequency N expressed in the form log10[N2 (s−2)] were −4. The seasonal hypoxia covered the downstream of SR at depths below 11.5 m in September with the highest log10[N2 (s−2)] between −3.95 and −3.64. The log10[N2 (s−2)] ≈ −4 may indicate the occurrence and development of hypoxia in both regions. In the case of the persistent and seasonal hypoxic conditions in BP and SR, the impact of temperature and turbidity on DO was opposite. Low oxygen levels in SR occurred under elevated temperature and turbidity. Additionally, under hypoxic conditions in both regions, NO3 and NH4+ concentrations significantly depended on DO changes. This study contributes to the understanding of seasonal changes in oxygen dynamics in different water bodies, and highlights different oxygen conditions and physicochemical responses to the oxygen changes.

1. Introduction

Oxygen is vital to sustain the life of aquatic organisms. It affects biogeochemical cycles and constrains the productivity and biodiversity of aquatic habitats, with potentially detrimental consequences for fisheries and economies when the oxygen concentrations are below 2.0 mg L−1 [1,2]. During the past decades, deep oceans and inland lakes have experienced accelerating oxygen depletion (i.e., hypoxia and anoxia) [3,4]; thus, the increasing episodes and areal extent of hypoxia have attracted great scientific and economic interest worldwide. Generally, human-caused eutrophication and global warming [5] have adversely affected the oxygen budgets of aquatic ecosystems. In addition, the behavior of oxygen in different bodies of water is complex, and there is limited understanding of the response of oxygen to changes in environmental conditions [6].
For the concentration limits to describe oxygen-deficiency conditions, Diaz and Rosenberg [7] defined hypoxia at 2.8 mg L−1 and anoxia at 0.0 mg O2 L−1. Fish mortality occurs at oxygen concentrations below 2.0 mg L−1 [8]. The median lethal oxygen concentration for marine benthic organisms was found to be 2.09 ± 0.20 mg L−1 [9]. When dissolved oxygen (DO) levels fell below 1.7 mg L−1, many fishes resorted to aquatic surface respiration [10]. Often, when oxygen concentrations are below 0.5 mg L−1, sediments become anoxic with the redox-discontinuity layer near the surface [11]. Therefore, 2 mg L−1 and 0.5 mg L−1 were considered in this study as the concentration limits for hypoxia and severe hypoxia, respectively [12]. Hypoxic environments have existed through geological time and occurred in the oceans and inland waters worldwide, including the Baltic Sea [10], the northern coast of the Indian Ocean [13], Maine lakes in America [4], Erhai Lake in China [14], and many other environments [15,16,17,18,19,20]. Global warming and eutrophication in temperate marginal seas are reinforced due to the increase in greenhouse gas emissions and nutrient discharges [5]. Consequently, the extent and severity of hypoxia are more likely to increase in the near future [5,6,21], which may cause additional ecological and economic losses [22]. Diaz and Rosenberg [11] proposed a classification of hypoxia into four distinct categories based on its severity, namely: (1) eutrophication-induced (50% occurrences), (2) periodic (25% occurrences), (3) episodic (17% occurrences), and (4) persistent (8% occurrences).
Due to human-caused eutrophication, nutrient-rich waters exist with a surplus of nitrogen and phosphorus. Excessive nutrient inputs, mainly from human waste and agriculture, stimulate phytoplankton growth, which ultimately leads to oxygen depletion in the water as organic matter decomposes [23]. Recent studies have shown a significant increase in the extent and severity of hypoxia because of anthropogenic nutrient input [24,25]. About 60% of the total oxygen consumption was strongly correlated with elevated nutrient loading, while nutrient imbalances (increasing N:P ratios) enhanced harmful algal bloom proliferation in the central Bohai Sea [26]. Moreover, global warming reduces the solubility of oxygen in water and accelerates oxygen consumption by raising metabolic rates, thereby accelerating hypoxia. In addition, warming enhances both thermal and salinity-driven stratification, leading to increased depletion of dissolved oxygen at depth, particularly near the bottom [27]. In consequence, the anthropogenic nutrient load together with climate change may likely exacerbate low-oxygen conditions and the associated effects on aquatic biogeochemistry [28].
Stratification is one of the main factors involved in the development of hypoxia, as it limits the water exchange and oxygen replenishment in the deep basins. Notably, 85% of global ocean oxygen loss was attributed to the intensified stratification during the past five decades [20]. Reduced ventilation in the deep ocean hindered the transport of oxygen into and within the water column, thereby affecting the supply of nutrients that regulate the production of organic matter and its subsequent sinking from the surface layer [21]. In lakes or reservoirs, thermal stratification has also been considered the primary driving factor of hypoxia [29,30,31]. Under hypoxic conditions, the release of nitrogen and phosphorus from the sediments accelerates, which might seriously affect the quality of the bottom waters and result in eutrophication of the aquatic environments [32]. In addition, the decomposition of organic matter in the bottom water leads to additional consumption of oxygen and ultimately reduces the oxygen levels, which also plays a significant role in the development and persistence of hypoxia.
Various environmental conditions, such as temperature changes, hydrology, and nutrients from anthropogenic activities, influence the dynamics of dissolved oxygen in water. In particular, there is still no universal understanding of the initiation or maintenance of hypoxia. Hence, two regions, encompassing marginal seas and inland waters, experiencing unique low-oxygen conditions, were selected to study the seasonally occurring oxygen changes and elucidate the processes promoting the development of hypoxia. In both water systems, there are marginal areas subject to bottom hypoxia. In the Baltic Sea, hypoxia occurs occasionally in the Arkona Basin, and is more frequent in the Bornholm and Gotland Basins [33]. In the reservoir, hypoxia occurs in the deep area in front of the dam [34]. According to five field investigations that covered one year in each research area, we conducted a systematic analysis of the effects of water level, stratification, and water quality parameters on oxygen changes. Our research aimed to answer the following questions: (1) When and under what circumstances does hypoxia occur most frequently? (2) Which parameters are contributing to the overall oxygen dynamics and the development of hypoxia?

2. Materials and Methods

2.1. Study Sites

The waterways along the Baltic Proper (BP), Europe (53°51′23″–60°8′26″ N, 9°31′25″–21°41′47″ E), and Shuikou Reservoir (SR), China (26°17′30″–26°26′54″ N, 118°23′11″–118°49′6″ E), located in the maritime climate zone and subtropical monsoon zone of the northern hemisphere, respectively, were selected as research areas (Figure 1). The Baltic Sea is a semi-enclosed sea divided into sub-basins; the BP covers the part of the Baltic Sea between the Danish Straits and Åland Sea. The water column of the Baltic Sea has strong stratification, a permanent halocline located at 60–80 m, and a water residence time of 25–30 years [35]. Different levels of hypoxia and anoxia have been observed throughout the year below 60 m in the BP [36]. Increased hypoxia has been demonstrated to affect the metabolic performance of eastern Baltic cod (Gadus morhua) and to cause habitat compression, leading to crowding and density-dependent processes that affect cod body condition [37]. Since the Baltic Sea has only irregular inflow of water from the North Sea and is classified as a semi-closed system, it can be considered to behave like a reservoir. The total storage capacity of BP is 13 billion m3 of water [38]. The Minjiang River, the longest river in Fujian Province, China, measures 541 km in length, and its drainage basin covers an area of 60,992 km2. The SR is a river-type reservoir located in the middle reach of the Minjiang River. It was filled in March 1993 following the construction of Shuikou Dam. The maximum storage capacity and water depth are 2.6 billion m3 and 80 m, respectively [39]. Here hypoxia usually occurs in September. Particularly in September 2011 and 2021, all the economically significant fish species cultivated in SR succumbed to hypoxic conditions, resulting in economic loss amounting to at least 3 million dollars.

2.2. Field Surveys

Sampling procedures: Five field surveys for oxygen and the related physicochemical parameters were conducted from July 2021 to May 2022 in the BP and from September 2021 to July 2022 in the RS. In each research area, six sampling stations were located along the main current pathway (Figure 1). The water depths along the BP transit, covering a longitudinal span of around 800 km, were in a range between 20 m and 200 m. The water level in the BP can be considered stable, showing a twice-per-day oscillation with a maximum amplitude of 0.046 m (Figure S1). In contrast, the longitudinal span in the SR was about 60 km, with the maximum depth varying from approximately 25 m to 70 m. In the SR, the water level showed significant changes; the maximum difference in water level during the whole period reached 8.79 m (Figure S1).
Physicochemical properties: During the cruises in BP, the CTD—“SBE 911plus” (Seabird-Electronics, Bellevue, MA, USA) was used to measure pressure, conductivity (SBE 4), oxygen concentration (SBE 43), temperature (SBE 3), turbidity, and Chlorophyll-a (Chl-a) fluorescence (683 nm) in the water column. The CTD sensors’ measurements were validated during the cruise by comparison with measurements. In detail, salinity was calculated from CTD conductivity using Seabird routines and then compared to salinity measurements on discrete water samples by a salinometer with a limit of detection (LD) of 0.002. The slope and offset of the oxygen sensors SBE 43 were determined through Winkler titration in daily comparisons, with an LD of 0.02 mg L−1. For temperature, a high-precision thermometer SBE RT35 was used with an accuracy of 0.001 °C. The accuracy of turbidity and Chl-a measurements was 0.01 NTU and 0.01 µg L−1, respectively. Ammonium ion (NH4+) was determined manually as indophenol blue [40] from unfiltered water on board. Nitrate (NO3) and nitrite (NO2) were analyzed using standard colorimetric methods using an autoanalyzer (FlowSys, Alliance-Instruments, Ainring, Germany). Total phosphorus (TP) samples were prepared and stored deep frozen for digestion and analyzed in the laboratory of the Marine Chemistry Department of the Leibniz Institute for Baltic Sea Research (IOW, Germany). The LD of all nutrients in SP was 0.001 µmol L−1. In the SR, the DO concentration, temperature, turbidity, and Chl-a were determined in situ by a multi-parameter EXO2 probe (YSI, Yellow Springs, OH, USA). All the sensors were checked before measuring according to the manufacturer’s manual guidelines [41]. The accuracy of DO, temperature, turbidity, and Chl-a is 0.1 mg L−1, 0.01 °C, 0.01 NTU, and 0.01 µg L−1, respectively. All water samples for nutrients were taken according to the instructions in ‘Water quality—Technical regulation of the preservation and handling of samples’ [42] and subsequently transported to the laboratory. The NH4+, NO3, NO2 and TP concentrations in the water were determined using Nessler’s reagent spectrophotometry [43], ultraviolet spectrophotometry [44], spectrophotometry [45], and ammonium ion molybdate spectrophotometry [46], respectively. The LD of NH4+, NO3, NO2 and TP concentrations in the water was 1.79 µmol L−1, 5.71 µmol L−1, 0.21 µmol L−1, and 0.32 µmol L−1, respectively. All nutrient concentration measurements were performed in duplicate. The water samples at a given depth were collected using IOW Standard CTD (SeaBird 911) and rosette sampling systems in BP and the stratified sampler in SR, respectively. The sampling depths at each station are presented in Table S1.

2.3. Hydrological Data Collection

The water level change in the Bornholm Basin (Station SP5) was provided via OSU TPXO Tidal Models (https://www.tpxo.net/, accessed on 5 July 2023). The water level data at the front of Shuikou Dam were collected from the website of the flood information system in Fujian Province (http://27.156.118.74:18800/web/html/index.html?module=sqxx, accessed on 15 July 2023), which provides hourly water level data.

2.4. Data Analysis

The oxygen change rate (σ) was calculated to assess the degree of oxygen consumption and recovery during the field surveys. It was determined by taking the difference of dissolved oxygen between each field survey (∆DO) and the time intervals between them (∆t) at each station, using the following formula (Equation (1)):
  σ = D O t
The Brunt–Väisälä frequency N of natural waters was calculated to understand their convective state and assess the water stratification of the research areas [47], following Equation (2). For seawater, the N was modified based on both vertical temperature and salinity gradients in the density gradient term (Equation (3)).
  N = g ρ d ρ d z
  N m o d i f i e d = g ρ ρ T d T d z + ρ S d S d z
where g is the gravitational acceleration (m s−2) and was calculated using latitude and water pressure as inputs in the Gibbs Seawater (GSW) Toolbox in MATLAB, ρ is the density (kg m−3) and was calculated based on water pressure, salinity, and temperature, z is the water depth (m), T is the temperature (°C), and S is the salinity. In this study, the Brunt–Väisälä frequency N was expressed in the form of log10[N2 (s−2)]. The log10[N2 (s−2)] values describe the degree of stratification, with higher values indicating greater stratification.

2.5. Statistical Analyses and Graphics

The Brunt–Väisälä frequency N was calculated using MATLAB (R2018a, The MathWorks, Natick, MA, USA). The normality test of Shapiro-Wilks and Levene’s variance homogeneity test were applied to all physicochemical variables. The DO data was not normally distributed. Hence, Spearman correlation coefficients were used to examine the relationships between DO and water quality parameters. Statistical analyses were performed with SPSS 27.0 (SPSS Inc., Chicago, IL, USA). Contour diagrams were produced using Origin 2021 software (OriginLab Corporation, Northampton, MA, USA).

3. Results

3.1. Changes of DO and the Dynamics of Hypoxia

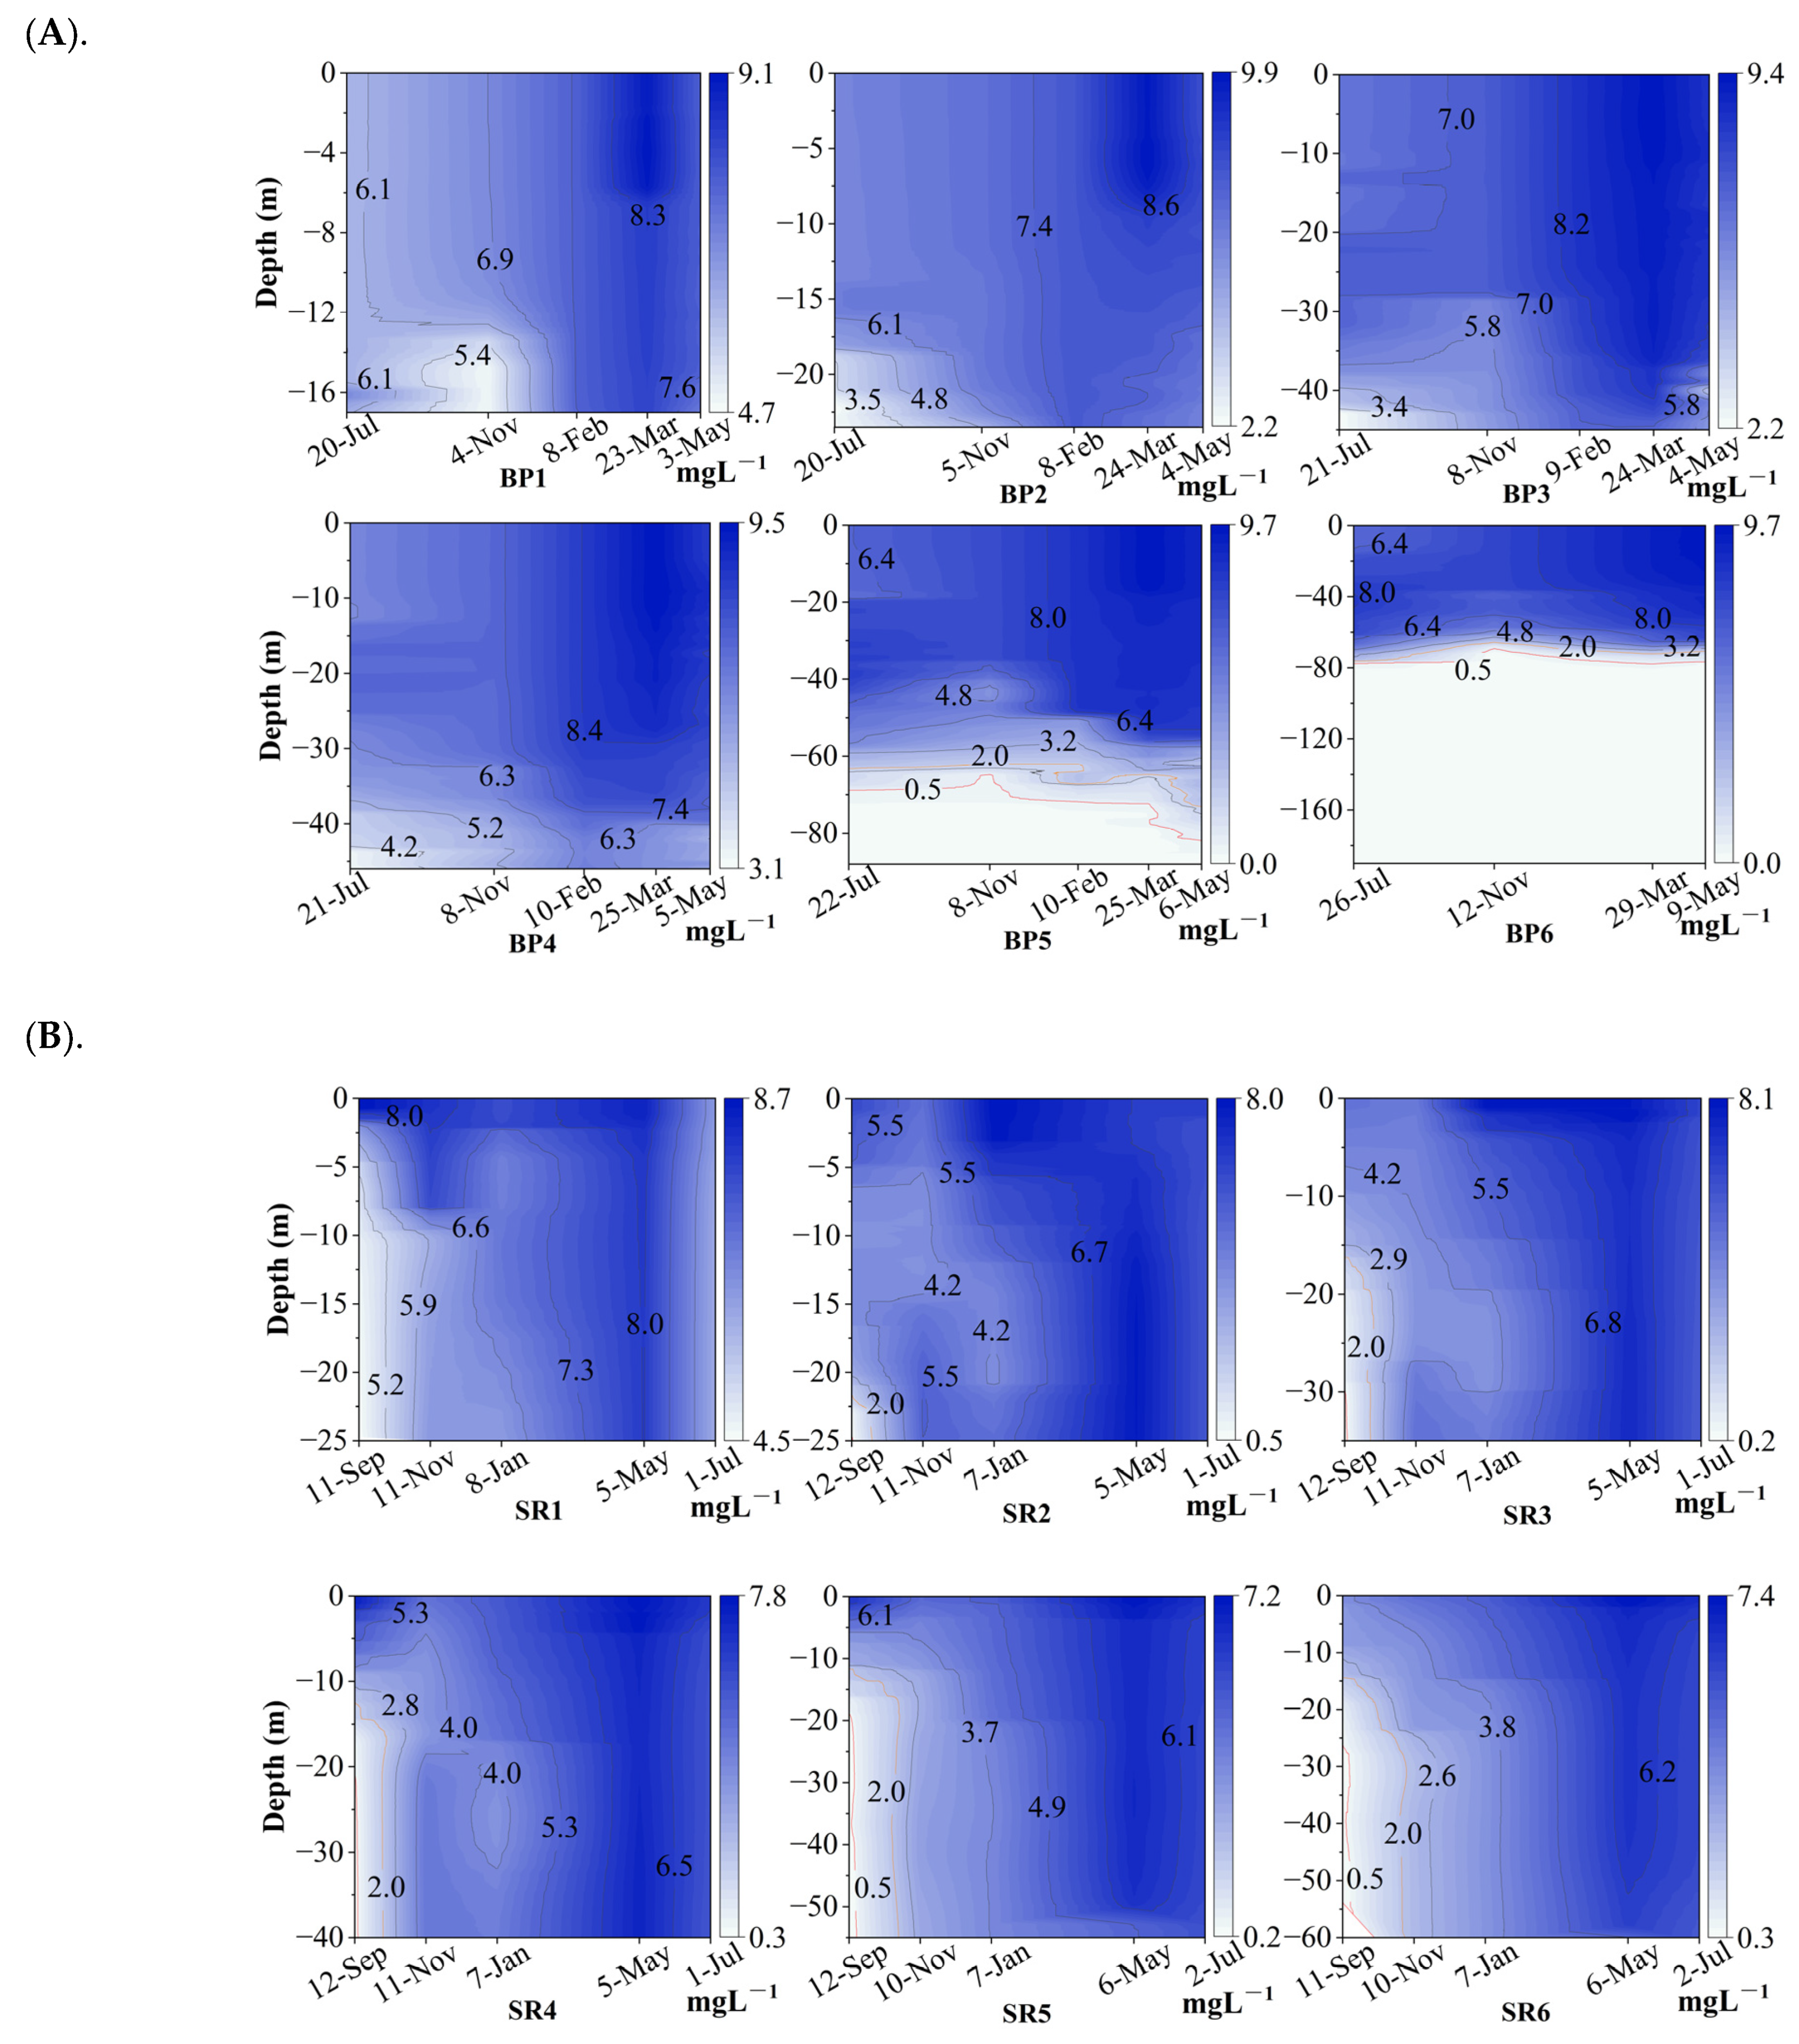
The dissolved oxygen concentrations throughout the entire study were 0–9.9 mg L−1 and 0.3–8.7 mg L−1 in the BP and SR (Figure 2), respectively. During the sampling periods in both regions, the DO increased from summer (i.e., July in BP and September in SR) to winter (i.e., February in BP and January in SR) and then decreased from winter to spring (i.e., May in both regions) following the density and temperature pattern (Figures S2, S3B, and S4A), showing that the DO concentration has a seasonal cycle linked to the temperature cycle. The average rates of oxygen change in BP and SR were −0.016~0.014 mg L−1 d−1 and −0.022~0.018 mg L−1 d−1, respectively (Table S2). The range of the oxygen change rates in BP was lower than that in SR.
In the BP, persistent hypoxia emerged below 63 m in the deeper regions (87–190 m), i.e., BP5-BP6 (see Figure 1), during all sampling periods, in a permanently stratified (Figure 2A). The DO concentrations measured at the entrance of BP (i.e., BP1), ranging from 4.7 mg L−1 to 9.2 mg L−1, indicated favorable oxygen conditions. Nonetheless, the oxygen decreased gradually from station from shallow BP1 (20 m) to slightly deeper BP4 (48 m). Particularly in July, the bottom layer exhibited DO deficiency, with levels decreasing to 2.2 mg L−1, a concentration close to the hypoxia threshold. Furthermore, at the persistently hypoxic stations (BP5 and BP6), the oxygen change rate in the deepest layer remains uniform throughout the year (Table S2, −0.004~0.005 mg L−1 d−1), with oxygen concentrations between 0.0076 and 0.2503 mg L−1 (Table 1).
In the SR, the seasonal hypoxia occurred in September and covered the stations from SR2 to SR6. Unlike hypoxia in the deeper layer below 63 m in BP, the upper layer at 11.5 m depth has already shown low oxygen concentrations. Afterwards, until November, the DO increased gradually, from the lowest DO concentrations of 0.23 mg L−1 in September to 2.33 mg L−1 in November. The highest positive rate of oxygen change for the entire volume and bottom layer was observed from September to November, with values of 0.022 mg L−1 d−1 and 0.048 mg L−1 d−1, respectively (Table S2). Meanwhile, the DO levels at the upstream station SR1 reached concentrations of 4.5~8.7 mg L−1, resembling those at the initial station BP1 in the BP region.

3.2. Contribution of Stratification to the Dynamics of Oxygen

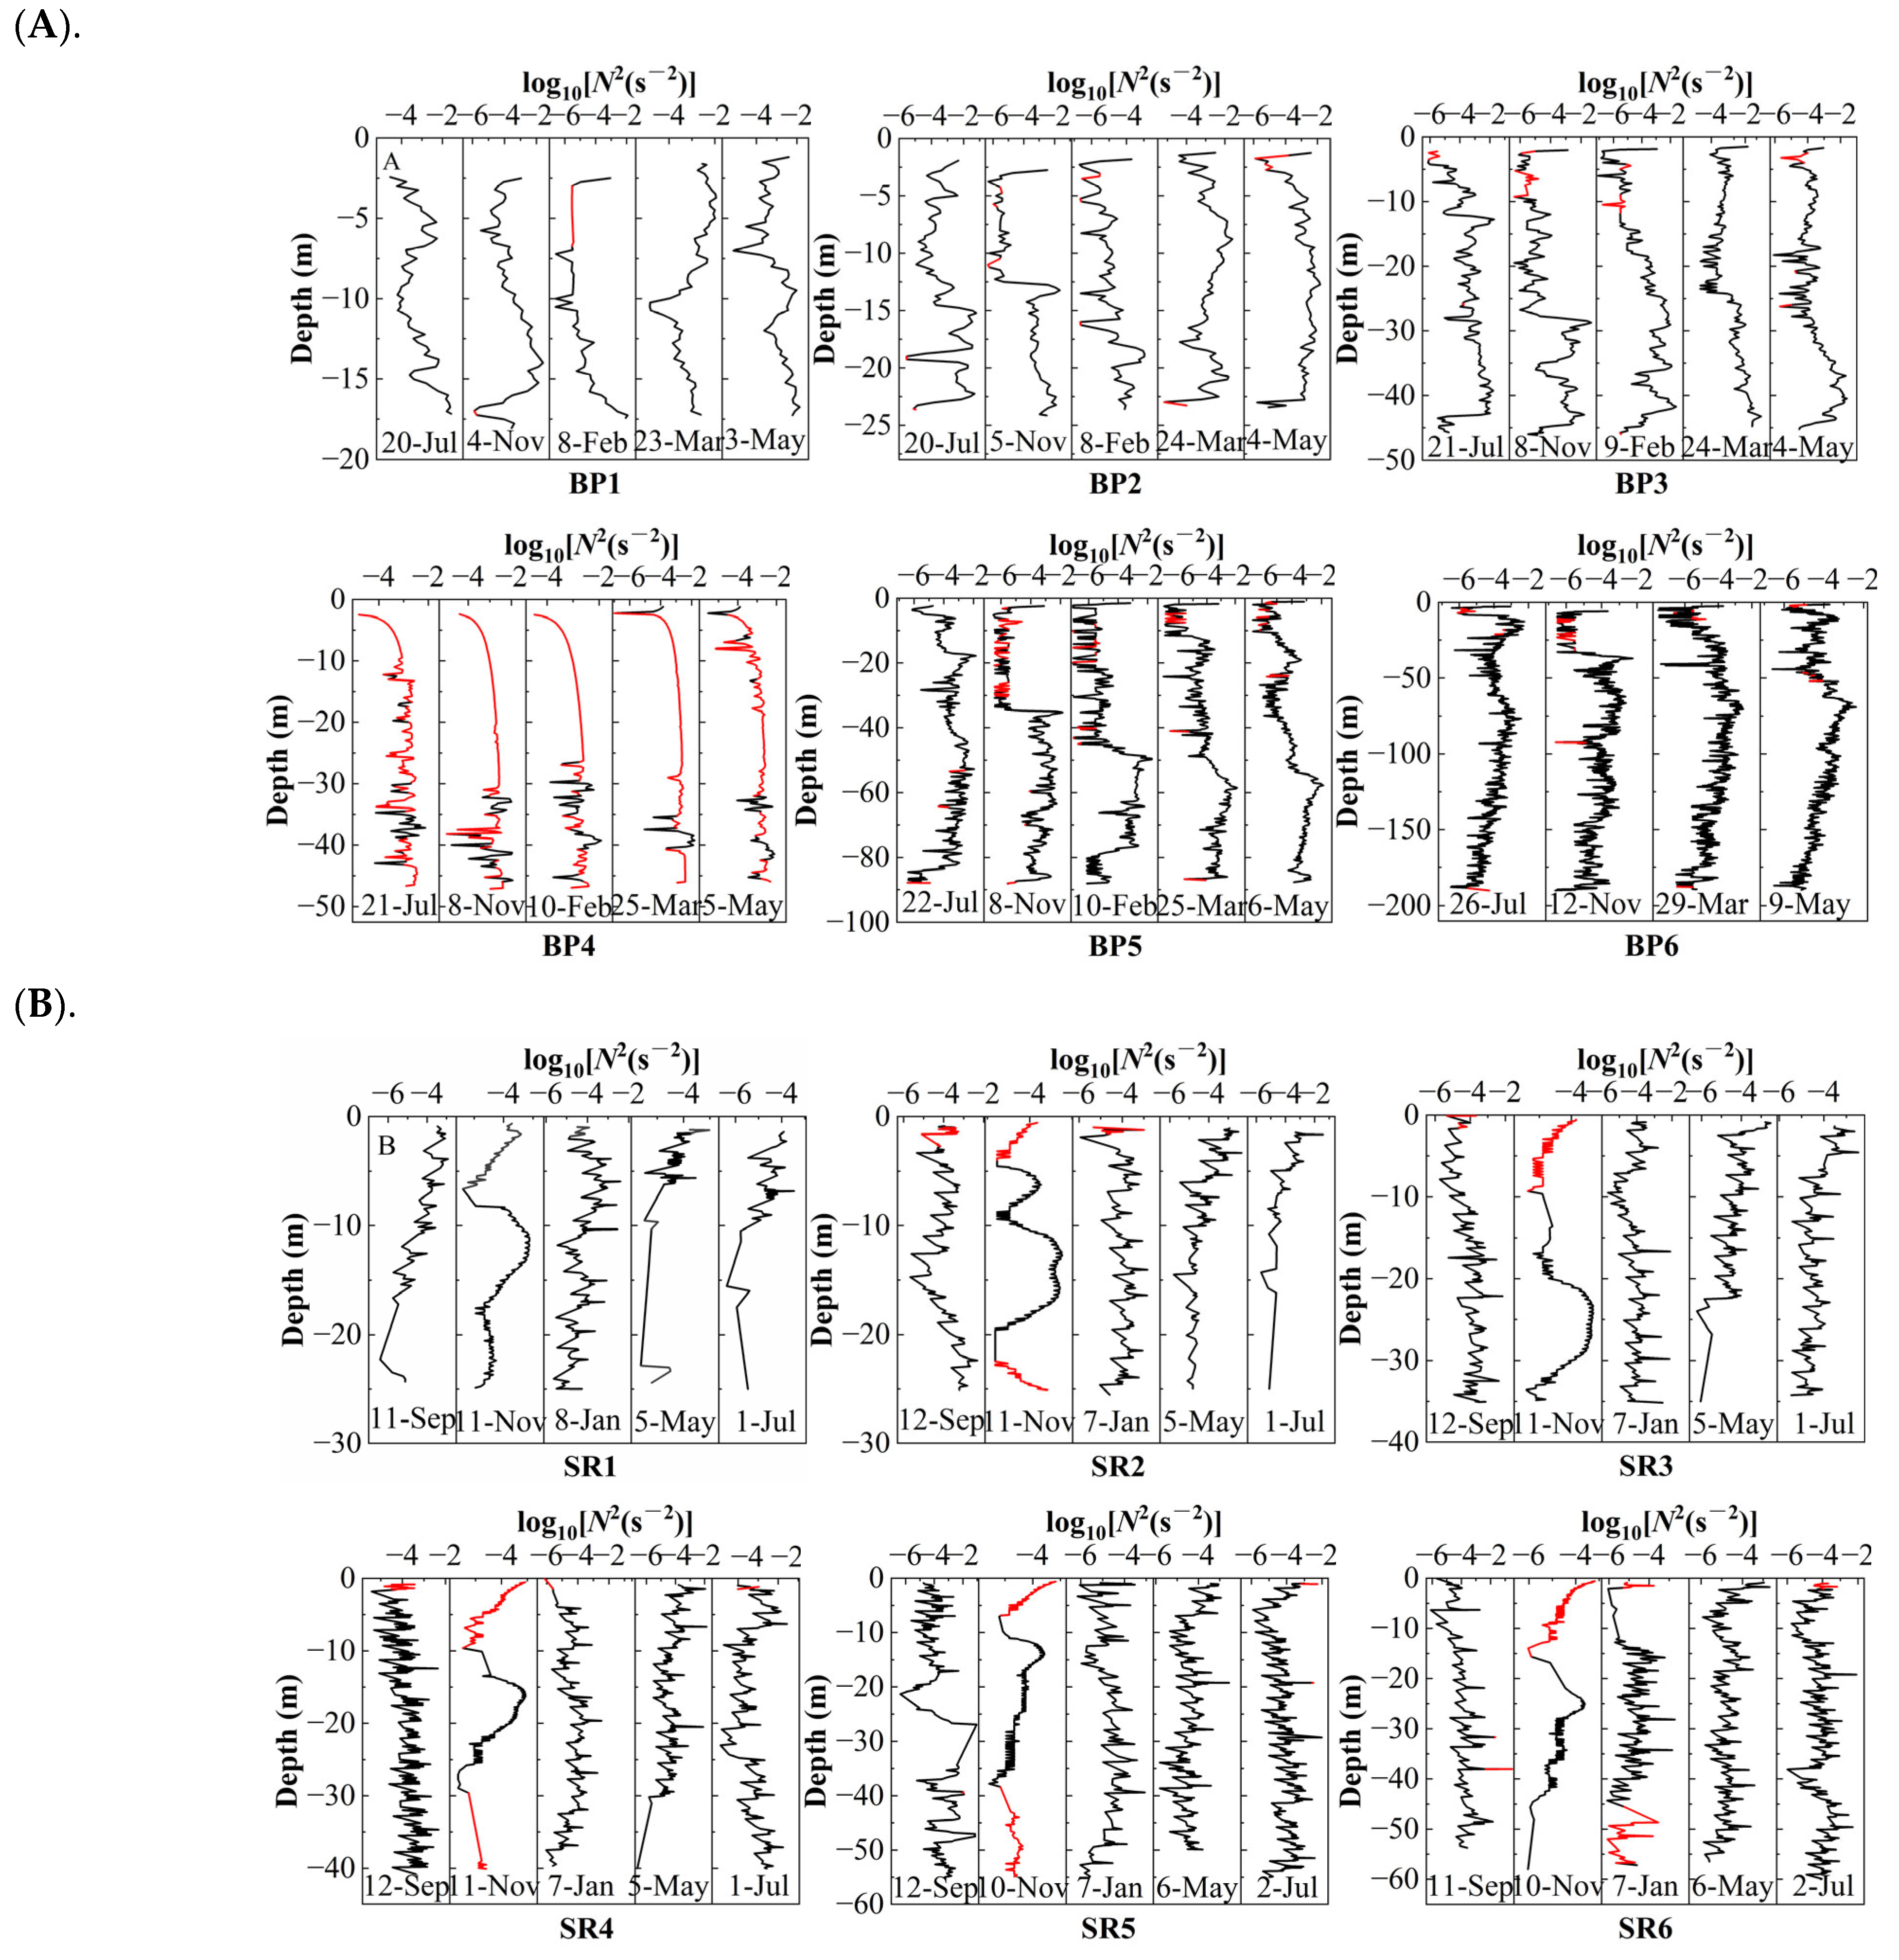
The Brunt–Väisälä frequency was calculated based on the vertical profiles of density (Supplementary Figure S2) and is presented in Figure 3. In the upper part of the profiles at stations BP1-BP4 before Bornholm Island, there was no special reversal point for log10[N2 (s−2)] when no hypoxia occurred. The reversal points for stronger stratification (log10[N2 (s−2)] ≈ −4) occurred at stations BP5 and BP6. Using the depth of the Brunt–Väisälä frequency maximum as the measure of the intensity of stratification [48], the thickness of the mixed layer here increased from approximately 20 m in July to 60–80 m in the following May. At BP4, the Brunt–Väisälä frequency differed notably in comparison to the other BP stations, where unstable conditions were observed (red lines in Figure 3). The results indicated that there was more convective mixing here due to the flow being diverted by Bornholm Island [49,50].
In the SR areas, the highest average values of Brunt–Väisälä were observed in September at the stations SR2 to SR6 (−3.95~−3.64), indicating the strongest stratification. This decreased the water exchange between colder hypolimnetic waters and warmer surface water influenced by atmospheric factors [51]. As a result, hypoxia occurred in the hypolimnetic waters during this month. In November, there were fewer fluctuations in the Brunt-Väisälä frequency compared to other months, allowing for seasonal hypoxia to disappear after September. Moreover, the lake overturn occurred when the temperature began to homogenize, as shown in Supplementary Figure S4A. A previous study indicated that lake overturn generally occurs from late October to mid-November [30].

3.3. Changes in Water Quality Parameters

3.3.1. Water Quality Parameters

Salinity differs between the two study regions. On the one hand, the BP has a salinity between 6.98 and 23.18. In the upper water column of the station, i.e., BP1-BP2, salinity-induced stratification was observed. At stations BP3 to BP6, a vertical salinity gradient was evident (Table 1 and Supplementary Figure S3). On the other hand, the salinity in the SR is close to the detection limit of the salinometer (0.02–0.04) and is similar to freshwater. The temperatures were 3.04–21.26 °C and 14.52~32.58 °C in the BP and SR, respectively (Table 1, and Figures S2 and S3). Although the temperature ranges differed, both regions exhibited the same seasonal pattern of an initial temperature decrease, followed by an increase during the sampling periods. During the initial sampling conducted in July in BP and in September in SR, clear vertical changes in temperature in both regions were seen. The follow-up surveys held in November revealed a substantial reduction of the temperature gradients and a decrease in the vertical temperature differences in both regions. The results indicated that the mixed-layer depth increased from July to November in both regions. Moreover, the water quality parameters differed considerably, with the exception of TP. The TP concentration in both regions was similar (0.37–9.21 µmol L−1 in BP and 0.09–12.8 µmol L−1 in SR). Turbidity and Chl-a concentration ranged from the limit of detection to 2.86 NTU and from 0.15 to 5.17 µg L−1 in BP, and from 0.05 to 29.65 NTU and from the limit of detection to 42.32 µg L−1 in SR. The concentrations of the main N species (NH4+, NO3, and NO2) in the BP region were 1–2 orders of magnitude lower than those in the SR region.

3.3.2. Contribution of Water Quality Parameters to DO

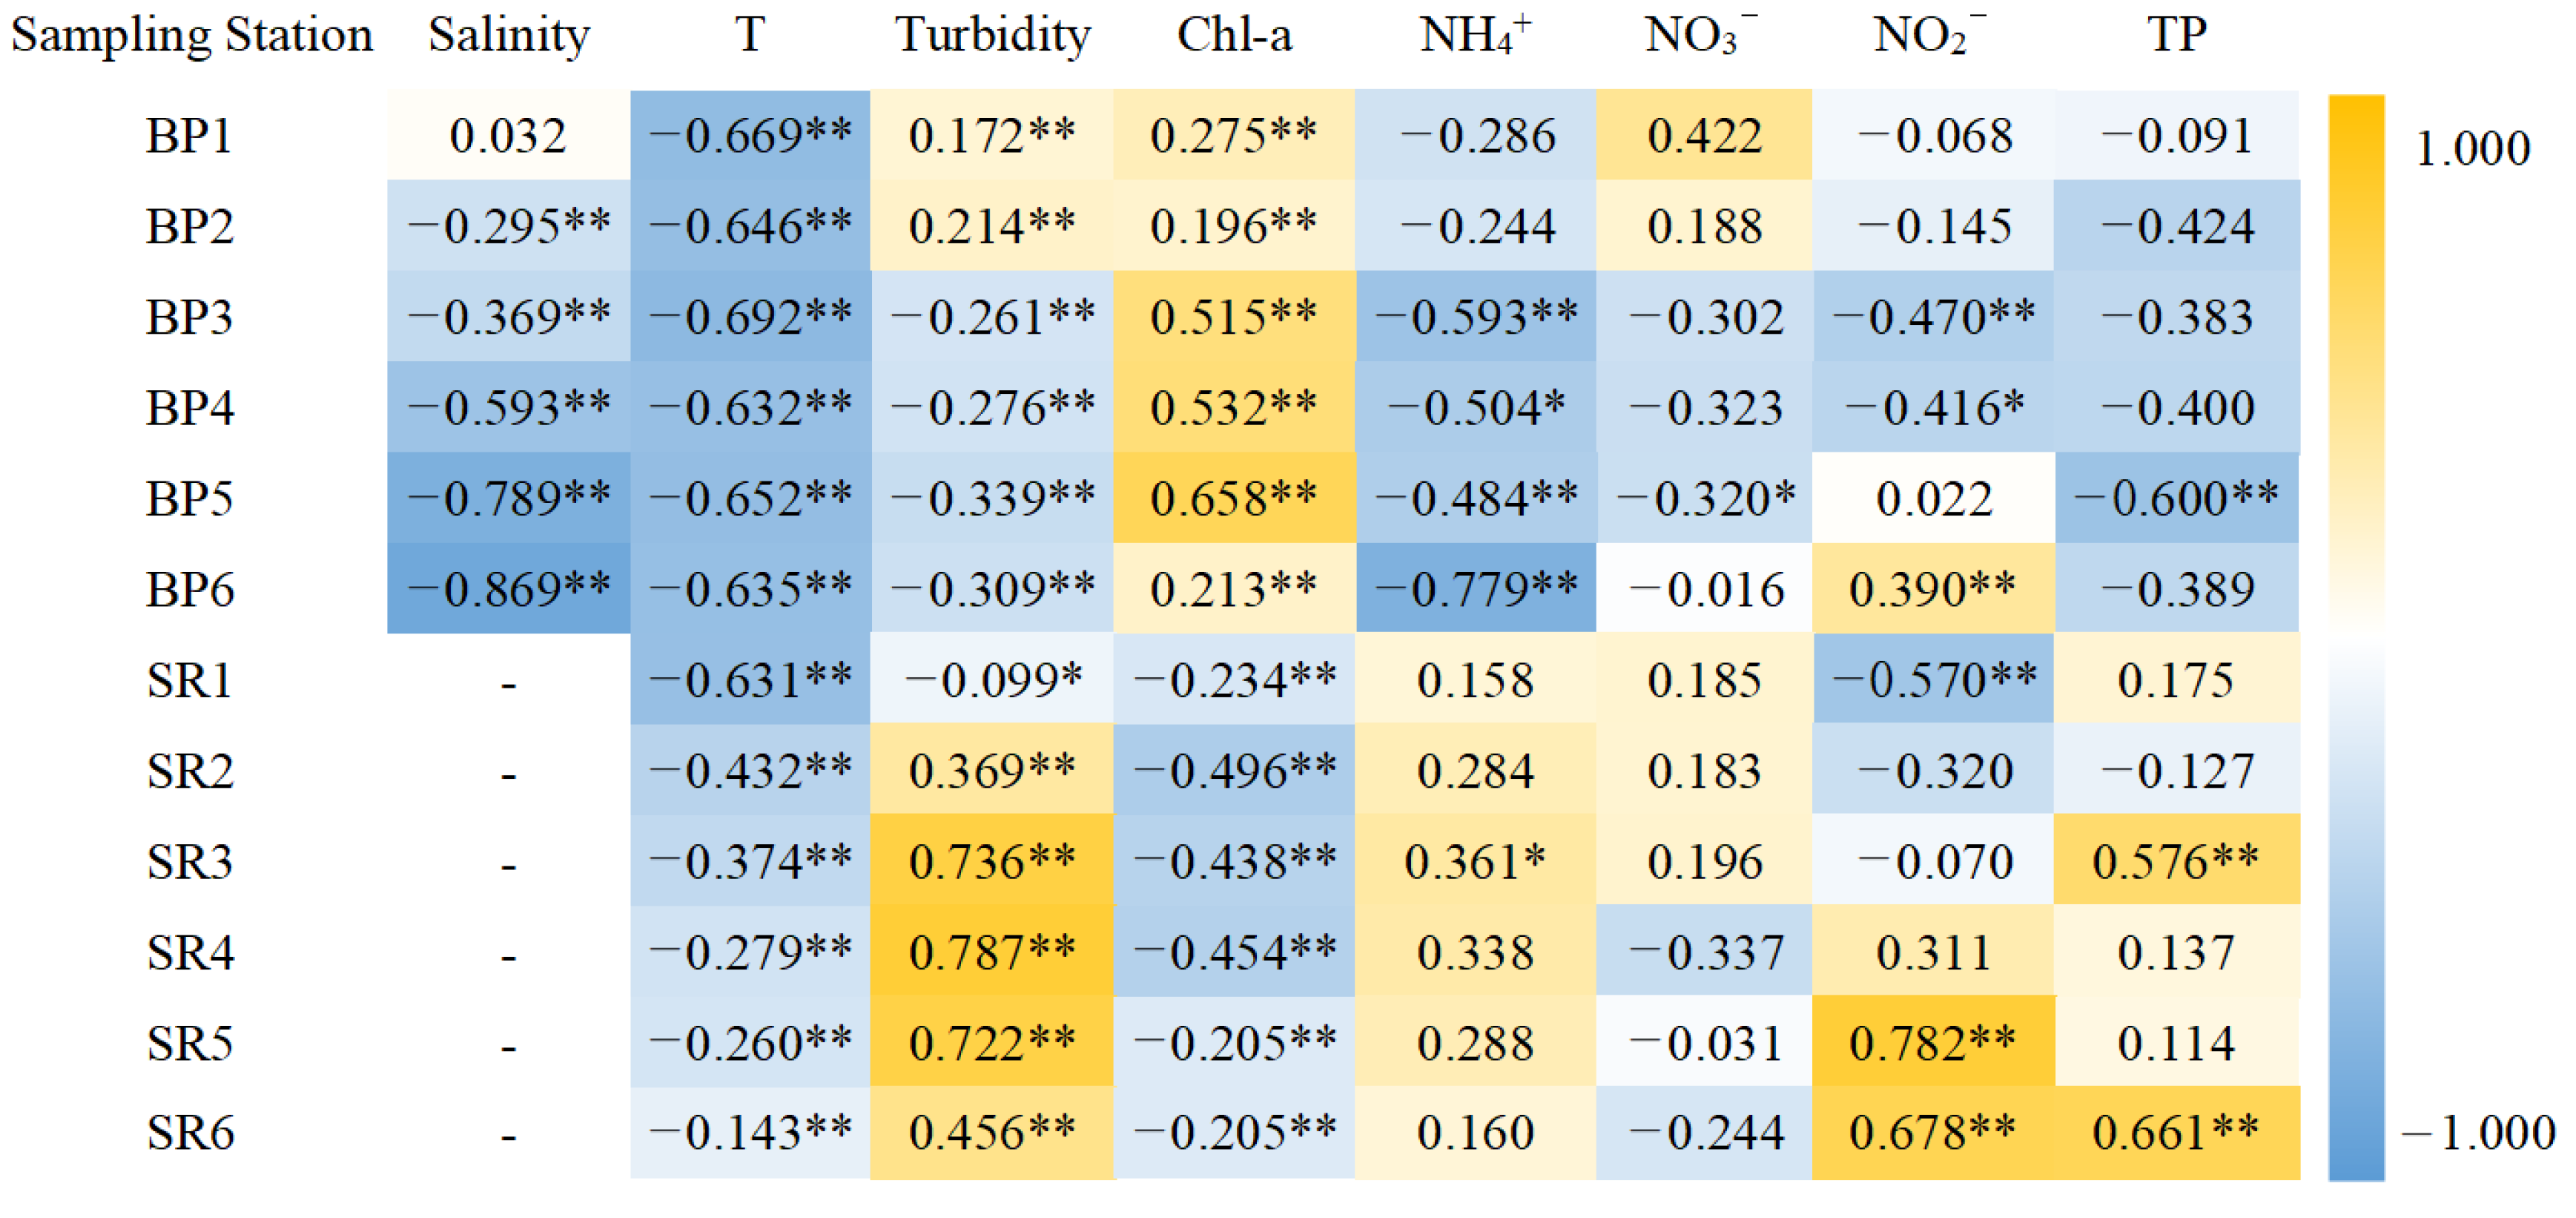
The Spearman’s correlation analysis for DO and water quality metrics is shown in Figure 4. In the two regions, temperature, turbidity, and Chl-a all exerted significant influence on the DO concentration (all p-value < 0.01 except for station SR1, p-value < 0.05 for turbidity, Figure 4). In detail, DO was significantly negatively related to temperature (p-value < 0.01); however, there are notable differences in the impact of turbidity and Chl-a between the two regions. The correlation between turbidity and DO was significantly positive at BP1 and BP2. However, it turned negative from BP3 to BP6. The correlation between the parameters in SR changed from negative to positive from upstream to downstream. Moreover, contradictory conclusions regarding the relationship between Chl-a and DO were also found in the two regions. There was a positive correlation between Chl-a and DO in BP, but a negative correlation in SR. Furthermore, the impact of nutrients (i.e., NH4+, NO3, NO2, and TP) on the DO appeared to be insignificant and erratic, with only a few sampling sites showing a significant relationship. The relationship between DO and water quality parameters in different layers is shown in Figure S5. The division of the water body into layers was determined by the overall water depth and the depth of hypoxia occurrence. The surface layer (0–11.5 m), the middle layer (BP: 11.5–63 m, SR: 11.5–30 m), and the bottom layer (BP: >63 m, SR: >30 m) were thus delineated. The findings revealed that the effects of salinity, temperature, turbidity, and Chl-a across different layers were almost consistent with those observed at different sampling stations. In the surface and middle layers of both regions, the nitrogen speciation exhibited a strong correlation with DO changes, and in the bottom layers of BP, a significant relationship was observed between TP and DO.
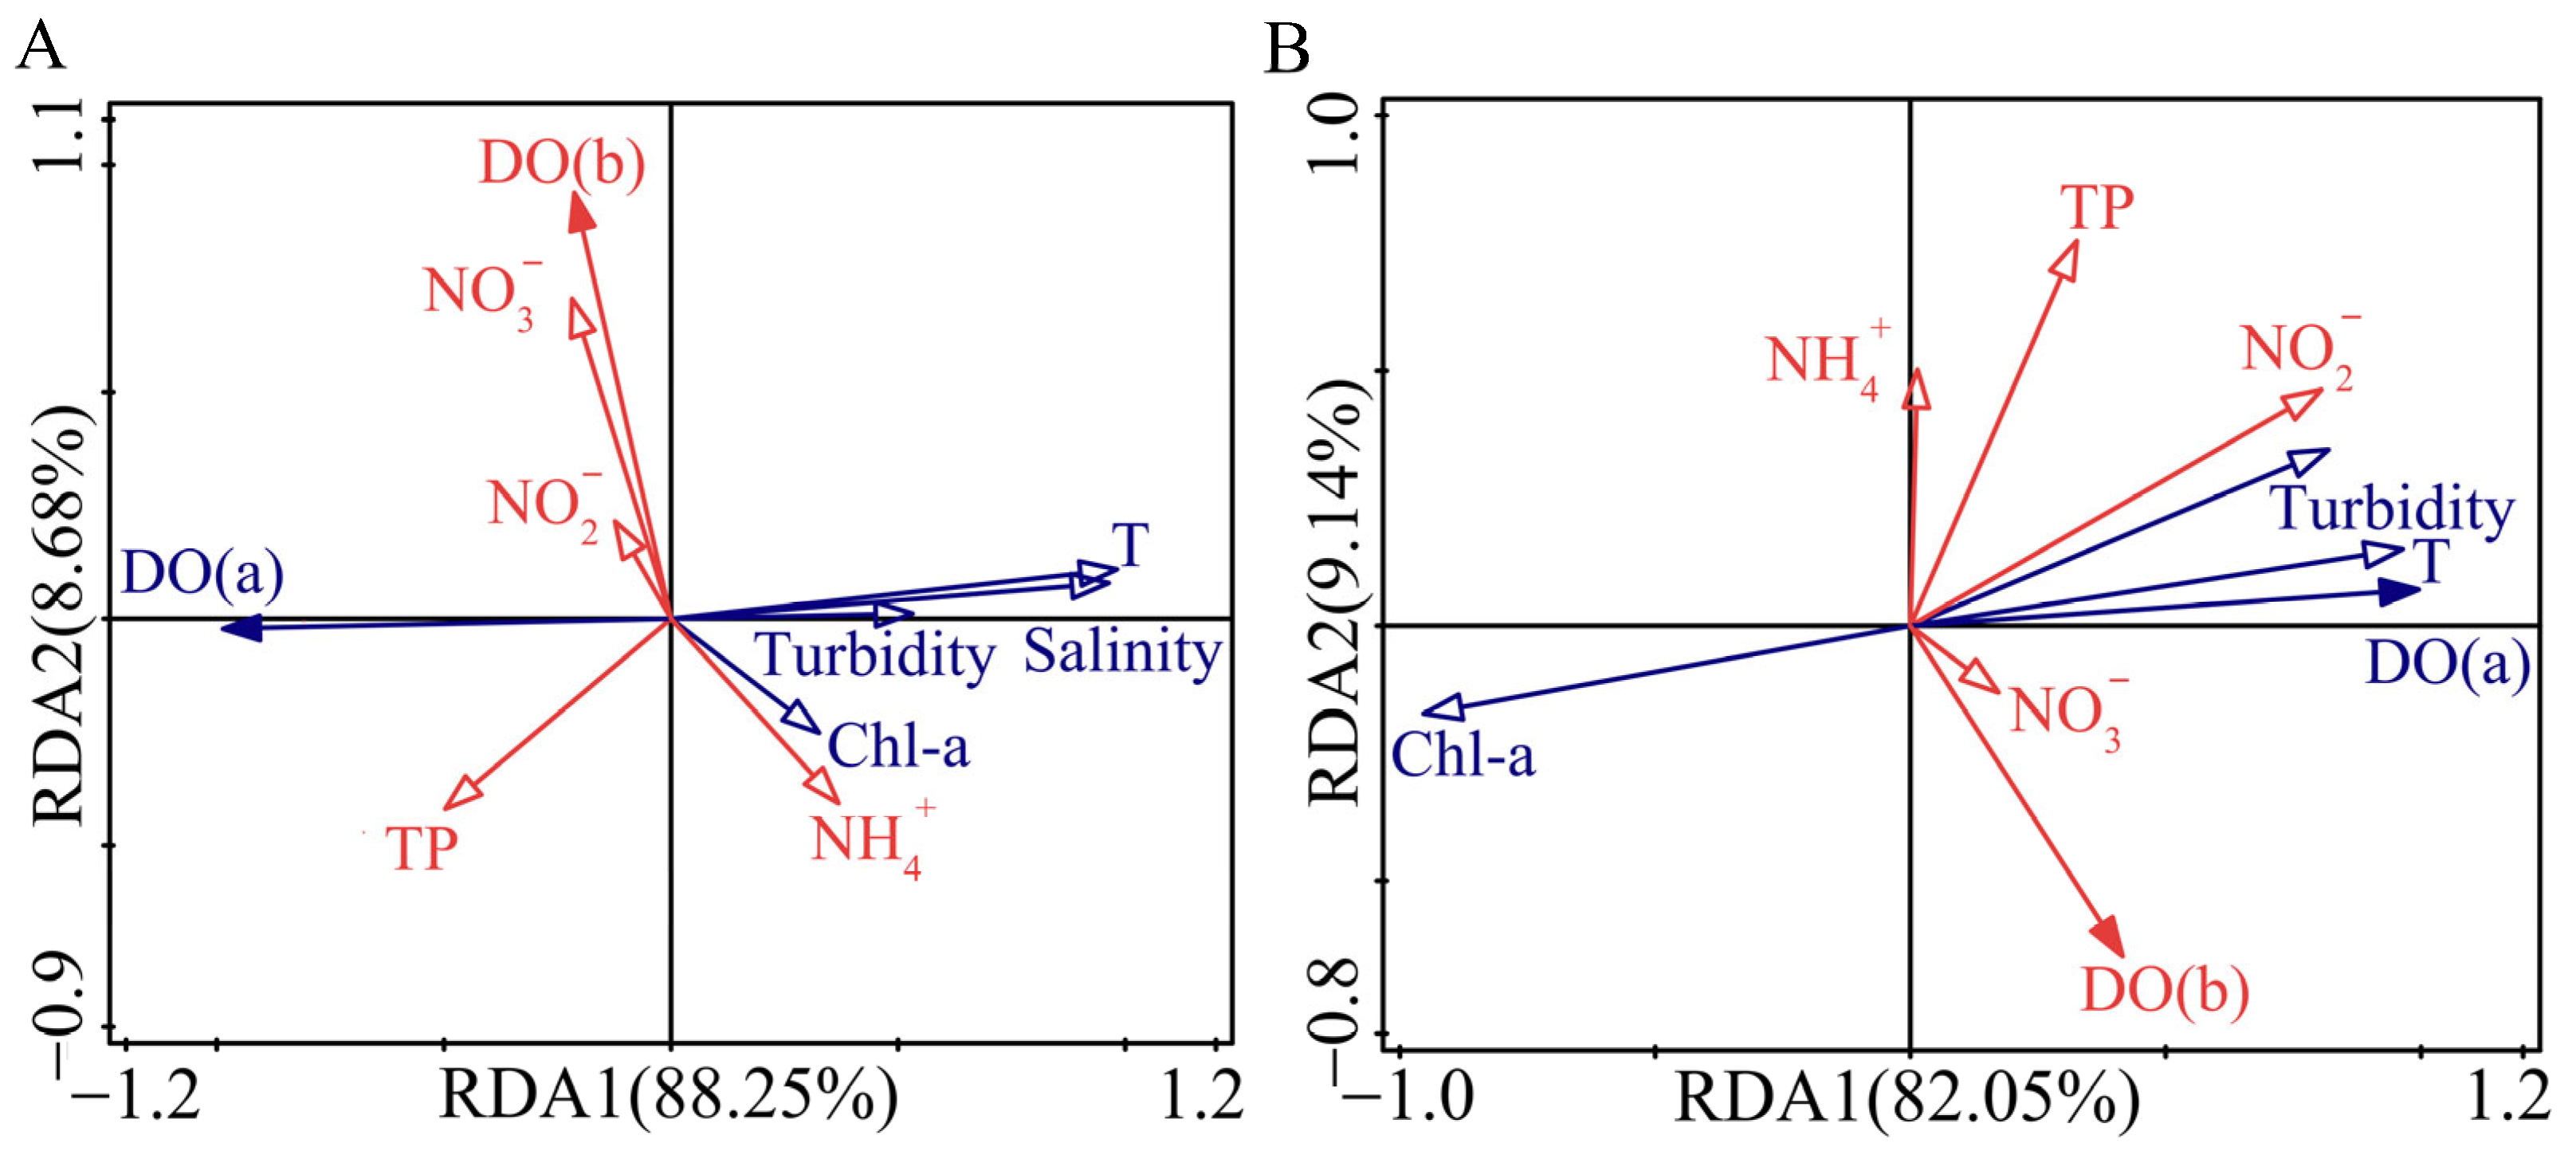
Redundancy analysis (RDA) was used to determine the response of DO to water quality parameters under hypoxic conditions. As illustrated in Figure 5, RDA explained 96.93% and 91.19% of the variation in changes in water quality parameters in the BP and SR, respectively. Under hypoxic conditions, the lower DO impacted the transformations of nitrogen species NH4+ and NO3 by influencing the oxidation state in the nitrogen cycle. NH4+ was positively related to DO while NO3 showed a negative relationship. The relationship between DO and TP was not significant. In addition, temperature and turbidity, which exhibited variation between the two research areas (Table S3), were found to exert an influence on DO variations. However, it is noteworthy that the impact of temperature and turbidity on DO changes under hypoxic conditions exhibited a completely opposite effect in BP and SR.

4. Discussion

4.1. Contributing Factors to Seasonal DO Changes

In this study, in both regions, the same seasonal pattern of DO dynamics was found. The results indicated that the oxygenation and deoxygenation of the water column occur naturally. Temperature, turbidity, and Chl-a were found to be more closely associated with the seasonal DO variations than nitrogen and phosphorus. DO was significantly negatively related to water temperature, since high temperatures lead to reduced DO solubility in water [5,52]. Surprisingly, it was found that turbidity and Chl-a in the investigated regions showed opposite effects on the changes in DO. Evidence indicated the presence of elevated levels of turbidity in water bodies that had undergone considerable de-stratification, which also resulted in an improvement in DO levels. Consequently, a positive correlation between turbidity and DO was observed [53]. While in BP3-BP5, the impact of Major Baltic Inflows (MBIs) was limited and turbidity levels were comparatively low due to the sedimentation of suspensions and their deposition, thereby resulting in the observed negative correlation. While in SR1, the highest turbidity has been observed to impede the penetration of sunlight, thereby diminishing photosynthesis and exerting a deleterious influence on dissolved oxygen levels [54]. In fact, the inconsistent effect of Chl-a on DO changes was also observed in the Panjiakou Reservoir [55]. The effect of Chl-a on DO is dependent on the level of Chl-a. In this study, Chl-a concentrations were 0.15–5.17 µg L−1 for BP and LD−42.32 µg L−1 for SR. In BP, phytoplankton photosynthesis is stronger than respiration, resulting in the production of oxygen in the upper water column (≤2 m) [56]. In SR, the relationship between DO and Chl-a is different due to the higher concentration of Chl-a, which revealed the occurrence of hypertrophic conditions in the water [57].
With regard to the oxygen dynamics in different layers, it has been demonstrated that there is a bias in the nitrogen speciation and TP with respect to DO. In both regions, strong correlations were seen between nitrogen speciation and alterations in oxygen levels in the surface and middle layers. These alterations were attributed to algal photosynthesis and the cycling of inorganic nitrogen [58]. A significant correlation has been observed between the competition for nitrogen by algae and the fluctuations in DO [59]. In the bottom layers of BP, in which hypoxia occurred, a significant relationship was observed between TP and DO. This relationship was also confirmed through the analysis of decadal records of both hypoxia intensity and iron-phosphorus cycling [60].

4.2. Contributing Factors for Hypoxia

Persistent hypoxia conditions were found below 63 m depth in the BP (i.e., at stations BP5 and BP6), where the stratification has been increasing since the last half century [61,62]. The stability of the water column in the Baltic Sea [63] results from the combination of salinity and temperature conditions. The elevated salinity levels linked to MBIs in the cooler months of November and February suggested the presence of oxygen-rich water. As it sank into the deeper layers of BP5, there was an enhancement in deepwater oxygenation and a strengthening of the stratification, as evidenced by the increased Brunt–Väisälä frequency. However, the oxygen conditions at depth remain unchanged in BP6, since the MBIs did not extend as far. Löptien et al. also established that the efficacy of MBIs was not directly associated with the re-oxygenation of the deep Baltic Sea [64]. In SR, the seasonal hypoxia occurred in September, coinciding with the typical summer thermal stratification in lakes [29,31]. Although hypoxia varied, the Brunt–Väisälä frequency in both regions consistently displayed the highest values under hypoxic conditions. In November and July in SR, the presence of hypoxia was not detected, and the depth profiles of Brunt–Väisälä frequency indicated well-mixed conditions. This indicated that the reservoir was well-mixed and stratification was the main contributing factor to the development of seasonal hypoxia.
Temperature and turbidity showed the opposite impacts on DO changes under hypoxic conditions in the investigated regions. In BP, the increased temperature exerted a negative effect on DO in the deeper layers, which may be related to the synergistic effect involving solubility and respiration [65]. As the hypoxia in BP occurred in deeper layers, where photosynthesis is reduced due to decreased light penetration, the deoxygenation is controlled by biological respiration [5]. Mineralization of organic matter, both in the water column and sediments, was identified as the primary driver of oxygen consumption in the central Baltic Sea [36]. Moreover, the reduction and oxidation of nitrogen, sulfur, manganese, and iron species have been demonstrated to play a significant role in oxygen equilibrium in such systems [66,67]. While in SR, the solubility losses induced by increasing temperature did not explain the positive relationship between temperature and DO [68,69]. Compared to the low temperature (5.37~10.14 °C) and low turbidity (LD~1.21 NTU) found in the BP hypoxic area, the seasonal temperature and turbidity in SR were 25.52~31.80 °C and 0.07~6.02 NTU at the time of hypoxia, respectively (Table S3). Organisms such as zebra mussels, acclimated to warmer climates, could dramatically reduce oxygen consumption because of increasing turbidity [70], allowing the net photosynthetic oxygen production at high temperature to outweigh the stratification-induced deoxygenation and in the end lead to an increase in dissolved oxygen levels [26,71].
Furthermore, the concentrations of DO played a crucial role in the variations of NO3 and NH4+ under hypoxic conditions, because denitrification dominates the nitrogen loss pathway under low oxygen, leading to a decrease of NO3. Additionally, the increase in the dissimilatory nitrate/nitrite reduction to ammonium process also mediated the concentrations of NO3 and NH4+ [72]. The increase in NH4+ may also be caused by the NH4+ release from sediments under hypoxic conditions, described in earlier studies [36,73]. In addition, over the past 30 years, the increase of hypoxia in the deep water of BP was linked to the oxidation of the remaining NH4+ and H2S [58]. Under hypoxic conditions, H2S can be produced through sulfate reduction, subsequently oxidized to sulfur and then to sulfate by either O2 or NO3 [36,74].

4.3. Hypoxia Management, Limitations, and Future Research

Hypoxia can occur in various types of water systems and exhibit distinct characteristics. To manage or prevent the occurrence of hypoxia, it is essential to implement a continuous reduction in nutrient load. Furthermore, the implementation of artificial oxygenation has been explored to effectively mitigate the low-oxygen effect in a short time. In the Baltic Deepwater Oxygenation Project, the implementation of pumped injection of winter water into the deeper parts of the Bornholm Sea led to an enhancement in oxygen levels [75]. In reservoirs [76], the implementation of a pump and injection technique to introduce surface oxygen-rich water and air into the hypoxic water layer has been demonstrated to enhance oxygen levels [77,78].
Understanding the oxygen dynamics in aquatic systems, both in the World Ocean and inland waters, is important for comprehending hypoxia worldwide. No direct comparison between these two different aquatic systems is possible even though they have the hypoxia phenomenon in common. Contradictions were found regarding the effect of temperature and turbidity, as well as the importance of NO3 and NH4+ in response to hypoxia in the two regions. Further exploration is needed to understand these contradictions and the effect of nitrogen to prevent or alleviate hypoxia worldwide. In addition, the shallower water bodies, characterized by a preponderance of anthropogenic activities, usually suffer episodic hypoxia and are of interest.

5. Conclusions

This study revealed the factors contributing to DO changes and the occurrence of hypoxic areas in both investigated regions. The entire dynamics of DO demonstrated a seasonal cycle, exhibiting a negative correlation with temperature in both regions. Differently, in the BP region, persistent hypoxia was observed below 63 m at stations BP5 and BP6, while seasonal hypoxia occurred in the lower part of SR in September, below 11.5 m. The higher Brunt–Väisälä frequency (log10[N2 (s−2)] ≈ −4) indicated greater stratification in both regions, which was a sign of the development and occurrence of hypoxia. For the seasonal pattern of DO, the relationship of salinity, temperature, turbidity, and Chl-a outweighed that of nitrogen and phosphorus. However, regarding the different hypoxia types occurring in the BP and SR, the impacts of temperature and turbidity on the DO were completely opposite. The low DO in SR occurred under elevated temperature and turbidity. This phenomenon may be attributed to the net photosynthetic oxygen production of organisms in SR. Moreover, the concentrations of NO3 and NH4+ significantly depended on DO changes. Our findings highlight that the stratification index and water quality parameters are essential to understanding the oxygen dynamics. This knowledge is essential to provide a scientific basis to elucidate seasonal changes in oxygen dynamics across various water bodies and understand physicochemical responses to the oxygen variations, thereby informing management strategies aimed at improving oxygen conditions in both oceans and inland waters.

Supplementary Materials

The following supporting information can be downloaded at: https://www.mdpi.com/article/10.3390/oceans6030054/s1, Table S1: Sampling depths for determining physicochemical indicators in the two comparative research areas; Table S2: Rates of oxygen change in the whole volume and the deepest layers in the two comparative research areas; Table S3: Variations of water quality parameters under hypoxic conditions in the two comparative research areas; Figure S1: Variations of water levels in the two research areas: (A) Baltic Proper, Europe (B) Shuikou Reservoir, China; Figure S2: Spatiotemporal distribution of density in the two research areas: (A) Baltic Proper, Europe (B) Shuikou Reservoir, China; Figure S3: Spatiotemporal distribution of water quality indices in the Baltic Proper, Europe; Figure S4: Spatiotemporal distribution of water quality indices in the Shuikou Reservoir, China; Figure S5: Spearman correlation analysis for DO and water quality indices in different layers of the research areas.

Author Contributions

Conceptualization, J.J.W., C.S. and R.X.; methodology, J.-P.P.; software, J.-P.P., investigation, J.C.; resources, C.S.; data curation, J.K., O.B.-P., J.L. and L.C.; writing—original draft preparation, J.W.; writing—review and editing, J.J.W., J.K., O.B.-P. and R.X.; visualization, J.W., supervision, R.X.; funding acquisition, J.C., J.L., L.C. and R.X. All authors have read and agreed to the published version of the manuscript.

Funding

This work was partially supported by the project for the Public Welfare Research Institute in Fujian (2023R1014001) and the National Natural Science Foundation of China (42007343).

Data Availability Statement

The data presented in this study are available on request from the corresponding author.

Acknowledgments

I extend my appreciation and thanks to my co-workers who contributed to the field surveys. The authors thank the IOW and BSH (Germany) for the funding provided during the collection of the monitoring and long-term observational data, as well as all the scientists and technicians involved in the various cruises and the ship crews for their technical support.

Conflicts of Interest

The authors declare that they have no known competing financial interests or personal relationships that could have appeared to influence the work reported in this paper.

References

  1. Levin, L.A.; Ekau, W.; Gooday, A.J.; Jorissen, F.; Middelburg, J.J.; Naqvi, S.W.A.; Neira1, C.; Rabalais, N.N.; Zhang, J. Effects of natural and human-induced hypoxia on coastal benthos. Biogeosciences 2009, 6, 2063–2098. [Google Scholar] [CrossRef]
  2. Rabalais, N.N.; Turner, R.E.; Wiseman, W.J., Jr. Gulf of Mexico hypoxia, a.k.a. “the dead zone”. Annu. Rev. Ecol. Syst. 2002, 33, 235–263. [Google Scholar] [CrossRef]
  3. Watson, A.J. Oceans on the edge of anoxia. Science 2016, 354, 1529–1530. [Google Scholar] [CrossRef]
  4. Deeds, J.; Amirbahman, A.; Norton, S.A.; Suitor, D.G.; Bacon, L.C. Predicting anoxia in low-nutrient temperate lakes. Ecol. Appl. 2021, 31, e2361. [Google Scholar] [CrossRef]
  5. Wei, Q.; Xue, L.; Yao, Q.; Wang, B.; Yu, Z. Oxygen decline in a temperate marginal sea: Contribution of warming and eutrophication. Sci. Total Environ. 2021, 757, 143227. [Google Scholar] [CrossRef] [PubMed]
  6. Schmidtko, S.; Stramma, L.; Visbeck, M. Decline in global oceanic oxygen content during the past five decades. Nature 2017, 542, 335–339. [Google Scholar] [CrossRef] [PubMed]
  7. Diaz, R.J.; Rosenberg, R. Marine benthic hypoxia: A review of its ecological effects and the behavioural responses of benthic macrofauna. Oceanogr. Mar. Biol. 1995, 33, 245–303. [Google Scholar]
  8. Gray, J.S.; Wu, R.S.S.; Or, Y.Y. Effects of hypoxia and organic enrichment on the coastal marine environment. Mar. Ecol. Prog. Ser. 2002, 238, 249–279. [Google Scholar] [CrossRef]
  9. Vaquer-Suner, R.; Duarte, C.M. Temperature effects on thresholds of hypoxia for marine benthic organisms. Glob. Change Biol. 2011, 17, 1788–1797. [Google Scholar] [CrossRef]
  10. Lukas, J.; Auer, F.; Goldhammer, T.; Krause, J.; Romanczuk, P.; Klamser, P.P.; Arias-Rodriguez, L.; Bierbach, D. Diurnal changes in hypoxia shape predator-prey interaction in a bird-fish system. Front. Ecol. Evol. 2021, 9, 619193. [Google Scholar] [CrossRef]
  11. Zillén, L.; Conley, D.J.; Andrén, T.; Andrén, E.; Björck, S. Past occurrences of hypoxia in the Baltic Sea and the role of climate variability, environmental change and human impact. Earth-Sci. Rev. 2008, 91, 77–92. [Google Scholar] [CrossRef]
  12. Diaz, R.J.; Rosenberg, R. Spreading dead zones and consequences for marine ecosystems. Science 2008, 321, 926–929. [Google Scholar] [CrossRef]
  13. Rixen, T.; Cowie, G.; Gaye, B.; Goes, J.; do Rosário Gomes, H.; Hood, R.R.; Lachkar, Z.; Schmidt, H.; Segschneider, J.; Singh, A. Reviews and syntheses: Present, past, and future of the oxygen minimum zone in the northern Indian Ocean. Biogeosciences 2020, 17, 6051–6080. [Google Scholar] [CrossRef]
  14. Zhang, Y.; Fu, H.; Liao, H.; Chen, H.; Liu, Z. Geochemical records of Lake Erhai (South-Western China) reveal the anthropogenically-induced intensification of hypolimnetic anoxia in monomictic lakes. Environ. Pollut. 2022, 299, 118909. [Google Scholar] [CrossRef]
  15. Diaz, R.J. Overview of Hypoxia around the World. J. Environ. Qual. 2001, 30, 275–281. [Google Scholar] [CrossRef] [PubMed]
  16. Glenn, S.; Arnone, R.; Bergmann, T.; Bissett, W.P.; Crowley, M.; Cullen, J.; Gryzmski, J.; Haidvogel, D.; Kohut, J.; Moline, M.; et al. Biogeochemical impact of summertime coastal upwelling on the New Jersey Shelf. J. Geophys. Res.-Ocean. 2004, 109, C12S02. [Google Scholar] [CrossRef]
  17. Turner, R.E.; Rabalais, N.N.; Swenson, E.M.; Kasprzak, M.; Romaire, T. Summer hypoxia in the northern Gulf of Mexico and its prediction from 1978 to 1995. Mar. Environ. Res. 2005, 59, 65–77. [Google Scholar] [CrossRef]
  18. Kasai, A.; Yamada, T.; Takeda, H. Flow structure and hypoxia in Hiuchi-nada, Seto Inland Sea, Japan. Estuar. Coast. Shelf Sci. 2007, 71, 210–217. [Google Scholar] [CrossRef]
  19. Liu, J.; Zang, J.; Ran, X.; Zhao, C.; Hua, J.; Jing, X. Sedimentary phosphorus speciation in the coastal hypoxic area of Changjiang estuary and its environmental significance. Huan Jing Ke Xue 2017, 38, 3243–3253. (In Chinese) [Google Scholar] [PubMed]
  20. Richirt, J.; Riedel, B.; Mouret, A.; Schweizer, M.; Langlet, D.; Seitaj, D.; Meysman, F.J.R.; Slomp, C.P.; Jorissen, F.J. Foraminiferal community response to seasonal anoxia in Lake Grevelingen (the Netherlands). Biogeosciences 2020, 17, 1415–1435. [Google Scholar] [CrossRef]
  21. Breitburg, D.; Levin, L.A.; Oschlies, A.; Gregoire, M.; Chavez, F.P.; Conley, D.J.; Garcon, V.; Gilbert, D.; Gutierrez, D.; Isensee, K.; et al. Declining oxygen in the global ocean and coastal waters. Science 2018, 359, 46. [Google Scholar] [CrossRef]
  22. Canadell, J.G.; Monteiro, P.M.S.; Costa, M.H.; Cunha, L.C.; Cox, P.M.; Eliseev, A.V.; Henson, S.; Ishii, M.; Jaccard, S.; Koven, C.; et al. Global Carbon and other Biogeochemical Cycles and Feedbacks. In Climate Change 2021: The Physical Science Basis. Contribution of Working Group I to the Sixth Assessment Report of the Intergovernmental Panel on Climate Change; Cambridge University Press: Cambridge, UK; New York, NY, USA, 2021; pp. 673–816. [Google Scholar]
  23. Rabalais, N.N.; Turner, R.E.; Sen Gupta, B.K.; Boesch, D.F.; Chapman, P.; Murrell, M.C. Characterization and long-term trends of hypoxia in the northern Gulf of Mexico: Does the science support the action plan? Estuaries Coasts 2007, 30, 753–772. [Google Scholar] [CrossRef]
  24. Fennel, K.; Testa, J.M. Biogeochemical controls on coastal hypoxia. Annu. Rev. Mar. Sci. 2019, 11, 105–130. [Google Scholar] [CrossRef]
  25. Feely, R.A.; Okazaki, R.R.; Cai, W.J.; Bednarsek, N.; Alin, S.R.; Byrne, R.H.; Fassbender, A. The combined effects of acidification and hypoxia on pH and aragonite saturation in the coastal waters of the California current ecosystem and the northern Gulf of Mexico. Cont. Shelf Res. 2018, 152, 50–60. [Google Scholar] [CrossRef]
  26. Yang, F.X.; Wang, H.; Bouwman, A.F.; Beusen, A.H.W.; Liu, X.; Wang, J.; Yu, Z.; Yao, Q. Nitrogen from agriculture and temperature as the major drivers of deoxygenation in the central Bohai Sea. Sci. Total Environ. 2023, 893, 164614. [Google Scholar] [CrossRef]
  27. Lin, J.; Xie, L.; Pietrefesa, L.J.; Xu, H.; Woods, W.; Mallin, M.; Durake, M.J. Water quality responses to simulated flow and nutrient reductions in the Cape Fear estuary and adjacent coastal region, North Carolina. Ecol. Model. 2008, 212, 200–217. [Google Scholar] [CrossRef]
  28. Testa, J.M.; Kemp, W.M. Oxygen-dynamics and biogeochemical consequences. Treatise Estuar. Coast. Sci. 2011, 5, 163–199. [Google Scholar]
  29. Zhang, Y.; Wu, Z.; Liu, M.; He, J.; Shi, K.; Zhou, Y.; Wang, M.; Liu, X. Dissolved oxygen stratification and response to thermal structure and long-term climate change in a large and deep subtropical reservoir (Lake Qiandaohu, China). Water Res. 2015, 75, 249–258. [Google Scholar] [CrossRef] [PubMed]
  30. Sánchez-España, J.; Mata, M.P.; Vegas, J.; Morellón, M.; Rodríguez, J.A.; Salazar, Á.; Yusta, I.; Chaos, A.; Pérez-Martínez, C.; Navas, A. Anthropogenic and climatic factors enhancing hypolimnetic anoxia in a temperate mountain lake. J. Hydrol. 2017, 555, 832–850. [Google Scholar] [CrossRef]
  31. Du, Y.; Peng, W.; Liu, C. Advances in research on the tempo-spatial characteristics of dissolved oxygen in a stratified reservoir. J. Hydraul. Eng. 2019, 50, 990–998. [Google Scholar]
  32. Müller, B.; Bryant, L.D.; Matzinger, A.; Wüest, A. Hypolimnetic oxygen depletion in eutrophic lakes. Environ. Sci. Technol. 2012, 46, 9964–9971. [Google Scholar] [CrossRef]
  33. Mariliis, K.; Ilja, M.; Jüri, E.; Ye, L.; Martin, H.; Lena, V.; Urmas, R. Recent regime of persistent hypoxia in the Baltic Sea. Environ. Res. Commun. 2021, 33, 7. [Google Scholar]
  34. Yan, J.; Chen, N.; Wang, F.; Liu, Q.; Wu, Z.; Middelburg, J.J.; Xie, Y.; Guo, W.; Zhang, X. Interaction between oxygen consumption and carbon dioxide emission in a subtropical hypoxic reservoir, southeastern China. J. Geophys. Res. Biogeosci. 2021, 126, e2020JG006133. [Google Scholar] [CrossRef]
  35. Kullenberg, G.; Jacobsen, T.S. The Baltic Sea: An outline of its physical oceanography. Mar. Pollut. Bull. 1981, 12, 183–186. [Google Scholar] [CrossRef]
  36. Naumov, L.; Neumann, T.; Radtke, H.; Meier, H.E.M. Limited ventilation of the central Baltic Sea due to elevated oxygen consumption. Front. Mar. Sci. 2023, 10, 1175643. [Google Scholar] [CrossRef]
  37. Heimbrand, Y.; Limburg, K.; Hüssy, K.; Næraa, T.; Casini, M. Cod otoliths document accelerating climate impacts in the Baltic Sea. Sci. Rep. 2024, 14, 16750. [Google Scholar] [CrossRef]
  38. HELCOM. Development of tools for assessment of eutrophication in the Baltic Sea. In Baltic Sea Environment Proceedings; Erweko Painotuote Oy: Uusimaa, Finland, 2006; No. 104; p. 62. [Google Scholar]
  39. Ma, X.; Ma, Y.; Qi, J.; Li, J.; Chen, J.; Liu, J.; Chen, L.; Shi, C.; Xie, R. Changes in perturbation-correlation mov-ing-window two-dimensional correlation spectroscopy of dissolved organic matter induced by dam regulation in a river-type reservoir. Ecotoxicol. Environ. Saf. 2025, 300, 118464. [Google Scholar] [CrossRef] [PubMed]
  40. Grasshoff, K.; Kremling, K.; Ehrhardt, M. Methods of Seawater Analysis; Wiley-VCH Verlag: Weinheim, Germany, 1999; pp. 188–189. [Google Scholar]
  41. YSI. EXO User Manual Advanced Water Quality Monitoring Platform; YSI: Yellow Springs, OH, USA, 2019. [Google Scholar]
  42. Xie, R.; Pang, Y.; Luo, B.; Li, J.; Wu, C.; Zheng, Y.; Sun, Q.; Zhang, P.; Wang, F. Spatiotemporal variability in salinity and hydraulic relationship with salt intrusion in the tidal reaches of the Minjiang River, Fujian province, China. Environ. Sci. Pollut. Res. 2017, 24, 11847–11855. [Google Scholar] [CrossRef] [PubMed]
  43. HJ 535-2009; Water Quality-Determination of Ammonia Nitrogen-Nesslers Reagent Spectrophotometry. China Environmental Science Press: Beijing, China, 2009. Available online: https://www.mee.gov.cn/ywgz/fgbz/bz/bzwb/jcffbz/201001/W020180319535685015821.pdf (accessed on 1 September 2023). (In Chinese)
  44. HJ/T 346-2007; Water Quality-Determination of Nitrate-Nitrogen-Ultraviolet Spectrophotometry. China Environmental Science Press: Beijing, China, 2007. Available online: https://www.mee.gov.cn/ywgz/fgbz/bz/bzwb/jcffbz/200703/W020220901375489450689.pdf (accessed on 1 September 2023). (In Chinese)
  45. GB 7493-1987; Water Quality-Determination of Nitrogen (Nitrite)—Spectrophotometric Method. China Environmental Science Press: Beijing, China, 1987. Available online: https://www.mee.gov.cn/image20010518/3467.pdf (accessed on 1 September 2023). (In Chinese)
  46. GB 11893-1989; Water Quality-Determination of Total Phosphorus-Ammonium Molybdate Spectrophotometric Method. China Environmental Science Press: Beijing, China, 1989. Available online: https://www.mee.gov.cn/image20010518/3655.pdf (accessed on 1 September 2023). (In Chinese)
  47. Sherstyankin, P.P.; Kuimova, L.N. Vertical stability and the Brunt-Vaisala frequency of deep natural waters by the example of Lake Baikal, Lake Tanganyika, and the World Ocean. Dokl. Earth Sci. 2009, 429, 1553–1558. [Google Scholar] [CrossRef]
  48. Duan, W.; Cheng, X.; Zhu, X.; Ma, T. Variability in upper-ocean salinity stratification in the tropical Pacific Ocean. Acta Oceanol. Sin. 2021, 40, 113–125. [Google Scholar] [CrossRef]
  49. Gerkema, T.; Zimmerman, J.T.F. An Introduction to Internal Waves; Royal NIOZ: Texel, The Netherlands, 2008; p. 40. [Google Scholar]
  50. Kang, X.; Xia, M. Stratification variability in a lagoon system in response to a passing storm. Limnol. Oceanogr. 2022, 67, 511–521. [Google Scholar] [CrossRef]
  51. Boehrer, B.; Schultze, M. Stratification of lakes. Rev. Geophys. 2008, 46, RG2005. [Google Scholar] [CrossRef]
  52. Jane, S.F.; Mincer, J.L.; Lau, M.P.; Lewis, A.S.L.; Stetler, J.T.; Rose, K.C. Longer duration of season stratification contributes to widespread increases in lake hypoxia and anoxia. Glob. Change Biol. 2023, 29, 1009–1023. [Google Scholar] [CrossRef] [PubMed]
  53. He, J.; Shen, H.; Xue, R.; Liu, Y.; Zhang, Q.; Li, J. Study on seasonal low dissolved oxygen driving factors and pollution traceability in surface water of XinghuaLixiahe area in Jiangsu Province. Environ. Monit. China 2025, 41, 83–93. (In Chinese) [Google Scholar] [CrossRef] [PubMed]
  54. Onabule, O.A.; Mitchell, S.B.; Couceiro, F. The effects of freshwater flow and salinity on turbidity and dissolved oxygen in a shallow Macrotidal estuary: A case study of Portsmouth Harbour. Ocean Coast. Manag. 2020, 191, 105179. [Google Scholar] [CrossRef]
  55. Zang, C.; Huang, S.; Wu, M.; Du, S.; Scholz, M.; Gao, F.; Lin, C.; Guo, Y.; Dong, Y. Comparison of relationships between pH, dissolved oxygen and chlorophyll a for aquaculture and non-aquaculture waters. Water Air Soil Pollut. 2011, 219, 157–174. [Google Scholar] [CrossRef]
  56. Sutula, M.; Kudela, R.; Hagy, J.D.; Harding, L.W.; Senn, D.; Cloern, J.E.; Bricker, S.; Berg, G.M.; Beck, M. Novel analyses of long-term data provide a scientific basis for chlorophyll-a thresholds in San Francisco Bay. Estuar. Coast. Shelf Sci. 2017, 197, 107–118. [Google Scholar] [CrossRef]
  57. Katkaew, N.; Chamchoi, N. Threshold amounts of nutrients and the relationship with chlorophyll a during eutrophication phenomenon in small-scale artificial reservoirs. Environ. Sustain. Indic. 2024, 22, 100378. [Google Scholar] [CrossRef]
  58. Paerl, H.W.; Havens, K.E.; Xu, H.; Zhu, G.; McCarthy, M.J.; Newell, S.E.; Scott, J.T.; Hall, N.S.; Otten, T.G.; Qin, B. Mitigating eutrophication and toxic cyanobacterial blooms in large lakes: The evolution of a dual nutrient (N and P) reduction paradigm. Hydrobiologia 2020, 847, 4359–4375. [Google Scholar] [CrossRef]
  59. Paerl, H.W.; Hall, N.S.; Calandrino, E.S. Controlling harmful cyanobacterial blooms in a world experiencing anthropogenic and climatic-induced change. Sci. Total Environ. 2011, 409, 1739–1745. [Google Scholar] [CrossRef]
  60. Jilbert, T.; Gustafsson, B.G.; Veldhuijzen, S.; Reed, D.C.; van Helmond, N.A.G.M.; Hermans, M.; Slomp, C.P. Iron-phosphorus feedbacks drive multidecadal oscillations in Baltic Sea hypoxia. Geophys. Res. Lett. 2021, 48, e2021GL095908. [Google Scholar] [CrossRef]
  61. Li, G.; Cheng, L.; Zhu, J.; Trenberth, K.; Mann, M.E.; Abraham, J.P. Increasing ocean stratification over the past half-century. Nat. Clim. Change 2020, 10, 1116–1123. [Google Scholar] [CrossRef]
  62. Rolff, C.; Walve, J.; Larsson, U.; Elmgren, R. How oxygen deficiency in the Baltic Sea proper has spread and worsened: The role of ammonium and hydrogen sulphide. Ambio 2022, 51, 2308–2324. [Google Scholar] [CrossRef]
  63. Taavi, L.; Urmas, L. Stratification has strengthened in the Baltic sea—An analysis of 35 years of observational data. Front. Earth Sci. 2019, 7, 174. [Google Scholar]
  64. Löptien, U.; Renz, M.; Dietze, H. Major Baltic Inflows come in different flavours. Commun. Earth Environ. 2025, 6, 232. [Google Scholar] [CrossRef]
  65. Ahlgren, J.; Grimvall, A.; Omstedt, A.; Rolff, C.; Wikner, J. Temperature, DOC level and basin interactions explain the declining oxygen concentrations in the Bothnian Sea. J. Mar. Syst. 2017, 170, 22–30. [Google Scholar] [CrossRef]
  66. Hermans, M.; Lenstra, W.K.; van Helmond, N.A.G.M.; Behrends, T.; Egger, M.; Séguret, M.J.M.; Gustafsson, E.; Gustafsson, B.G.; Slomp, C.P. Impact of natural re-oxygenation on the sediment dynamics of manganese, iron and phosphorus in a euxinic Baltic Sea basin. Geochim. Et Cosmochim. Acta 2019, 246, 174–196. [Google Scholar] [CrossRef]
  67. Yakushev, E.V.; Pollehne, F.; Jost, G.; Kuznetsov, I.; Schneider, B.; Umlauf, L. Analysis of the water column oxic/anoxic interface in the Black and Baltic seas with a numerical model. Mar. Chem. 2007, 107, 388–410. [Google Scholar] [CrossRef]
  68. Jane, S.F.; Hansen, G.J.A.; Kraemer, B.M.; Leavitt, P.R.; Mincer, J.L.; North, R.L.; Pilla, R.M.; Stetler, J.T.; Williamson, C.E.; Woolway, R.I.; et al. Widespread deoxygenation of temperate lakes. Nature 2021, 594, 66–70. [Google Scholar] [CrossRef]
  69. Pilla, R.M.; Williamson, C.E.; Adamovich, B.V.; Adrian, R.; Anneville, O.; Chandra, S.; Colom-Montero, W.; Devlin, S.P.; Dix, M.A.; Dokulil, M.T.; et al. Deeper waters are changing less consistently than surface waters in a global analysis of 102 lakes. Sci. Rep. 2020, 10, 20514. [Google Scholar] [CrossRef]
  70. Alexander, J.E.; Thorp, J.H.; Fell, R.D. Turbidity and temperature effects on oxygen consumption in the Zebra mussel (Dreissena polymorpha). Can. J. Fish. Aquat. Sci. 1994, 51, 179–184. [Google Scholar] [CrossRef]
  71. Zhu, X.; Jia, G.; Tian, Y.; Mo, A.; Xu, W.; Miao, L.; Xu, S.; Yan, W. Photosynthetic Production Determines bottom water oxygen variations in the upwelling coastal south China sea over recent decades. Front. Earth Sci. 2021, 9, 759317. [Google Scholar] [CrossRef]
  72. Sarkar, A.; Naqvi, S.W.A.; Lavik, G.; Pratihary, A.; Naik, H.; Shirodkar, G.; Kuypers, M.M.M. Massive nitrogen loss over the western Indian continental shelf during seasonal anoxia: Evidence from isotope pairing technique. Front. Mar. Sci. 2020, 7, 678. [Google Scholar] [CrossRef]
  73. Liu, C.; Wang, S.; Liu, X.; Zhou, H.; Li, B.; Du, Y.; Wang, L. Characteristics of water quality response to hypolimnetic anoxia in Daheiting Reservoir. Water Sci. Technol. 2022, 85, 2065–2075. [Google Scholar] [CrossRef]
  74. Horne, A.J.; Jung, R.; Lai, H.; Faisst, B.; Beutel, M. Hypolimnetic oxygenation 2: Oxygen dynamics in a large reservoir with submerged down-flow contact oxygenation (Speece cone). Lake Reserv. Manag. 2019, 35, 323–337. [Google Scholar] [CrossRef]
  75. Holtermann, P.; Prien, R.; Naumann, M.; Umlauf, L. Interleaving of oxygenized intrusions into the Baltic Sea redoxcline. Limnol. Oceanogr. 2020, 65, 482–503. [Google Scholar] [CrossRef]
  76. Stigebrandt, A.; Kalén, O. Improving oxygen conditions in the deeper parts of Bornholm sea by pumped injection of winter water. Ambio 2013, 42, 587–595. [Google Scholar] [CrossRef] [PubMed]
  77. Salmi, P.; Malin, I.; Salonen, K. Pumping of epilimnetic water into hypolimnion improves oxygen but not necessarily nutrient conditions in a lake recovering from eutrophication. Inland Waters 2014, 4, 425–434. [Google Scholar] [CrossRef]
  78. Prashanth, K.S.; Ashish, K. Enhancement of dissolved oxygen level in the reservoir downstream using air injection techniques in hydroturbines: A review. Energy Sources Part A Recovery Util. Environ. Eff. 2024, 46, 9935–9954. [Google Scholar]
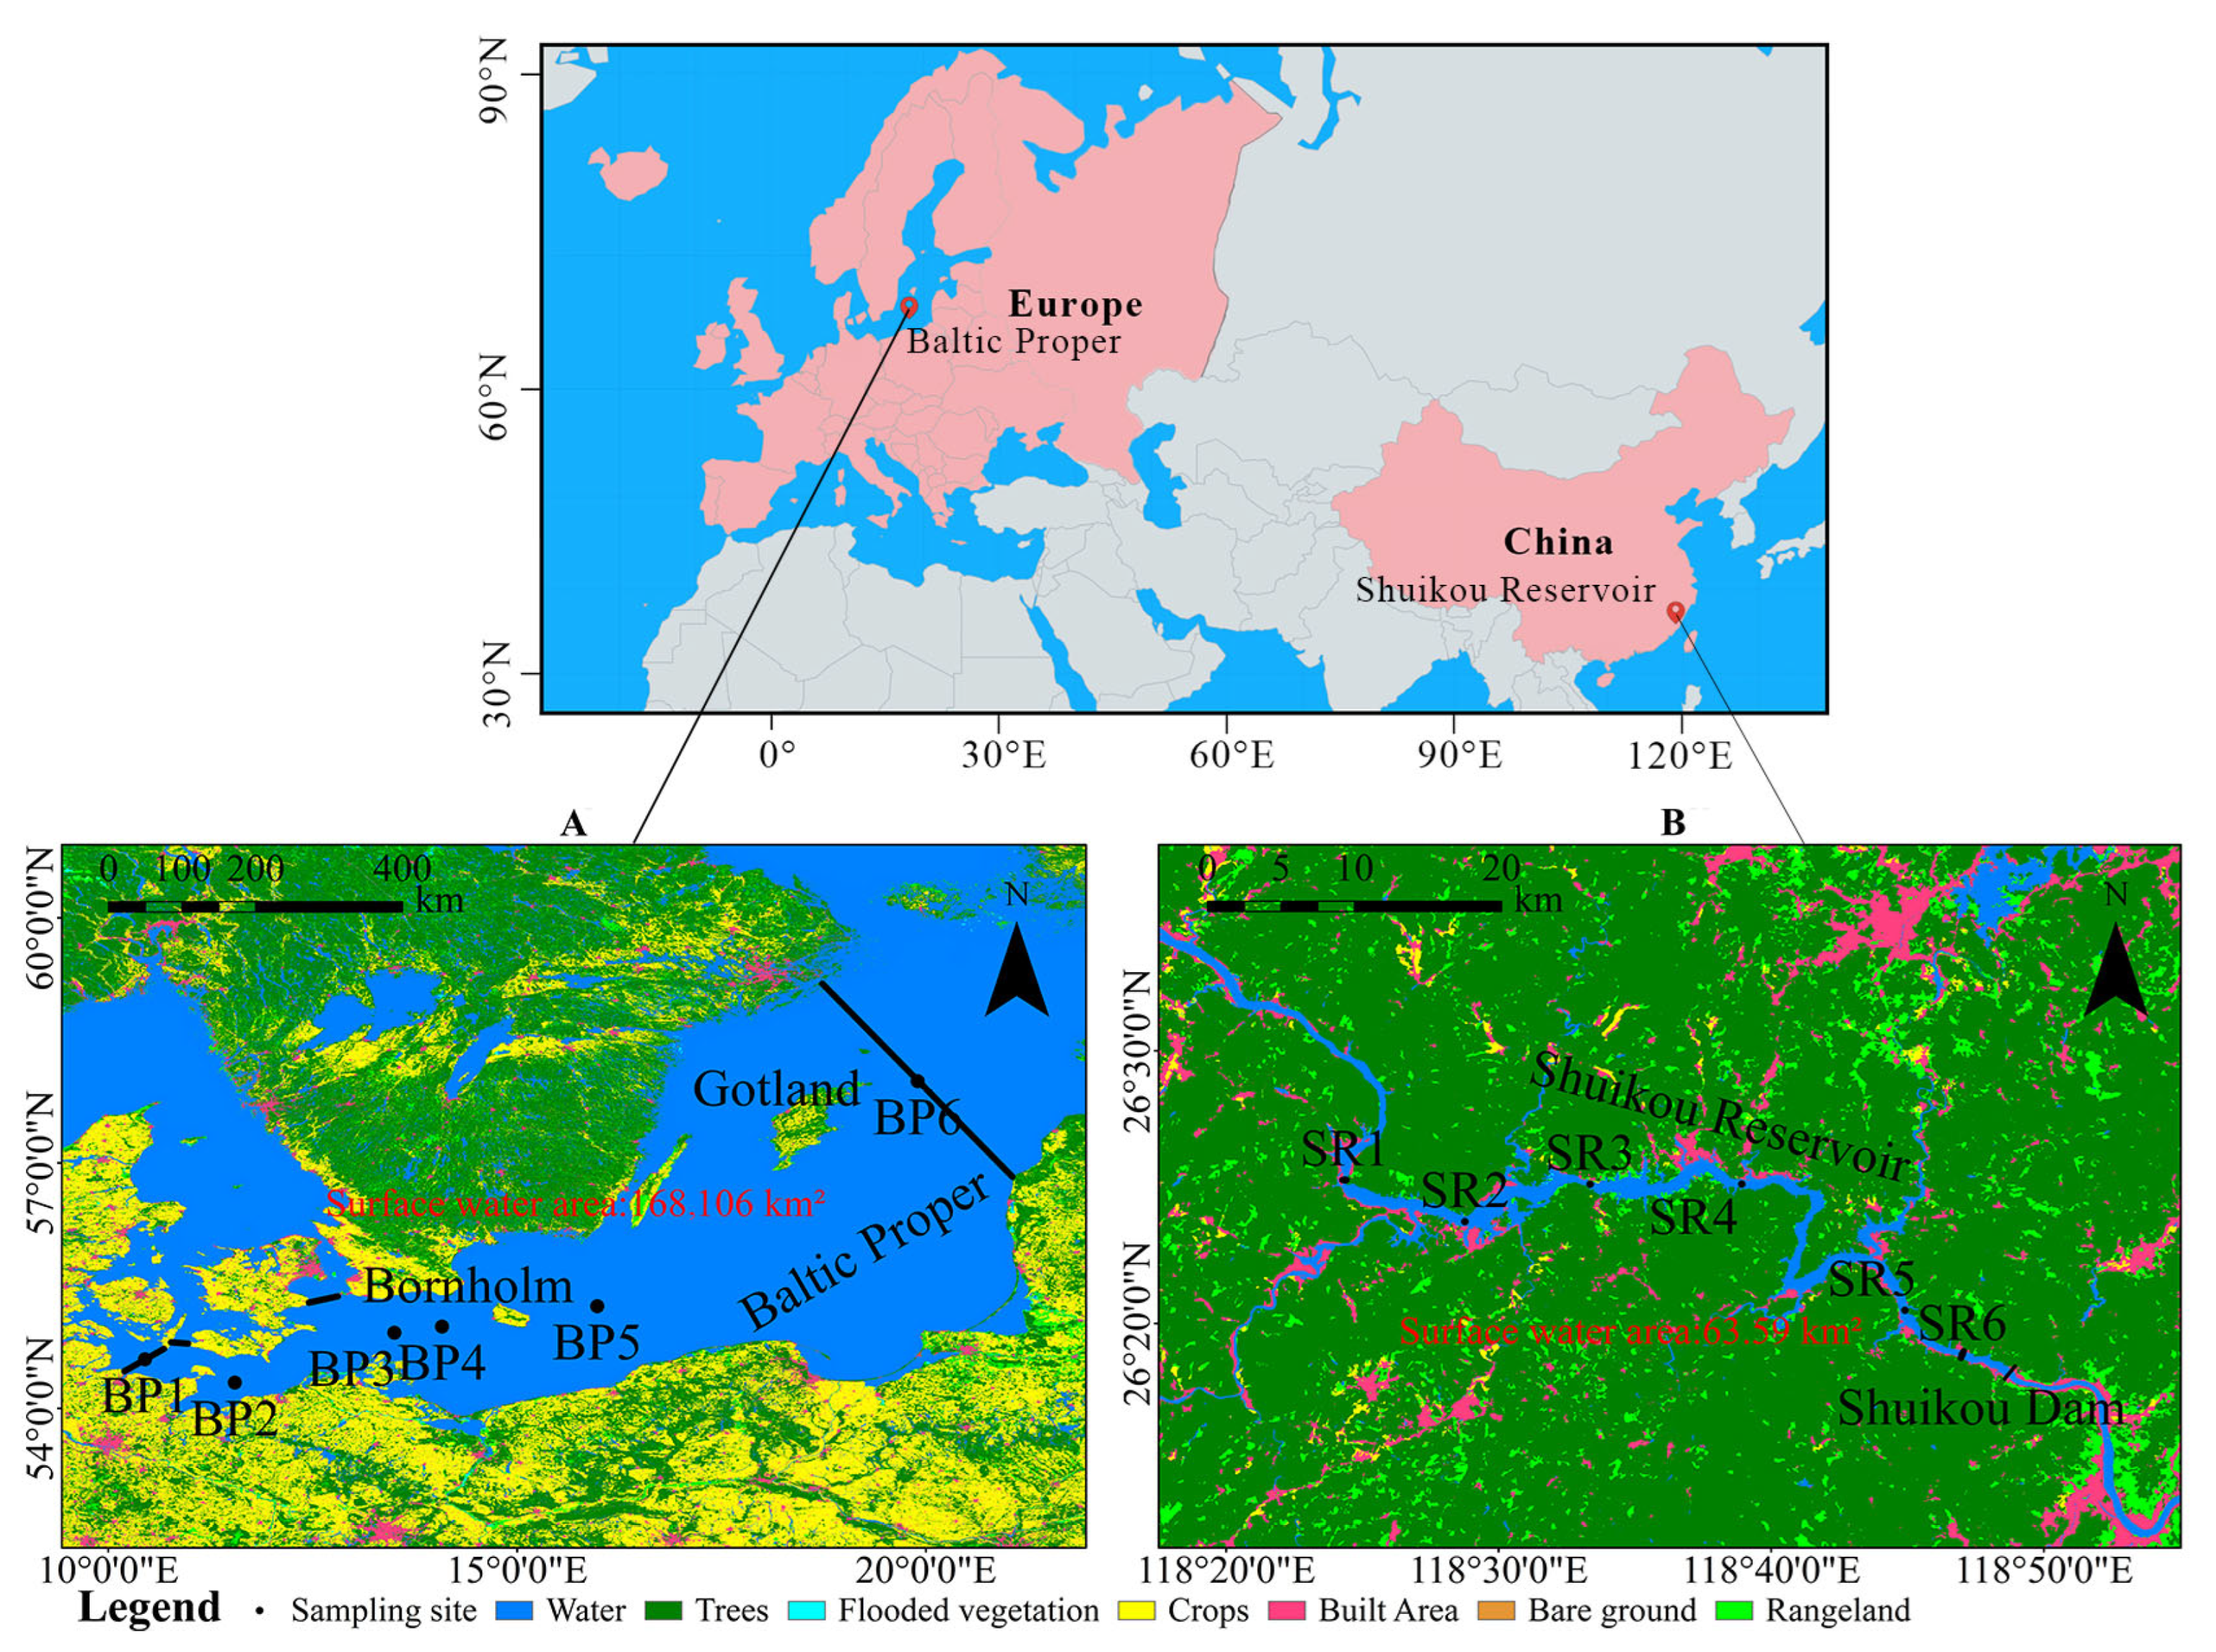
Figure 1. Location of sampling sites: (A) Baltic Proper, Europe, (B) Shuikou Reservoir, China.
Oceans 06 00054 g001
Figure 2. Spatiotemporal distribution of dissolved oxygen in the two research areas: (A) Baltic Proper, Europe (B) Shuikou Reservoir, China.
Oceans 06 00054 g002
Figure 3. Variability of the Brunt–Väisälä as a measure of stratification in the two research areas: (A) Baltic Proper, Europe (B) Shuikou Reservoir, China. The lines in red represent N2 < 0, which indicates unstable stratification [48].
Oceans 06 00054 g003
Figure 4. Spearman correlation analysis for DO and water quality parameters in the research areas. The symbols * and ** indicate parameters with a significant correlation at the 0.05 and 0.01 levels, respectively. Numbers with yellow background correspond to parameters with a positive relationship while numbers with blue background are associated with negatively correlated parameters.
Oceans 06 00054 g004
Figure 5. Redundancy analysis (RDA) of trends in water quality under hypoxia/anoxia conditions: (A) Baltic Proper, Europe (the numbers of samples in blue and red are 2056 and 38, respectively) (B) Shuikou Reservoir, China (the numbers of samples in blue and red are 560 and 10, respectively). DO(a) is the vertical profile of continuous sampling. DO(b) is the specific DO concentration at a given depth of the stratified sampling. DO(b) was derived from DO(a).
Oceans 06 00054 g005
Table 1. Variations of water quality parameters in the two comparative research areas. The minimum and maximum values are given. The numbers in bold indicate the number of samples. The sampling depths at each station are indicated in Table S1.
Sampling StationSalinityDO/
(mg/L)
T/
(°C)
Turbidity (NTU)Chl-a/
(μg/L)
NH4+/
(μmol/L)
NO3/(μmol/L)NO2/(μmol/L)TP/
(μmol/L)
BP111.99~23.18, 3134.69~9.07, 3134.46~20.90, 3130.09~1.17, 3130.59~4.17, 3130.18~2.50, 15LD~6.33, 150.02~0.73, 150.37~1.19, 15
BP29.05~25.61, 4432.21~9.94, 4434.33~20.04, 4430.05~2.43, 4430.43~5.17, 4430.16~5.21, 20LD~6.90, 200.01~0.60, 200.42~1.66, 20
BP37.22~18.05, 8812.20~9.39, 8813.81~20.04, 881LD~1.38, 8810.20~2.24, 8810.16~5.38, 35LD~7.01, 350.02~0.73, 350.54~1.93, 20
BP47.32~18.15, 9003.08~9.50, 9003.99~19.68, 900LD~1.59, 9000.16~2.94, 9000.16~3.51, 25LD~8.52, 25LD~1.02, 250.52~1.42, 20
BP57.30~16.17, 17260.03~9.61, 17263.73~20.95, 1726LD~1.32, 17260.15~2.85, 17260.10~14.78, 50LD~10.21, 50LD~0.36, 500.47~9.21, 30
BP66.98~12.43, 29920.0076~9.65, 29923.04~21.26, 2992LD~2.86, 29920.16~4.05, 2992LD~23.04, 52LD~5.64, 52LD~0.63, 520.44~5.42, 22
SR10.02~0.044.54~8.74, 86914.52~32.58, 8691.29~26.79, 6640.00~42.32, 8690.26~12.86, 2963.14~107.84, 291.77~9.17, 290.48~2.74, 29
SR20.58~8.00, 92714.79~32.39, 9270.86~29.65, 6530.04~36.57, 9270.62~24.14, 2557.44~103.62, 250.21~8.58, 250.67~3.64, 25
SR30.29~8.09, 103214.96~31.95, 10320.51~19.02, 7370.03~30.48, 10320.82~14.17, 3063.41~105.66, 300.21~8.86, 300.32~4.35, 30
SR40.31~7.75, 148215.15~31.11, 14820.24~10.50, 10320.08~15.60, 14821.02~28.08, 3064.36~103.90, 300.21~10.15, 300.41~5.25, 30
SR50.23~7.23, 178715.74~31.95, 17870.05~25.70, 13500.04~12.03, 17871.20~33.16, 3559.75~106.07, 350.21~6.81, 350.34~2.80, 35
SR60.27~7.36, 188115.98~31.61, 18810.20~24.26, 8690.10~5.78, 18811.79~14.36, 395.71~118.57, 390.21~5.86, 390.48~2.15, 39
LD is limit of detection.
Disclaimer/Publisher’s Note: The statements, opinions and data contained in all publications are solely those of the individual author(s) and contributor(s) and not of MDPI and/or the editor(s). MDPI and/or the editor(s) disclaim responsibility for any injury to people or property resulting from any ideas, methods, instructions or products referred to in the content.