
A Stability Model for Sea Cliffs Considering the Coupled Effects of Sea Erosion and Rainfall


Abstract
1. Introduction
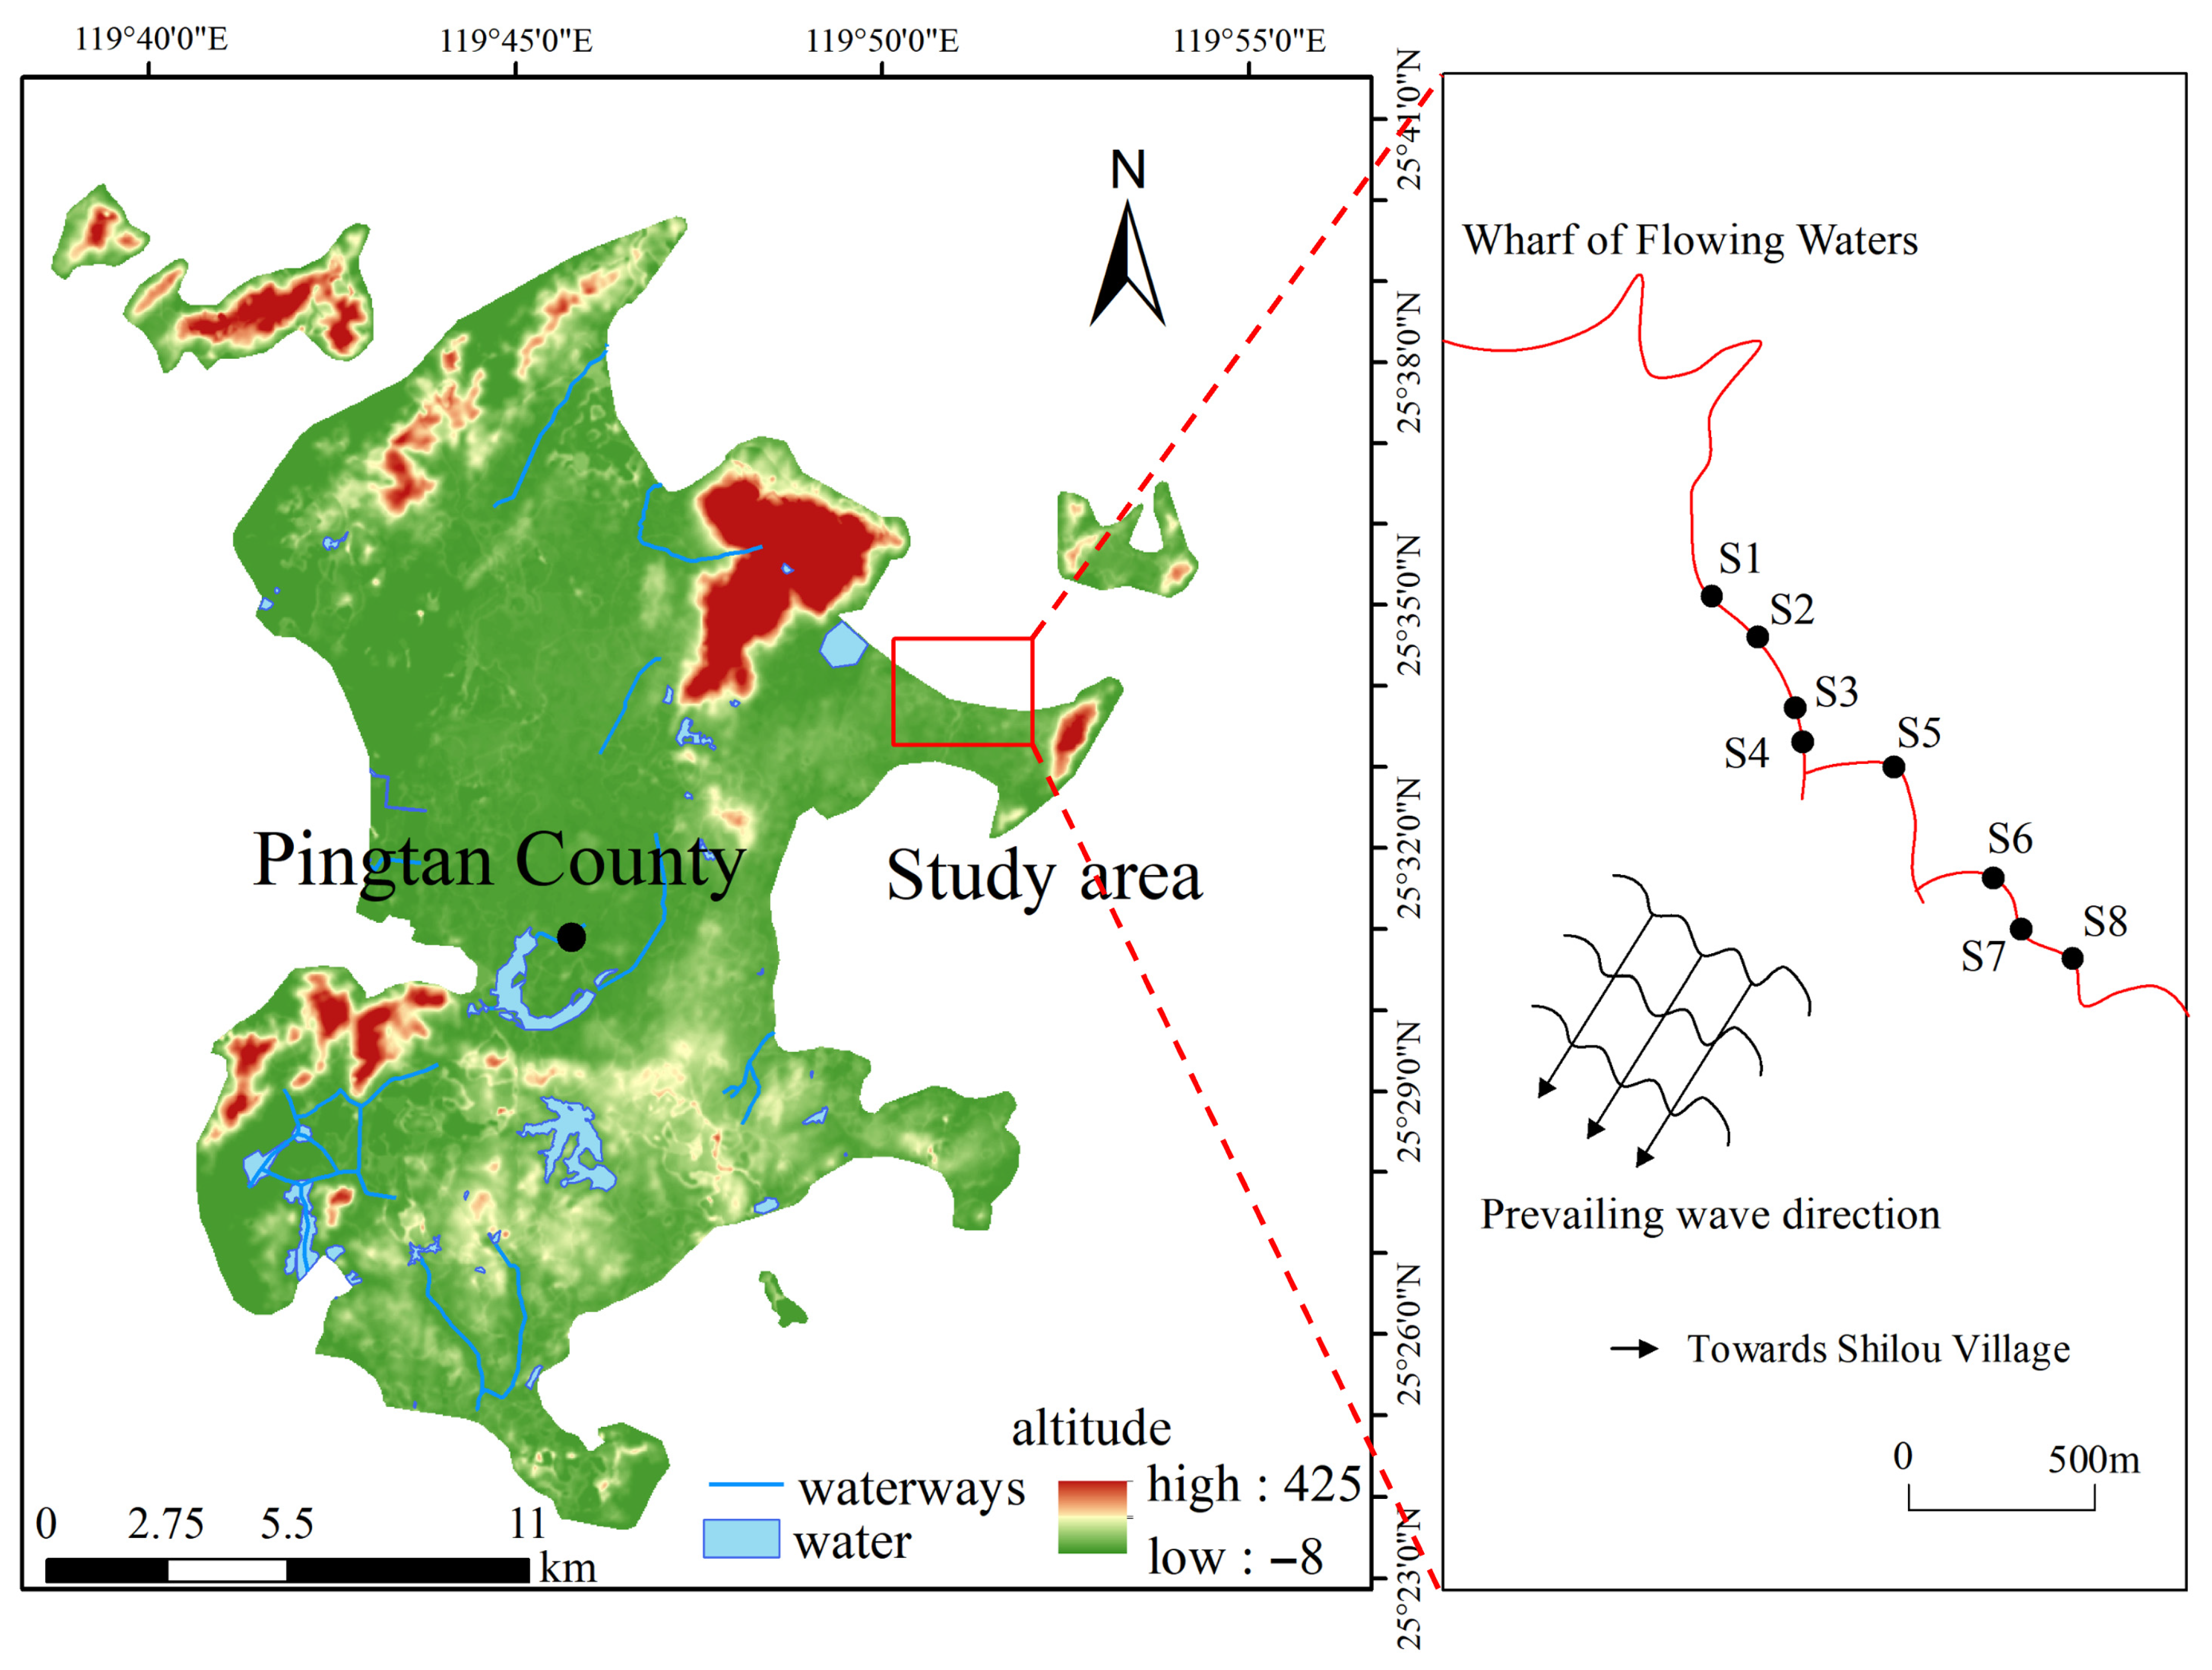
2. Study Area
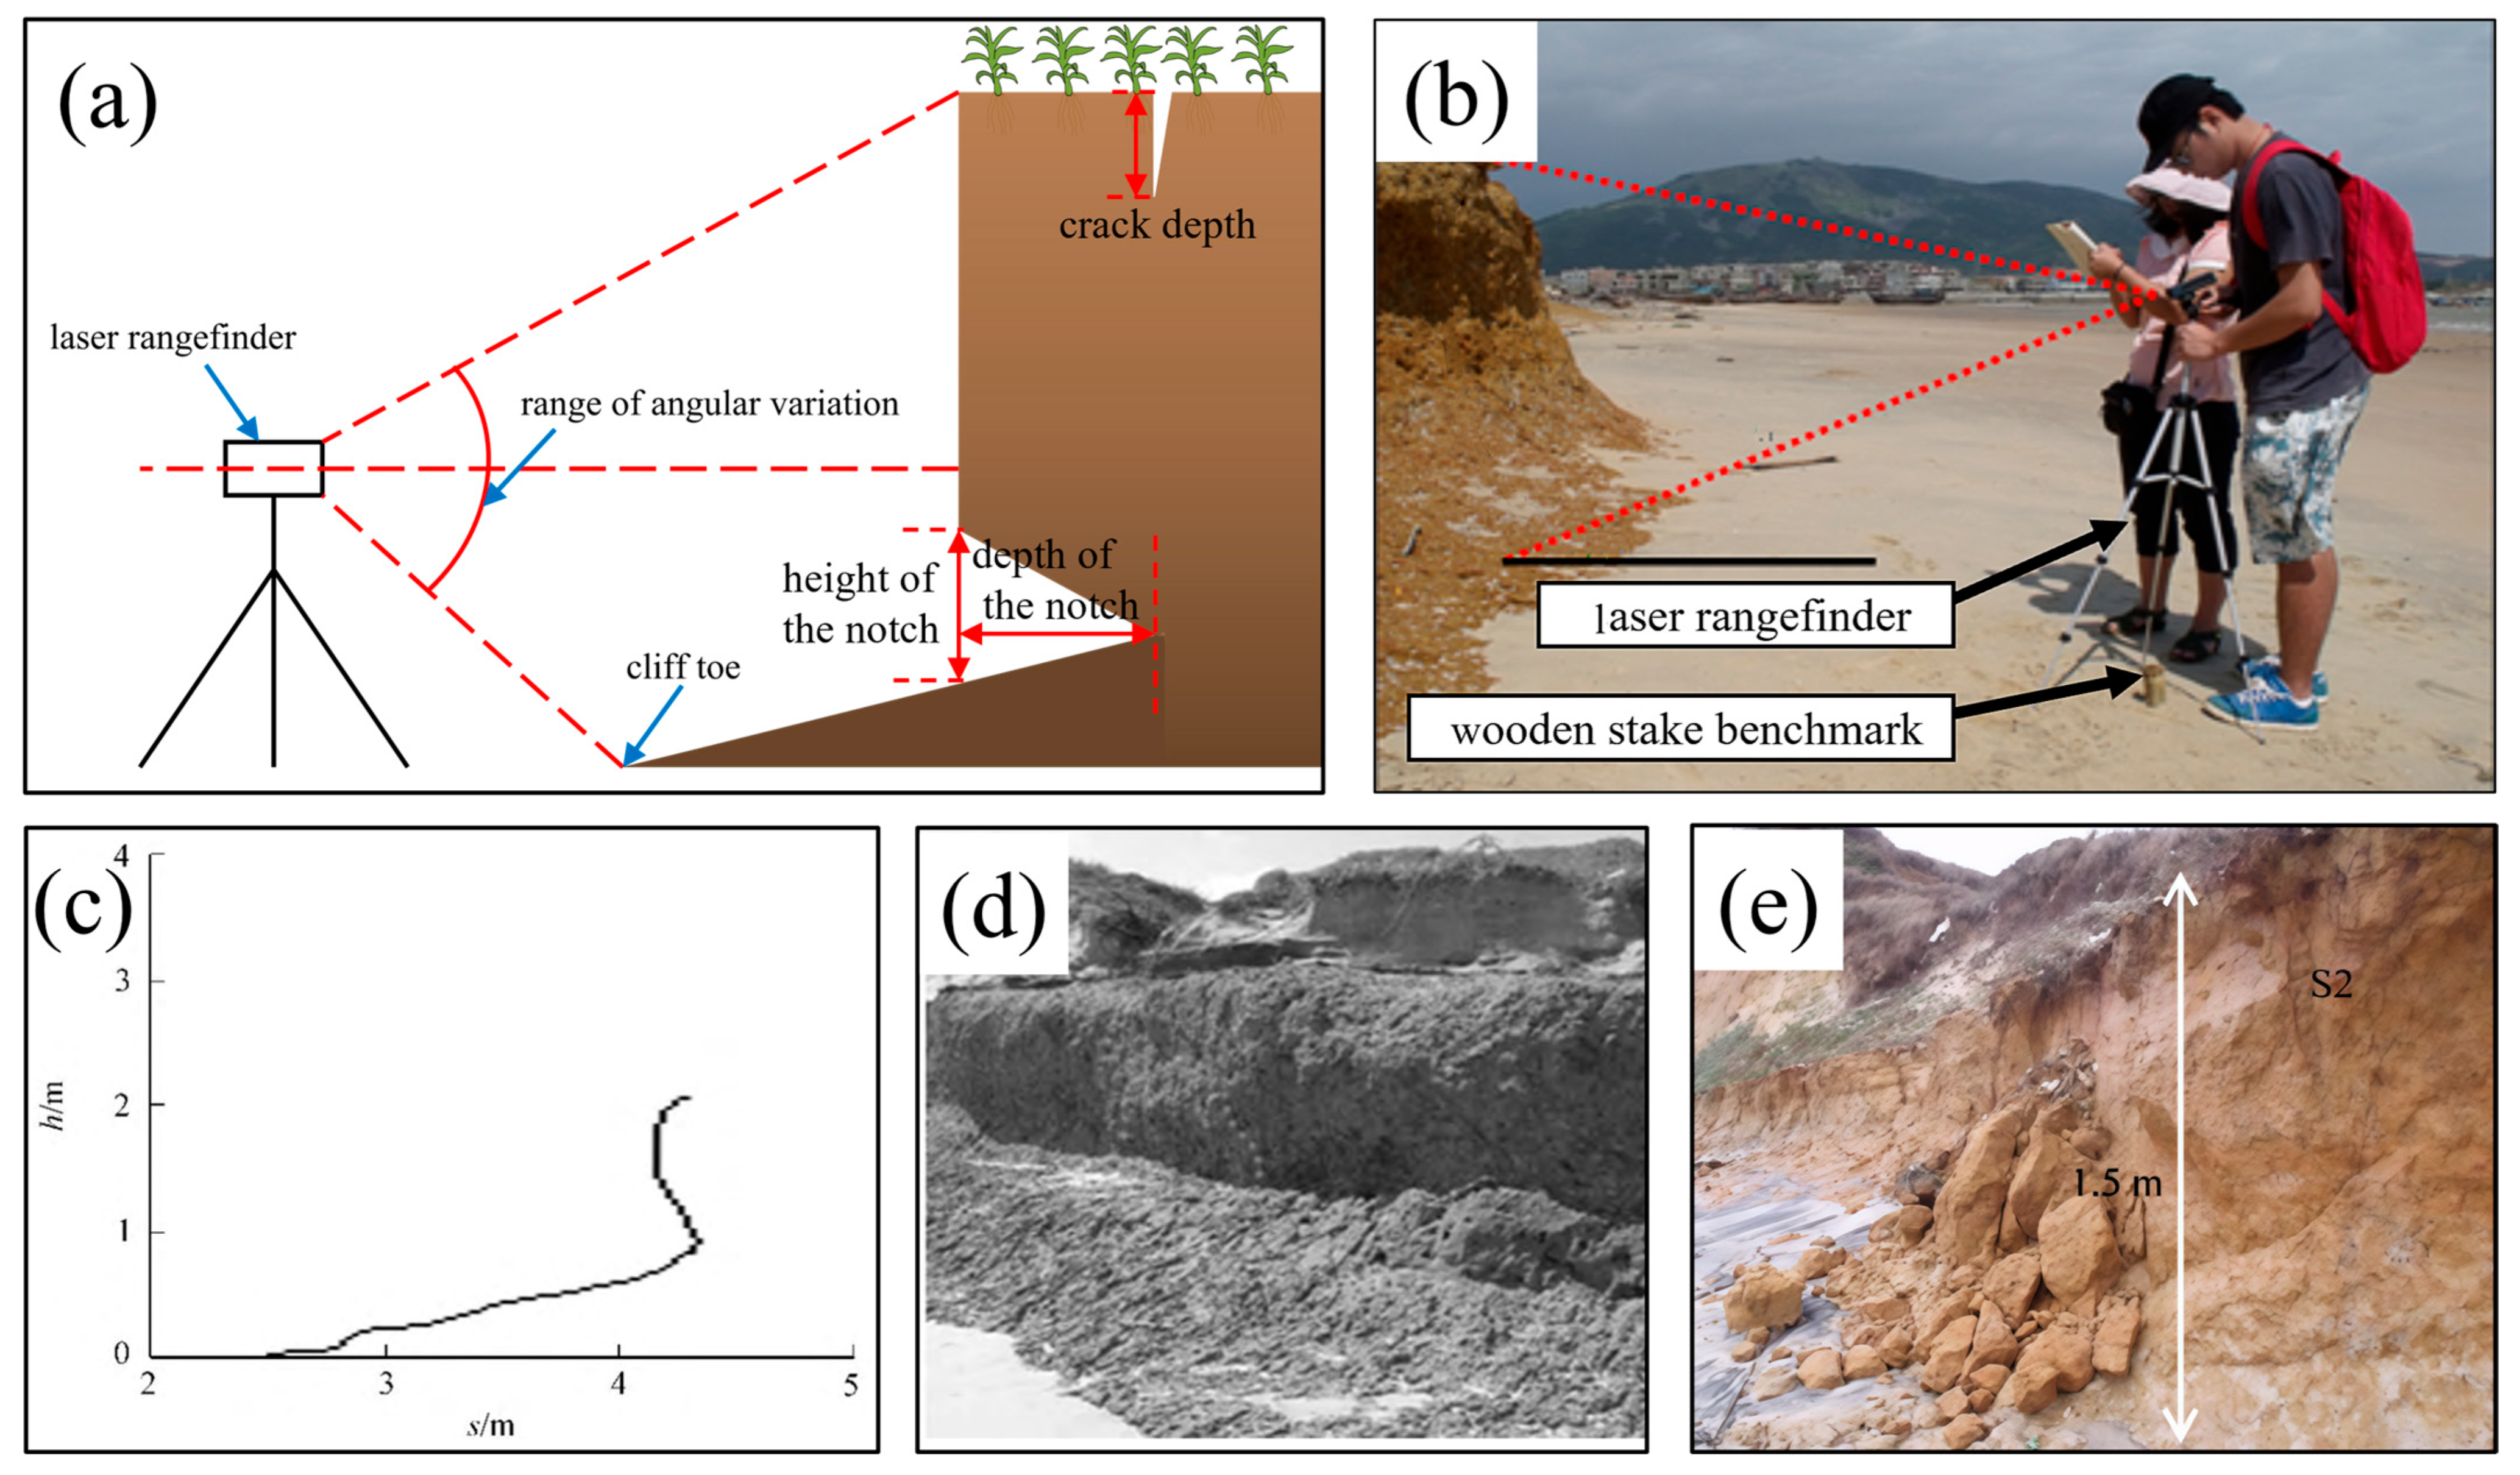
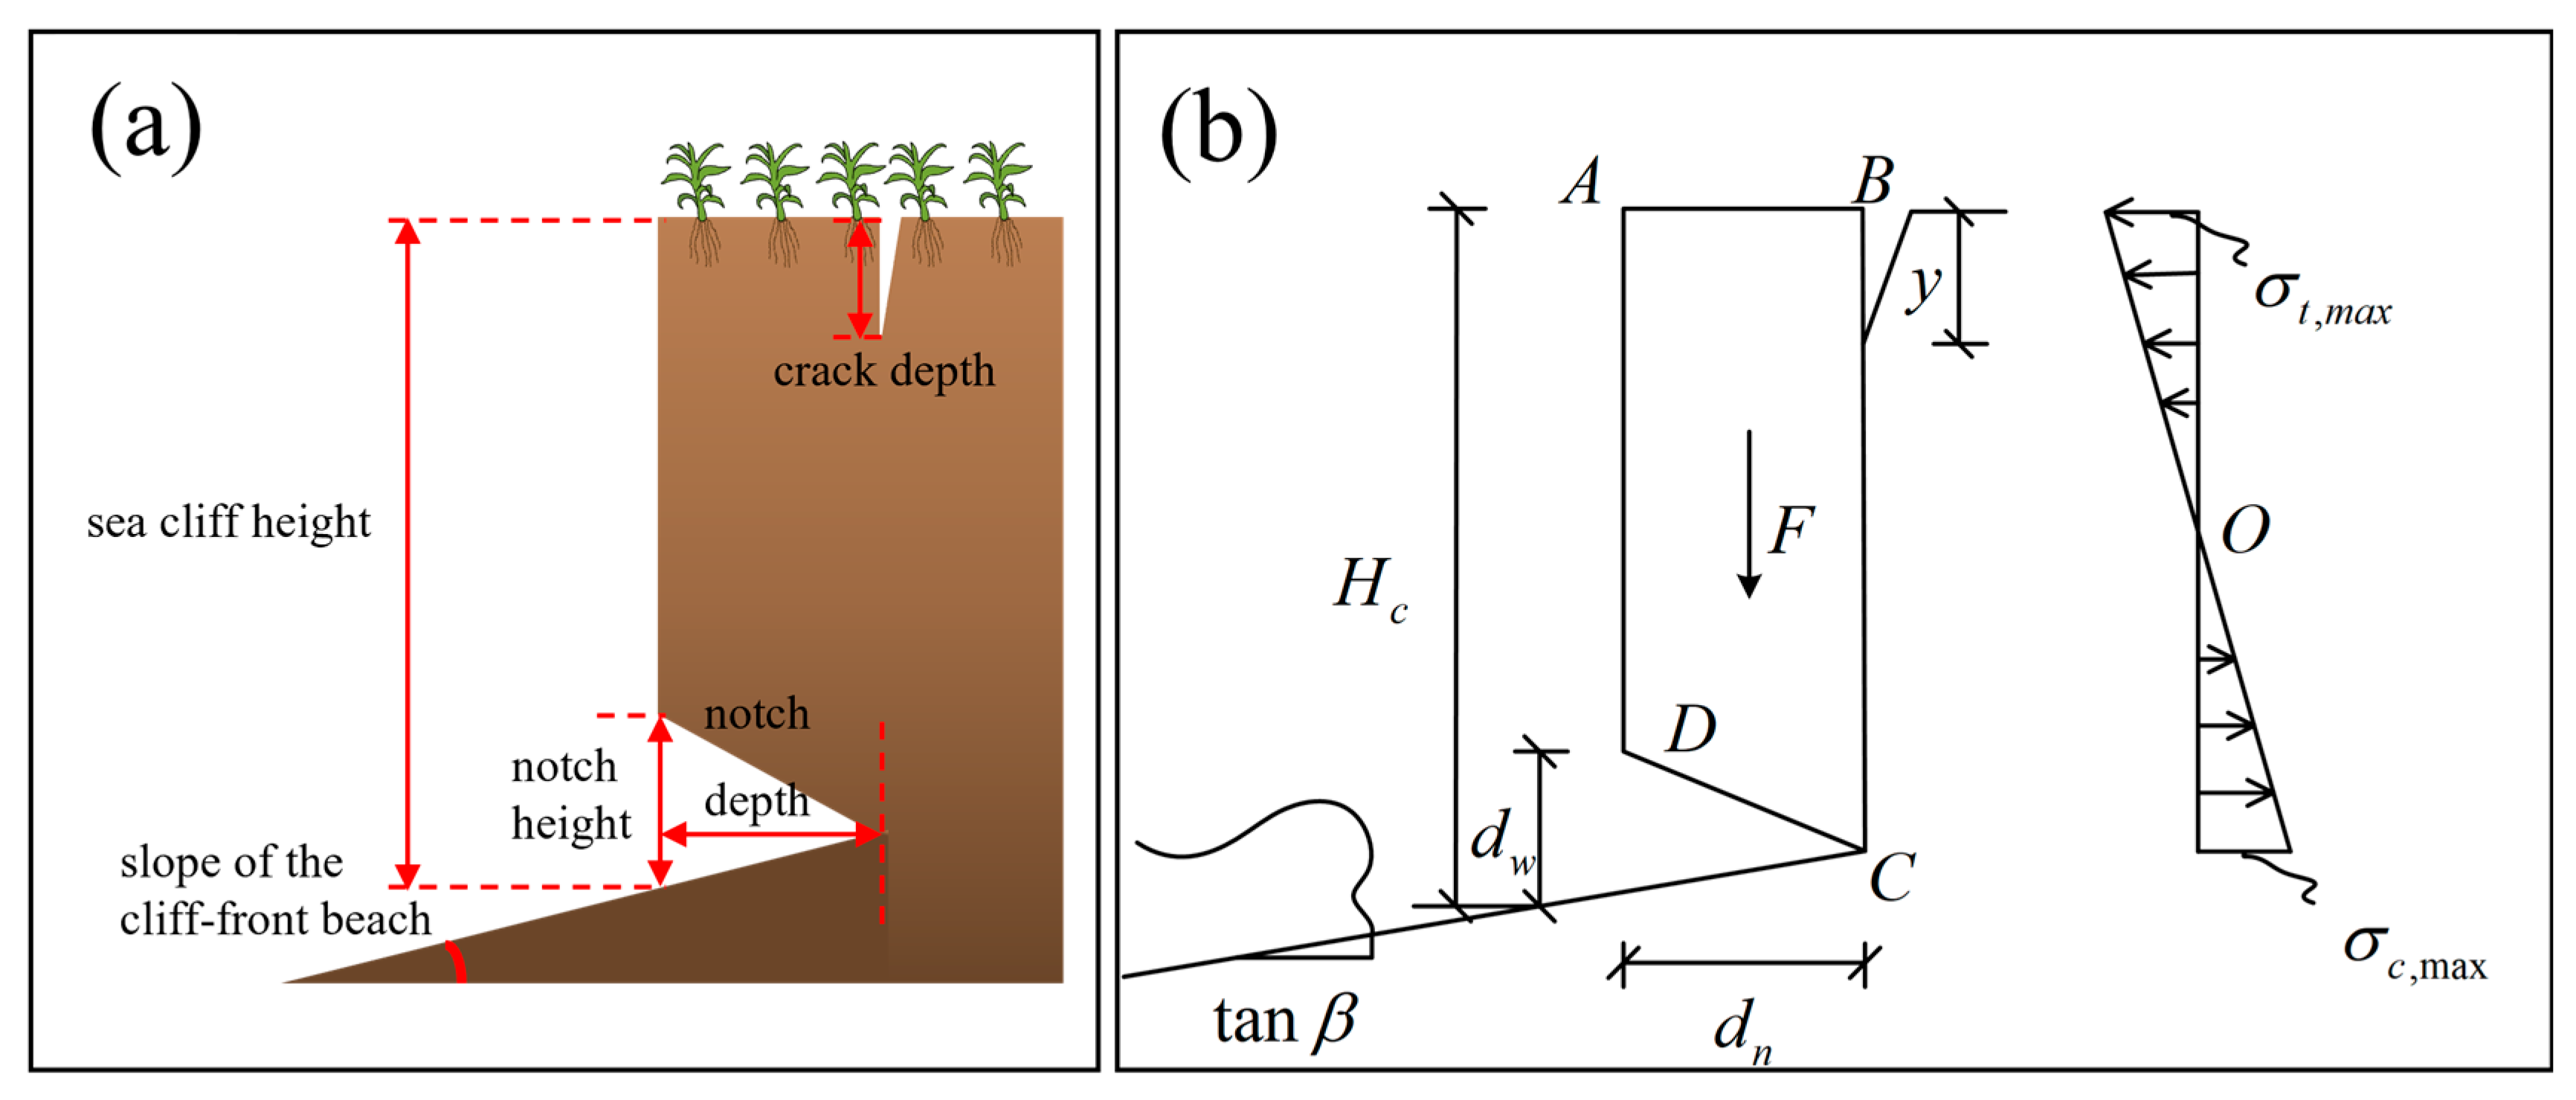
2.1. Toppling Characteristics
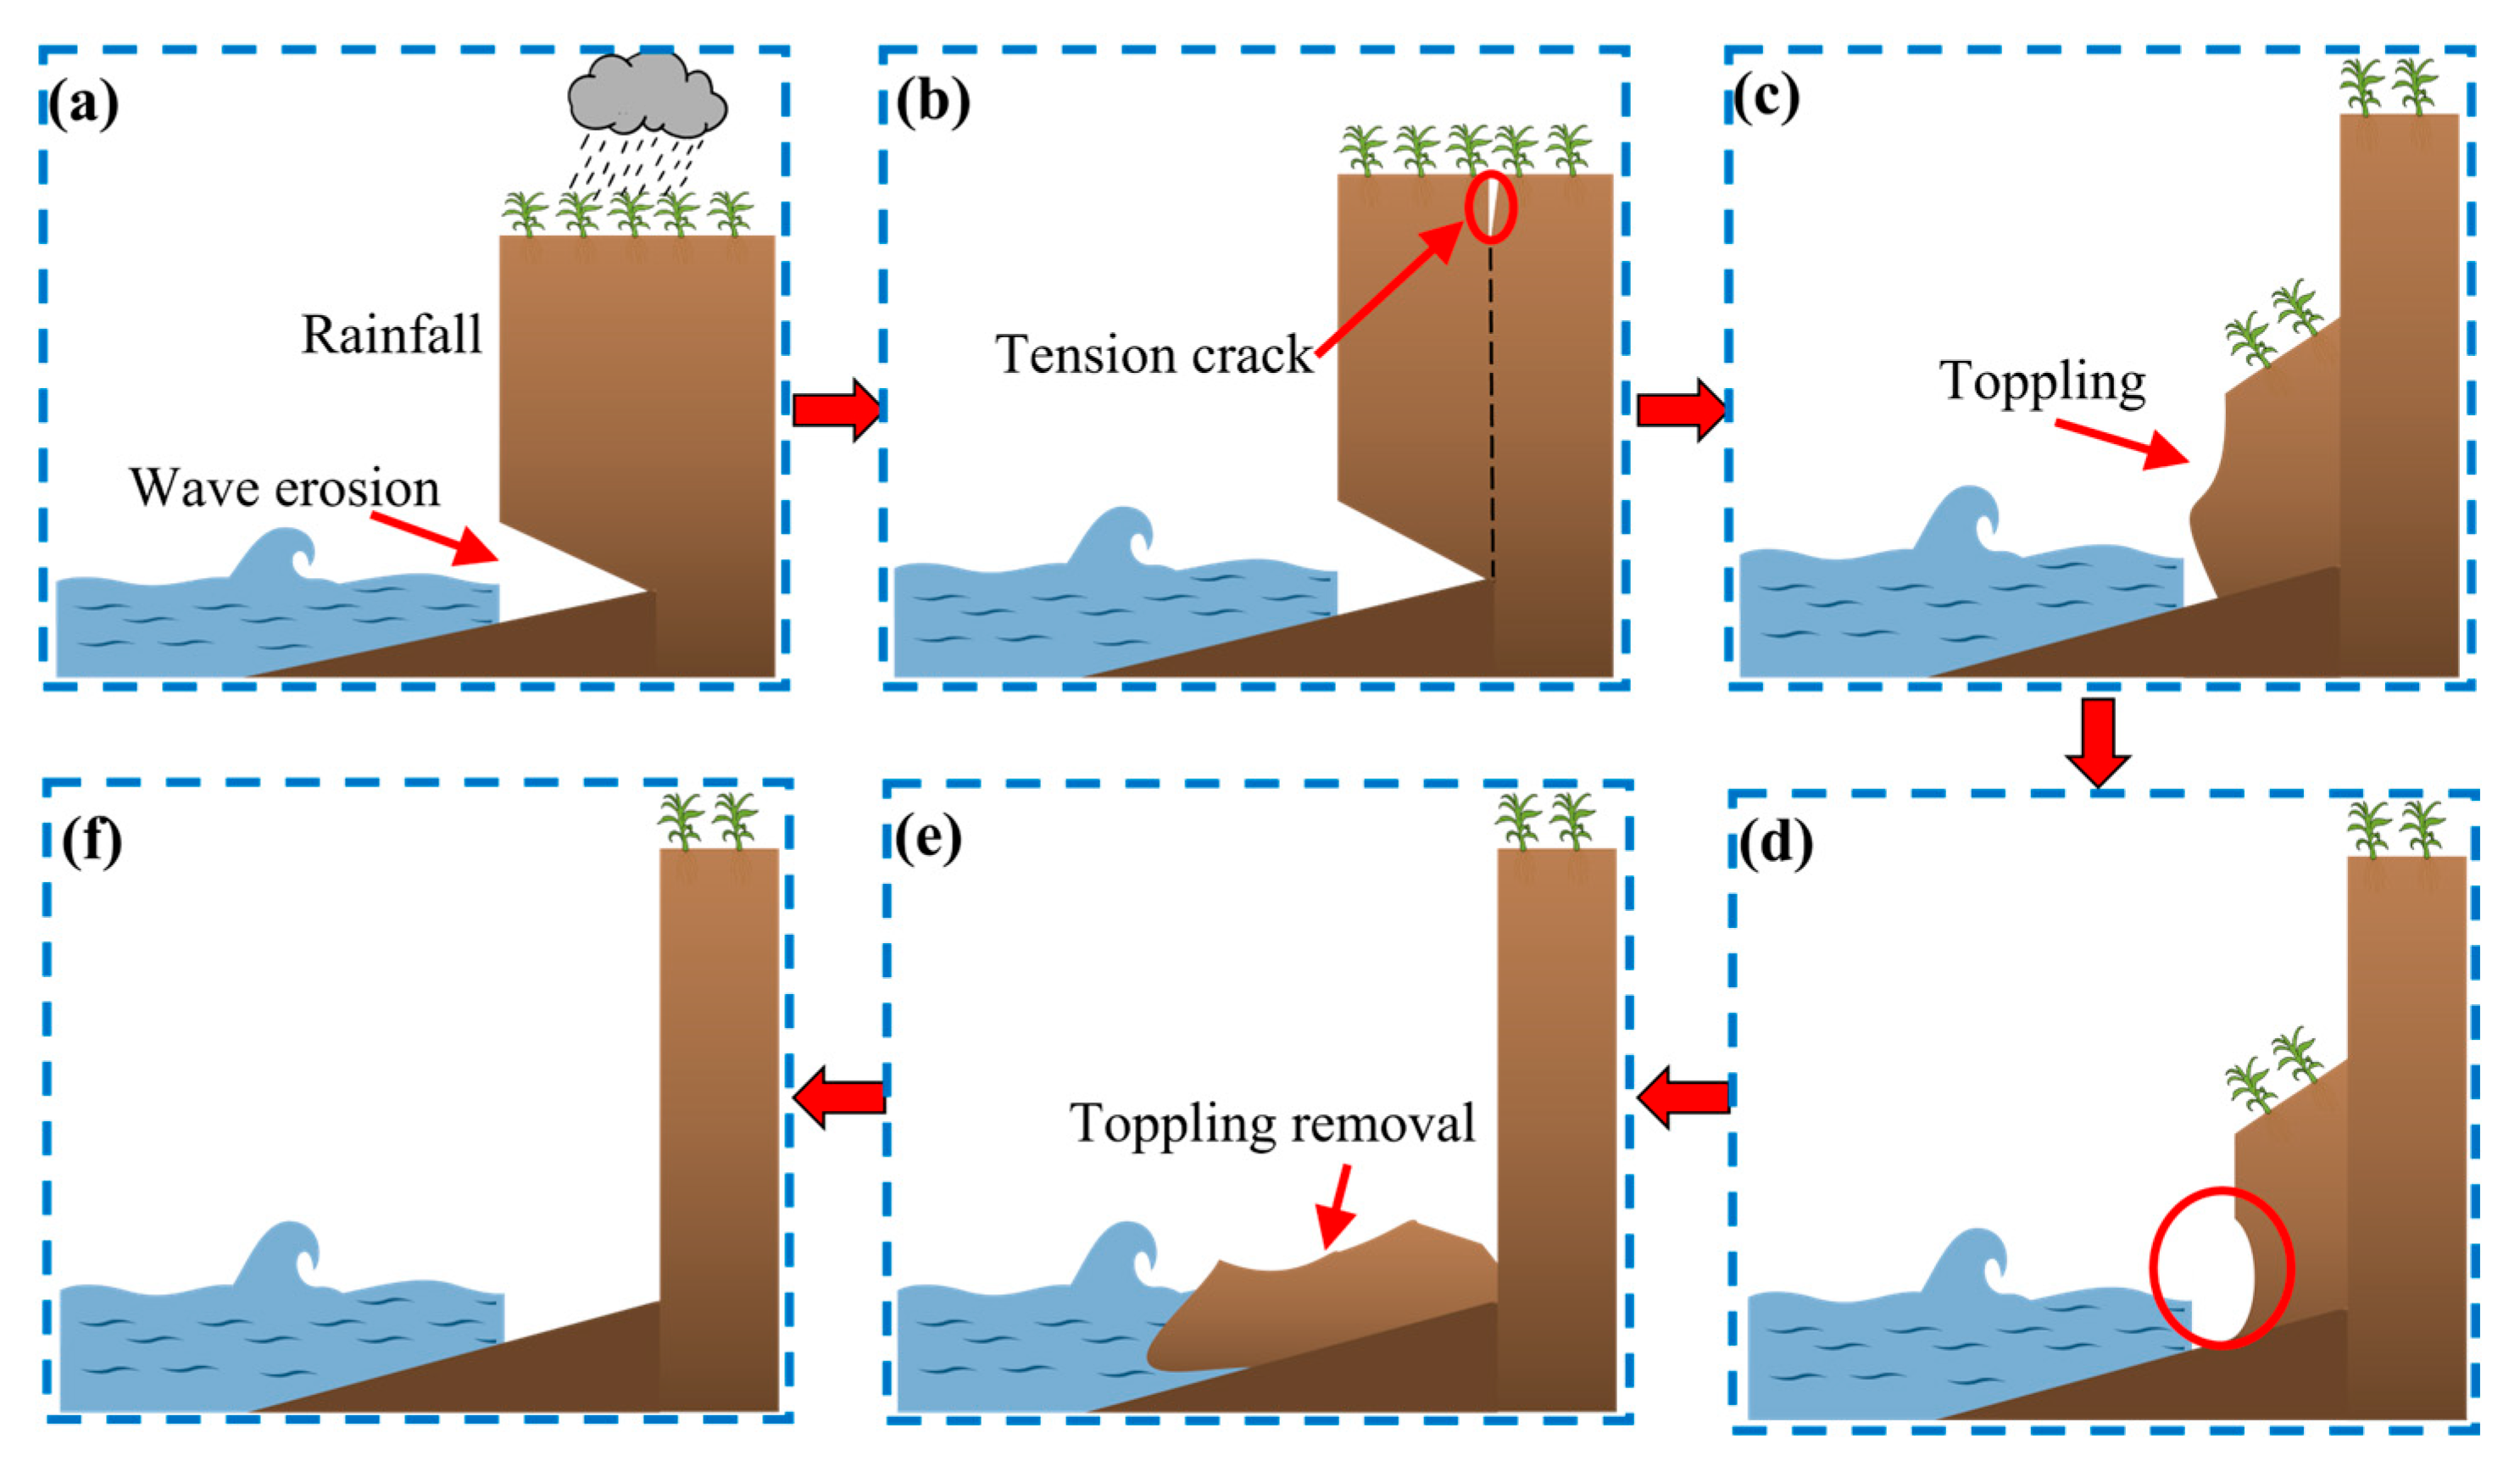
2.2. Evolution Process of Cliff Toppling
3. Methods
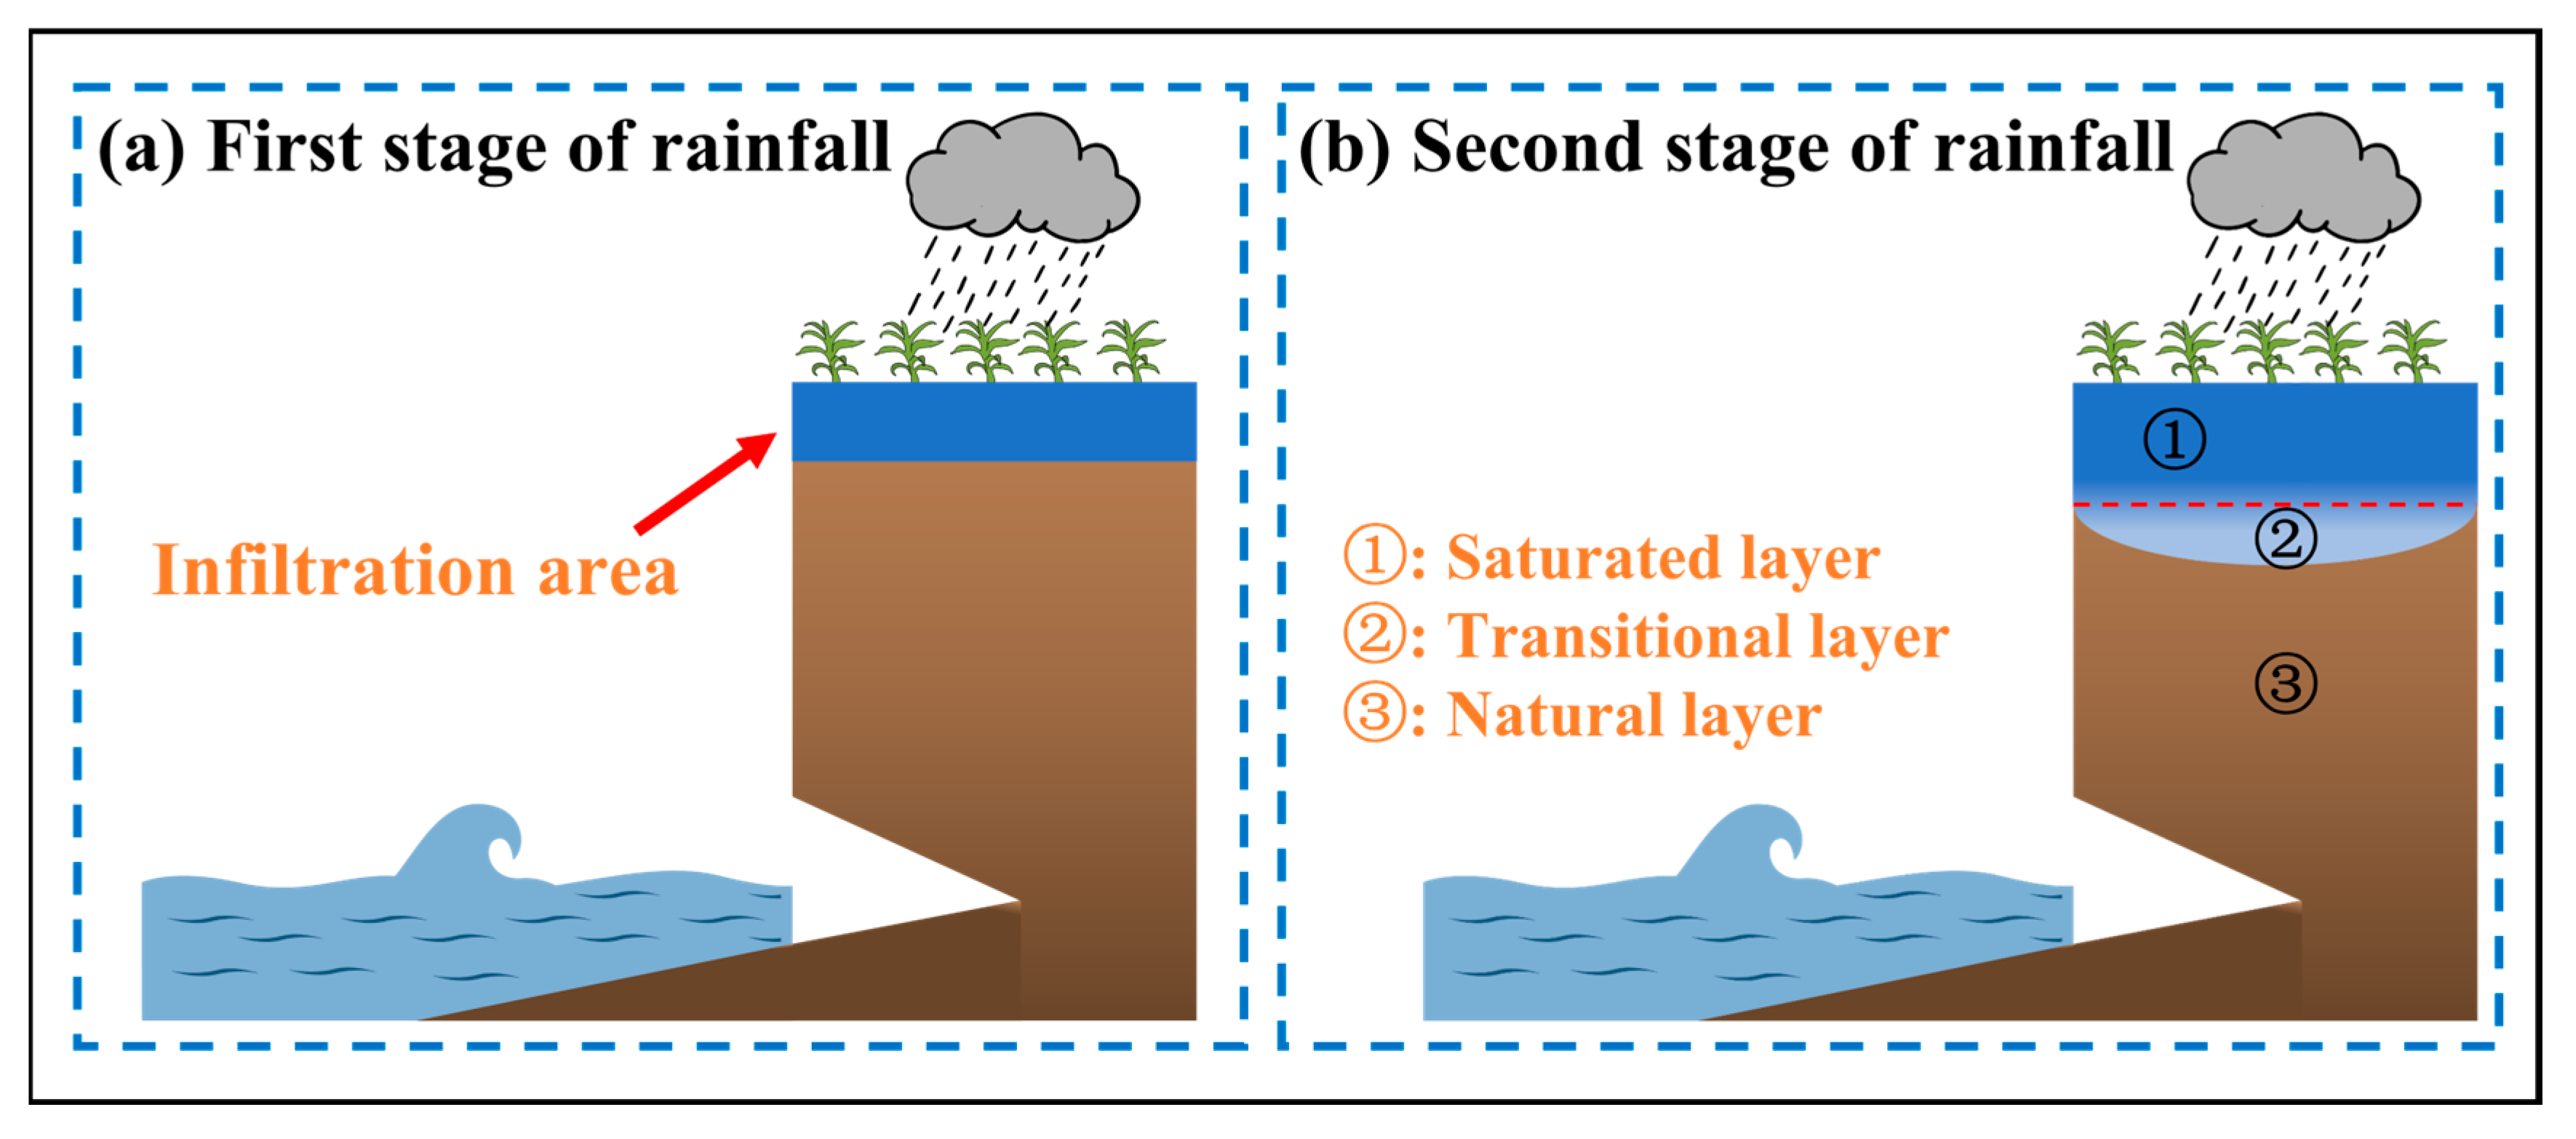
3.1. Rainfall Infiltration Model
3.2. Stability Analysis Model
- (1)
- In the first stage of rainfall, :
- (2)
- In the second stage of rainfall,
3.3. Parametric Selection
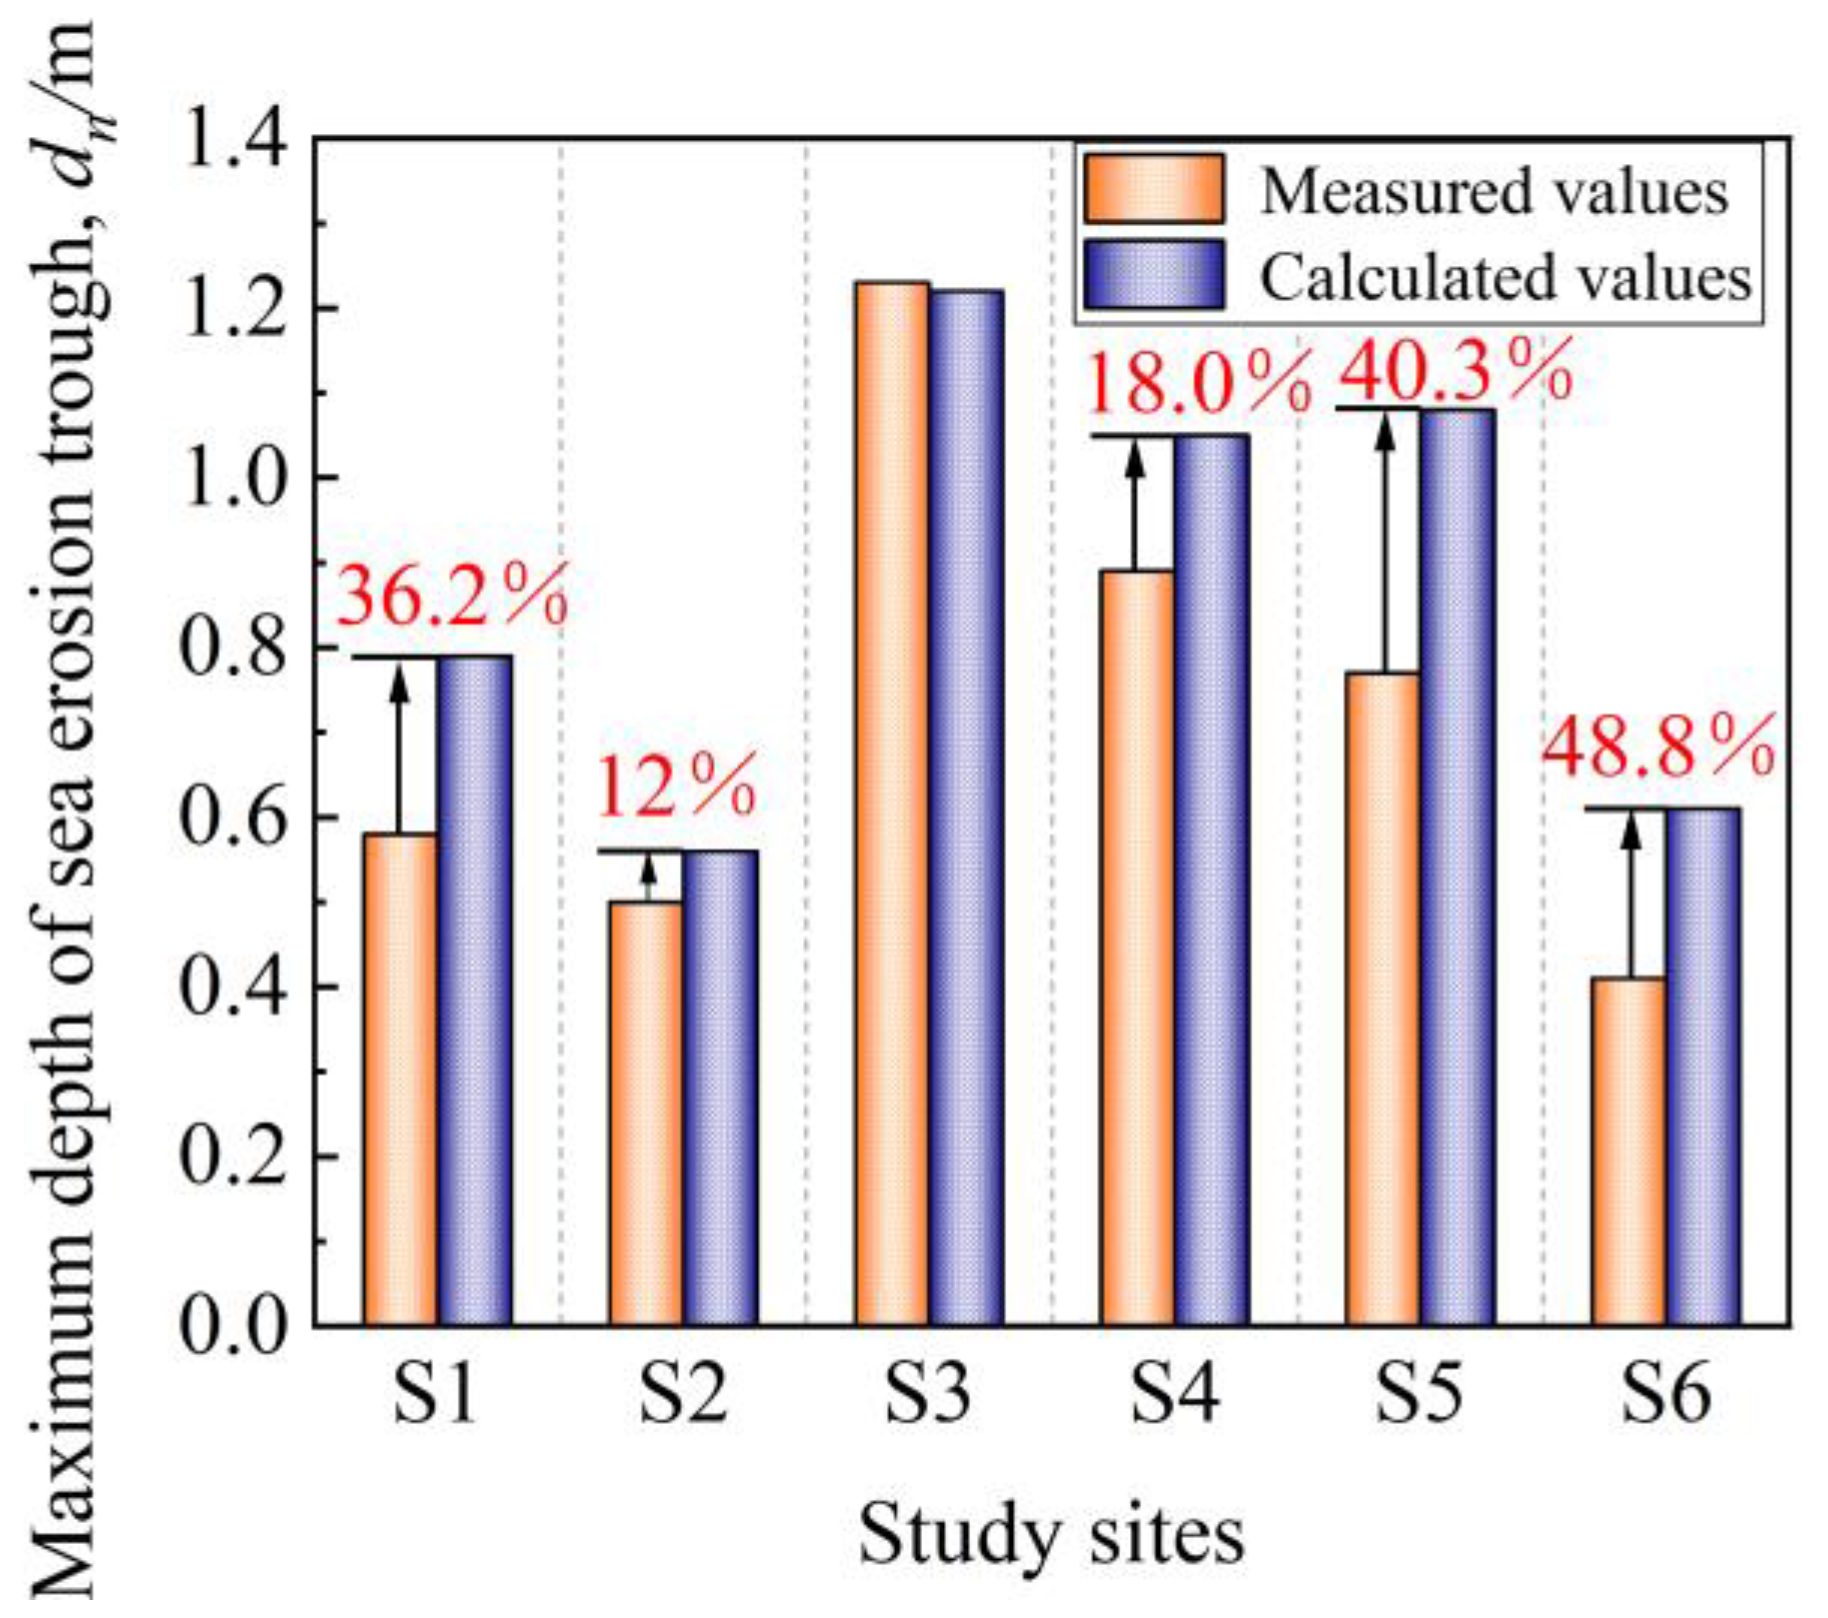
3.4. Model Validation
4. Results
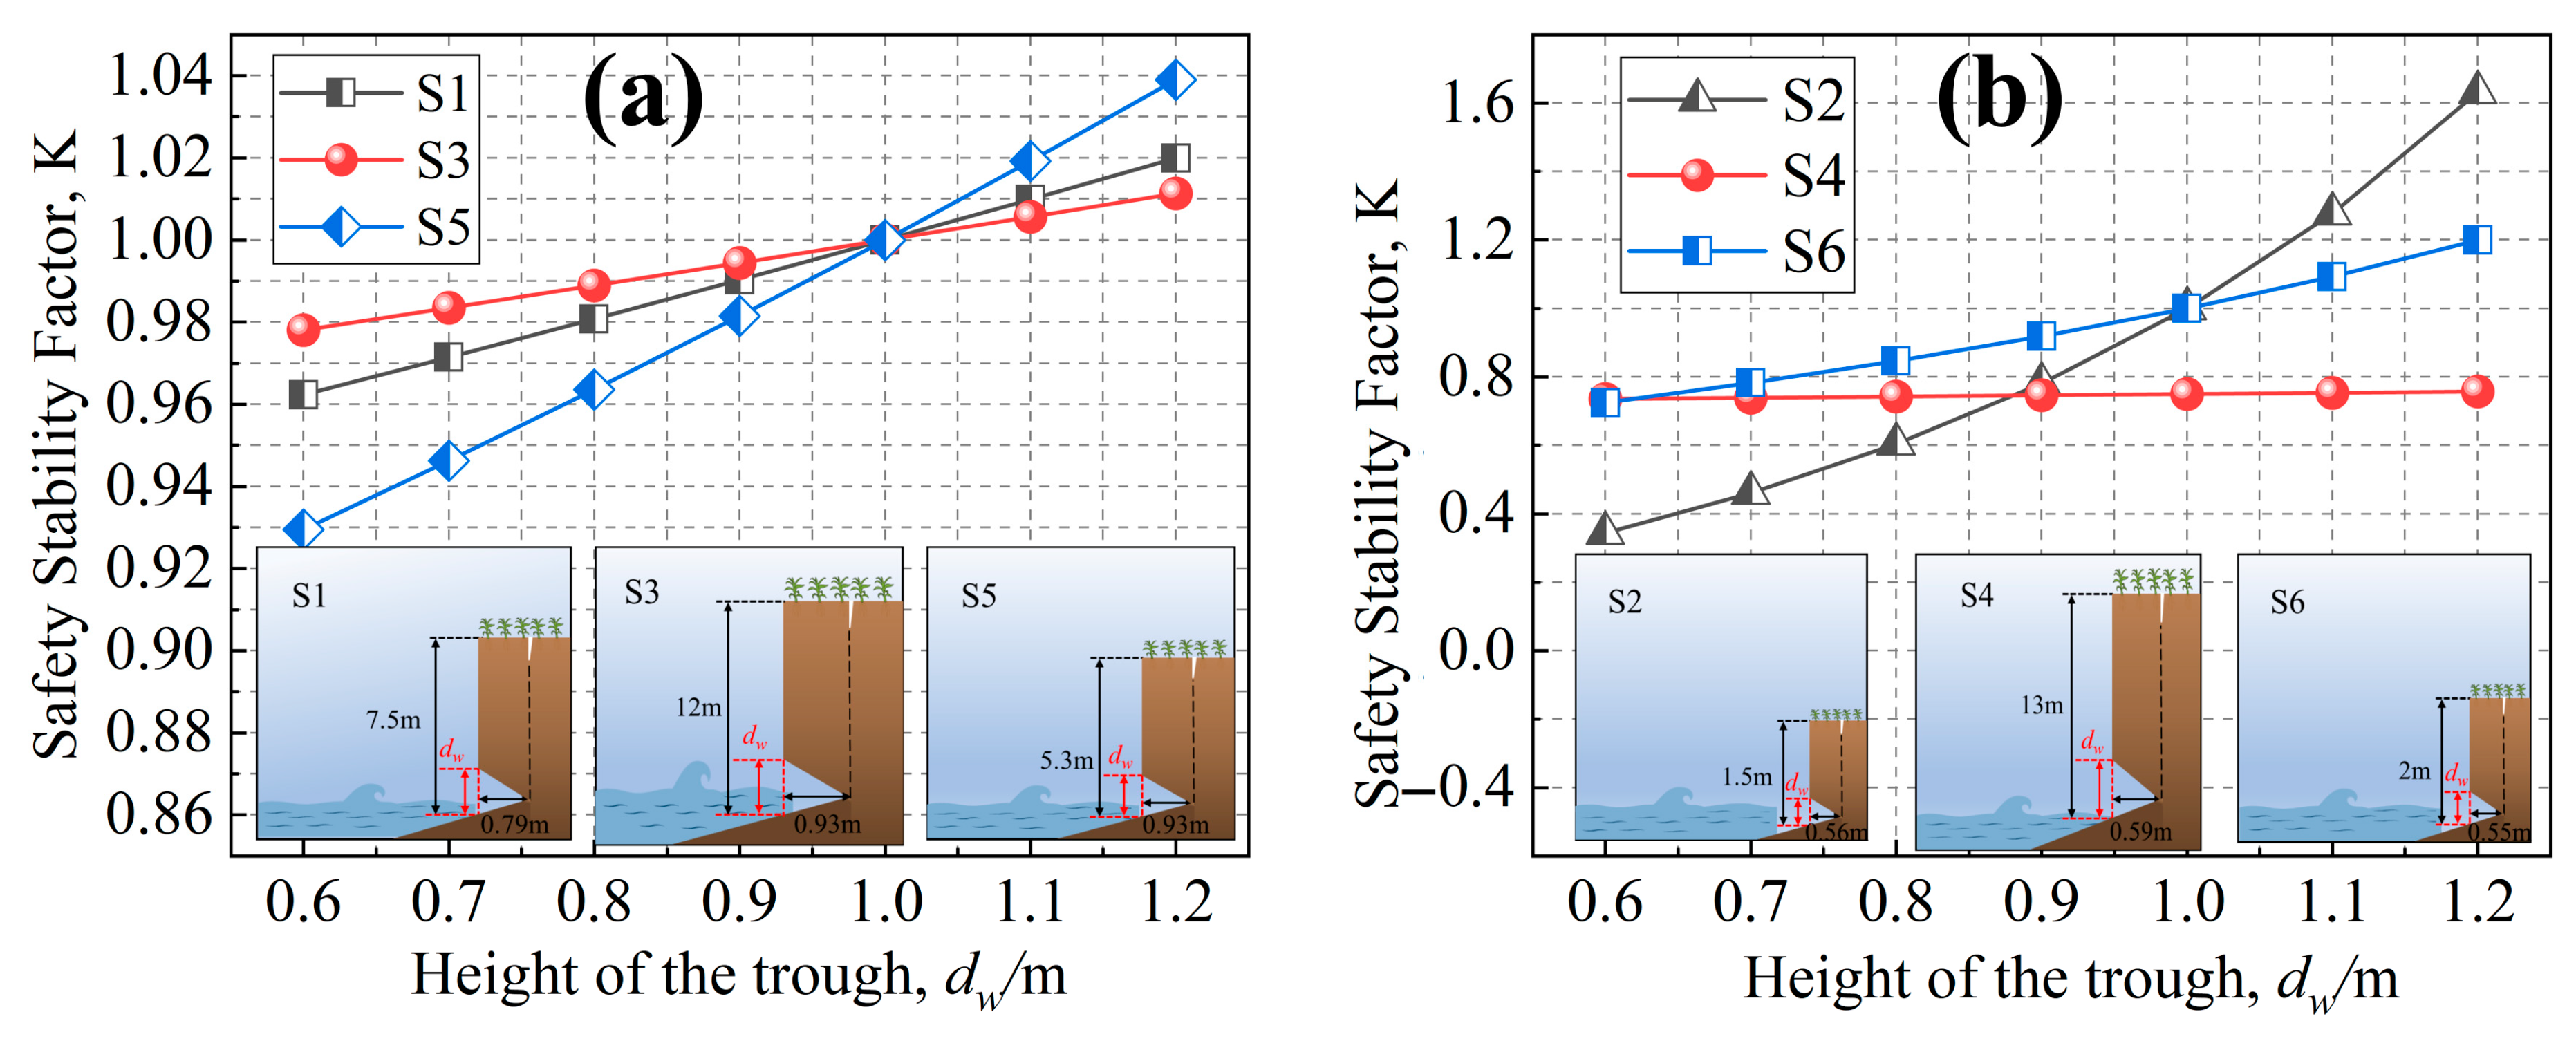
4.1. Trough Height
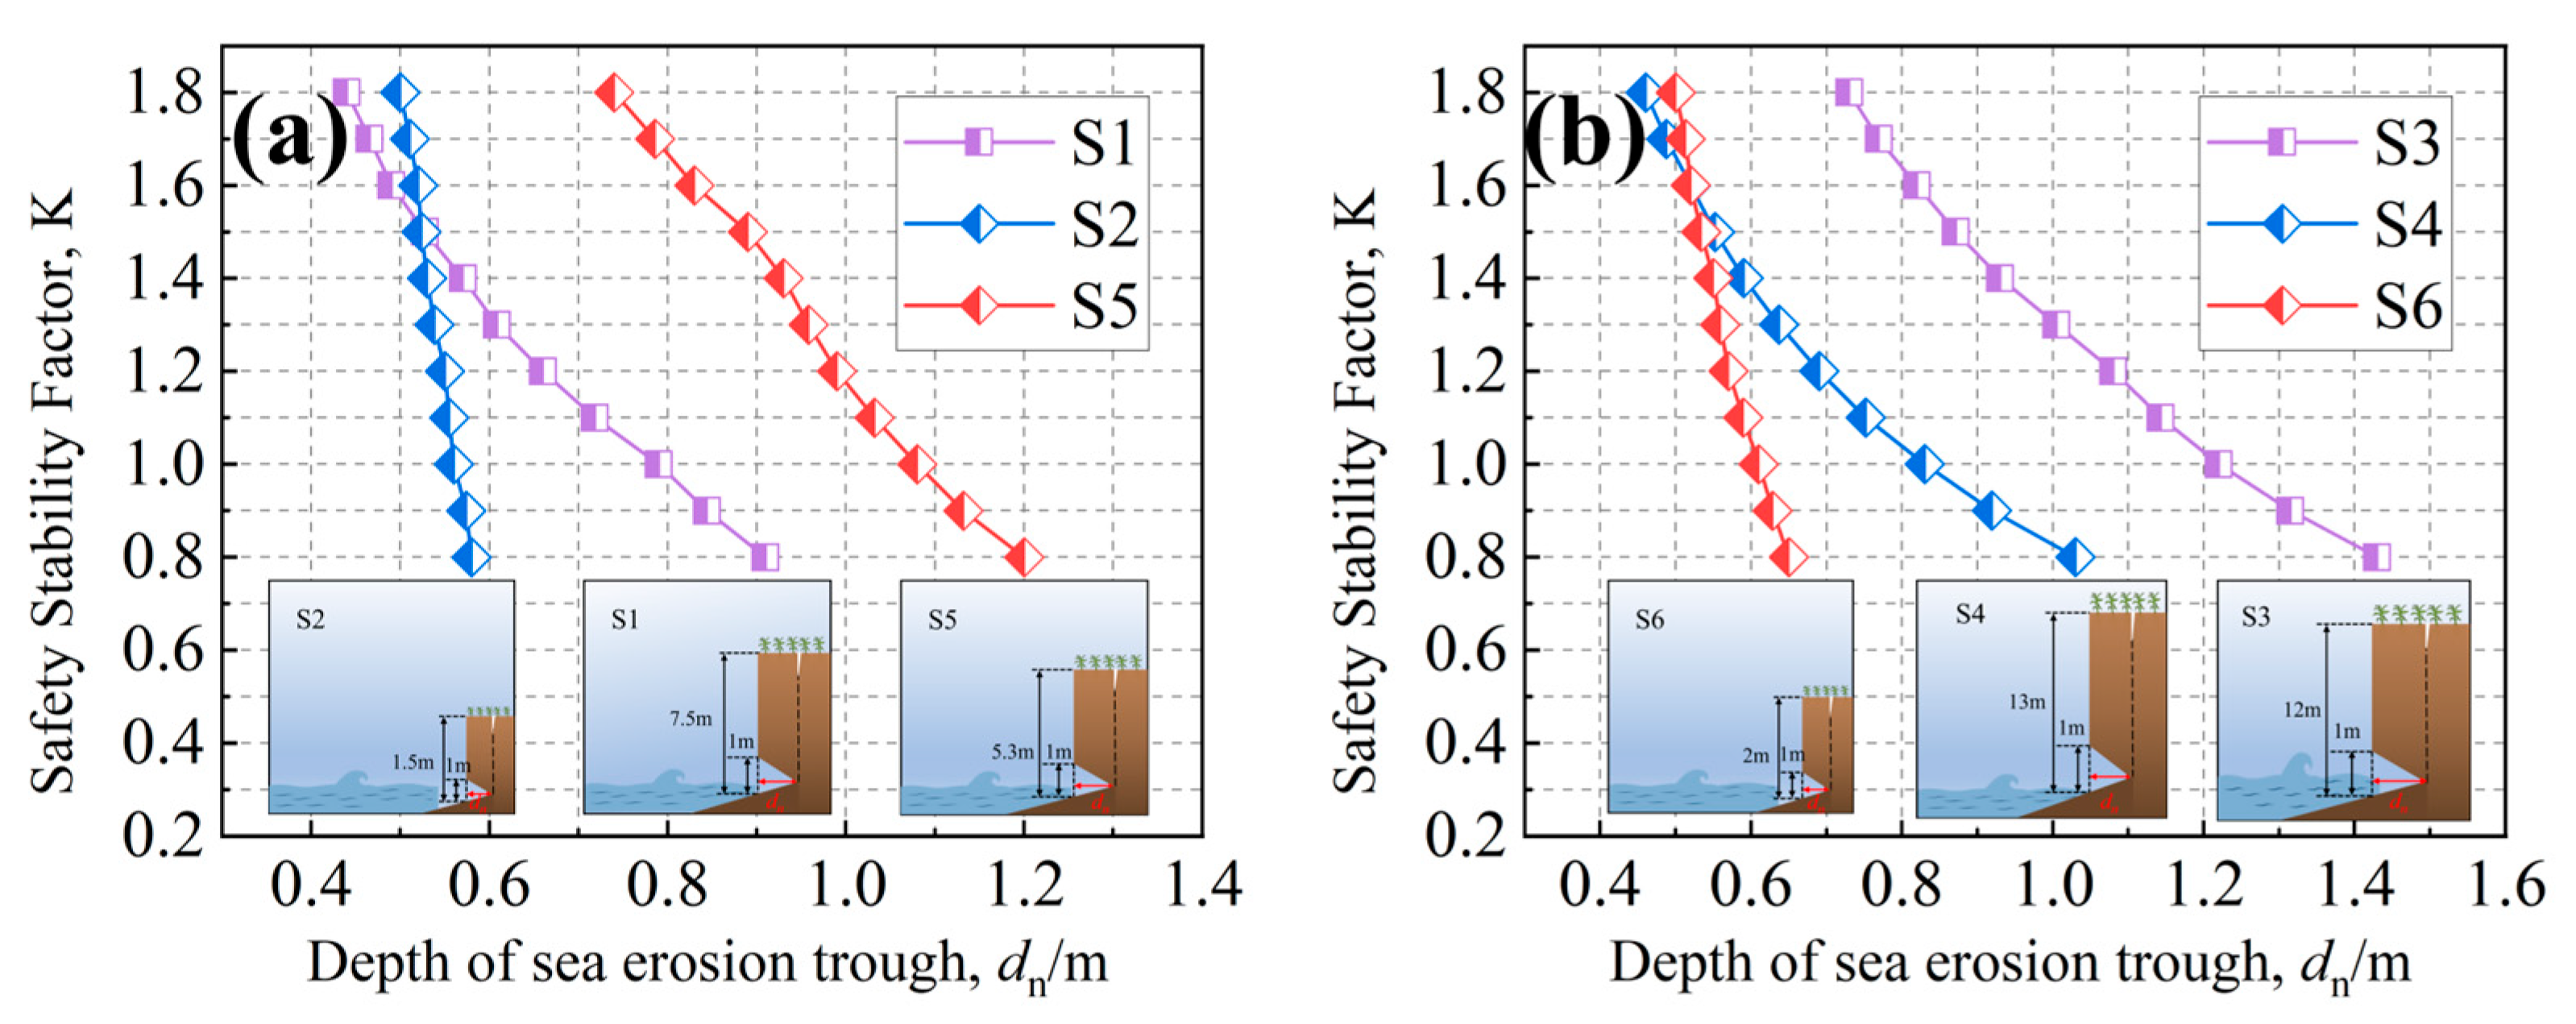
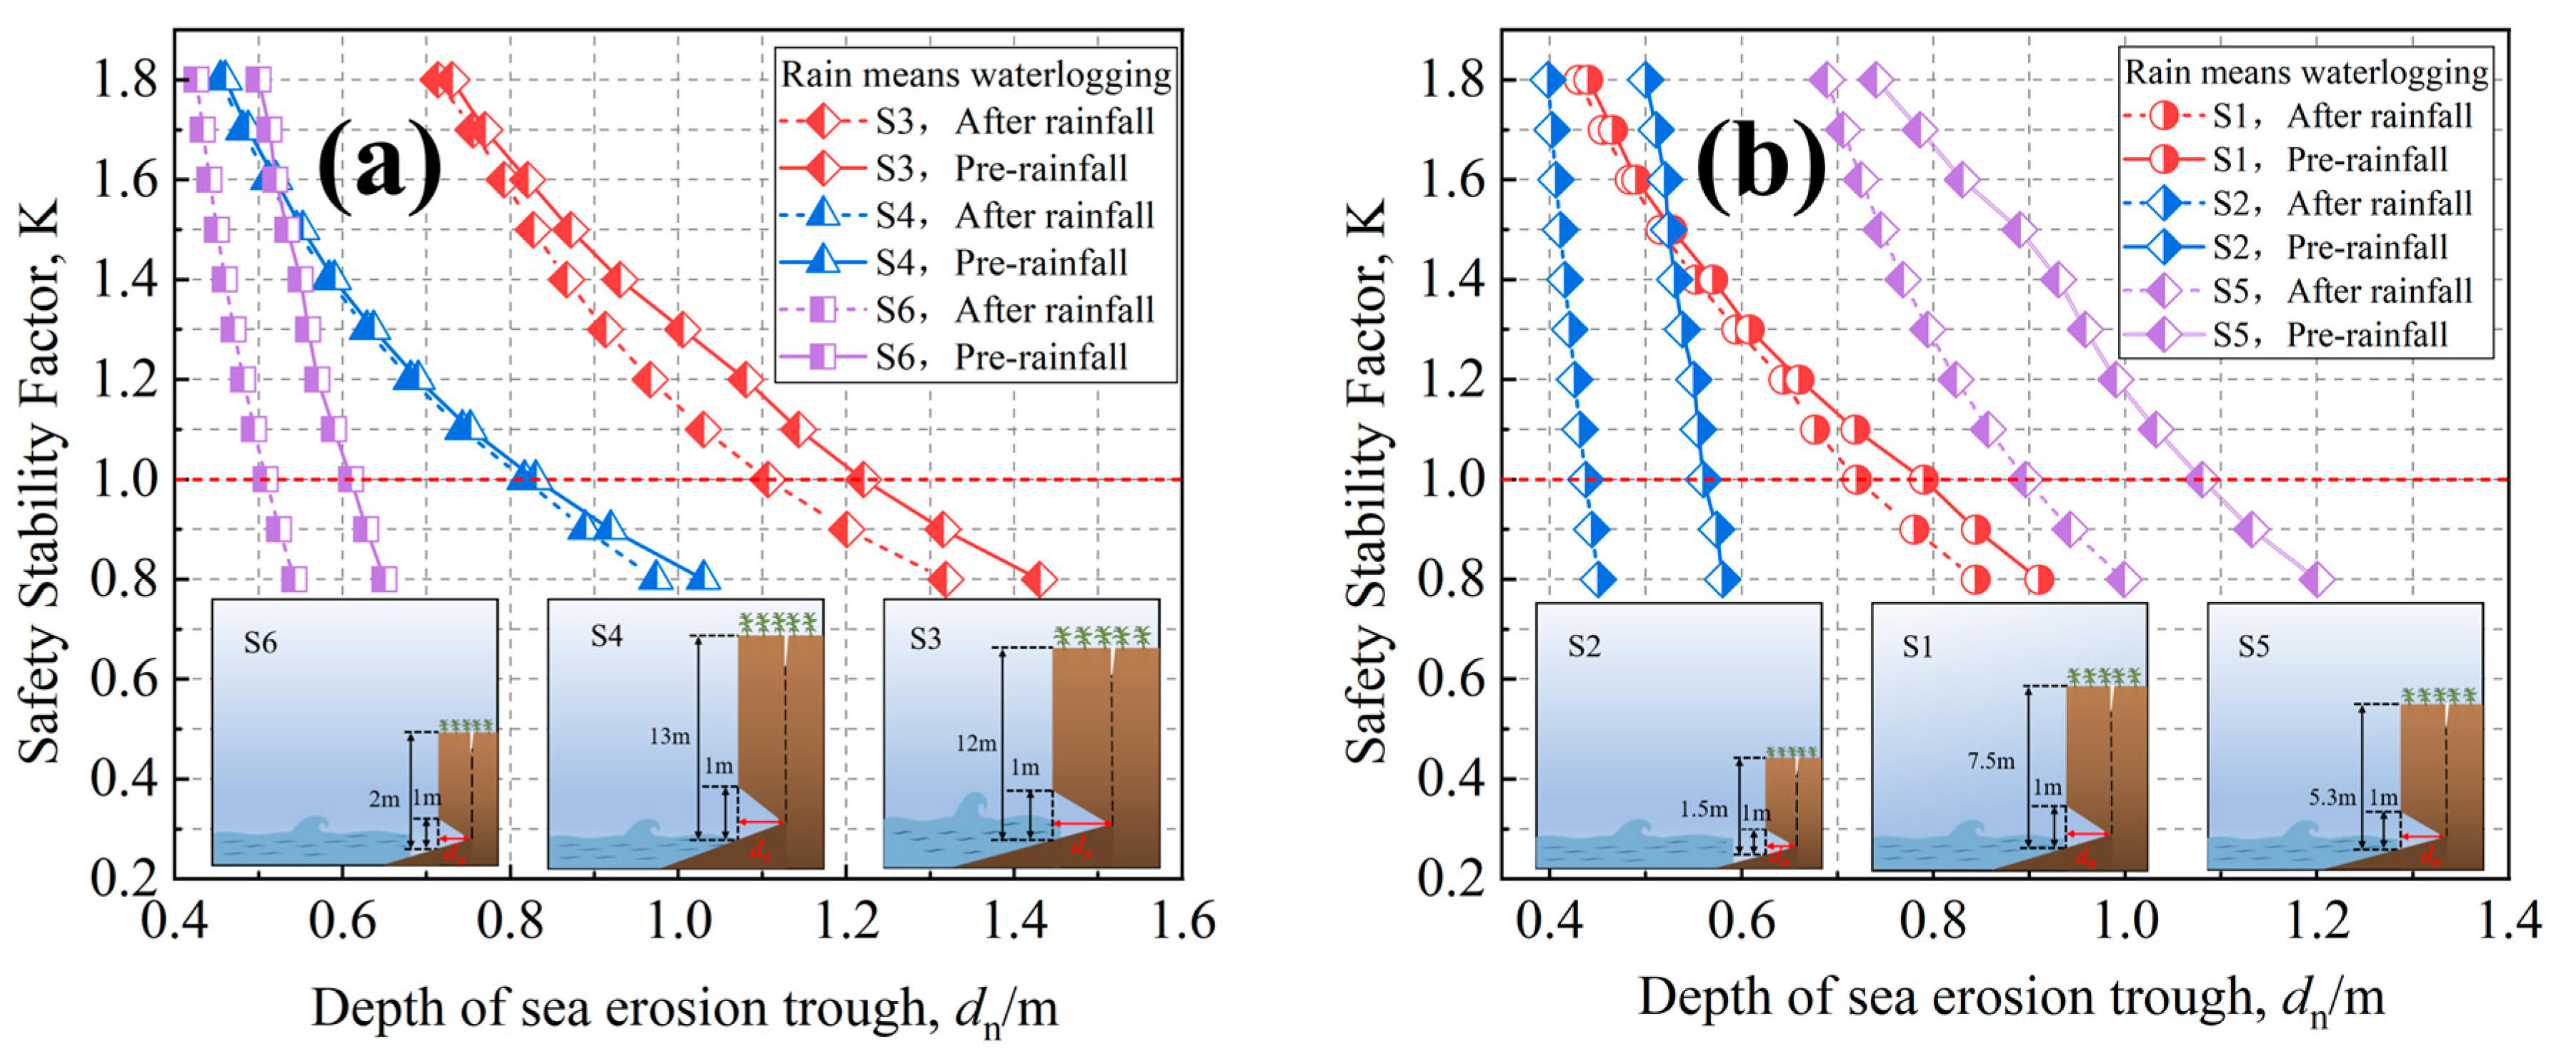
4.2. Trough Depth
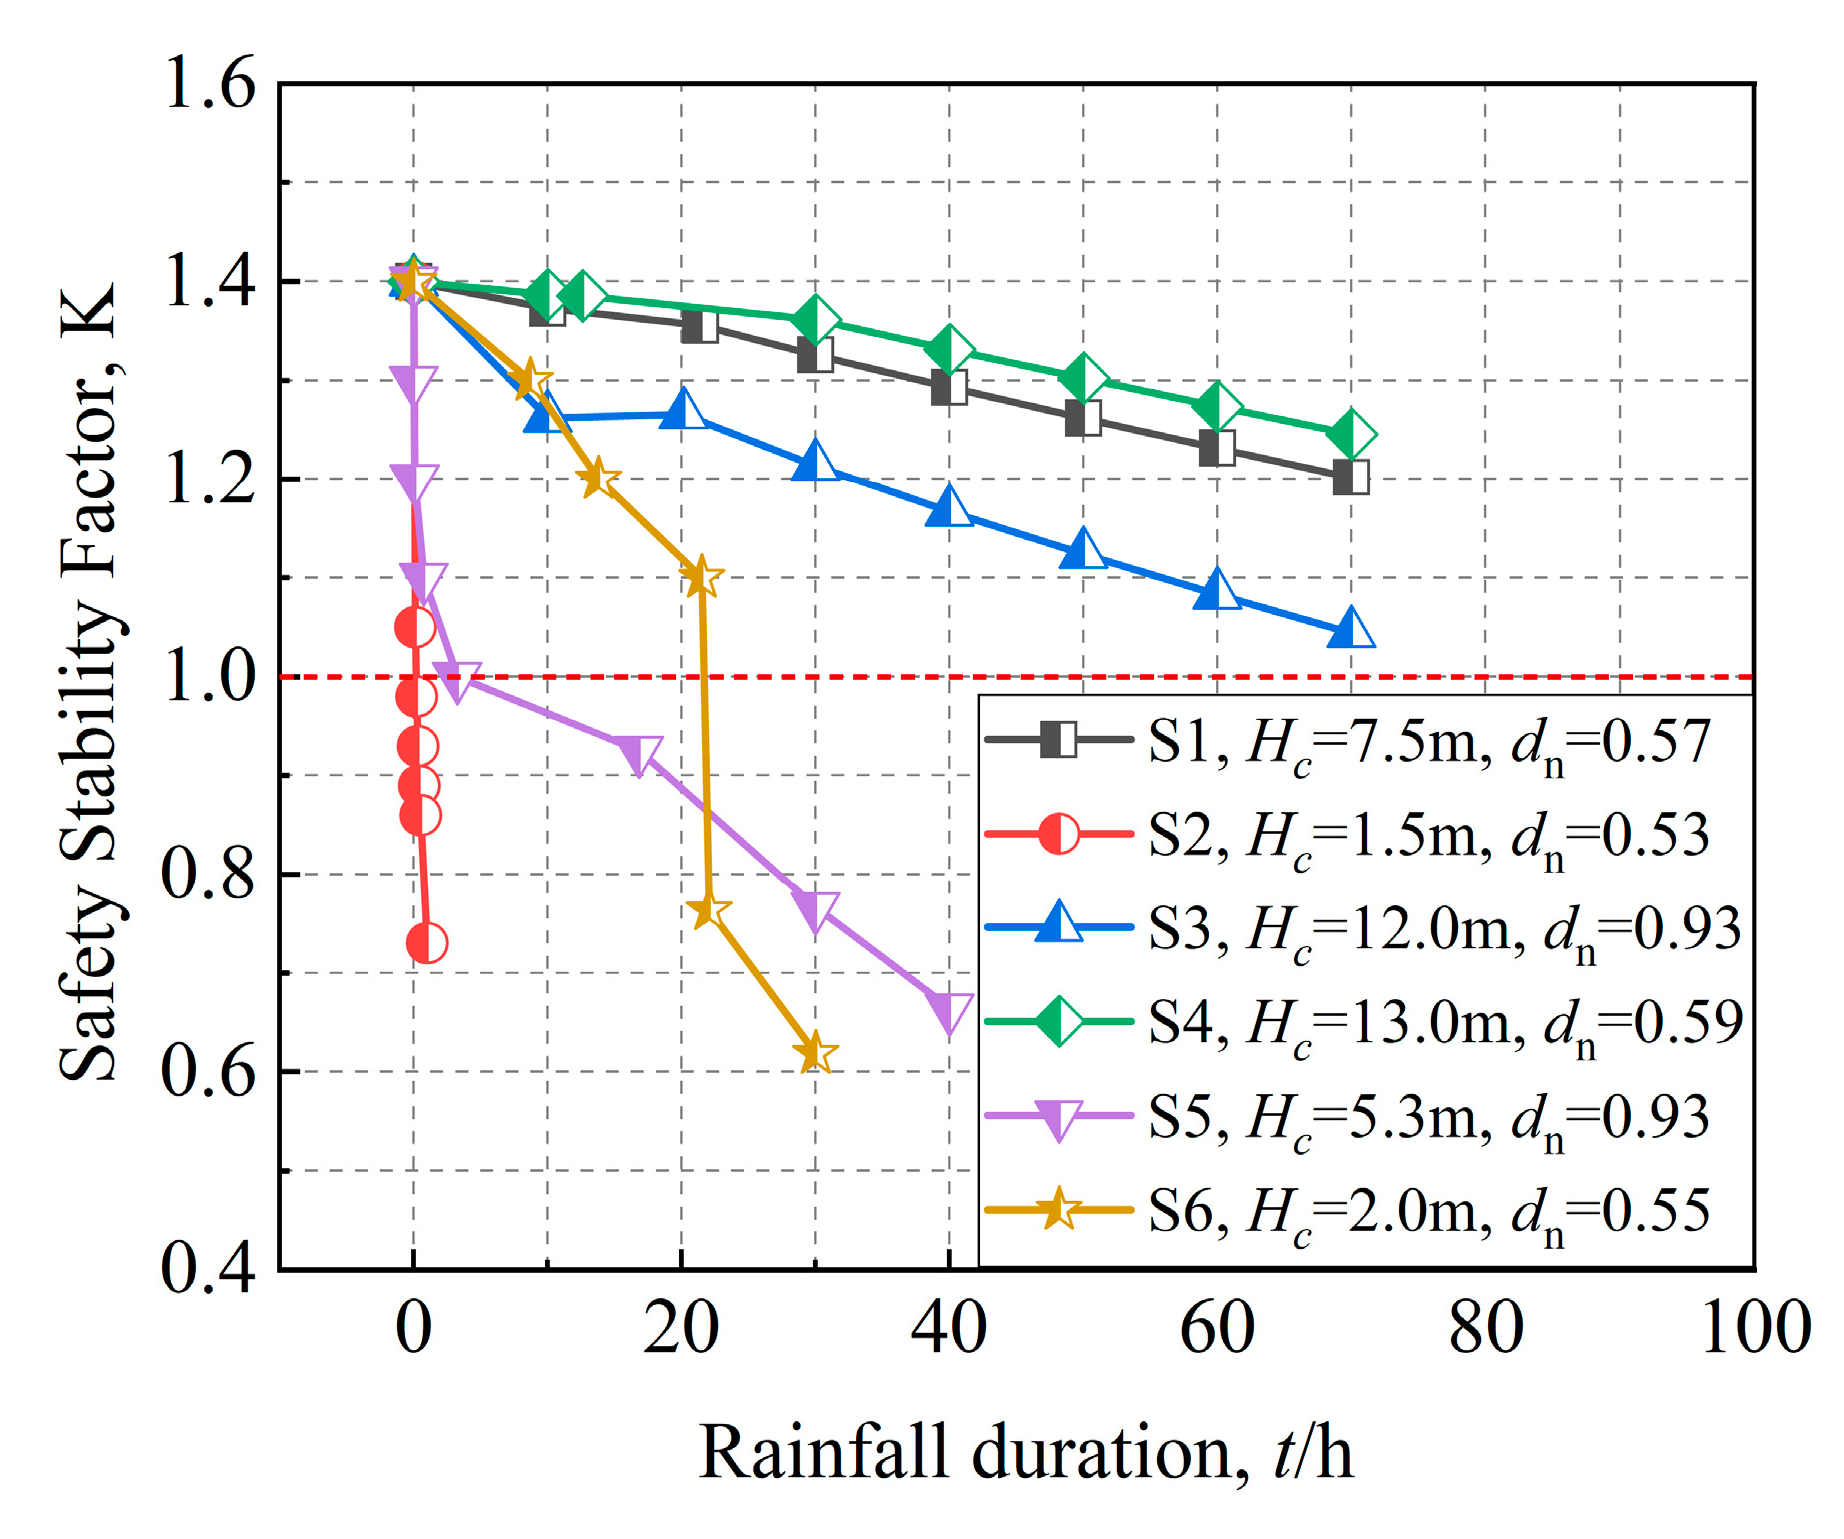
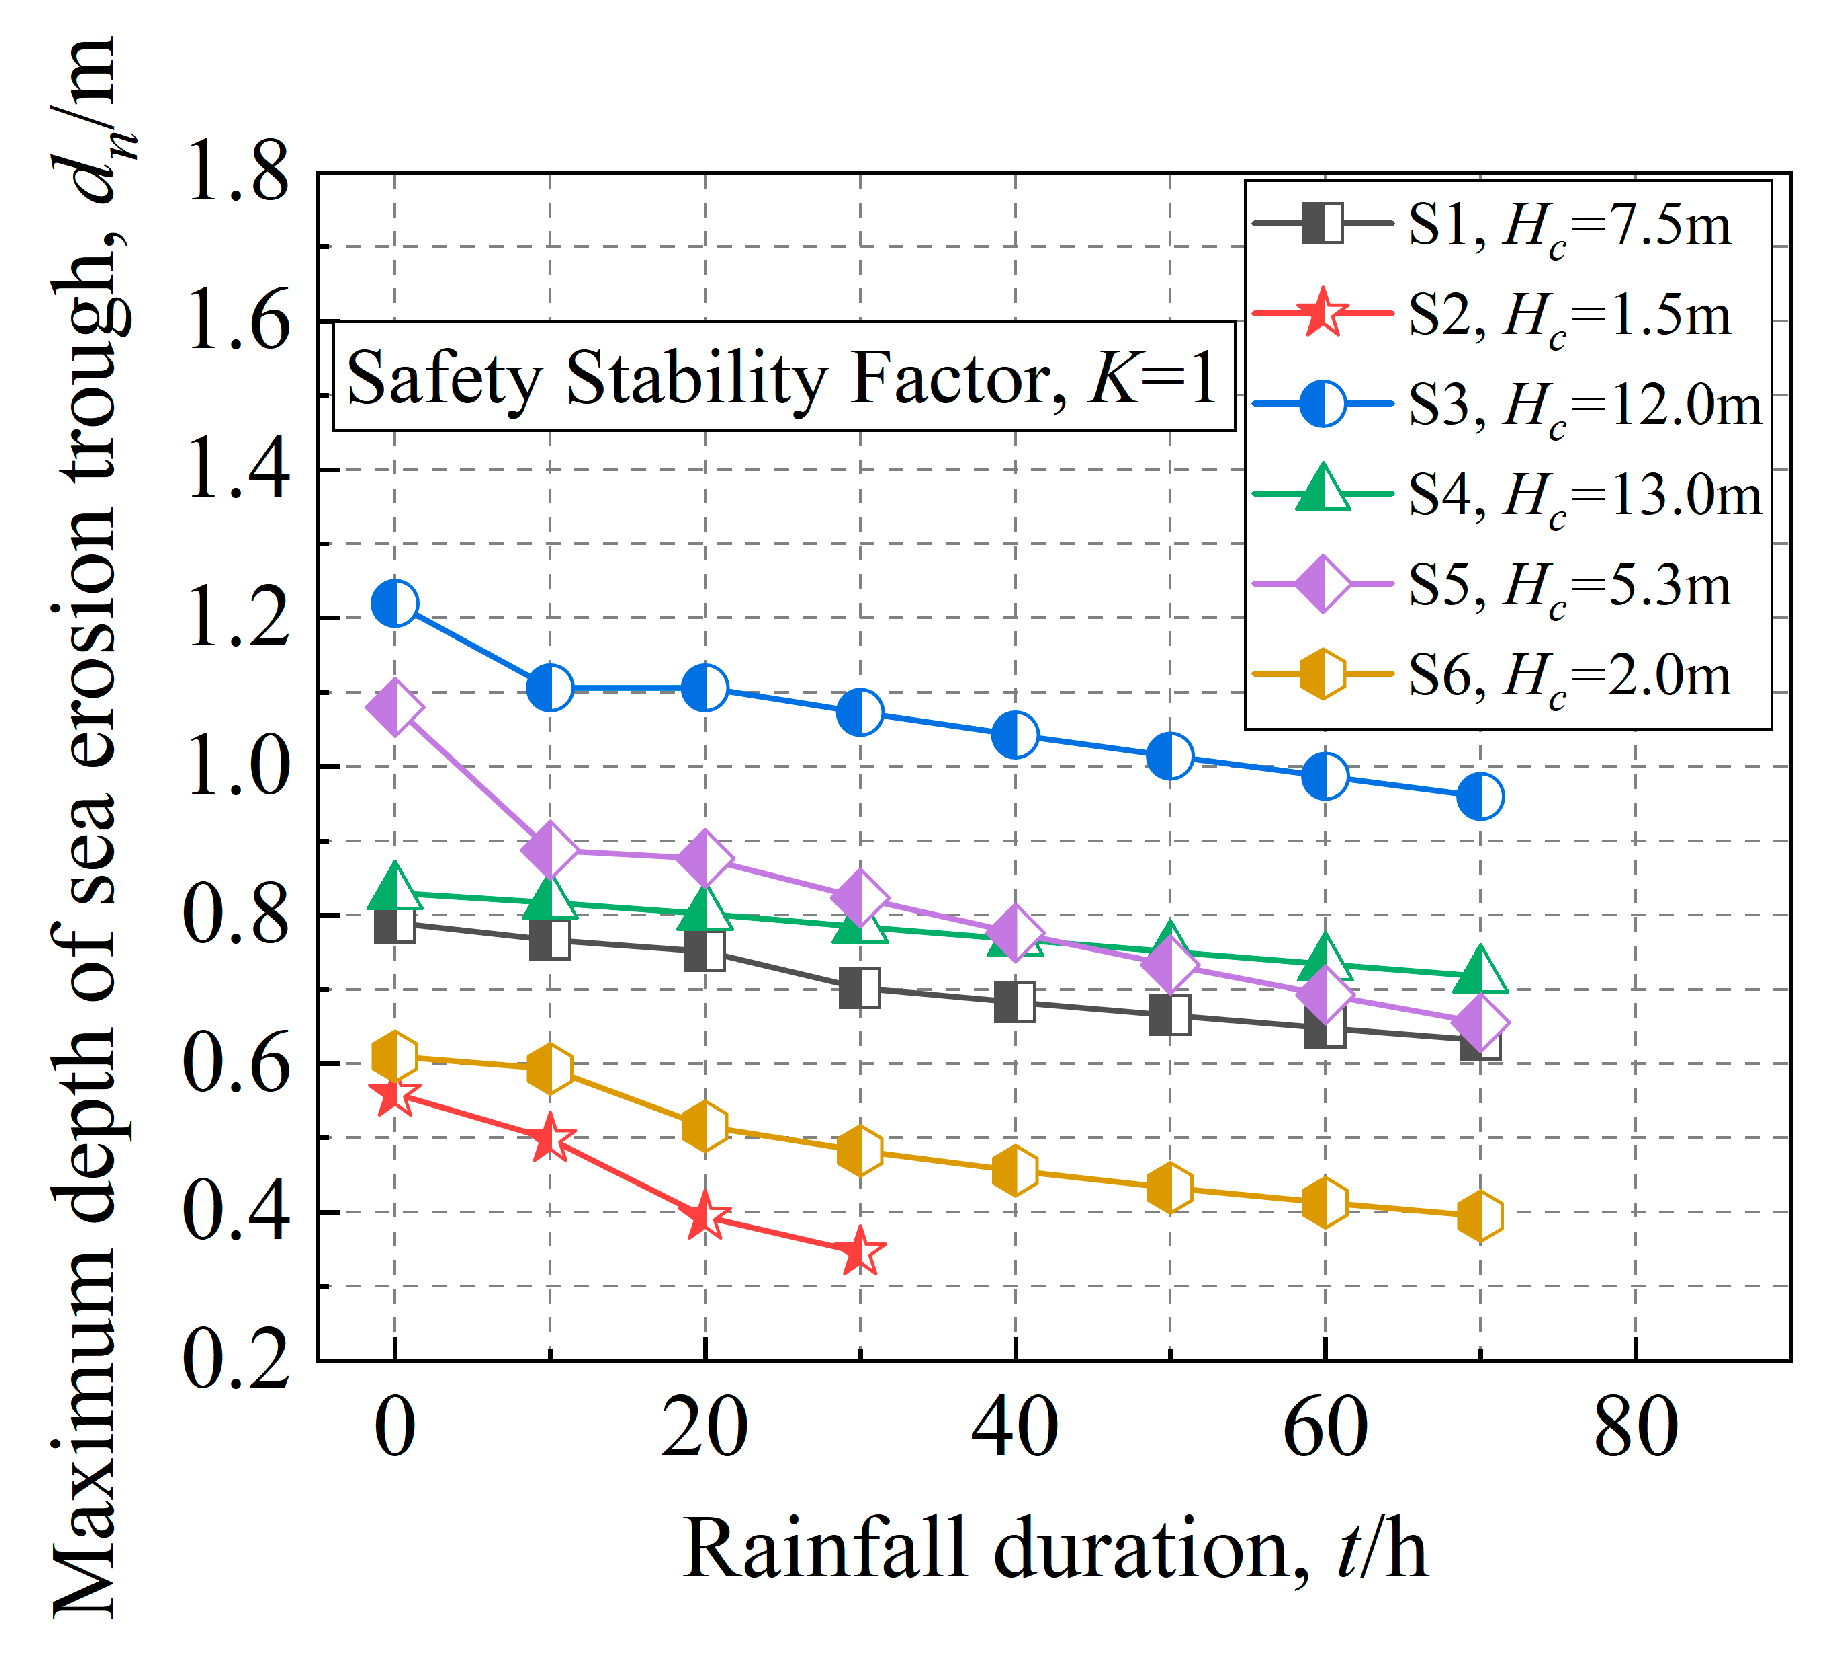
4.3. Rainfall Duration
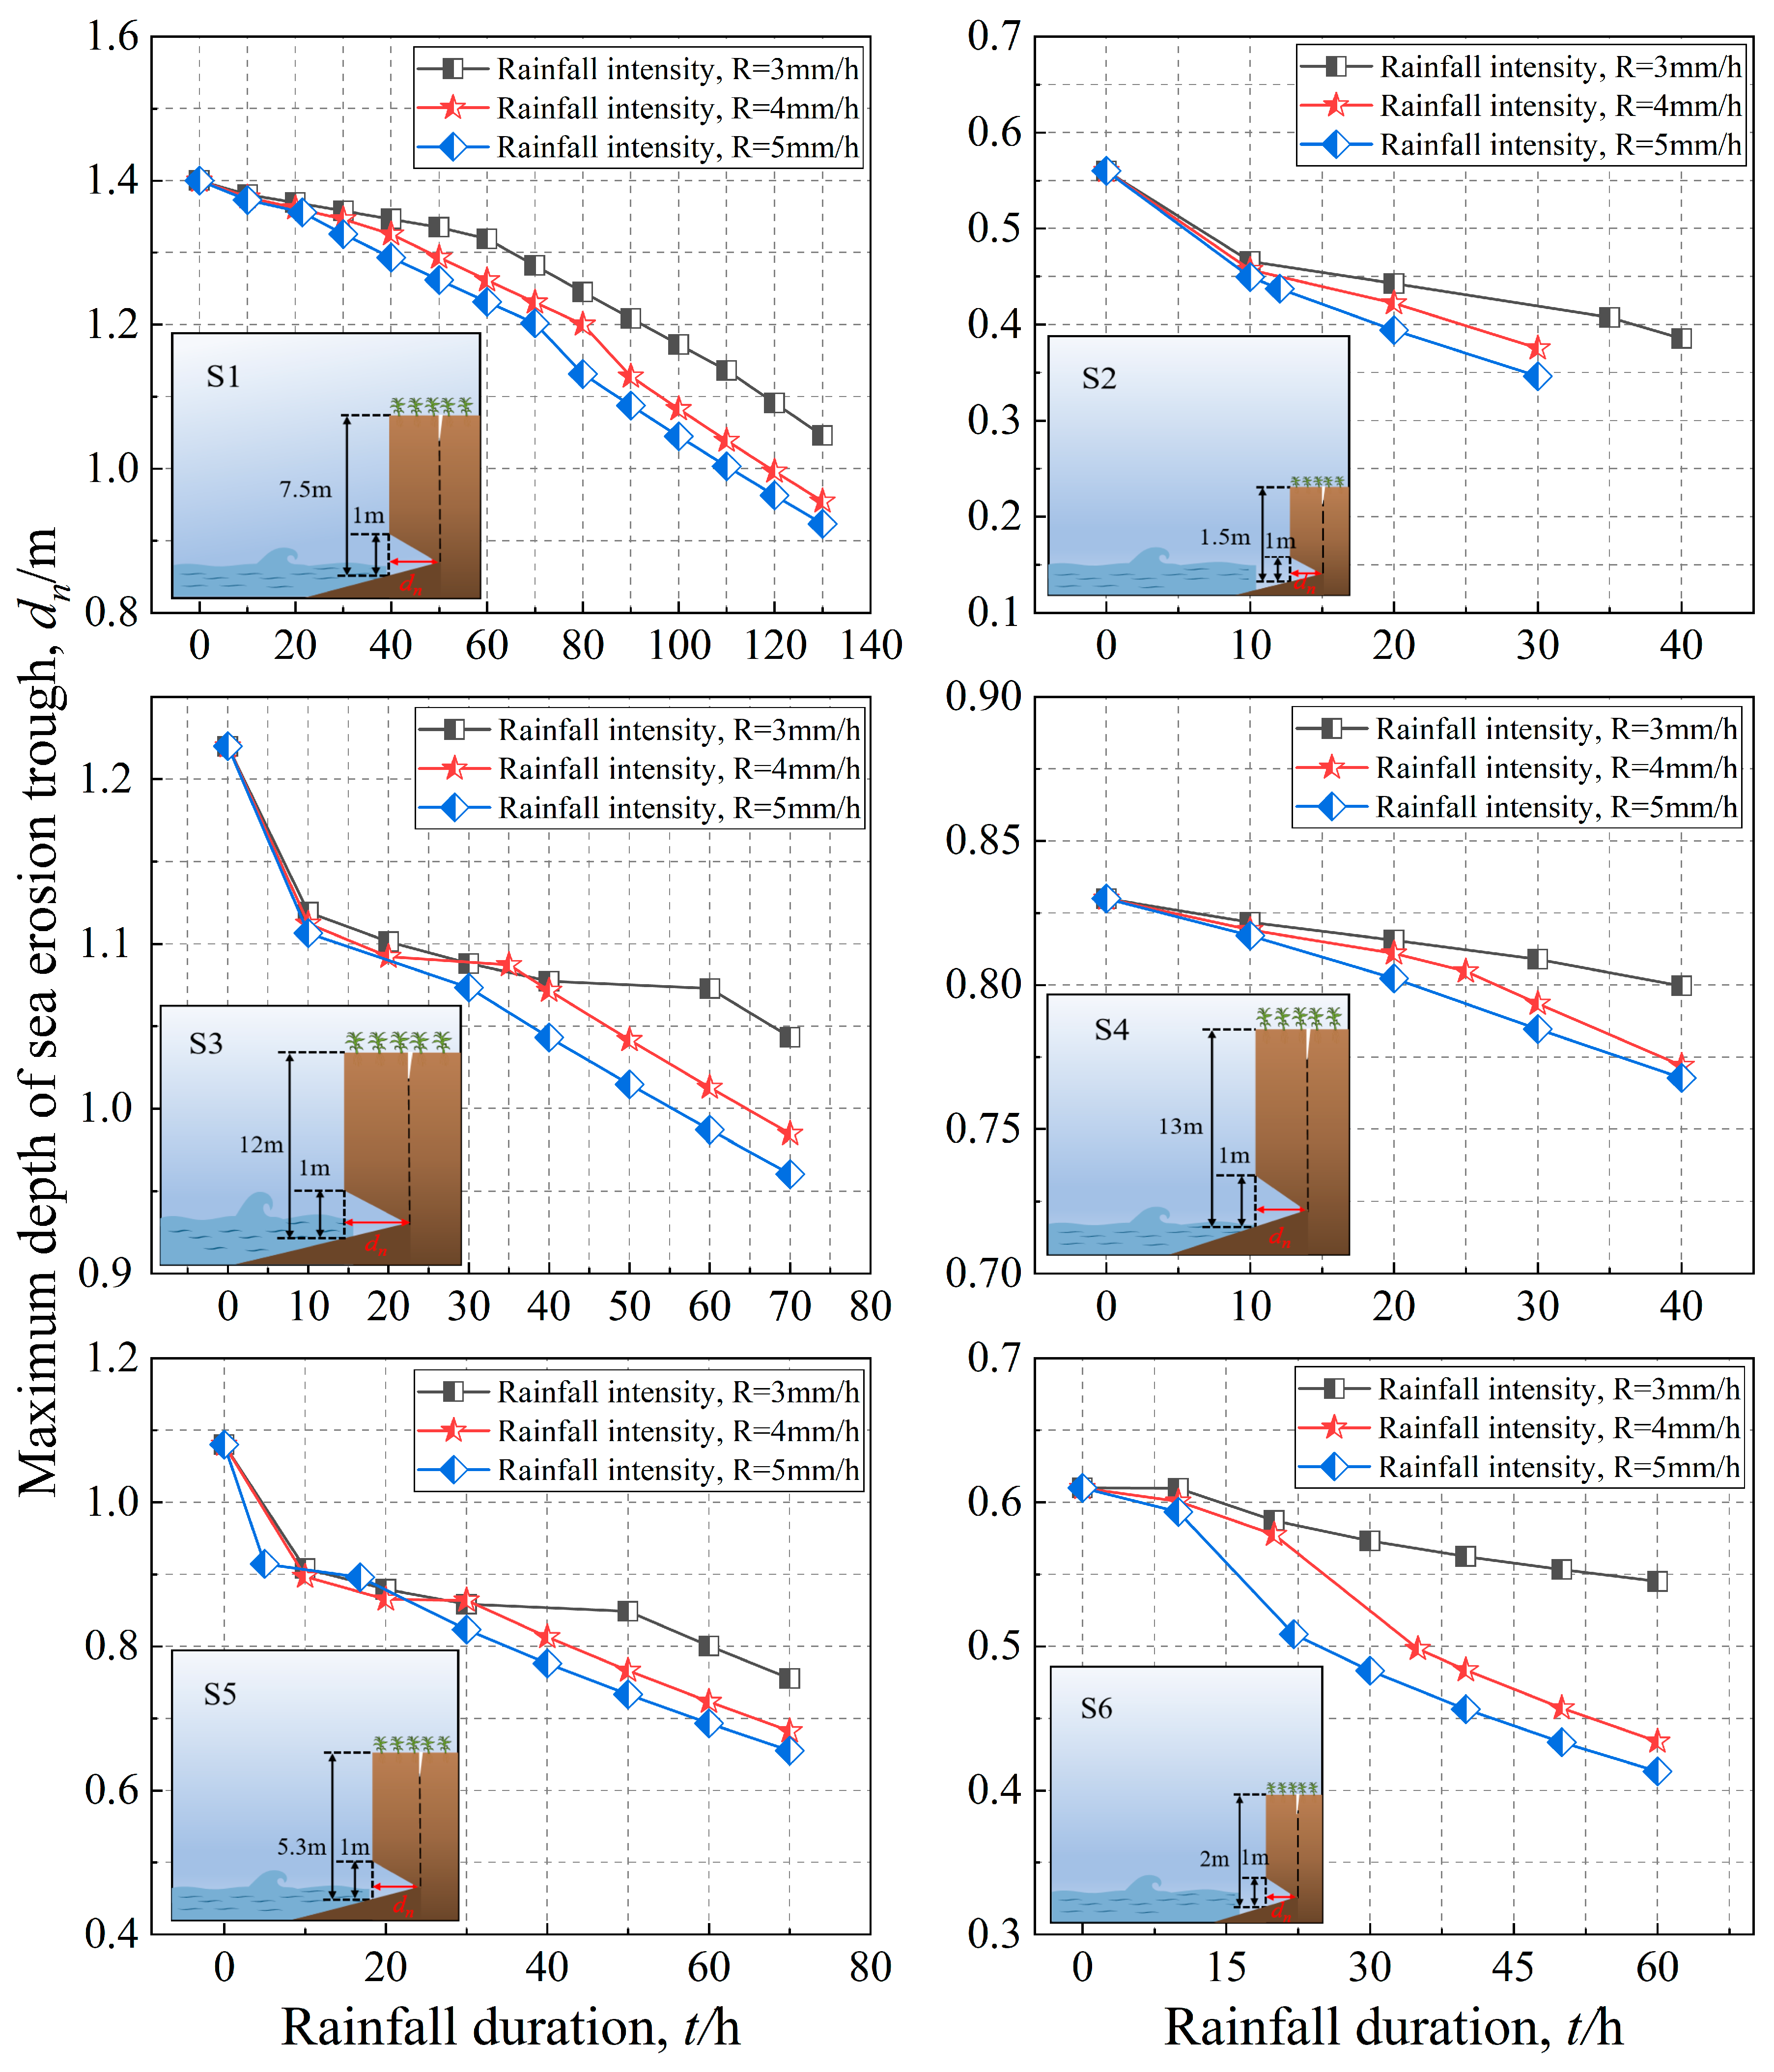
4.4. Rainfall Intensity
5. Discussion
5.1. The Effect of Notch Morphology on the K
5.2. The Effect of Rainfall on the K
6. Conclusions
Author Contributions
Funding
Institutional Review Board Statement
Informed Consent Statement
Data Availability Statement
Conflicts of Interest
Appendix A
References
- Small, C.; Nicholls, R.J. A global analysis of human settlement in coastal zones. J. Coast. Res. 2003, 19, 584–599. [Google Scholar]
- Young, A.P.; Carilli, J.E. Global distribution of coastal cliffs. Earth. Surf. Process. Landf. 2019, 44, 1309–1316. [Google Scholar] [CrossRef]
- Lopez-Saez, J.; Corona, C.; Morel, P.; Rovéra, G.; Dewez, T.J.; Stoffel, M.; Berger, F. Quantification of cliff retreat in coastal quaternary sediments using anatomical changes in exposed tree roots. Earth. Surf. Process. Landf. 2018, 43, 2983–2997. [Google Scholar] [CrossRef]
- Bergillos, R.J.; Rodriguez-Delgado, C.; Medina, L.; Iglesias, G. Coastal cliff exposure and management. Ocean. Coast. Manag. 2020, 198, 105387. [Google Scholar] [CrossRef]
- Chen, C.W.; Saito, H.; Oguchi, T. Analyzing rainfall-induced mass movements in Taiwan using the soil water index. Landslides 2017, 14, 1031–1041. [Google Scholar] [CrossRef]
- Wang, X.; Qin, X.; Tan, J.; Yang, L.; Ou, L.; Duan, X.; Deng, Y. Effect of the moisture content and dry density on the shear strength parameters of collapsing wall in hilly granite areas of south China. Int. Soil. Water. Conserv. Res. 2024, 12, 697–713. [Google Scholar] [CrossRef]
- Huppert, K.L.; Perron, J.T.; Ashton, A.D. The influence of wave power on bedrock sea-cliff erosion in the Hawaiian Islands. Geology 2020, 48, 499–503. [Google Scholar] [CrossRef]
- Trenhaile, A.S. Hard-Rock Coastal Modelling: Past Practice and Future Prospects in a Changing World. J. Mar. Sci. Eng. 2019, 7, 34. [Google Scholar] [CrossRef]
- Kogure, T.; Aoki, H.; Maekado, A.; Hirose, T.; Matsukura, Y. Effect of the development of notches and tension cracks on instability of limestone coastal cliffs in the Ryukyus, Japan. Geomorphology 2006, 80, 236–244. [Google Scholar] [CrossRef]
- Trenhaile, A.S. Coastal notches: Their morphology, formation, and function. Earth-Sci. Rev. 2015, 150, 285–304. [Google Scholar] [CrossRef]
- Dai, F.C.; Lee, C.F. Terrain-based mapping of landslide susceptibility using a geographical information system: A case study. Can. Geotech. J. 2001, 38, 911–923. [Google Scholar] [CrossRef]
- Fall, M.A. GIS-based mapping of historical coastal cliff recession. Bull. Eng. Geol. Environ. 2009, 68, 473–482. [Google Scholar] [CrossRef]
- Marques, F.M.S.F.; Matildes, R.; Redweik, P. Sea cliff instability susceptibility at regional scale: A statistically based assessment in the southern Algarve, Portugal. Nat. Hazards. Earth. Syst. Sci. 2013, 13, 3185–3203. [Google Scholar] [CrossRef]
- Marques, F. Regional scale sea cliff hazard assessment at Sintra and Cascais counties, western coast of Portugal. Geosciences 2018, 8, 80. [Google Scholar] [CrossRef]
- Di Luccio, D.; Aucelli, P.P.C.; Di Paola, G.; Pennetta, M.; Berti, M.; Budillon, G.; Florio, A.; Benassai, G. An integrated approach for coastal cliff susceptibility: The case study of Procida island (southern Italy). Sci. Total. Environ. 2023, 855, 158759. [Google Scholar] [CrossRef] [PubMed]
- Watanabe, M.; Arikawa, T. Elucidation of wave pressure acting on a wave-cut notch beneath a coastal cliff based on laboratory experiments and numerical modeling. Ocean. Eng. 2023, 270, 113656. [Google Scholar] [CrossRef]
- Alessio, P.; Keller, E.A. Short-term patterns and processes of coastal cliff erosion in Santa Barbara, California. Geomorphology 2020, 353, 106994. [Google Scholar] [CrossRef]
- Leisner, M.M.; de Paula, D.P.; de Carvalho, R.G.; de Holanda Bastos, F.; da Guia Albuquerque, M.; Vasconcelos, Y.G.; Leal-Alves, D.C.; de Morais, J.O. Mass movement hazard assessment of active coastal cliffs (Northeast Brazil). Ocean. Coast. Manag. 2025, 263, 107596. [Google Scholar] [CrossRef]
- Young, A.P.; Guza, R.T.; Matsumoto, H.; Merrifield, M.A.; O’Reilly, W.C.; Swirad, Z.M. Three years of weekly observations of coastal cliff erosion by waves and rainfall. Geomorphology 2021, 375, 107545. [Google Scholar] [CrossRef]
- Calista, M.; Mascioli, F.; Menna, V.; Miccadei, E.; Piacentini, T. Recent geomorphological evolution and 3D numerical modelling of soft clastic rock cliffs in the mid-western Adriatic sea (Abruzzo, Italy). Geosciences 2019, 9, 309. [Google Scholar] [CrossRef]
- Kuhn, D.; Torizin, J.; Fuchs, M.; Hermanns, R.L.; Redfield, T.F.; Balzer, D. Back analysis of a coastal cliff failure along the Forkastningsfjellet coastline, Svalbard: Implications for controlling and triggering factors. Geomorphology 2021, 389, 107850. [Google Scholar] [CrossRef]
- Morales, T.; Clemente, J.A.; Mollá, L.D.; Izagirre, E.; Uriarte, J.A. Analysis of instabilities in the Basque coast geopark coastal cliffs for its environmentally friendly management (Basque-Cantabrian basin, northern Spain). Eng. Geol. 2021, 283, 106023. [Google Scholar] [CrossRef]
- Barbosa, N.; Taquez, D.; Santos, O.; De Freitas Neto, O.; Scudelari, A. The effect of basal erosion on sea cliffs stability. J. Coast. Res. 2020, 95, 362–366. [Google Scholar] [CrossRef]
- Shen, Y.; Whittaker, C.N.; Dickson, M.E. Cliff notching due to swash abrasion: Insights from physical experiments. Geophys. Res. Lett. 2024, 51, e2024GL112175. [Google Scholar] [CrossRef]
- Chang, F.; Shu, Z. A model for calculating the erosion distance of soft sea cliff under wave loading. Acta. Oceanol. Sin. 2018, 37, 69–77. [Google Scholar] [CrossRef]
- Yao, W.; Li, C.; Zhan, H.; Zeng, J. Time-dependent slope stability during intense rainfall with stratified soil water content. Bull. Eng. Geol. Environ. 2019, 78, 4805–4819. [Google Scholar] [CrossRef]
- Zhang, J.; Huang, H.; Zhang, L.; Zhu, H.; Shi, B. Probabilistic prediction of rainfall-induced slope failure using a mechanics-based model. Eng. Geol. 2014, 168, 129–140. [Google Scholar] [CrossRef]
- Moore, I.D.; Eigel, J.D. Infiltration into two-layered soil profiles. Trans. ASAE 1981, 24, 1496–1503. [Google Scholar] [CrossRef]
- Dou, H.Q.; Han, T.C.; Gong, X.N.; Qiu, Z.Y.; Li, Z.N. Effects of the spatial variability of permeability on rainfall-induced landslides. Eng. Geol. 2015, 192, 92–100. [Google Scholar] [CrossRef]
- Brooks, R.H. Hydraulic Properties of Porous Media; Colorado State University: Fort Collins, CO, USA, 1965. [Google Scholar]
- Dou, H.; Han, T.; Gong, X.; Zhang, J. Probabilistic slope stability analysis considering the variability of hydraulic conductivity under rainfall infiltration-redistribution conditions. Eng. Geol. 2014, 183, 1–13. [Google Scholar] [CrossRef]
- Jiang, S.H.; Liu, X.; Ma, G.; Rezania, M. Stability analysis of heterogeneous infinite slopes under rainfall-infiltration by means of an improved Green-Ampt model. Can. Geotech. J. 2023, 61, 1560–1573. [Google Scholar] [CrossRef]
- Cho, S.E. Probabilistic stability analysis of rainfall-induced landslides considering spatial variability of permeability. Eng. Geol. 2014, 171, 11–20. [Google Scholar] [CrossRef]
- Lohnes, R.A.; Handy, R.L. Slope angles in friable loess. J. Geol. 1968, 76, 247–258. [Google Scholar] [CrossRef]
- Erikson, L.H.; Larson, M.; Hanson, H. Laboratory investigation of beach scarp and dune recession due to notching and subsequent failure. Mar. Geol. 2007, 245, 1–19. [Google Scholar] [CrossRef]


| Position | Hc/m | dn/m | γ/kN·m−3 | θ | c/kPa | φ/(°) |
|---|---|---|---|---|---|---|
| S1 | 7.5 | 0.58 | 18.9 | 0.185 | 14 | 17 |
| S2 | 1.5 | 0.50 | 19.2 | 0.323 | 17 | 15 |
| S3 | 12.0 | 1.23 | 19.1 | 0.204 | 24 | 12 |
| S4 | 13.0 | 0.89 | 18.8 | 0.315 | 15 | 17 |
| S5 | 5.3 | 0.77 | 18.9 | 0.253 | 23 | 19 |
| S6 | 2.0 | 0.41 | 18.5 | 0.176 | 13 | 20 |
| Design Conditions | Value |
|---|---|
| 0.5 | |
| 1.40 × 10⁻⁶ | |
| 0.013 | |
| 5 | |
| 2.752 | |
| 424.3 | |
| 0.319 |
Disclaimer/Publisher’s Note: The statements, opinions and data contained in all publications are solely those of the individual author(s) and contributor(s) and not of MDPI and/or the editor(s). MDPI and/or the editor(s) disclaim responsibility for any injury to people or property resulting from any ideas, methods, instructions or products referred to in the content. |
© 2025 by the authors. Licensee MDPI, Basel, Switzerland. This article is an open access article distributed under the terms and conditions of the Creative Commons Attribution (CC BY) license (https://creativecommons.org/licenses/by/4.0/).
Share and Cite
Zhao, H.; Chang, X.; Huang, Y.; Zhou, J.; Ti, Z. A Stability Model for Sea Cliffs Considering the Coupled Effects of Sea Erosion and Rainfall. Oceans 2025, 6, 45. https://doi.org/10.3390/oceans6030045
Zhao H, Chang X, Huang Y, Zhou J, Ti Z. A Stability Model for Sea Cliffs Considering the Coupled Effects of Sea Erosion and Rainfall. Oceans. 2025; 6(3):45. https://doi.org/10.3390/oceans6030045
Chicago/Turabian StyleZhao, Haoyu, Xu Chang, Yingbin Huang, Junlong Zhou, and Zilong Ti. 2025. "A Stability Model for Sea Cliffs Considering the Coupled Effects of Sea Erosion and Rainfall" Oceans 6, no. 3: 45. https://doi.org/10.3390/oceans6030045
APA StyleZhao, H., Chang, X., Huang, Y., Zhou, J., & Ti, Z. (2025). A Stability Model for Sea Cliffs Considering the Coupled Effects of Sea Erosion and Rainfall. Oceans, 6(3), 45. https://doi.org/10.3390/oceans6030045