Abstract
Coastal shellfish farming areas in northern China seas face frequent starfish outbreaks, particularly from Asterias amurensis and Patiria pectinifera, leading to significant economic losses. Genomic data are key to understanding the population dynamics and adaptive traits and developing effective control measures for these species. Here, we characterized and compared the genomic information of these two starfish using a whole-genome survey approach. The genome size of A. amurensis is ~477 Mb with 1.52% heterozygosity, 53.60% repetitive sequences, and 39.94% GC content, while P. pectinifera has a ~529 Mb genome, 2.90% heterozygosity, 56.02% repetitive sequences, and 40.63% GC content. Scaffold N50 values were 1823 bp for A. amurensis and 1328 bp for P. pectinifera. We identified 161,786 microsatellite motifs in A. amurensis and 316,245 in P. pectinifera, with mononucleotide repeats being the most common. A total of 171 single-copy homologous genes were found in A. amurensis, with 94 in P. pectinifera. For both species, KEGG annotation showed functional similarities in glycan biosynthesis, translation, metabolism, catabolism, and transport. The Pairwise Sequentially Markovian Coalescent (PSMC) analysis unveiled a bottleneck effect during the Pleistocene glaciation. Additionally, phylogenetic analysis of mitochondrial genomes indicates that P. pectinifera and Patiria miniata of the same genus belong to the same branch in the evolutionary tree as sister groups with the closest genetic relationship, while A. amurensis is most closely related to Astropecten polyacanthus within the class Asteroidea. These findings provide valuable genomic insights for both species.
1. Introduction
Starfish, key species in rocky intertidal zones, rapidly reproduce and significantly influence their ecosystem [1,2,3]. With multiple arms, they feed on key bivalves such as oysters and clams, along with live corals [4,5,6]. The biological traits and feeding behaviors of sea stars underpin their rapid reproduction and mass proliferation, thereby causing severe damage to shellfish aquaculture and coral ecosystems [7,8]. These population outbreaks lead to substantial economic losses and ecological disruption, signaling significant changes in marine environments that impact coastal ecosystem quality and stability.
Asterias amurensis and Patiria pectinifera are the two most common disaster-causing starfish in the northern China seas. Asterias amurensis was historically distributed across the northern North Pacific, encompassing regions such as northern China, Japan, Russia, and Korea [9]. As an invasive species, it has successfully colonized southern Australia and emerged as one of the most problematic marine invasive pests in the region [10]. Patiria pectinifera is a prevalent species in the shallow coastal waters of northern China. Its distribution spans the coastal regions of China, Japan, Korea, and the Russian Far East. It inhabits sandy bottoms, shell bottoms, and rocky reef bottoms in shallow coastal waters and has a wide tolerance range for salinity [11]. The economic value of A. amurensis and P. pectinifera is relatively low, and they mainly harm cultured shellfish [12]. Therefore, in scientific research and prevention efforts, they receive far less attention than Acanthaster planci, which harms coral reefs. At present, there are relatively few molecular biology studies on A. amurensis and P. pectinifera. Relevant research has only been carried out in fields such as taxonomy, early development, and ethology [13].
Recent breakthroughs in high-throughput sequencing combined with bioinformatics analysis have offered a feasible method to decipher the whole-genome information of species [14,15]. Through genome survey analysis using whole-genome data, numerous species have yielded valuable genomic metrics, including genome size, heterozygosity, repetitive sequence content, and GC content [16,17]. Whole-genome-derived microsatellite markers and mitochondrial genome data facilitate population genetics and evolutionary analyses. Moreover, whole-genome sequencing (WGS) data offer deeper insights into population history.
Using Illumina sequencing, we generated whole-genome datasets for A. amurensis and P. pectinifera. The objectives of this study were to (1) compare their genomic characteristics, assemble mitochondrial genomes from whole-genome data, and analyze phylogenetic relationships among selected Asteroidea species; (2) characterize the abundance and distribution of simple sequence repeats (SSRs); and (3) identify single-copy orthologous genes to decipher interspecific functional divergences. These findings will provide insights into the genome-level differences between these two northern starfish species, significantly enriching Asteroidea genomic resources and offering new case studies for evolutionary research.
2. Materials and Methods
2.1. Ethics Statement
This study does not involve endangered or live animals. The A. amurensis and P. pectinifera samples used in this study were sourced from fishery production and were already deceased at the time of collection. All animal experiments complied with the regulations of the Experimental Animal Ethics Committee of Ocean University of China.
2.2. Sample Collection and Genome Survey Sequencing
Samples of A. amurensis and P. pectinifera were collected in Qingdao and Yantai, Shandong Province, China, in August 2021 and October 2022, respectively. Muscle tissue samples were preserved in 95% ethanol at −80 °C. Genomic DNA was extracted using a modified phenol–chloroform protocol: tissues were homogenized in lysis buffer (100 mM Tris-HCl, 50 mM EDTA, 0.5% SDS, pH 8.0), extracted with phenol–chloroform–isoamyl alcohol (25:24:1), and precipitated with ethanol to obtain the DNA [18]. The purity and concentration of DNA were measured using a NanoDrop 8000 microspectrophotometer (Thermo Fisher Scientific, Waltham, MA, USA) and a Qubit fluorometer (Thermo Fisher Scientific, Waltham, MA, USA), respectively. When preparing DNA libraries, each sample used 0.2 μg of DNA as the input material. The Rapid Plus DNA Lib Prep Kit for Illumina was employed to generate the sequencing library, adhering to the manufacturer’s instructions, and index codes were appended to each sample. The genomic DNA samples were fragmented via sonication to achieve a size of 350 bp. The fragmented DNA underwent end-polishing, A-tailing, and ligation with Illumina-specific full-length adapters, followed by PCR amplification. PCR products were purified using the AMPure XP system (Beckman Coulter, Brea, CA, USA). Library quality was evaluated via the Agilent 5400 system (Agilent Technologies, Santa Clara, CA, USA), and quantification was performed by QPCR (1.5 nM). Qualified libraries were pooled and sequenced on Illumina platforms using the PE150 strategy, with sequencing depth determined by effective library concentration and data requirements. Sequencing was conducted on an Illumina HiSeq Nova platform at Wuhan Onemore-tech Co., Ltd. (Wuhan, China). The whole-genome sequencing data are deposited in NCBI’s Short Read Archive (SRA) under accession number PRJNA1225912.
2.3. Genome Survey, Assembly, and Simple Sequence Repeat (SSR) Identification
The raw sequencing data were processed using fastp (v 0.23.2) software to remove adapter sequences and filter out low-quality reads (quality score < 30) [19]. To identify potential foreign DNA contamination, clean reads were aligned against the non-redundant (nr) protein database using BLAST (v 2.11.0+). High-quality reads were used for K-mer analysis: counting was carried out with Jellyfish, and a frequency distribution table was generated [20]. Genome ploidy was analyzed with Smudgeplot (v 0.4.0) software [21], while genome heterozygosity and repeat content were estimated using the GCE tool [22,23]. Genome size was estimated by analyzing the K-mer distribution curve and identifying its peak. For genomic assembly, SOAPdenovo was used to obtain sequences [24]. Potential SSRs (simple sequence repeats) were identified by the MISA v2.1 misa.pl script with default parameters [25]. Search criteria detected di- to hexanucleotide microsatellite motifs with minimum repeat counts of 6 (di-) or 5 (tri- to hexanucleotide).
2.4. Genome Functional Annotation
Utilizing BUSCO (v 5.3.1) software, we searched for single-copy orthologous genes in A. amurensis and P. pectinifera [26]. Using eggNOG-Mapper against the Gene Ontology (GO) and Kyoto Encyclopedia of Genes and Genomes (KEGG) databases [27], we identified species-specific single-copy orthologs and performed KEGG enrichment via OmicShare tools.
2.5. Mitochondrial Genome Assembly and Phylogenetic Analysis
Clean data were used in GetOrganelle (v 1.7.0) software for the assembly of the mitochondrial genome, followed by annotation using Geseq software [28,29]. To elucidate the phylogenetic relationships of A. amurensis and P. pectinifera within the class Asteroidea, mitochondrial genomes of 10 Asteroidea species were downloaded from GenBank (https://www.ncbi.nlm.nih.gov/) accessed on 17 May 2025 (Table S1). The outgroup selected was Lytechinus variegatus belonging to the class Echinoidea. Sequence alignment was conducted via Clustal W, and the maximum likelihood tree was inferred in MEGA X employing the Kimura 2-parameter model with gamma-distributed rate variation (K2P+G) [30]. Bootstrap support values were computed based on 1000 replicates.
2.6. Effective Population Size Inference
The Pairwise Sequentially Markovian Coalescent (PSMC) method [31] was used to infer the historical population dynamics of A. amurensis and P. pectinifera. PSMC estimates effective population size (Ne) changes over time by analyzing heterozygous site distributions in diploid genomes. Briefly, clean reads were aligned to the assembled genome using BWA [32], and mapped BAM files were processed with Samtools v0.1.19 using −bF 12 [33,34]. Sorted BAM files were converted to “fq.gz” via bcftools and vcftools, and then to psmcfa files using PSMC’s fq2psmcfa script with -q20 [35,36]. PSMC ran with a generation time of 2 years and a mutation rate of 1.5 × 10⁻⁸.
3. Results
3.1. Whole-Genome Sequencing, k-Mer Analysis, and Genome Assembly
Sequencing of the libraries for A. amurensis and P. pectinifera generated 79.91 Gb and 93.57 Gb of raw data, respectively. Filtered whole-genome sequencing data metrics for both species are shown in Table 1. Clean reads were screened against the NT database for DNA contamination. The alignment results showed that 99.88% of the reads matched DNA from closely related species of A. amurensis, and 94.86% matched DNA from closely related species of P. pectinifera (Table S2), indicating no significant foreign DNA contamination. The 17-Kmer frequency plot (Figure 1) shows prominent heterozygous peaks in both A. amurensis and P. pectinifera, confirming their diploid genomes (Figure 2). Genomic metrics are as follows: A. amurensis has a 477 Mb genome with 1.52% heterozygosity and 53.60% repetitive sequences, while P. pectinifera has a 529 Mb genome with 2.90% heterozygosity and 56.02% repetitive sequences (Table 2). High-quality filtered sequences were used for draft genome assembly: A. amurensis achieved contig N50 of 79 bp and scaffold N50 of 1823 bp, whereas P. pectinifera had contig N50 of 86 bp and scaffold N50 of 1328 bp (Table 3).

Table 1.
The indexes of the whole-genome sequencing data of A. amurensis and P. pectinifera.
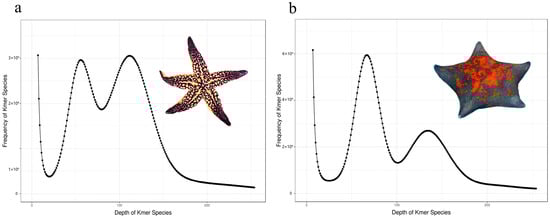
Figure 1.
K-mer (17-mer) profiling for genome size estimation of A. amurensis (a) and P. pectinifera (b).
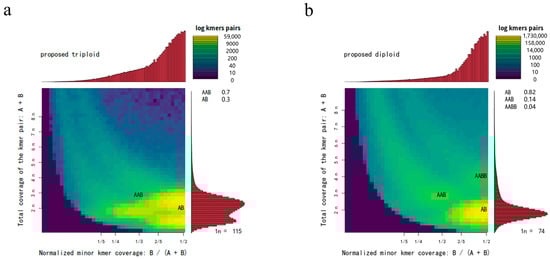
Figure 2.
Genome ploidy level analysis of A. amurensis (a) and P. pectinifera (b).
Table 2.
Genome size, heterozygosity, and repetitive sequence ratio of A.amursis and P. pectinifera.
Table 3.
The metrics of the whole-genome sequencing data of A.amurensis and P. pectinifera.
3.2. Identification and Characterization of SSRs
Simple sequence repeats (SSRs) were identified in draft genomes of A. amurensis and P. pectinifera using MISA. In A. amurensis, 903,887 sequences (507,490,131 bp total length) were screened, yielding 161,786 SSRs (Table 4). P. pectinifera had 1,457,538 sequences (744,513,467 bp) screened, with 316,245 SSRs identified. The distribution of microsatellites with different base repeat types from 1 to 6 varied greatly. Mononucleotide microsatellites were in an absolute dominant position. There were 124,979 mononucleotide microsatellites in A. amurensis, accounting for 77.25% of the total number of microsatellites (Figure 3a); meanwhile, microsatellites with other base repeat types accounted for only 22.76% of the total, and the proportions from largest to smallest were trinucleotide (19,822, 12.25%), dinucleotide (9096, 5.62%), tetranucleotide (6085, 3.76%), pentanucleotide (1163, 0.72%), and hexanucleotide (641, 0.40%). In P. pectinifera, there were 283,197 mononucleotide microsatellites, accounting for 89.55% of the total number of microsatellites (Figure 3b); meanwhile, microsatellites with other base repeat types accounted for only 10.46% of the total, and the proportions from largest to smallest were trinucleotide (14,000, 4.43%), dinucleotide (11,897, 3.76%), tetranucleotide (5144, 1.63%), pentanucleotide (1324, 0.42%), and hexanucleotide (683, 0.22%). Notably, A. amurensis exhibited a more pronounced dominance of A/T mononucleotide motifs compared to P. pectinifera, reflecting species-specific genomic compositions (Figure 4a,g). For A. amurensis, the AT repeat was the most prevalent dinucleotide microsatellite motif (Figure 4b). AAT dominated among the trinucleotide repeats (Figure 4c), while AAAT and AAAC were the predominant tetranucleotide motifs (Figure 4d). The pentanucleotide repeat AATTG (Figure 4e) and hexanucleotide repeat AATAAC (Figure 4f) were the most abundant in their respective categories. In P. pectinifera, AT and TG were the most frequent dinucleotide repeats (Figure 4h), with AAT as the major trinucleotide motif (Figure 4i). Similar to A. amurensis, AAAT and AAAC were the common tetranucleotide repeats (Figure 4g). The pentanucleotide CCCAA (Figure 4k) and hexanucleotide TACATG (Figure 4l) were the most abundant in their classes.
Table 4.
Statistics of microsatellite recognition results of A. amurensis and P. pectinifera.
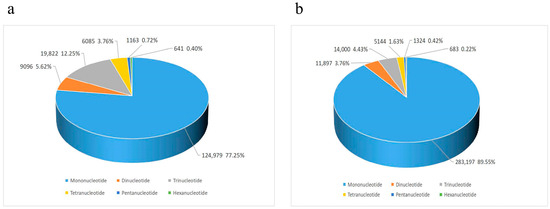
Figure 3.
Frequency distribution of identified microsatellite motifs in A. amurensis (a) and P. pectinifera (b) SSRs, showing distinct proportions of di- to hexanucleotide repeats.
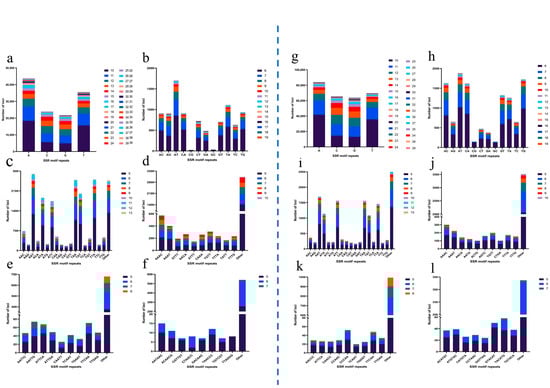
Figure 4.
Microsatellite motif distribution and frequency in A. amurensis and P. pectinifera. A. amurensis: (a) mononucleotide motif frequencies; (b) dinucleotide motif frequencies; (c) trinucleotide motif frequencies; (d) tetranucleotide motif frequencies; (e) pentanucleotide motif frequencies; (f) hexanucleotide motif frequencies. P. pectinifera: (g) mononucleotide motif frequencies; (h) dinucleotide motif frequencies; (i) trinucleotide motif frequencies; (j) tetranucleotide motif frequencies; (k) pentanucleotide motif frequencies; (l) hexanucleotide motif frequencies.
3.3. Screening and Functional Annotation of Single-Copy Homologous Genes
Using the assembled draft genomes in this study, 171 single-copy orthologous genes were identified in A. amurensis, with 94 in P. pectinifera. The GO annotation results indicated that for A. amurensis (Figure 5a, Table S3), the main terms related to single-copy orthologous genes included cytoskeleton dynamics, energy metabolism and enzyme activity, nervous system development and regulation, gene expression regulation, and ribosome biogenesis and assembly. In P. pectinifera (Figure 5b, Table S4), the main terms related to single-copy orthologous genes included protein kinases and signal transduction, nervous system development and regulation, ribosome biogenesis and translation regulation, metabolism and enzyme activity, and cell signal transduction and immune response. KEGG annotation showed that single-copy orthologous genes in A. amurensis were mainly related to processes such as glycan biosynthesis and metabolism, energy metabolism, translation, transcription, transport, and catabolism (Figure 6a). In P. pectinifera, single-copy genes were primarily involved in glycan biosynthesis/metabolism, translation, folding/sorting/degradation, transport, and catabolism (Figure 6b). During environmental adaptation, both species sense external changes via signal transduction pathways.
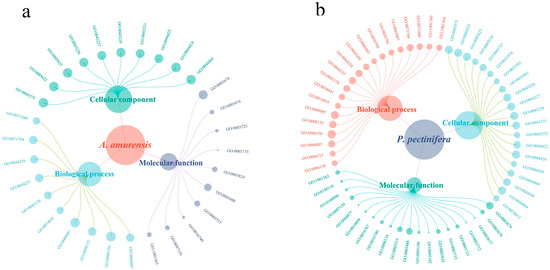
Figure 5.
GO categorization of all single-copy orthologous genes in A. amurensis (a) and P. pectinifera (b).
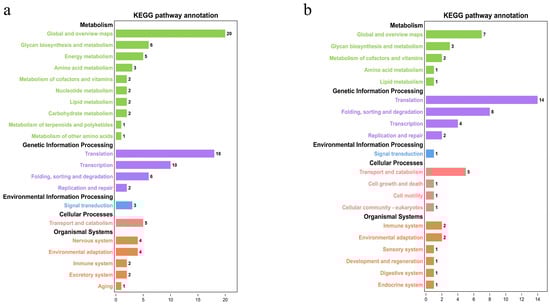
Figure 6.
KEGG annotation results for all single-copy orthologous genes A. amurensis (a) and P. pectinifera (b).
3.4. Mitochondrial Genome Assembly and Phylogenetic Analysis
The complete mitochondrial genomes of A. amurensis and P. pectinifera are closed-circular molecules, measuring 16,695 bp and 16,977 bp, respectively. Both contain 13 protein-coding genes, 22 tRNA genes, 2 rRNA genes, and a single control region (D-loop) (Figure 7). Among these, nad1, nad2, nad6, 1 large rRNA gene (rrnL), and 11 tRNA genes reside on the light chain, with the remaining genes encoded on the heavy chain. In the phylogenetic tree inferred from the 13 protein-coding genes, all starfish species form a monophyletic cluster with a sea urchin outgroup (Figure 8). P. pectinifera and Patiria miniata of the same genus belong to the same branch in the evolutionary tree, having the closest genetic relationship and being sister groups to each other. Additionally, A. amurensis is most closely related to Astropecten polyacanthus.
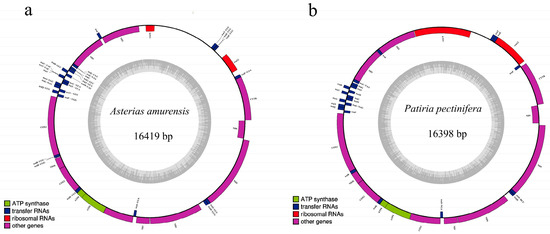
Figure 7.
Mitochondrial genome organization of A. amurensis (a) and P. pectinifera (b).
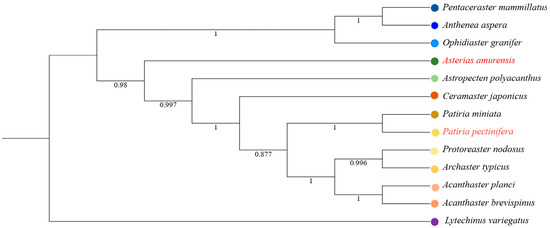
Figure 8.
Phylogenetic trees inferred by maximum likelihood, based on 13 mitochondrial protein-coding genes of Asteroidea with Strongylocentrotus purpuratus (Echinoidea) as the outgroup.
3.5. Population Size Dynamics of A. amurensis and P. pectinifera
The PSMC results (Figure 9) revealed that both A. amurensis and P. pectinifera have undergone population bottlenecks over the past ~1 million years, with cyclic fluctuations in effective population size (Ne). A. amurensis Ne peaked ~100,000 years ago before declining, a trend that halted during the Last Glacial Maximum (LGM, ~21,000 years ago). In contrast, P. pectinifera Ne peaked ~60,000 years ago and has shown a continuous decline since, with no recovery.
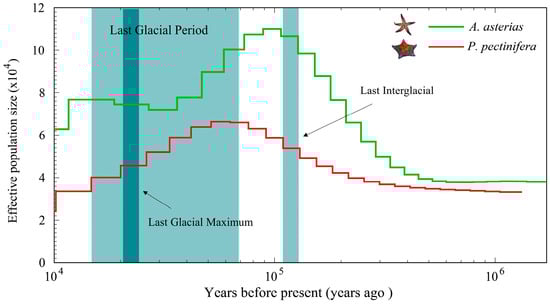
Figure 9.
Demographic history of A. amurensis and P. pectinifera.
4. Discussion
There are approximately 1,600 modern species in the class Asteroidea. However, currently, only 28 whole-genome sequences of the class Asteroidea have been uploaded to the NCBI database. As regards A. amurensis and P. pectinifera, important members of the class Asteroidea, the genomic research on them can provide a reference basis for the variation pattern of the genome size of starfish. In this study, whole-genome survey sequencing was employed to acquire the genomic data of A. amurensis and P. pectinifera. The original data are of high quality, with both Q20 and Q30 exceeding 90%, making them suitable for subsequent analysis. Sequencing reads selected at random were all aligned to sequences of closely related species, confirming the absence of foreign contamination in the data. The genome of A. amurensis shows 1.52% heterozygosity and 53.60% repetitive sequences. The heterozygosity of the genome of P. pectinifera is 2.9%, and the proportion of repetitive sequences is 56.02%. Both of them are genomes with high heterozygosity. Repetitive sequences and regions with high heterozygosity will affect the integrity of the genome during the genome assembly process [16,37]. Therefore, in the future assembly of the genomes of A. amurensis and P. pectinifera, the sequencing depth should be increased.
Since only Illumina sequencing data were used, the lengths of N50 contigs and scaffolds of the genomic sequences of A. amurensis and P. pectinifera are relatively short, which may be due to their high heterozygosity and proportion of repetitive sequences. Recently, simple sequence repeats (SSRs) have emerged as one of the most widely used molecular markers [38,39]. As chromosome-specific markers, SSRs typically exhibit Mendelian codominant inheritance. Microsatellite locus identification in A. amurensis and P. pectinifera draft genomes revealed mononucleotide motifs were dominant, followed by trinucleotide and dinucleotide types, while tetranucleotide, pentanucleotide, and hexanucleotide motifs were rare. This aligns with Labbé et al. [40], who found short (1–3 bp) repeat motifs are more abundant in most genomes. These SSR data are critical for developing starfish molecular markers. Follow-up validation is required to ensure the usability of the newly developed microsatellite markers.
Single-copy genes refer to genes that exist in only one copy in an organism’s genome. This means that there are no repetitive sequences or additional copies of this gene on the chromosome where it is located or in the entire genome [41,42]. Single-copy genes usually encode key functional proteins that are crucial for the life activities of cells. Single-copy genes often have a high degree of evolutionary conservation, meaning that their sequences are highly similar or even identical among different species [43]. This indicates that they have been under strict selective pressure during evolution, as any mutation may harm the survival of individuals. Functional analysis of single-copy orthologous genes facilitates species-level differentiation insights. In this study, single-copy ortholog datasets for A. amurensis and P. pectinifera were derived from whole-genome data, followed by functional annotation and enrichment analyses. The two species showed substantial differences in the single-copy ortholog count: A. amurensis harbored approximately twice as many single-copy genes as P. pectinifera. Despite this disparity, their GO annotations and KEGG pathways were similar, encompassing diverse life activity processes. A. amurensis having single-copy genes more involved in energy metabolism might indicate its specific energy acquisition and utilization strategies, which could be crucial for its survival in its habitat. Additionally, the enrichment of protein kinase-related signal transduction and immune response pathways in P. pectinifera may be related to its defense mechanisms and responses to environmental stimuli.
The mitochondrial genome-based phylogenetic tree elucidates distinct evolutionary relationships among starfish taxa, with findings corroborating and extending previous studies. For instance, the close evolutionary connection between A. amurensis and A. polyacanthus (bootstrap support ≥ 95%) not only suggests a recent common ancestor and convergent adaptations [44] but also underscores the high resolution of mitochondrial genomes in resolving closely related species [45]. Similarly, the monophyletic clustering of P. pectinifera and P. miniata within the genus Patiria is consistent with traditional morphological classifications [46], highlighting the reliability of mitochondrial genomes for genus-level taxonomic inference [47]. However, the maternal inheritance of mitochondrial genomes may underestimate introgression events (e.g., hybridization), potentially explaining minor topological conflicts in the Amphipholis clade compared to nuclear data.
Population historical dynamics research is a crucial dimension for analyzing species’ adaptive evolution and phylogenetic relationships. Using the PSMC model, this study inferred changes in the effective population size (Ne) of A. amurensis and P. pectinifera during the Pleistocene glaciation, with the results echoing and supplementing paleoclimatic records and previous studies. For example, the Ne peaks of the two species during the Last Interglacial Period (approximately 105 years ago) highly coincide with the Northern Hemisphere interglacial warming event [48], confirming that climate-driven fluctuations in marine productivity promoted the population expansion of benthic organisms [49]. Notably, the divergent recovery patterns after the Last Glacial Maximum—A. amurensis showing no further reduction in Ne, with P. pectinifera maintaining persistently low Ne—may reflect differences in their ecological strategies. As a eurythermal invasive species, the former likely rapidly adapt to new habitats through phenotypic plasticity (e.g., adjustments in feeding behavior), whereas the latter’s recovery is delayed due to its sessile lifestyle and narrow salinity tolerance. By comparing the changes in the effective population sizes of the two species, it is possible to explore the divergence time in their evolutionary history and the existence of a common ancestor. This information is of great significance for understanding the phylogenetic relationships within the class Asteroidea.
5. Conclusions
In conclusion, whole-genome surveys of A. amurensis and P. pectinifera were conducted through high-throughput sequencing. This study revealed the genomic characteristics of A. amurensis and P. pectinifera, including small genomes, slightly high heterozygosity, and a high content of repetitive sequences. SSRs were identified from the genomic data, providing new ideas for future population genetics studies. Functional annotation of single-copy orthologs revealed that the two species share similar roles in glycan biosynthesis/metabolism, translation, transport, and catabolism. The assembled mitochondrial genomes not only expand the genetic resource pool of Asteroidea but also provide additional evidence to support their taxonomic classification. The PSMC analysis showed that both A. amurensis and P. pectinifera experienced bottleneck events during the Pleistocene glacial period. This study has significantly supplemented the genetic information of species in the class Asteroidea, providing new perspectives for research on their genomic characteristics and evolutionary biology.
Supplementary Materials
The following supporting information can be downloaded at https://www.mdpi.com/article/10.3390/oceans6020035/s1: Table S1: NCBI accession numbers of 13 protein-coding genes of the mitochondrial genomes; Table S2: Comparison results of the library data of Asterias amurensis and Patiria pectinifera with the NT library; Table S3: GO ID and terms of A. amurensis; Table S4: GO ID and terms of P. pectinifera.
Author Contributions
Conceptualization, G.N.; methodology, Z.H. and Z.L.; software, Z.H.; validation, G.N., Z.H. and Z.L.; formal analysis, G.N.; investigation, Z.H.; resources, G.N.; data curation, Z.L.; writing—original draft preparation, Z.H.; writing—review and editing, G.N.; visualization, Z.H. and Z.L.; supervision, G.N.; project administration, G.N.; funding acquisition, G.N. All authors have read and agreed to the published version of the manuscript.
Funding
This research was funded by the National Key Research and Development Program, China [2022YFC3106301], and the Young Talent Program of Ocean University of China [No. 862201013143] to Gang Ni.
Institutional Review Board Statement
Not applicable.
Informed Consent Statement
Not applicable.
Data Availability Statement
The datasets generated and/or analyzed during the current study are available from the corresponding author upon reasonable request.
Acknowledgments
We appreciate the assistance provided by Chengbin Liu during the sampling. We also appreciate the technical support provided by Xinghai Liu.
Conflicts of Interest
The authors declare no conflicts of interest.
Abbreviations
The following abbreviations are used in this manuscript:
| GO | Gene Ontology |
| KEGG | Kyoto Encyclopedia of Genes and Genomes |
| PSMC | Pairwise Sequentially Markovian Coalescent |
References
- Lubchenco, J.; Menge, B.A. Community Development and Persistence in a Low Rocky Intertidal Zone. Ecol. Monogr. 1978, 48, 67–94. [Google Scholar] [CrossRef]
- Mackenzie, C.; Pikanowski, R.A. A Decline in Starfish, Asterias forbesi, Abundance and a Concurrent Increase in Northern Quahog, Mercenaria mercenaria, Abundance and Landings in the Northeastern United States. Mar. Fish. Rev. 1999, 61, 66–71. [Google Scholar]
- Paine, R.T. Food Web Complexity and Species Diversity. Am. Nat. 1966, 100, 65–75. [Google Scholar] [CrossRef]
- Brodie, J.; Fabricius, K.; De’ath, G.; Okaji, K. Are increased nutrient inputs responsible for more outbreaks of crown-of-thorns starfish? An appraisal of the evidence. Mar. Pollut. Bull. 2005, 51, 266–278. [Google Scholar] [CrossRef] [PubMed]
- Li, L.C.; Yu, Y.; Wu, W.H.; Wang, P.P. Extraction, Characterization and Osteogenic Activity of a Type I Collagen from Starfish (Asterias amurensis). Mar. Drugs 2023, 21, 274. [Google Scholar] [CrossRef]
- Ross, D.J.; Johnson, C.R.; Hewitt, C.L. Assessing the ecological impacts of an introduced seastar: The importance of multiple methods. Biol. Invasions 2003, 5, 3–21. [Google Scholar] [CrossRef]
- Babcock, R.C.; Plaganyi, É.; Condie, S.A.; Westcott, D.A.; Fletcher, C.S.; Bonin, M.C.; Cameron, D. Suppressing the next crown-of-thorns outbreak on the Great Barrier Reef. Coral Reefs 2020, 39, 1233–1244. [Google Scholar] [CrossRef]
- Li, L.Y.; Liu, T.; Huang, H.; Song, H.; He, S.Y.; Li, P.L.; Gu, Y.Z.; Chen, J.W. An early warning model for starfish disaster based on multi-sensor fusion. Front. Mar. Sci. 2023, 10, 12. [Google Scholar] [CrossRef]
- Shah, A.; Kinoshita, M.; Kurihara, H.; Ohnishi, M.; Takahashi, K. Glycosylceramides Obtain from the Starfish Asterias amurensis Lutken. J. Oleo Sci. 2008, 57, 477–484. [Google Scholar] [CrossRef]
- Byrne, M.; Morrice, M.G.; Wolf, B. Introduction of the northern Pacific asteroid Asterias amurensis to Tasmania: Reproduction and current distribution. Mar. Biol. 1997, 127, 673–685. [Google Scholar] [CrossRef]
- Kashenko, S.D. The Reaction of the Starfish Asterias amurensis and Patiria pectinifera (Asteroidea) from Vostok Bay (Sea of Japan) to a Salinity Decrease. Russ. J. Mar. Biol. 2003, 29, 110–114. [Google Scholar] [CrossRef]
- Wang, Y.; Gu, Y.B.; Guo, H.; Cao, L.Q.; Jin, Y. Advances and perspectives on the research of starfish outbreaks in northern China. Chin. J. Appl. Ecol. 2023, 34, 1146–1152. [Google Scholar]
- Du, M.R.; Zhang, J.H.; Mao, Y.Z.; Jiang, Z.J.; Gao, Y.P.; Fang, J.G. Development of embryo and early stage larvae of Asterias amurensis. Prog. Fish. Sci. 2014, 35, 133–138. [Google Scholar]
- Chen, B.J.; Sun, Z.C.; Lou, F.R.; Gao, T.X.; Song, N. Genomic characteristics and profile of microsatellite primers for Acanthogobius ommaturus by genome survey sequencing. Biosci. Rep. 2020, 40, 8. [Google Scholar] [CrossRef]
- Wenne, R. Microsatellites as Molecular Markers with Applications in Exploitation and Conservation of Aquatic Animal Populations. Genes 2023, 14, 808. [Google Scholar] [CrossRef]
- Jia, C.H.; Yang, T.Y.; Yanagimoto, T.; Gao, T.X. Comprehensive Draft Genome Analyses of Three Rockfishes (Scorpaeniformes, Sebastiscus) via Genome Survey Sequencing. Curr. Issues Mol. Biol. 2021, 43, 2048–2058. [Google Scholar] [CrossRef]
- Surachat, K.; Deachamag, P.; Wonglapsuwan, M. The first de novo genome assembly and sex marker identification of Pluang Chomphu fish (Tor tambra) from Southern Thailand. Comput. Struct. Biotechnol. J. 2022, 20, 1470–1480. [Google Scholar] [CrossRef]
- Sambrook, J.; Russell, D.W. Molecular Cloning: A Laboratory Manual, 3rd ed.; Cold Spring Harbor Laboratory Press: Woodbury, NY, USA, 2001. [Google Scholar]
- Chen, S.F.; Zhou, Y.Q.; Chen, Y.R.; Gu, J. fastp: An ultra-fast all-in-one FASTQ preprocessor. Bioinformatics 2018, 34, 884–890. [Google Scholar] [CrossRef]
- Marcais, G.; Kingsford, C. A fast, lock-free approach for efficient parallel counting of occurrences of k-mers. Bioinformatics 2011, 27, 764–770. [Google Scholar] [CrossRef]
- Ranallo-Benavidez, T.R.; Jaron, K.S.; Schatz, M.C. GenomeScope 2.0 and Smudgeplot for reference-free profiling of polyploid genomes. Nat. Commun. 2020, 11, 10. [Google Scholar] [CrossRef]
- Kajitani, R.; Toshimoto, K.; Noguchi, H.; Toyoda, A.; Ogura, Y.; Okuno, M.; Yabana, M.; Harada, M.; Nagayasu, E.; Maruyama, H.; et al. Efficient de novo assembly of highly heterozygous genomes from whole-genome shotgun short reads. Genome Res. 2014, 24, 1384–1395. [Google Scholar] [CrossRef] [PubMed]
- Li, R.Q.; Zhu, H.M.; Ruan, J.; Qian, W.B.; Fang, X.D.; Shi, Z.B.; Li, Y.R.; Li, S.T.; Shan, G.; Kristiansen, K.; et al. De novo assembly of human genomes with massively parallel short read sequencing. Genome Res. 2010, 20, 265–272. [Google Scholar] [CrossRef] [PubMed]
- Luo, R.B.; Liu, B.H.; Xie, Y.L.; Li, Z.Y.; Huang, W.H.; Yuan, J.Y.; He, G.Z.; Chen, Y.X.; Pan, Q.; Liu, Y.J.; et al. SOAPdenovo2: An empirically improved memory-efficient short-read de novo assembler. Gigascience 2012, 1, 6. [Google Scholar] [CrossRef] [PubMed]
- Beier, S.; Thiel, T.; Münch, T.; Scholz, U.; Mascher, M. MISA-web: A web server for microsatellite prediction. Bioinformatics 2017, 33, 2583–2585. [Google Scholar] [CrossRef]
- Simao, F.A.; Waterhouse, R.M.; Ioannidis, P.; Kriventseva, E.V.; Zdobnov, E.M. BUSCO: Assessing genome assembly and annotation completeness with single-copy orthologs. Bioinformatics 2015, 31, 3210–3212. [Google Scholar] [CrossRef]
- Cantalapiedra, C.P.; Hernández-Plaza, A.; Letunic, I.; Bork, P.; Huerta-Cepas, J. eggNOG-mapper v2: Functional Annotation, Orthology Assignments, and Domain Prediction at the Metagenomic Scale. Mol. Biol. Evol. 2021, 38, 5825–5829. [Google Scholar] [CrossRef]
- Jin, J.J.; Yu, W.B.; Yang, J.B.; Song, Y.; dePamphilis, C.W.; Yi, T.S.; Li, D.Z. GetOrganelle: A fast and versatile toolkit for accurate de novo assembly of organelle genomes. Genome Biol. 2020, 21, 31. [Google Scholar] [CrossRef]
- Tillich, M.; Lehwark, P.; Pellizzer, T.; Ulbricht-Jones, E.S.; Fischer, A.; Bock, R.; Greiner, S. GeSeq-versatile and accurate annotation of organelle genomes. Nucleic Acids Res. 2017, 45, W6–W11. [Google Scholar] [CrossRef]
- Kumar, S.; Stecher, G.; Li, M.; Knyaz, C.; Tamura, K. MEGA X: Molecular Evolutionary Genetics Analysis across Computing Platforms. Mol. Biol. Evol. 2018, 35, 1547–1549. [Google Scholar] [CrossRef]
- Li, H.; Durbin, R. Inference of human population history from individual whole-genome sequences. Nature 2011, 475, 493–496. [Google Scholar] [CrossRef]
- Jung, Y.; Han, D. BWA-MEME: BWA-MEM emulated with a machine learning approach. Bioinformatics 2022, 38, 2404–2413. [Google Scholar] [CrossRef] [PubMed]
- Danecek, P.; Bonfield, J.K.; Liddle, J.; Marshall, J.; Ohan, V.; Pollard, M.O.; Whitwham, A.; Keane, T.; McCarthy, S.A.; Davies, R.M.; et al. Twelve years of SAMtools and BCFtools. Gigascience 2021, 10, 4. [Google Scholar] [CrossRef] [PubMed]
- Li, H.; Handsaker, B.; Wysoker, A.; Fennell, T.; Ruan, J.; Homer, N.; Marth, G.; Abecasis, G.; Durbin, R. The Sequence Alignment/Map format and SAMtools. Bioinformatics 2009, 25, 2078–2079. [Google Scholar] [CrossRef] [PubMed]
- Danecek, P.; Auton, A.; Abecasis, G.; Albers, C.A.; Banks, E.; DePristo, M.A.; Handsaker, R.E.; Lunter, G.; Marth, G.T.; Sherry, S.T.; et al. Genomes Project Anal. The variant call format and VCFtools. Bioinformatics 2011, 27, 2156–2158. [Google Scholar] [CrossRef]
- Narasimhan, V.; Danecek, P.; Scally, A.; Xue, Y.L.; Tyler-Smith, C.; Durbin, R. BCFtools/RoH: A hidden Markov model approach for detecting autozygosity from next-generation sequencing data. Bioinformatics 2016, 32, 1749–1751. [Google Scholar] [CrossRef]
- Shao, F.; Han, M.J.; Peng, Z.G. Evolution and diversity of transposable elements in fish genomes. Sci. Rep. 2019, 9, 8. [Google Scholar] [CrossRef]
- Cho, Y.G.; Ishii, T.; Temnykh, S.; Chen, X.; Lipovich, L.; McCouch, S.R.; Park, W.D.; Ayres, N.; Cartinhour, S.; Ayres, S. Cartinhour. Diversity of microsatellites derived from genomic libraries and GenBank sequences in rice (Oryza sativa). Theor. Appl. Genet. 2000, 100, 713–722. [Google Scholar] [CrossRef]
- Desai, H.; Hamid, R.; Ghorbanzadeh, Z.; Bhut, N.; Padhiyar, S.M.; Kheni, J.; Tomar, R.S. Genic microsatellite marker characterization and development in little millet (Panicum sumatrense) using transcriptome sequencing. Sci. Rep. 2021, 11, 14. [Google Scholar] [CrossRef]
- Labbé, J.; Murat, C.; Morin, E.; Le Tacon, F.; Martin, F. Survey and analysis of simple sequence repeats in the Laccaria bicolor genome, with development of microsatellite markers. Curr. Genet. 2011, 57, 75–88. [Google Scholar] [CrossRef]
- Fitch, W.M. Distinguishing homologous from analogous proteins. Syst. Zool. 1970, 19, 99–113. [Google Scholar] [CrossRef]
- Huang, Y.; Feulner, P.G.D.; Eizaguirre, C.; Lenz, T.L.; Bornberg-Bauer, E.; Milinski, M.; Reusch, T.B.H.; Chain, F.J.J. Genome-Wide Genotype-Expression Relationships Reveal Both Copy Number and Single Nucleotide Differentiation Contribute to Differential Gene Expression between Stickleback Ecotypes. Genome Biol. Evol. 2019, 11, 2344–2359. [Google Scholar] [CrossRef] [PubMed]
- Koonin, E.V. Orthologs, paralogs, and evolutionary genomics. Annu. Rev. Genet. 2005, 39, 309–338. [Google Scholar] [CrossRef] [PubMed]
- Demuth, J.P.; Hahn, M.W. The life and death of gene families. Bioessays 2009, 31, 29–39. [Google Scholar] [CrossRef] [PubMed]
- Matsubara, M.; Komatsu, M.; Araki, T.; Asakawa, S.; Yokobori, S.-I.; Watanabe, K.; Wada, H. The phylogenetic status of Paxillosida (Asteroidea) based on complete mitochondrial DNA sequences. Mol. Phylogenetics Evol. 2005, 36, 598–605. [Google Scholar] [CrossRef]
- Mah, C.; Foltz, D. Molecular phylogeny of the Forcipulatacea (Asteroidea: Echinodermata): Systematics and biogeography. Zool. J. Linn. Soc. 2011, 162, 646–660. [Google Scholar] [CrossRef]
- Boore, J.L. Animal mitochondrial genomes. Nucleic Acids Res. 1999, 27, 1767–1780. [Google Scholar] [CrossRef]
- Jouzel, J.; Masson-Delmotte, V.; Cattani, O.; Dreyfus, G.; Falourd, S.; Hoffmann, G.; Minster, B.; Nouet, J.; Barnola, J.M.; Chappellaz, J.; et al. Orbital and Millennial Antarctic Climate Variability over the Past 800,000 Years. Science 2007, 317, 793–796. [Google Scholar] [CrossRef]
- Marko, P.B.; Hoffman, J.M.; Emme, S.A.; McGovern, T.M.; Keever, C.C.; Cox, L.N. The “Expansion-Contraction” Model of Pleistocene Biogeography: Rocky Shores Suffer a Sea Change? Integr. Comp. Biol. 2010, 50, E108. [Google Scholar] [CrossRef]
Disclaimer/Publisher’s Note: The statements, opinions and data contained in all publications are solely those of the individual author(s) and contributor(s) and not of MDPI and/or the editor(s). MDPI and/or the editor(s) disclaim responsibility for any injury to people or property resulting from any ideas, methods, instructions or products referred to in the content. |
© 2025 by the authors. Licensee MDPI, Basel, Switzerland. This article is an open access article distributed under the terms and conditions of the Creative Commons Attribution (CC BY) license (https://creativecommons.org/licenses/by/4.0/).