
Evaluation of Anchovy Egg Density: A Study on Differences Between Vertical and Oblique Towing Samplers for Ichthyoplankton

 ,
,  ,
,  ,
,
Abstract
1. Introduction
2. Material and Methods
2.1. Sampling and Analysis of Eggs
2.2. Statistical Analysis
3. Results
4. Discussion
5. Conclusions
Author Contributions
Funding
Institutional Review Board Statement
Informed Consent Statement
Data Availability Statement
Acknowledgments
Conflicts of Interest
References
- Stratoudakis, Y.; Bernal, M.; Ganias, K.; Uriarte, A. The Daily Egg Production Method: Recent advances, current applications and future challenges. Fish Fish. 2006, 7, 35–57. [Google Scholar] [CrossRef]
- Houde, E.D. Emerging from Hjort’s Shadow. J. Northw. Atl. Fish. Sci. 2008, 41, 53–70. [Google Scholar] [CrossRef]
- Diaz Conde, P.; Carrera Lopez, P.; Sanz Pinilla, L.; Tel, E. Sardine and Anchovy Eggs Abundance from PELACUS Surveys in the Northeast Atlantic Waters (Spring); SEANOE: Plouzané, France, 2024. [Google Scholar] [CrossRef]
- ICES. Working group on Southern Horse mackerel, anchovy and sardine (WGHANSA). ICES Sci. Rep. 2024, 6, 738. [Google Scholar]
- Pepin, P.; Helbig, J.A. Sampling variability of ichthyoplankton surveys—Exploring the roles of scale and resolution on uncertainty. Fish. Res. 2012, 117–118, 137–145. [Google Scholar] [CrossRef]
- Somarakis, S.; Palomera, I.; Garcia, A.; Quintanilla, L.; Koutsikopoulos, C.; Uriarte, A.; Motos, L. Daily Egg Production of anchovy in European waters. ICES J. Mar. Sci. 2004, 61, 944–958. [Google Scholar] [CrossRef]
- Basilone, G.; Ferreri, R.; Barra, M.; Bonanno, A.; Pulizzi, M.; Gargano, A.; Fontana, I.; Giacalone, G.; Rumolo, P.; Mazzola, S.; et al. Spawning eology of the European anchovy (Engraulis encrasicolus) in the Strait of Sicily: Linking variations of zooplankton prey, fish density, growth, and reproduction in an upwelling system. Progr. Oceanogr. 2020, 184, 102330. [Google Scholar] [CrossRef]
- Parker, K. A direct method for estimating Northern anchovy, Engraulis mordax, spawning biomass. Fish. Bull. 1980, 78, 541–544. [Google Scholar]
- Kurita, Y. Oocyte growth and fecundity regulation by atresia of Atlantic herring (Clupea harengus) in relation to body condition throughout the maturation cycle. J. Sea Res. 2003, 49, 203–219. [Google Scholar] [CrossRef]
- Somarakis, S.; Schismenou, E.; Siapatis, A.; Giannoulaki, M.; Kallianiotis, A.; Machias, A. High variability in the Daily Egg Production method parameters of an Eastern Mediterranean anchovy stock: Influence of environmental factors, fish condition and population density. Fish. Res. 2012, 117–118, 12–21. [Google Scholar] [CrossRef]
- Uriarte, A.; Alday, A.; Santos, M.; Motos, L. A re-evaluation of the spawning fraction estimation procedures for Bay of Biscay anchovy, a species with short interspawning intervals. Fish. Res. 2012, 117–118, 96–111. [Google Scholar] [CrossRef]
- Basilone, G.; Ganias, K.; Ferreri, R.; D’Elia, M.; Quinci, E.M.; Mazzola, S.; Bonanno, A. Application of GAMs and multinomial models to assess the spawning pattern of fishes with daily spawning synchronicity: A case study in the European anchovy (Engraulis encrasicolus) in the central Mediterranean Sea. Fish. Res. 2015, 167, 92–100. [Google Scholar] [CrossRef]
- Palermino, A.; De Felice, A.; Canduci, G.; Biagiotti, I.; Costantini, I.; Centurelli, M.; Menicucci, S.; Gašparević, D.; Tičina, V.; Leonori, I. Modeling of the habitat suitability of European sprat (Sprattus sprattus, L.) in the Adriatic Sea under several climate change scenarios. Front. Mar. Sci. 2024, 11, 1383063. [Google Scholar] [CrossRef]
- Quinci, E.M.; Torri, M.; Cuttitta, A.; Patti, B. Predicting potential spawning habitat by ensemble species distribution models: The case study of European anchovy (Engraulis encrasicolus) in the Strait of Sicily. Water 2022, 14, 1400. [Google Scholar] [CrossRef]
- Xiang, X.; Zhang, X.; Bian, X.; Lou, Q.; Xiong, Y. HSI model for early life stages of anchovy considering transport processes in Laizhou Bay. Front. Mar. Sci. 2022, 9, 946114. [Google Scholar] [CrossRef]
- Smith, P.E.; Flerx, W.; Hewitt, R.P. The CalCOFI vertical egg tow (CalVET) Net. In An Egg Production Method for Estimating Spawning Biomass of Pelagic Fish: Application to the Northern Anchovy (Engraulis mordax); Lasker, R., Ed.; NOAA Technical Report NMFS; U.S. Department of Commerce: Washington, DC, USA, 1985; Volume 36, pp. 27–32. [Google Scholar]
- Citores, L.; Ibaibarriaga, L.; Santos, M.; Uriarte, A. A Bayesian spatially explicit estimation of Daily Egg Production: Application to anchovy in the Bay of Biscay. Can. J. Fish. Aquat. Sci. 2024, 81, 1013–1028. [Google Scholar] [CrossRef]
- Köster, F.W.; Huwer, B.; Kraus, G.; Diekmann, R.; Eero, M.; Makarchouk, A.; Örey, S.; Dierking, J.; Margonski, P.; Herrmann, J.P.; et al. Egg production methods applied to eastern Baltic cod provide indices of spawning stock dynamics. Fish. Res. 2020, 227, 105553. [Google Scholar] [CrossRef]
- Ward, T.M.; Wolfe, B.W.; Grammer, G.L.; Ivey, A.R.; King, E.; Schiller, A.; McDonald, K.S.; Dambacher, J.M. Large sardine resource discovered off South-Eastern Australia: Potential risks, challenges and benefits of establishing a new fishery. Mar. Policy 2023, 155, 105739. [Google Scholar] [CrossRef]
- Schismenou, E.; Giannoulaki, M.; Valavanis, V.D.; Somarakis, S. Modeling and predicting potential spawning habitat of anchovy (Engraulis encrasicolus) and Round sardinella (Sardinella aurita) based on satellite environmental information. Hydrobiologia 2008, 612, 201–214. [Google Scholar] [CrossRef]
- FAO. The State of Mediterranean and Black Sea Fisheries 2023; FAO: Rome, Italy, 2023; ISBN 978-92-5-138411-4. [Google Scholar]
- Cury, P. Small pelagics in upwelling systems: Patterns of interaction and structural changes in “Wasp-Waist” ecosystems. ICES J. Mar. Sci. 2000, 57, 603–618. [Google Scholar] [CrossRef]
- Valenti, D.; Denaro, G.; Conversano, F.; Brunet, C.; Bonanno, A.; Basilone, G.; Mazzola, S.; Spagnolo, B. The role of noise on the steady state distributions of phytoplankton populations. J. Stat. Mech. 2016, 2016, 054044. [Google Scholar] [CrossRef]
- Rumolo, P.; Bonanno, A.; Barra, M.; Fanelli, E.; Calabrò, M.; Genovese, S.; Ferreri, R.; Mazzola, S.; Basilone, G. Spatial variations in feeding habits and trophic levels of two small pelagic fish species in the central Mediterranean Sea. Mar. Environ. Res. 2016, 115, 65–77. [Google Scholar] [CrossRef] [PubMed]
- European Union. Regulation (EU) Regulation (EU) 2017/1004 of the European Parliament and of the Council of 17 May 2017 on the Establishment of a Union Framework for the Collection, Management and Use of Data in the Fisheries Sector and Support for Scientific Advice Regarding the Common Fisheries Policy and Repealing Council Regulation (EC) No 199/2008 (Recast); OJEU L 157; European Union: Brussels, Belgium, 2017; pp. 1–121.
- ICES. Workshop 3 on age estimation of European anchovy (Engraulis encrasicolus) (WKARA3; Outputs from 2021 Meeting). ICES Sci. Rep. 2023, 5, 59. [Google Scholar]
- Lleonart, J.; Maynou, F. Fish stock assessments in the Mediterranean: State of the art. Sci. Mar. 2003, 67, 37–49. [Google Scholar] [CrossRef]
- Ferreri, R.; Genovese, S.; Barra, M.; Biagiotti, I.; Bourdeix, J.-H.; De FELICE, A.; Gašparević, D.; Hattab, T.; Iglesias, M.; Juretić, T.; et al. Variability in size at maturity of the European anchovy (Engraulis encrasicolus) in the Mediterranean Sea. Medit. Mar. Sci. 2021, 22, 858. [Google Scholar] [CrossRef]
- Barra, M.; Bonanno, A.; Hattab, T.; Saraux, C.; Iglesias5, M.; Leonori, I.; Tičina, V.; Basilone, G.; De Felice, A.; Ferreri, R.; et al. Effects of sampling intensity and biomass levels on the precision of acoustic surveys in the Mediterranean Sea. Medit. Mar. Sci. 2021, 22, 769. [Google Scholar] [CrossRef]
- Basilone, G.; Bonanno, A.; Patti, B.; Mazzola, S.; Barra, M.; Cuttitta, A.; McBride, R. Spawning site selection by European anchovy (Engraulis encrasicolus) in relation to oceanographic conditions in the Strait of Sicily. Fish. Oceanogr. 2013, 22, 309–323. [Google Scholar] [CrossRef]
- Lo, N.C.H.; Green Ruiz, Y.A.; Cervantes, M.J.; Moser, H.G.; Lynn, R.J. Egg production and spawning biomass of Pacific sardine (Sardinops sagax) in 1994, determined by the Daily Egg Production Method. CalCOFl Rep. 1996, 37, 160–174. [Google Scholar]
- Checkley, D.M., Jr.; Ortner, P.B.; Settle, L.R.; Cummings, S.R. A Continuous, underway fish egg sampler. Fish. Oceanogr. 1997, 6, 58–73. [Google Scholar] [CrossRef]
- Somarakis, S.; Tsimenides, N. A Daily Egg Production biomass estimate of the Northern Aegean Sea anchovy stock. Ozeanografika 1997, 2, 133–148. [Google Scholar]
- Machias, A.; Somarakis, S.; Tsimenides, N.; Magoulas, A.; Koutsikopoulos, C. Evaluation of the Southern Greek Anchovy Stocks; Project, No. 97-0048; Institute of Marine Biology of Crete: Gournes, Greece, 2000; p. 105. [Google Scholar]
- R Core Team. R: A Language and Environment for Statistical Computing; R Foundation for Statistical Computing: Vienna, Austria, 2023. [Google Scholar]
- Pennington, M. Efficient estimators of abundance, for fish and plankton surveys. Biometrics 1983, 39, 281. [Google Scholar] [CrossRef]
- ICES. Working Group on Biological Parameters (WGBIOP). ICES Sci. Rep. 2024, 5, 372. [Google Scholar]
- GFCM. Report of the Working Group on Stock Assessment of Small Pelagic Species (WGSASP); GFCM: Rome, Italy, 12–17 December 2022; p. 65. [Google Scholar]
- Džoić, T.; Zorica, B.; Matić, F.; Šestanović, M.; Čikeš Keč, V. Cataloguing environmental influences on the spatiotemporal variability of Adriatic anchovy early life stages in the Eastern Adriatic Sea using an artificial neural network. Front. Mar. Sci. 2022, 9, 997937. [Google Scholar] [CrossRef]
- Fernández-Corredor, E.; Albo-Puigserver, M.; Pennino, M.G.; Bellido, J.M.; Coll, M. Influence of environmental factors on different life stages of European anchovy (Engraulis encrasicolus) and European sardine (Sardina pilchardus) from the Mediterranean Sea: A literature review. Reg. Stud. Mar. Sci. 2021, 41, 101606. [Google Scholar] [CrossRef]
- Somarakis, S.; Catalano, B.; Tsimenides, N. Catchability and retention of larval European anchovy, Engraulis encrasicolus, with Bongo nets. Fish. Bull. 1998, 96, 917–925. [Google Scholar]
- Cada, G.F.; Loar, J.M. Relative effectiveness of two ichthyoplankton sampling techniques. Can. J. Fish. Aquat. Sci. 1982, 39. [Google Scholar] [CrossRef]
- Habtes, S.; Muller-Karger, F.E.; Roffer, M.A.; Lamkin, J.T.; Muhling, B.A. A comparison of sampling methods for larvae of medium and large epipelagic fish species during spring SEAMAP ichthyoplankton surveys in the Gulf of Mexico: Gulf of Mexico larval fish sampling gear. Limnol. Oceanogr. Methods 2014, 12, 86–101. [Google Scholar] [CrossRef]
- Hernandez, F.J.; Carassou, L.; Muffelman, S.; Powers, S.P.; Graham, W.M. Comparison of two plankton net mesh sizes for ichthyoplankton collection in the Northern Gulf of Mexico. Fish. Res. 2011, 108, 327–335. [Google Scholar] [CrossRef]
- Gutkowska, A.; Paturej, E.; Kowalska, E. Qualitative and quantitative methods for sampling zooplankton in shallow coastal estuaries. Ecohydrol. Hydrobiol. 2012, 12, 253–263. [Google Scholar] [CrossRef]
- Zhuang, X.; Guo, G.; You, X.; Hu, F. Sinking performance of new biplane depressor for constant-depth ichthyoplankton sampler at horizonal sampling. Aquac. Fish. 2024, S2468550X24001539. [Google Scholar] [CrossRef]
- Guo, G.; You, X.; Zhuang, X.; Hu, F.; Wang, H.; He, S.; Huang, L. Drag force and filtration performance of square-frame ichthyoplankton sampling net. Ocean Eng. 2024, 310, 118662. [Google Scholar] [CrossRef]
- ICES; WGACEGG. Working Group on Acoustic and Egg Surveys for Small Pelagic Fish in Northeast Atlantic (WGACEGG.; Outputs from 2023 Meeting). ICES Sci. Rep. 2024, 6, 227. [Google Scholar]
- Pinardi, N.; Zavatarelli, M.; Adani, M.; Coppini, G.; Fratianni, C.; Oddo, P.; Simoncelli, S.; Tonani, M.; Lyubartsev, V.; Dobricic, S.; et al. Mediterranean Sea large-scale low-frequency ocean variability and water mass formation rates from 1987 to 2007: A retrospective analysis. Progr. Oceanogr. 2015, 132, 318–332. [Google Scholar] [CrossRef]
- Uygun, O.; Hoşsucu, B. Temporal dynamics of the ichthyoplankton assemblages in the central Aegean Sea during one year and the effects of ecological factors. Reg. Stud. Mar. Sci. 2024, 72, 103439. [Google Scholar] [CrossRef]
- Patti, B.; Zarrad, R.; Jarboui, O.; Cuttitta, A.; Basilone, G.; Aronica, S.; Placenti, F.; Tranchida, G.; Armeri, G.M.; Buffa, G.; et al. Anchovy (Engraulis encrasicolus) early life stages in the central Mediterranean Sea: Connectivity issues emerging among adjacent sub-areas across the Strait of Sicily. Hydrobiologia 2018, 821, 25–40. [Google Scholar] [CrossRef]
- García, A.; Palomera, I. Anchovy early life history and its relation to its surrounding environment in the Western Mediterranean basin. Sci. Mar. 1996, 60, 155–166. [Google Scholar]


| 2007 | 2008 | 2009 | 2010 | 2014 | |
|---|---|---|---|---|---|
| N° Stations sampled | 110 | 127 | 78 | 82 | 96 |
| N° Egg PV | 180 | 234 | 145 | 505 | 46 |
| N° Egg B40 | 1330 | 1146 | 887 | 2826 | 305 |
| Average density PV (#eggs m−2) | 1.72 | 1.84 | 1.88 | 6.32 | 0.47 |
| Average density B40 (#eggs m−2) | 3.39 | 3.37 | 2.98 | 5.07 | 1.39 |
| N° of PV stations with 0 eggs | 77 | 86 | 53 | 27 | 83 |
| N° of B40 stations with 0 eggs | 58 | 83 | 41 | 8 | 69 |
| N° stations with PV > 0 and B40 = 0 | 5 | 10 | 3 | 1 | 3 |
| N° stations with B40 > 0 and PV= 0 | 24 (22%) | 13 (10%) | 15 (19%) | 20 (25%) | 17 (18%) |
| EggPV | EggB40 | VolPV | VolB40 | DepthPV | DepthB40 | densPV | densB40 | |
|---|---|---|---|---|---|---|---|---|
| n° stations | 256 | 256 | 256 | 256 | 256 | 256 | 256 | 256 |
| nbr.null | 89 | 22 | 0 | 0 | 0 | 0 | 89 | 22 |
| pos.median | 3 | 11 | 8 | 64 | 85 | 81 | 3 | 1 |
| pos.mean | 7 | 28 | 8 | 62 | 78 | 77 | 7 | 4 |
| pos.var | 123 | 2717 | 6 | 398 | 510 | 505 | 132 | 51 |
| pos.std.dev | 11 | 52 | 2 | 20 | 23 | 22 | 11 | 7 |
| geo.mean | 3 | 10 | 7 | 59 | 73 | 72 | 3 | 1 |
| pen.mean | 4 | 26 | 8 | 63 | 79 | 78 | 4 | 3 |
| pen.var | 55 | 5076 | 11 | 593 | 1008 | 938 | 58 | 97 |
| pen.std.dev | 7 | 71 | 3 | 24 | 32 | 31 | 8 | 10 |
| pen.mean.var | 0.2 | 12 | 0.04 | 2 | 4 | 4 | 0.2 | 0.2 |
| (A) | ||||||
|---|---|---|---|---|---|---|
| DF | Sum Sq | MeanSq | F value | Pr(>F) | ||
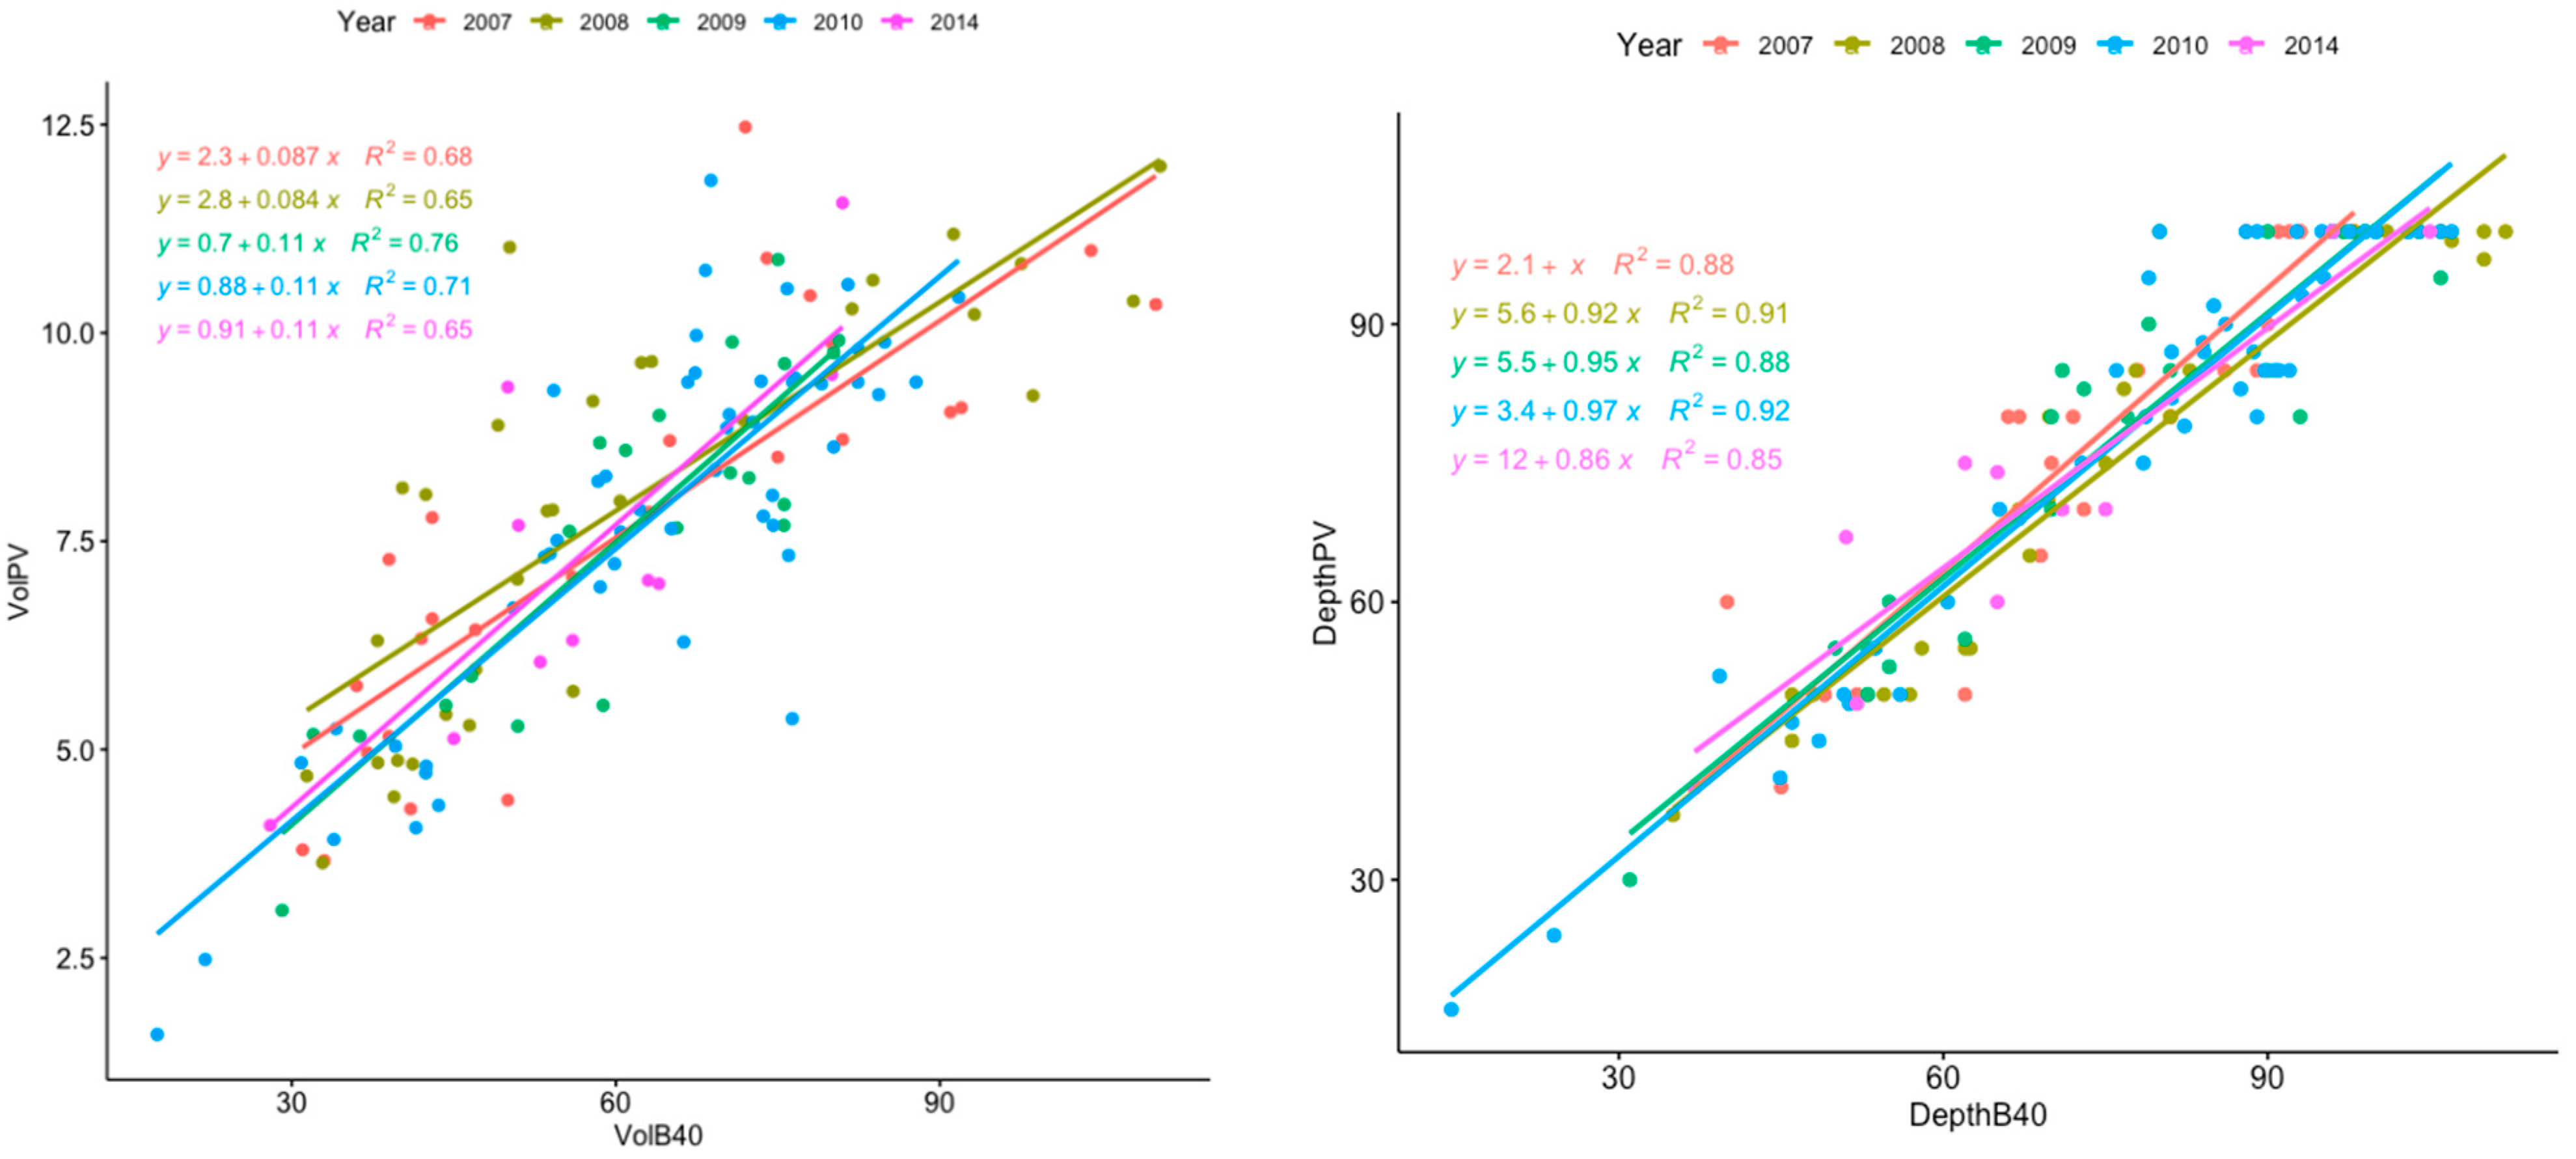
| VolB40 | 1 | 1011.82 | 1011.82 | 612.8557 | <2.00 × 10⁻¹⁶ | *** |
| Year | 4 | 13.87 | 3.47 | 2.0998 | 0.08143 | . |
| VolB40: Year | 4 | 19.4 | 4.85 | 2.9373 | 0.02127 | * |
| Residuals | 246 | 406.15 | 1.65 | |||
| (B) | ||||||
| DepthB40 | 1 | 118,053 | 118,053 | 2622.0383 | <2.20 × 10⁻¹⁶ | *** |
| Year | 4 | 737 | 184 | 4.0921 | 0.003141 | ** |
| DepthB40: Year | 4 | 257 | 64 | 1.4263 | 0.225779 | |
| Residuals | 246 | 11,076 | 45 | |||
| Sum of sq | Df | F Value | Pr(>F) | Significance | |
|---|---|---|---|---|---|
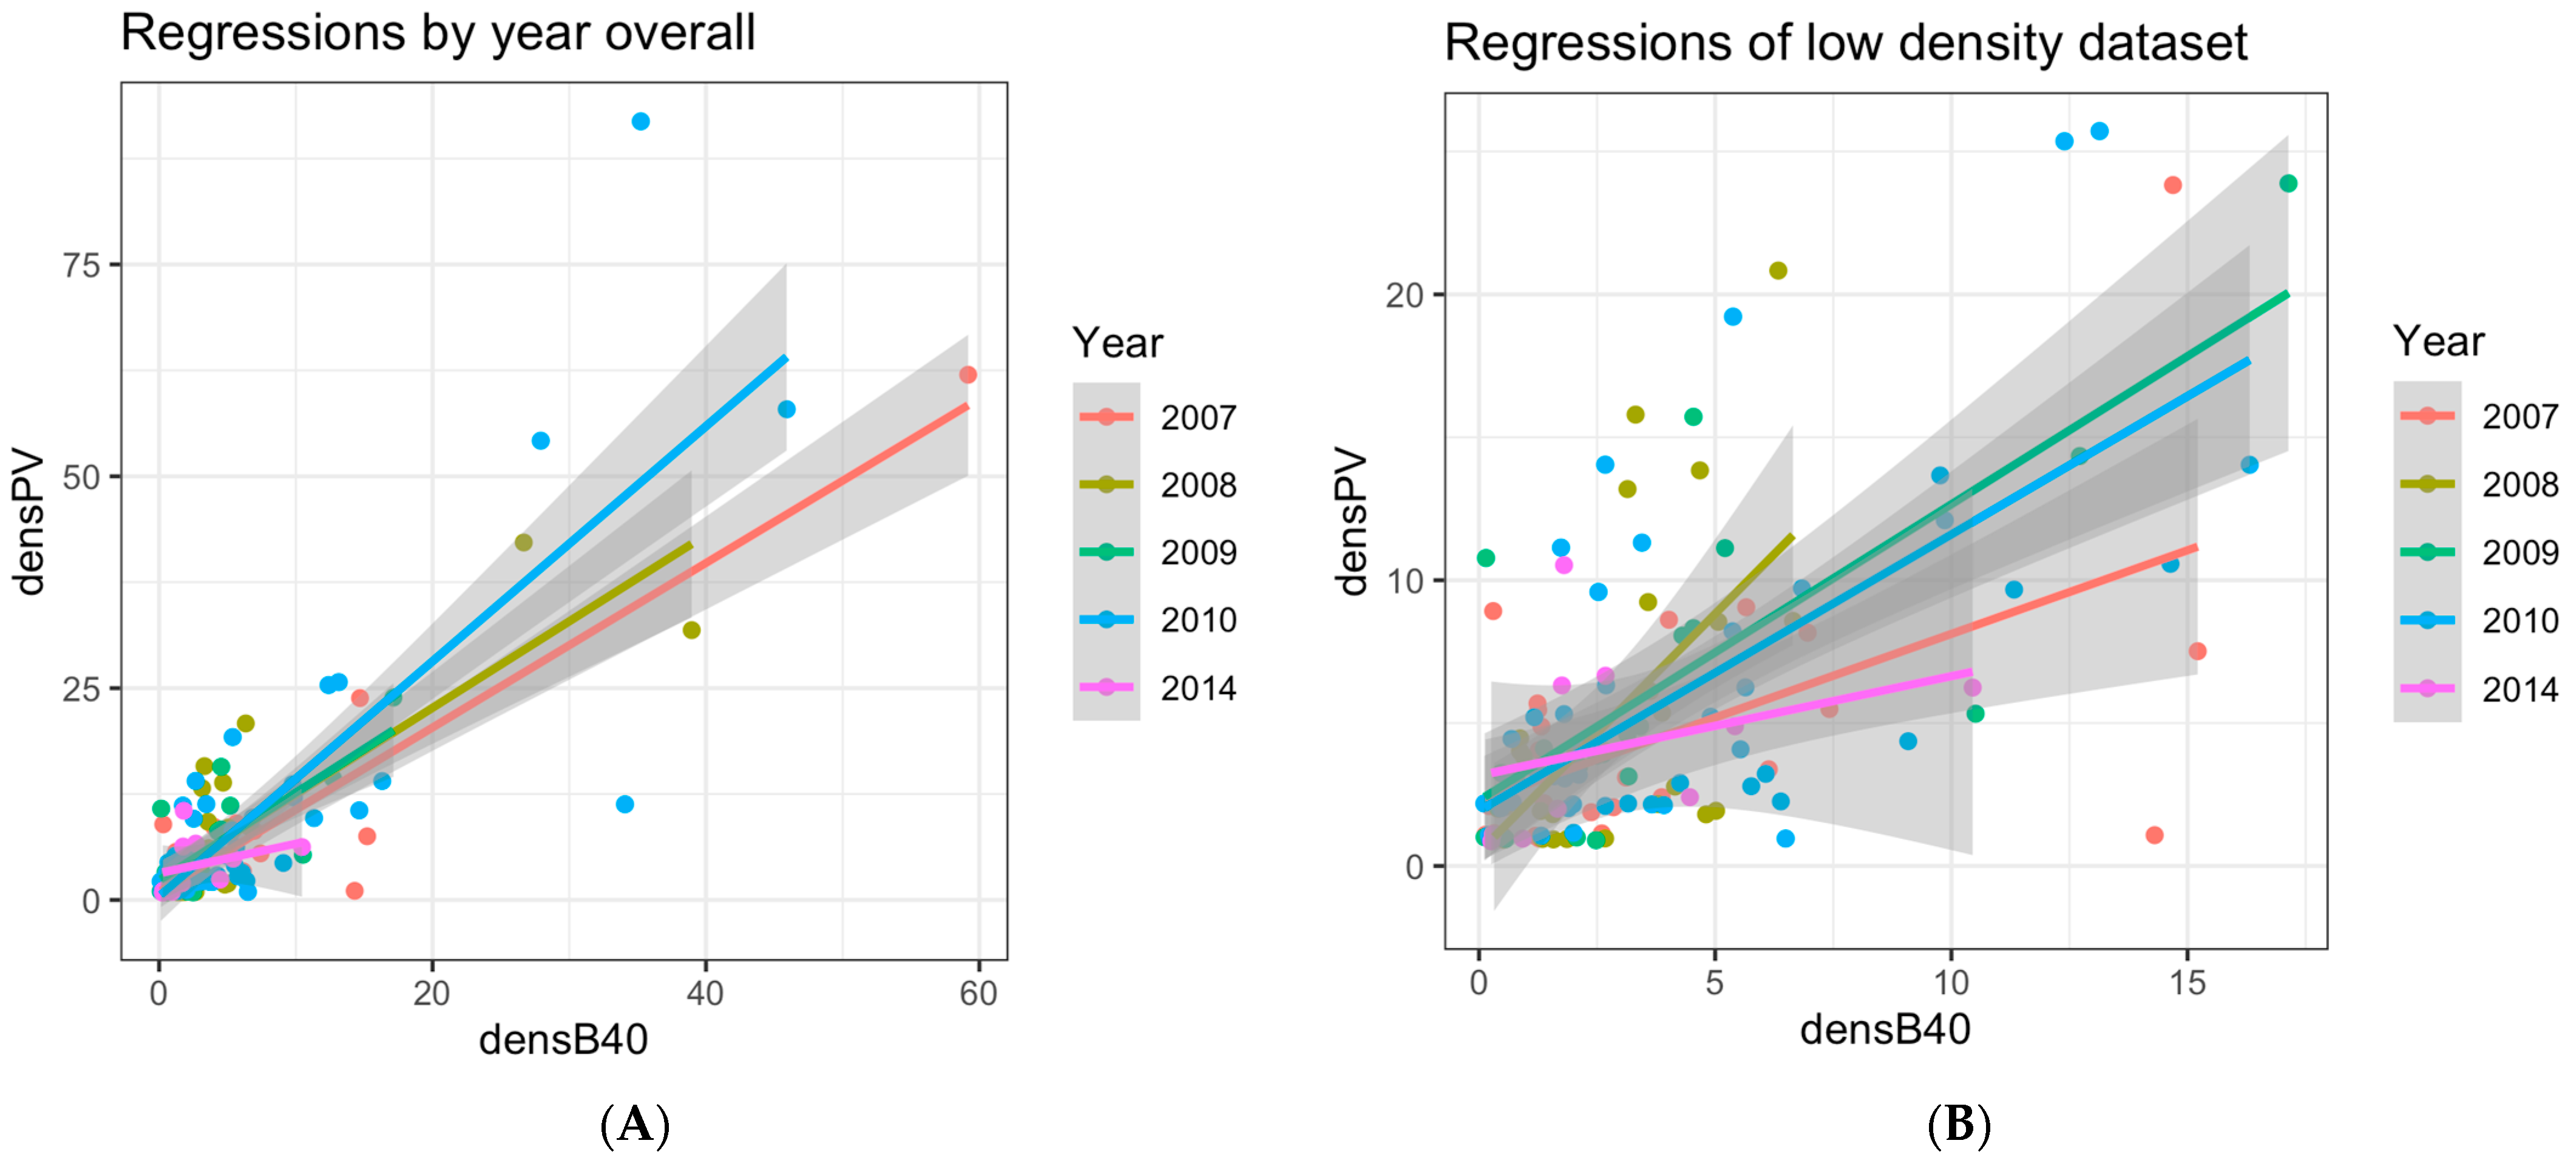
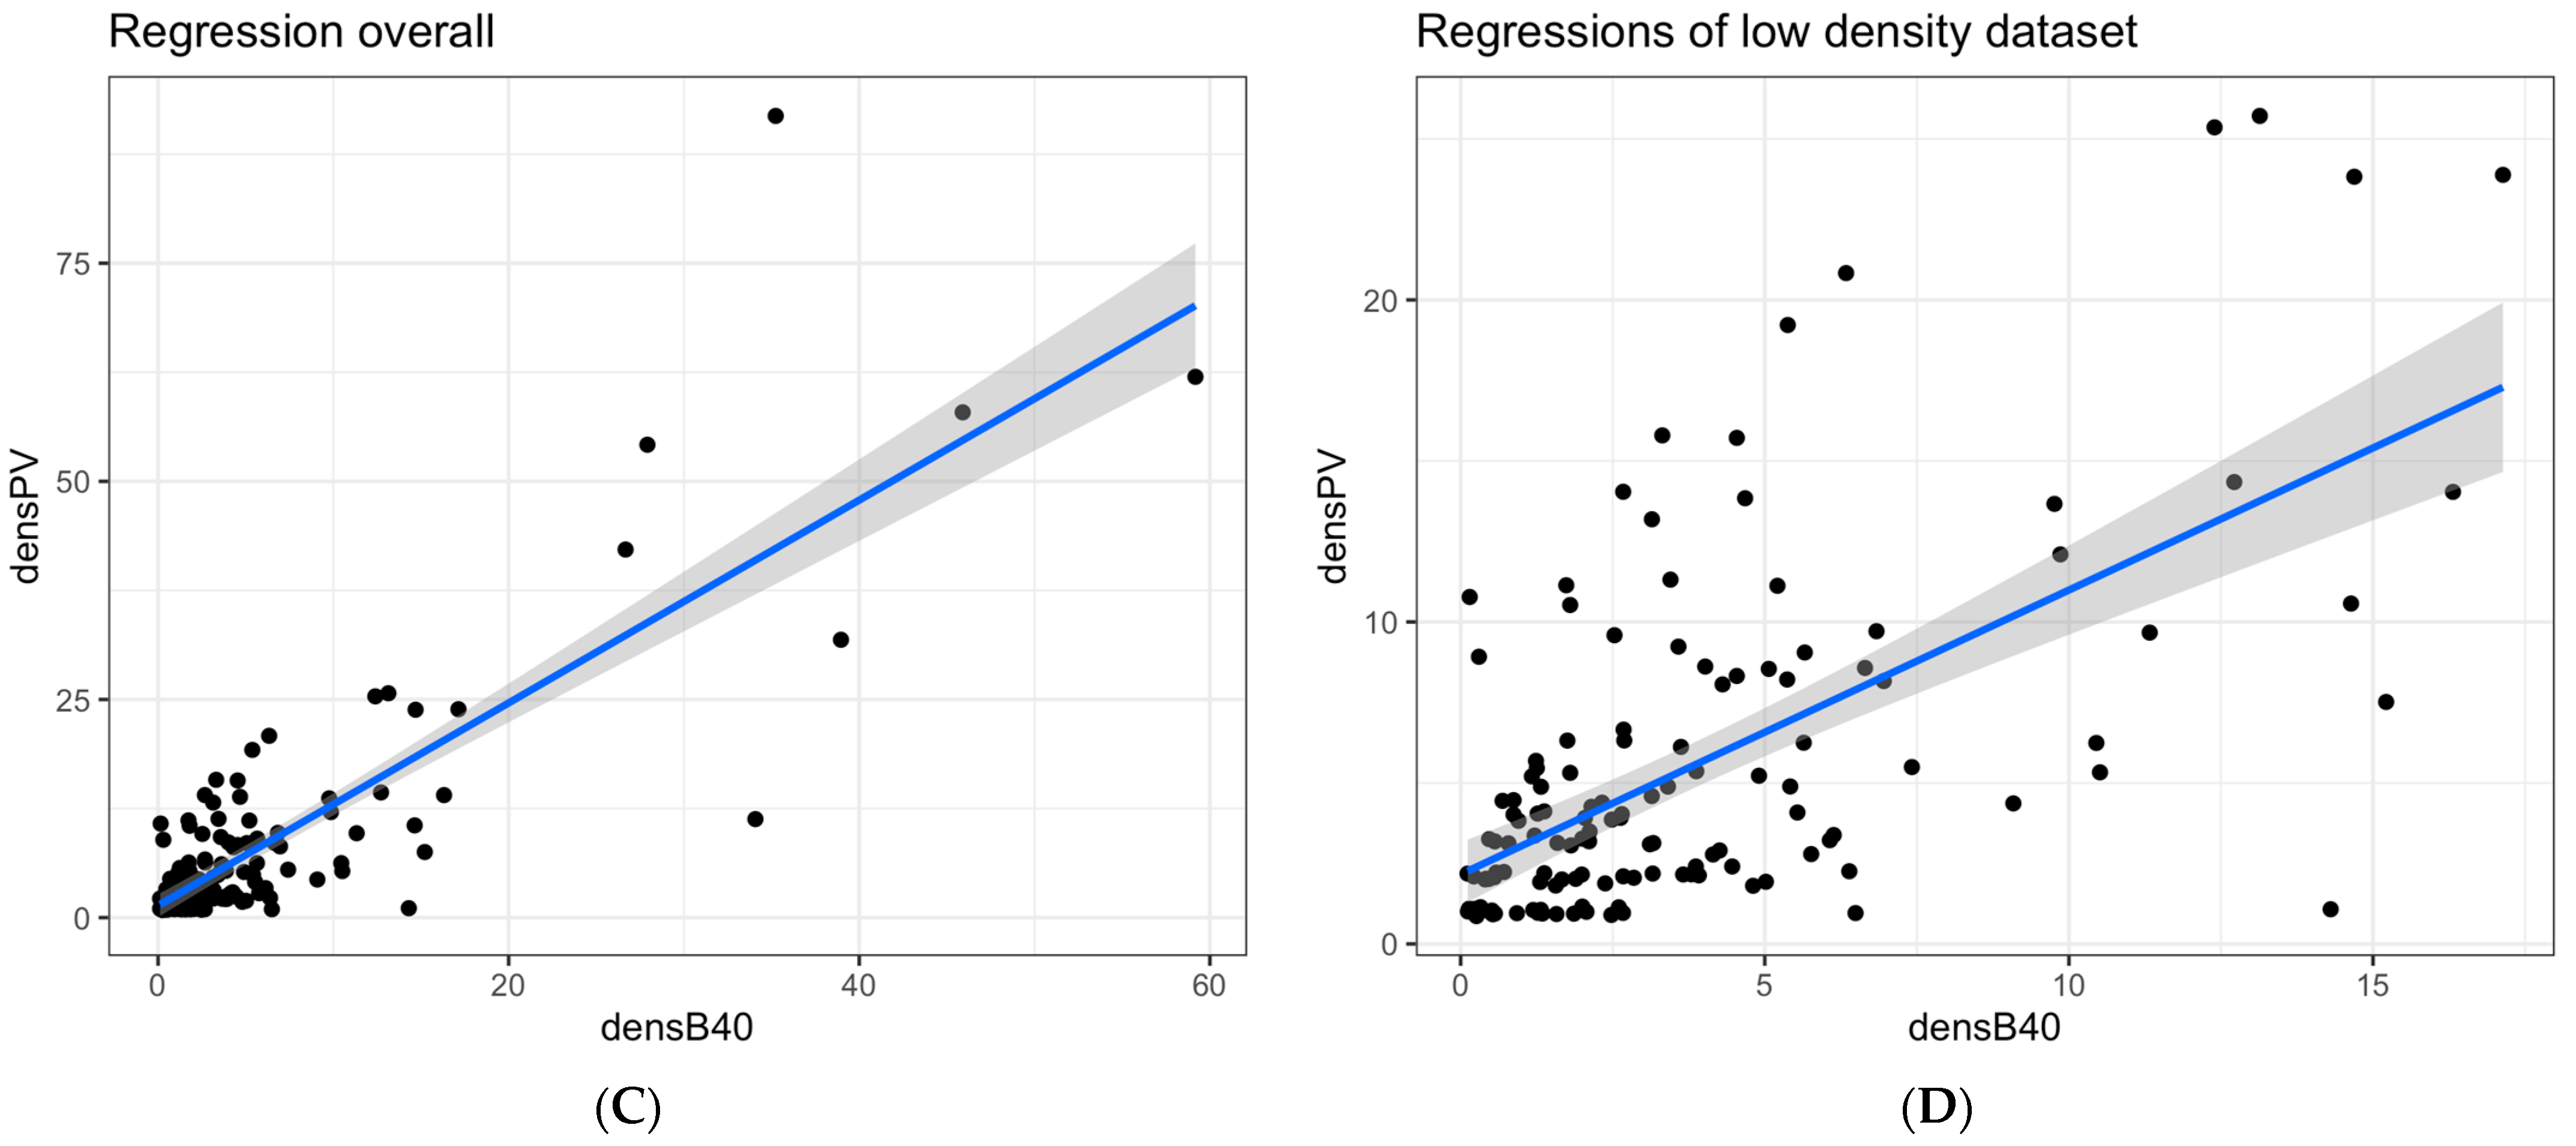
| densB40 | 16,503.8 | 1 | 606.7974 | 2.00 × 10⁻¹⁶ | *** |
| Year | 135.4 | 5 | 0.9956 | 0.42098 | |
| densB40:Year | 501.4 | 4 | 4.6092 | 0.00132 | ** |
| Residuals | 6690.7 | 246 |
| (A) | |||||
|---|---|---|---|---|---|
| Coefficients: | Estimate | Std. Error | t Value | Pr(>|t|) | Significance |
| densB40 | 1.17927 | 0.04924 | 23.951 | <2 × 10⁻¹⁶ | *** |
| Year 2007 | −0.32852 | 0.72656 | −0.452 | 0.652 | |
| Year 2008 | 1.07954 | 0.74234 | 1.454 | 0.147 | |
| Year 2009 | 0.41789 | 0.85886 | 0.487 | 0.627 | |
| Year 2010 | 1.0204 | 0.66644 | 1.531 | 0.127 | |
| Year 2014 | 0.01232 | 0.98121 | 0.013 | 0.99 | |
| <20 ind. m−2 | |||||
| (B) | |||||
| densB4020 | 0.97452 | 0.06893 | 14.137 | <2 × 10⁻¹⁶ | *** |
| Year 2007 | 0.23296 | 0.48622 | 0.479 | 0.63229 | |
| Year 2008 | 1.51174 | 0.49425 | 3.059 | 0.00247 | ** |
| Year 2009 | 0.9824 | 0.5814 | 1.69 | 0.09237 | . |
| Year 2010 | 1.09127 | 0.4698 | 2.323 | 0.02102 | * |
| Year 2014 | 0.2691 | 0.64033 | 0.42 | 0.67467 | |
Disclaimer/Publisher’s Note: The statements, opinions and data contained in all publications are solely those of the individual author(s) and contributor(s) and not of MDPI and/or the editor(s). MDPI and/or the editor(s) disclaim responsibility for any injury to people or property resulting from any ideas, methods, instructions or products referred to in the content. |
© 2025 by the authors. Licensee MDPI, Basel, Switzerland. This article is an open access article distributed under the terms and conditions of the Creative Commons Attribution (CC BY) license (https://creativecommons.org/licenses/by/4.0/).
Share and Cite
Basilone, G.; Ferreri, R.; Bonanno, A.; Genovese, S.; Aronica, S. Evaluation of Anchovy Egg Density: A Study on Differences Between Vertical and Oblique Towing Samplers for Ichthyoplankton. Oceans 2025, 6, 31. https://doi.org/10.3390/oceans6020031
Basilone G, Ferreri R, Bonanno A, Genovese S, Aronica S. Evaluation of Anchovy Egg Density: A Study on Differences Between Vertical and Oblique Towing Samplers for Ichthyoplankton. Oceans. 2025; 6(2):31. https://doi.org/10.3390/oceans6020031
Chicago/Turabian StyleBasilone, Gualtiero, Rosalia Ferreri, Angelo Bonanno, Simona Genovese, and Salvatore Aronica. 2025. "Evaluation of Anchovy Egg Density: A Study on Differences Between Vertical and Oblique Towing Samplers for Ichthyoplankton" Oceans 6, no. 2: 31. https://doi.org/10.3390/oceans6020031
APA StyleBasilone, G., Ferreri, R., Bonanno, A., Genovese, S., & Aronica, S. (2025). Evaluation of Anchovy Egg Density: A Study on Differences Between Vertical and Oblique Towing Samplers for Ichthyoplankton. Oceans, 6(2), 31. https://doi.org/10.3390/oceans6020031