Article

Following the Food: Dynamic, Seasonal Changes in the Fine-Scale Distribution of Foraging Minke Whales Within a Scottish Marine Protected Area (MPA)

by
Duncan A. I. MacDougall
1,* and
Kevin P. Robinson
1,2,*
1
Cetacean Research & Rescue Unit (CRRU), Banff AB45 3YQ, UK
2
Centre for Ecology & Conservation, University of Exeter, Cornwall TR10 9FE, UK
*
Authors to whom correspondence should be addressed.
Oceans 2025, 6(1), 18; https://doi.org/10.3390/oceans6010018
Submission received: 27 January 2025 / Revised: 14 March 2025 / Accepted: 19 March 2025 / Published: 20 March 2025
(This article belongs to the Special Issue Marine Mammals in a Changing World, 2nd Edition)

Abstract

:
Environmental heterogeneity is especially important in determining the distribution and spatial management of marine mammals. Intra-annual changes in distribution exhibited by highly mobile species such as baleen whales, however, present a challenge to traditional area-based management measures which should be accounted for in the designations, but these data are typically lacking. In the present study, we investigated the seasonal variables influencing the spatio-temporal distribution of feeding/foraging minke whales in the Southern Trench MPA in northeast Scotland. A presence–absence model was selected to determine the associations of feeding/foraging whales with areas of high prey density and other environmental determinants. Whale presence was strongly correlated with high burrowed sandeel density (BSD) in May and June and offshore thermal fronts (derived from the standard deviation of sea-surface temperature (SST SD)) from June to September. Both were concluded to be valuable proxies for the distribution of available prey and provided a compelling explanation for observed spatio-temporal shifts and high intraannual variability of whales from our long-term data. The present findings illustrate the value of prey data inclusion in habitat models for baleen whales on their feeding grounds, and advocate for a more dynamic, ecosystem-based approach to management for these highly mobile protected whales.

1. Introduction

Marine habitats are heterogenous over space and time leading to the non-random distribution of both predators and prey alike. This environmental heterogeneity is especially important when considering spatial management options for marine mammals, since the success of efforts to conserve protected populations relies on a clear understanding of the underlying factors driving their distributional changes [1].
In area-based management strategies for cetaceans, site selection is primarily structured upon fixed, physical features of the marine environment [2]. Highly sloped areas of the seabed, for example, promote upwellings in nutrient-rich waters, which heighten local productivity and aggregate targeted prey [3,4], whilst sea bottom sediments may provide integral habitats for benthic and demersal fish quarry [5]. Distribution in cetaceans, however, is also often linked to oceanographic variables, such as eddies, frontal systems, sea surface temperature (SST) and surface chlorophyll-a concentrations [6,7,8], which positively favour ecosystem richness and the availability of prey. Consequently, the relationship between predator–prey dynamics and the influence of the marine environment is highly complex and likely the result of compound interactions between topographic, oceanographic and even anthropogenic factors over multiple scales, which presents challenges to area-based management [9,10,11].
Whilst the mapping of important areas from spatial sightings is a crucial first step in the design of area-based management for cetaceans, temporal changes in the distribution of target species are rarely taken into account [12]. For example, many baleen whales exhibit such changes during their migrations from high latitude feeding grounds to low latitude breeding grounds [13], but also within feeding areas [14,15,16,17,18]. Thus, area-based management measures for such highly mobile species should account for these distributional changes that may limit the efficacy of traditional static MPAs, but these data are often lacking. There is subsequently a need to integrate the underlying behavioural factors driving these changes into spatial models in priority areas to better understand the distributional trends observed [19].
The minke whale (Balaenoptera acutorostrata) has recently been categorised as a ‘Priority Marine Feature’ by the Scottish Government [20] and is considered to be an important ecological component of the marine ecosystem in northeast Scotland [21,22]. The highly productive waters of the Moray Firth (57°41′ N, 2°40′ W) afford rich, inshore feeding grounds for these coastal baleen whales during the summer and autumnal months [21,22,23,24] where they are known to principally target sandeels (Ammodytes marinus), sprat (Sprattus sprattus) and herring (Clupea harengus) through both active corralling and more passive bird-associated feeding behaviour [21,22,24]. In 2020, the Southern Trench, along the southern coastline of the outer Moray Firth (Figure 1), was designated as a Marine Protected Area (MPA) for the protection of the species. Within the Southern Trench MPA, minke whales have previously been known to associate with ocean floor topography, water depth, seabed classification (according to sedimentary characteristics) and sea surface temperature [21,25]. Additionally, prey switching and seasonal dietary plasticity [22,26], as well as habitat partitioning by age-class [22], may explain the high inter-/intra-annual variability in observed sightings, but the likely changes in distribution as a result are not yet understood.
Studies addressing temporal shifts in the distribution of highly mobile species are necessary to inform improved area-based management of their important habitats (e.g., [27]), providing the biological rationale to proactively shift, extend or retract protective management boundaries. Thus, in the present study, we investigated the temporal changes influencing the seasonal distribution of feeding/foraging minke whales within the Southern Trench MPA, to better understand their intra-annual movements and identify seasonally important habitat features giving rise to feeding opportunities. A presence–absence model was employed to determine temporally dynamic associations of feeding/foraging whales with areas of high prey density and frontal systems, as well as associations with other environmental variables. The aim of the study was to identify features of biological importance within this recently established MPA, in order to inform and advance the adaptive management process for this and other Scottish MPAs also including minke whales as a priority feature.

2. Materials and Methods

2.1. Data Collection and Processing

Sightings data were collected during dedicated boat-based surveys within a 1980 km2 area of the southern Moray Firth (Figure 1) between May and October, from 2009 to 2022 inclusive. Surveys were conducted using an 8 metre rigid-hulled inflatable boat (RHIB), operated at speeds of 7 to 10 knots during favourable sea conditions (≤3 Beaufort Sea State, swells of less than 1 m and visibility ≥ 1.5 km) and with 4 to 8 trained observers (for full methodology, see Robinson et al. [21]). From a total of 24,640 km of survey effort, 570 whale sightings were recorded. Since the aim of the present study was to uncover the intra-annual associations by minke whales with biologically important environmental characteristics driven by feeding behaviour, only feeding/foraging animals (n = 458) were used in the following analyses. This is because non feeding/foraging animals that may be travelling between foraging habitats are not likely to be associated with the same conditions as actively feeding/foraging animals [28].
All spatial analyses were carried out using QGIS v3.28.1 [29]. Spatial layers were projected to the British National Grid Transverse Mercator coordinate reference system, so that spatial distances could be interpreted in metric units. A presence–absence approach was employed to produce a dependent variable for the probability of feeding/foraging whale presence. Since the study aimed to incorporate monthly and interannual variation, this required up to six presence–absence grids (one for every month surveyed) for each study year, 2009 to 2022, respectively, resulting in a total of 73 grids with a cell size of 2 km2 set to capture fine-scale environmental variability. Therein, all grid cells containing positive search effort with at least one whale sighting were categorised as ‘presence’ cells, whereas those cells containing positive effort but with zero sightings were categorised as ‘absence’ cells.
In accordance with previous modelling studies of foraging cetaceans, where absence cells adjacent to presence cells are typically established as false-absences [30], each sighting location in the following analyses was assigned a 2 km buffer area (also in-line with the estimated foraging range typically utilised by minke whales in the study area of 1 to 2 km (KP Robinson, unpublished data [31])). In addition, survey track line layers were provided with a 1.5 km buffer area as a steadfast spotting distance for detecting whales during boat-based survey work.
A rectangular raster grid of the study area was created, measuring 553 by 159 cells, with a resolution of 200 m2 per cell. Mean depth values were obtained using bathymetry data derived from Admiralty charts of the Moray Firth and the slope layer (in degrees) was derived from these depth data. Monthly composite images of sea surface temperature (SST) (°C) and chlorophyll-a concentration (CHL) (mg m−3) were provided by the Natural Environment Research Council (NERC) Earth Observation Data Acquisition and Analysis Service (NEODAAS), at 1 km resolution (0.01 degrees).
Since frontal areas typically exhibit large SST gradients, the standard deviation of SST (SST SD) was used to quantify thermal fronts [32,33]. SST SD was calculated for each survey month using the r.neighbors tool from the GRASS 7 GIS core plugin, at the same resolution and coverage as SST. A 7 by 7 cell neighbourhood matrix was chosen to reflect the wider general area around the fronts, as well as the fronts themselves.
Direct variables for prey distribution and quality (e.g., prey density) are typically strong predictors of marine predator occurrence [34,35,36,37,38,39], but such data are usually scarce [35]. Sandeels, however, are highly spatially restricted by the availability of suitable burrowing sediment [40] and thus, their distribution, even at fine scales, is predictable [41]. For the present study, spatial estimates of burrowed lesser sandeel density (BSD) were available from Marine Scotland at a resolution of 200 m (under Open Government Licence v 3.0) [41].
All GIS data layers were subsequently overlayed with the corresponding cells in the presence–absence grid. The mean value for all variables in each cell was calculated for each presence–absence grid cell accordingly. The grids with data sampled for all environmental and prey layers were subsequently collated for the following analyses.

2.2. Statistical Analysis

All statistical analyses were carried out using RStudio v2023.12.1+402 [42]. The collinearity between explanatory variables, including physiographic (depth and slope), oceanographic (SST, SST SD and CHL), ecological (BSD) and temporal (month, year) variables, was examined using the ‘pairs’ function in RStudio.
A generalised additive model (GAM) was selected in the subsequent analyses since several of the relationships between presence/absence and the explanatory variables were expected to be non-linear. GAM functions were accessed using the mgcv package in RStudio [43] and low-rank thin plate smoothing splines were applied to depth, sea surface temperature (SST) and slope in the initial model, with the maximum number of smoothing basis functions (k) set at 4 for each of these smooth terms, to prevent overfitting. Tensor product interactions were included for both BSD and SST SD, interacting with month, with k set to 6 for these interactions. Smooth functions of the main effects (SST SD, BSD and month) were further included, with k set to 4 for SST SD and BSD and to 6 for month (May to October). Year was included as a linear predictor to capture interannual variation in the probability of minke whale presence.
The GAM family was set as ‘binomial’ using a logit link function. Restriction maximum likelihood (REML) was selected for smoothness selection to prevent overfitting, whilst concurvity amongst model smooth terms was assessed by looking at worst-case concurvity, as evaluated by the concurvity function in the mgcv package. Due to strong concurvity (concurvity > 0.8) being detected between SST SD and the tensor product interaction between SST SD and month, the smooth main effects for month and SST SD were removed from the model and a full tensor product smooth between SST SD and month was replaced. This may be preferable to simply discarding the main effects as the full tensor product smooth retains the main smooth effects within the term whilst using fewer smoothing parameters. However, a subsequent concurvity check indicated there was still high concurvity between the SST smooth and the full tensor product smooth interaction (>0.8). Since seasonal associations with fronts were expected to be more directly important for minke whales than SST, the SST smooth term was therefore removed from the model and replaced with a linear SST term. To check that the number of smoothing basis functions, k, was set at an appropriate level, checks were carried out using the gam.check function in mgcv. These indicated that k was set appropriately for all the smooth model terms except for depth. Subsequently, the number of basis functions for depth was increased to 8, with checks indicating this was an appropriate k value for depth as indicated by high p-values (p > 0.05) and effective degrees of freedom that were not close to the upper limits set by k. A final check indicated that there were no further issues of concurvity further to these changes (worst-case concurvity < 0.7).

2.3. Model Validation and Selection

To assess whether the model used met the assumptions of a GAM, model validation techniques were applied to examine the residuals. The assumption of homogeneity of residual variance was evaluated by plotting the mean residuals against all model explanatory variables. Due to the binary nature of the response variable (presence versus absence), however, the standard residual plots were difficult to interpret and so ‘binned’ residuals versus explanatory variables were created and examined using the arm package (version 1.12-2) [44] to display the mean residuals for discrete levels (bins) of the continuous explanatory variables. To assess whether the model had met the assumptions of temporal and spatial independence, mean residuals of the final model were plotted against the temporal variables (month and year) and spatial variables (latitude and longitude)×, respectively. Model selection was conducted with comparison of the Akaike’s information criterion (AIC) between the full model and alternative models, where non-significant predictors were removed from the model until all remaining predictors were significant. The full model was selected unless differences in AIC between the full and any alternative models was greater than 2, in which case the model with the lowest AIC was selected accordingly.

3. Results

3.1. Sightings Data

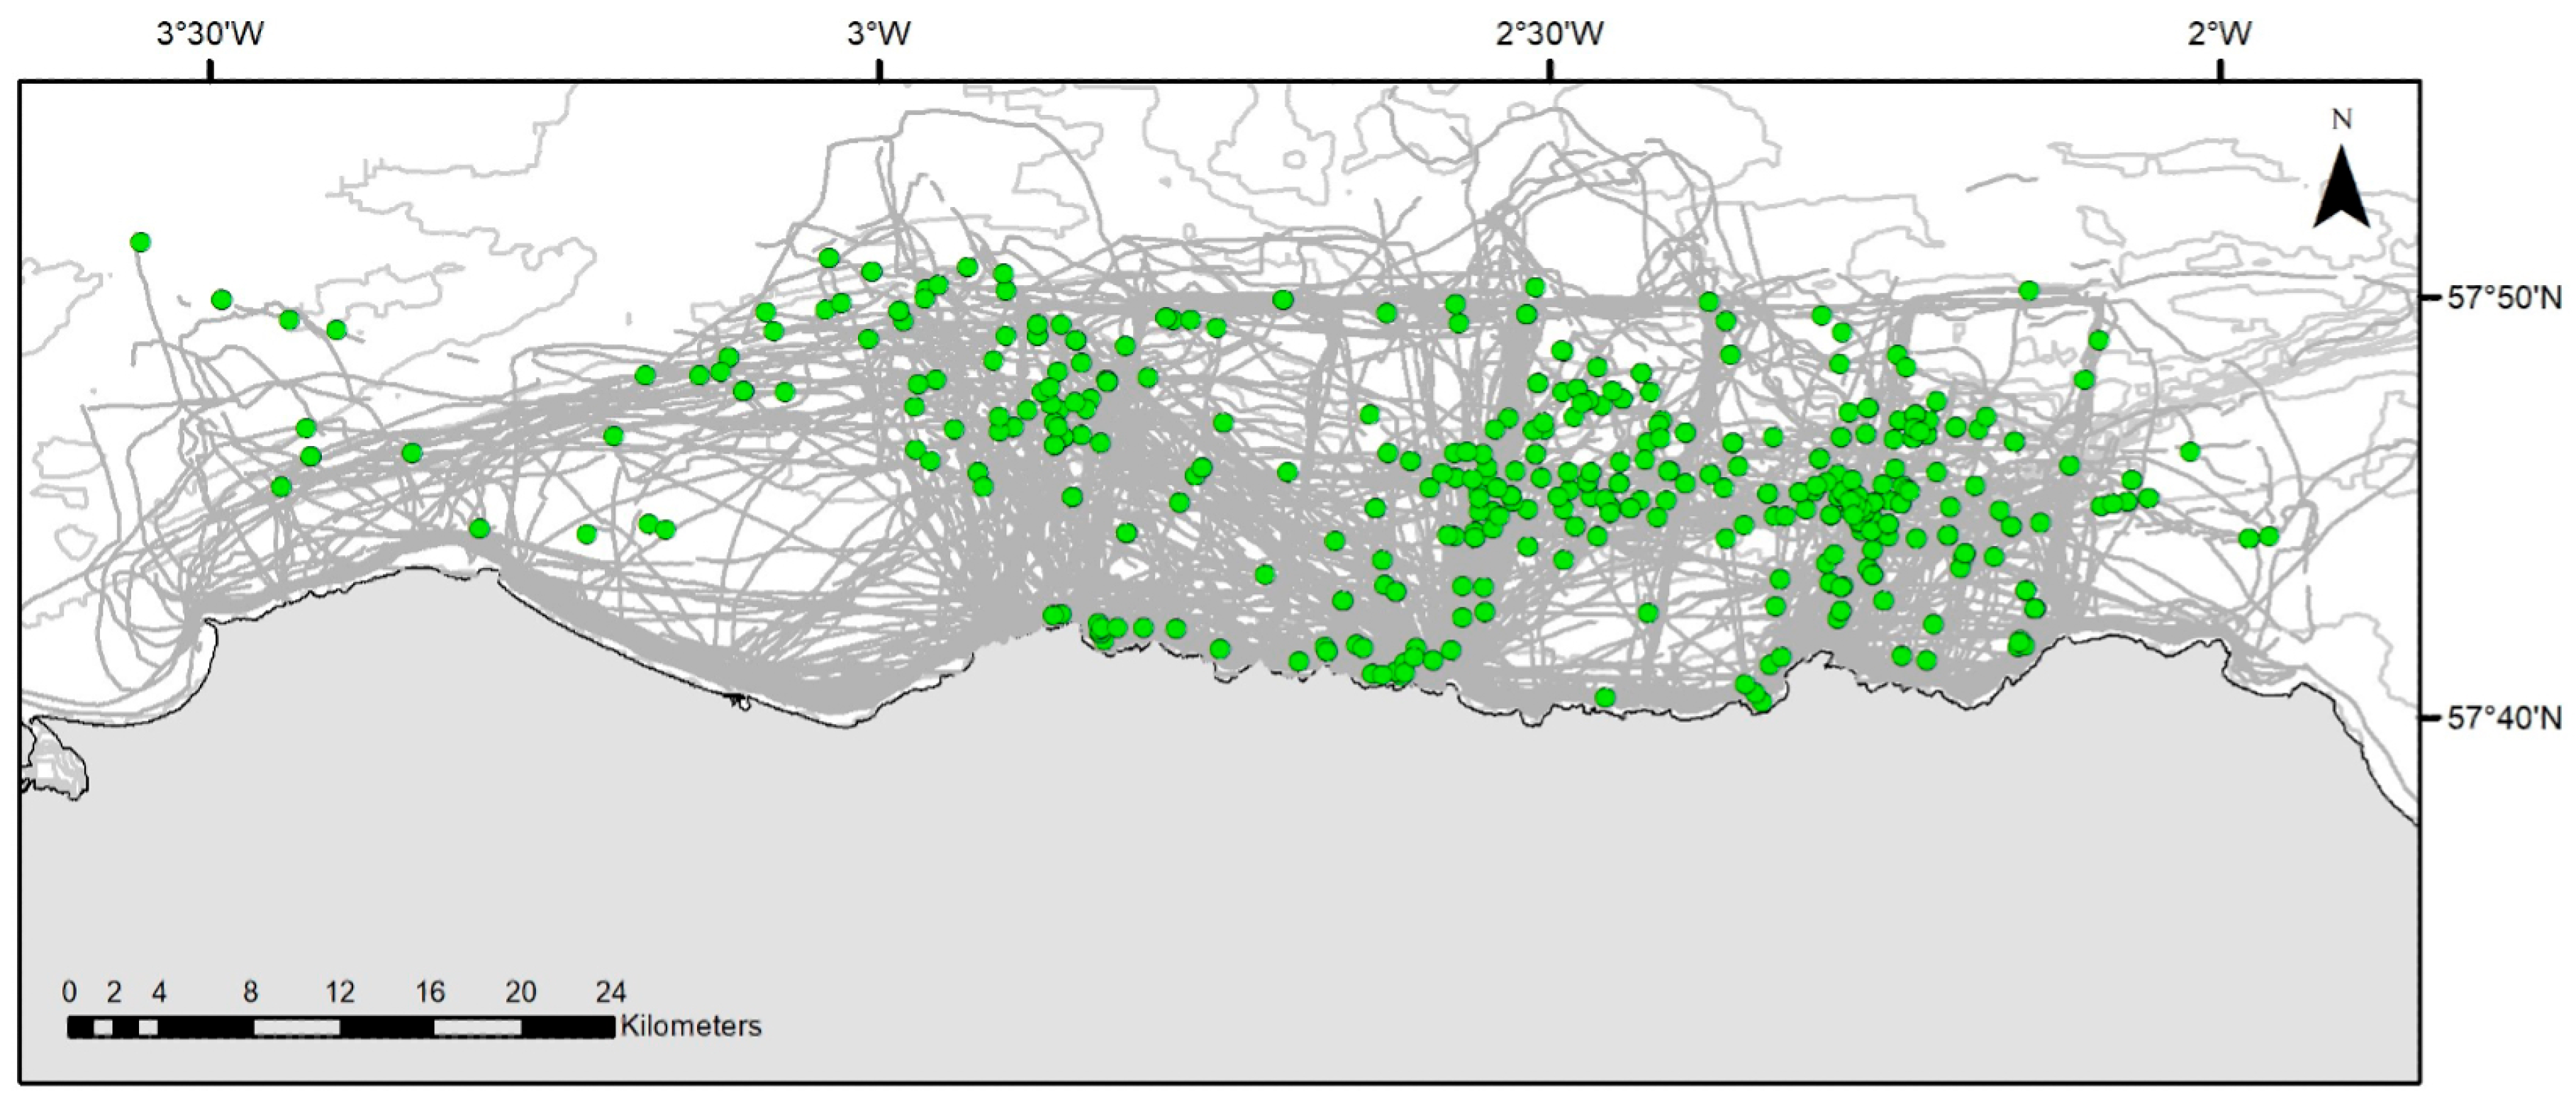
The spatial distribution of feeding/foraging minke whales encountered in the study area between May and October 2009 to 2022 is shown in Figure 2. Whales were encountered throughout the study area but were more generally distributed towards the central and eastern areas of the study site, with a greater number of encounters offshore. Sightings were recorded from May to October inclusive (Figure 3a), but considerable variation was observed in the number of sightings from one month and from one year to the next (Figure 3a,b, respectively), with the highest number of sightings being recorded in 2018 and 2021 (Figure 3b).

3.2. Model Selection and Outputs

Since differences between the full and alternative GAMs were minor (Δ AIC < 2; Table 1), the full model was selected for the following analyses. The selected model explained 21.6% of the deviance and the mean residuals displayed no notable pattern when plotted against temporal (i.e., month and year) or spatial (i.e., latitude and longitude) variables, indicating that the assumptions of temporal and spatial independence in the residuals had not been violated. Furthermore, there were no apparent patterns in the residuals when plotted against the explanatory variables and since residual variance was similar, the assumption of homogeneity of variance in the residuals by the model had also been adequately met.
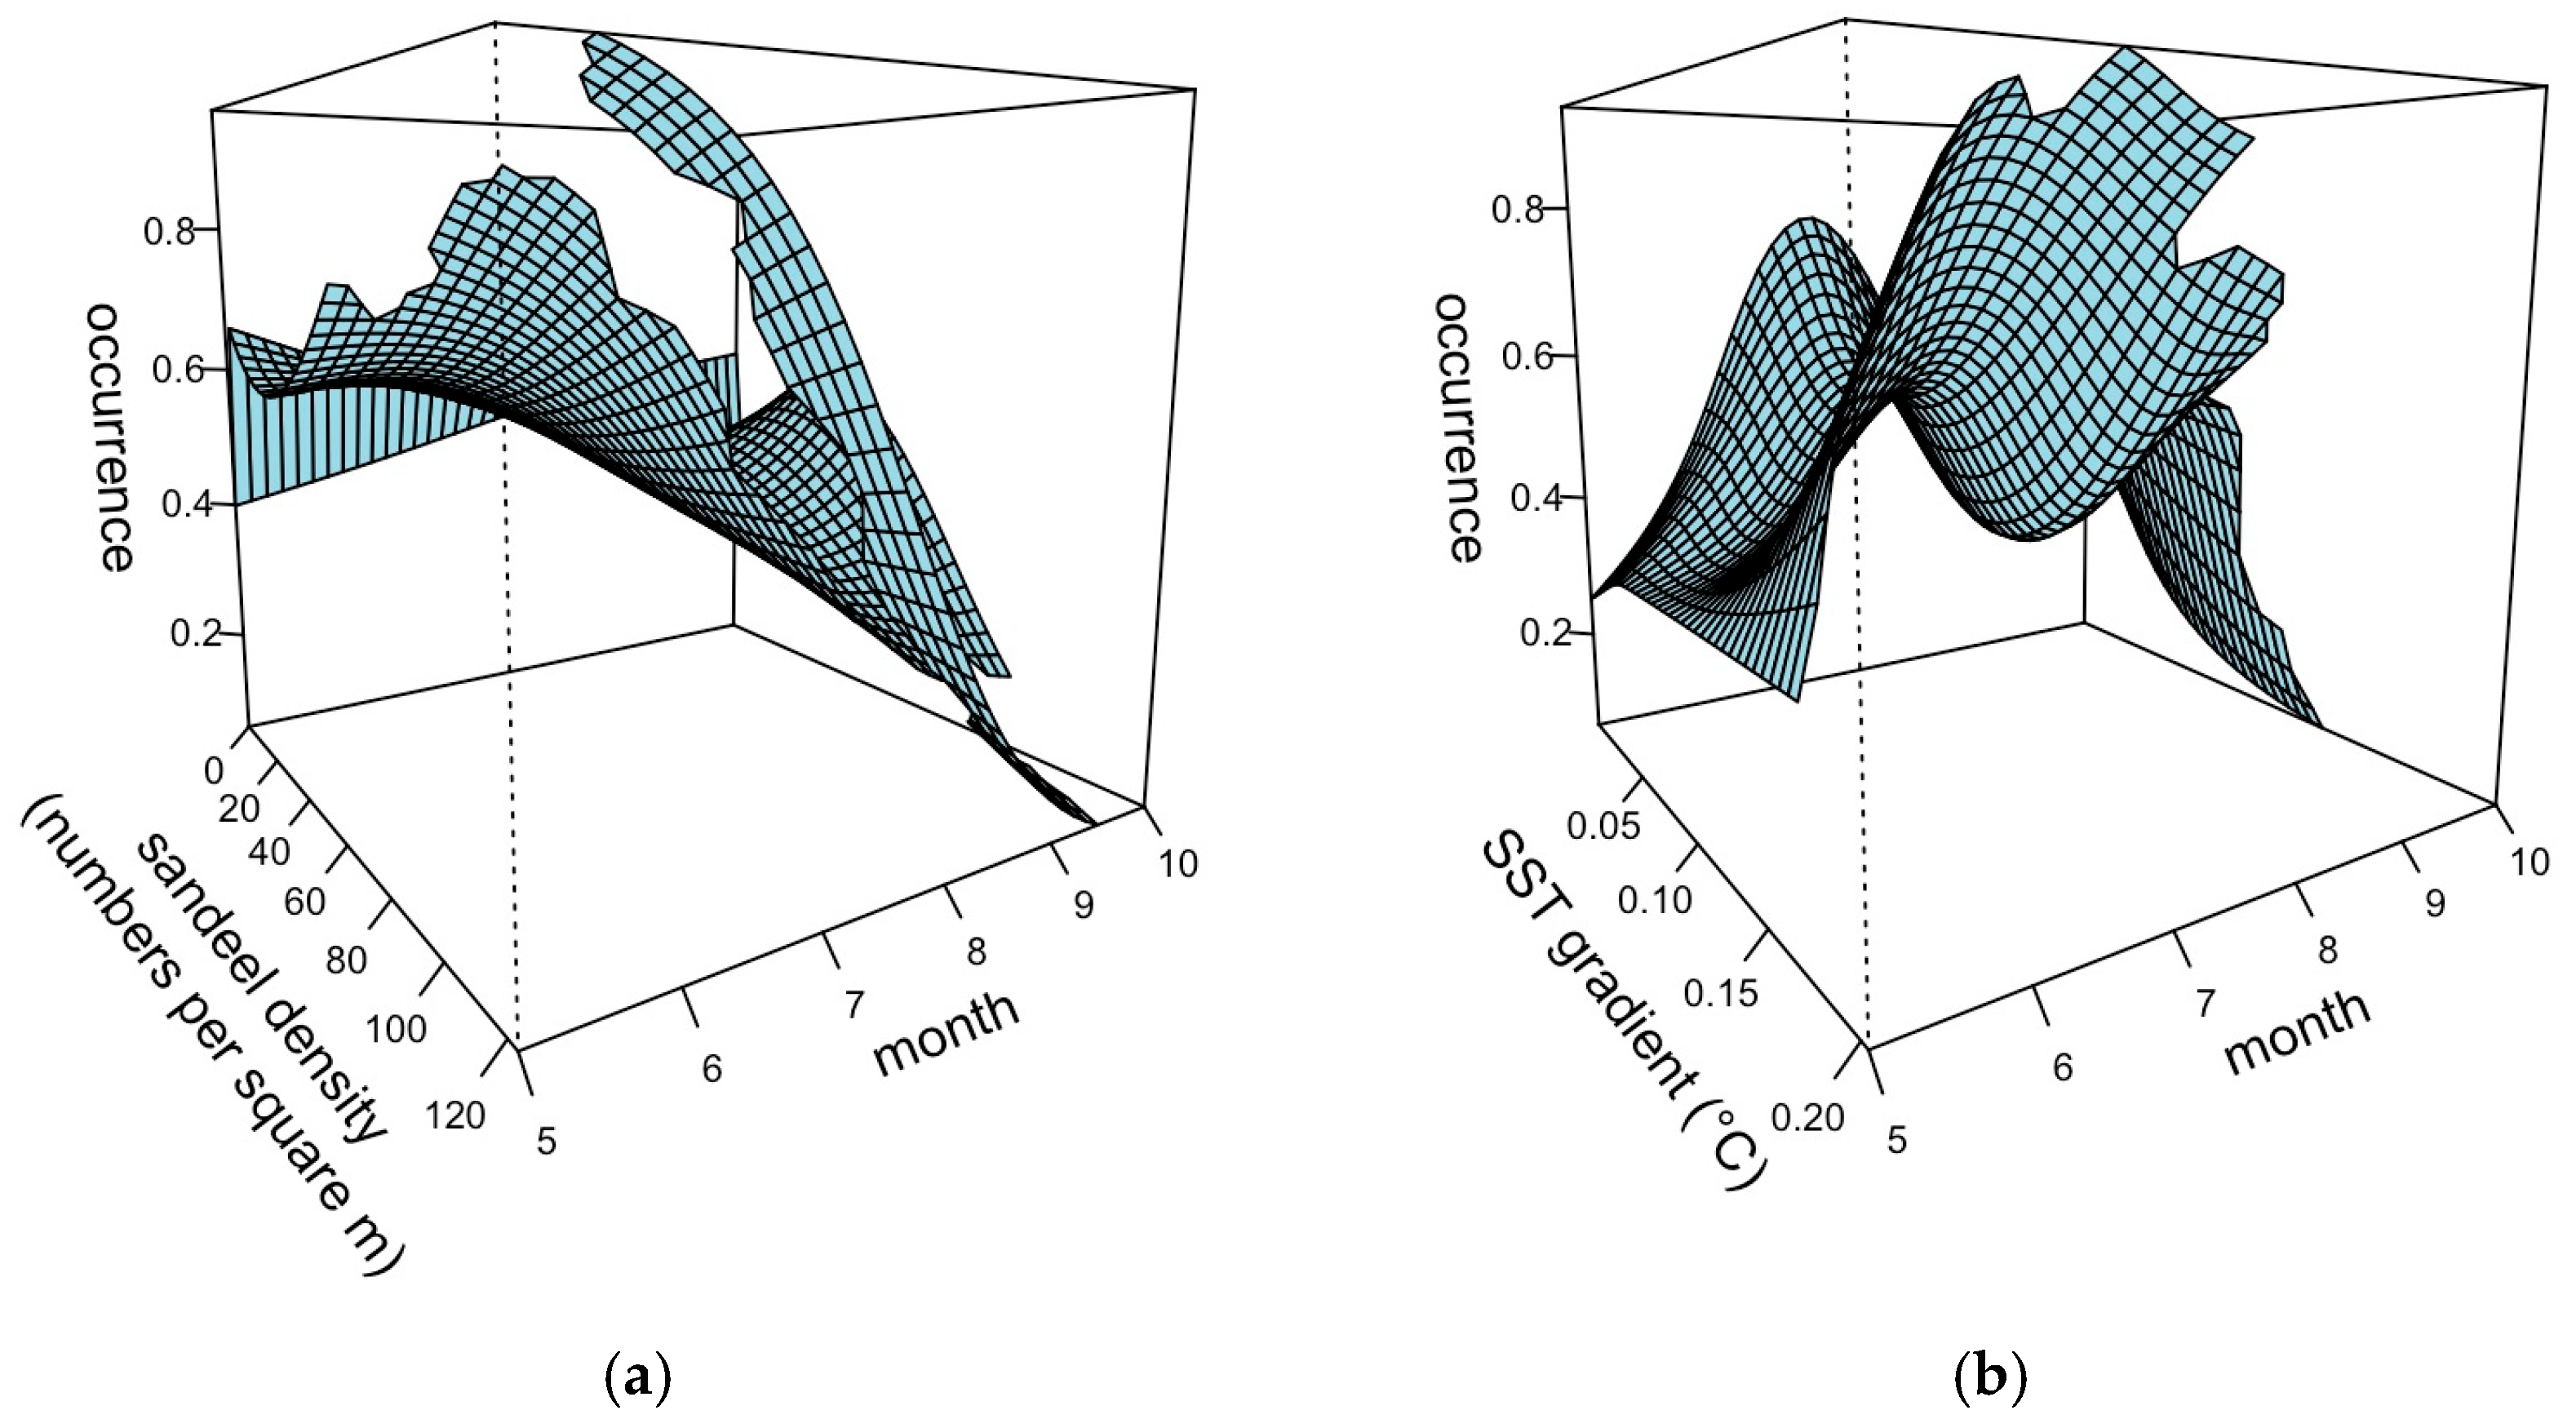
The tensor product interaction (ti) between burrowed sandeel density (BSD) and month was found to have a strong significant effect (Table 2), with feeding/foraging minke whale presence being strongly associated with high BSD levels during May and June but declining in the consecutive months thereafter. From May to July, feeding/foraging minke whale presence was much lower at low sandeel densities than at high sandeel densities but was similar in August and considerably higher at low BSD than at high BSD in September and especially October (Table 2; Figure 4a). The tensor product smooth (te) between sea surface temperature standard deviation (SST SD) and month was also found to have a very strong significant effect, with feeding/foraging whale presence between June and August being strongly influenced by high SST SDs (i.e., thermal fronts), although apparently also to a lesser degree at low SST SDs during the same period. By September and October, feeding/foraging whale presence very steeply declined, particularly at high SST SDs (Table 2, Figure 4b).
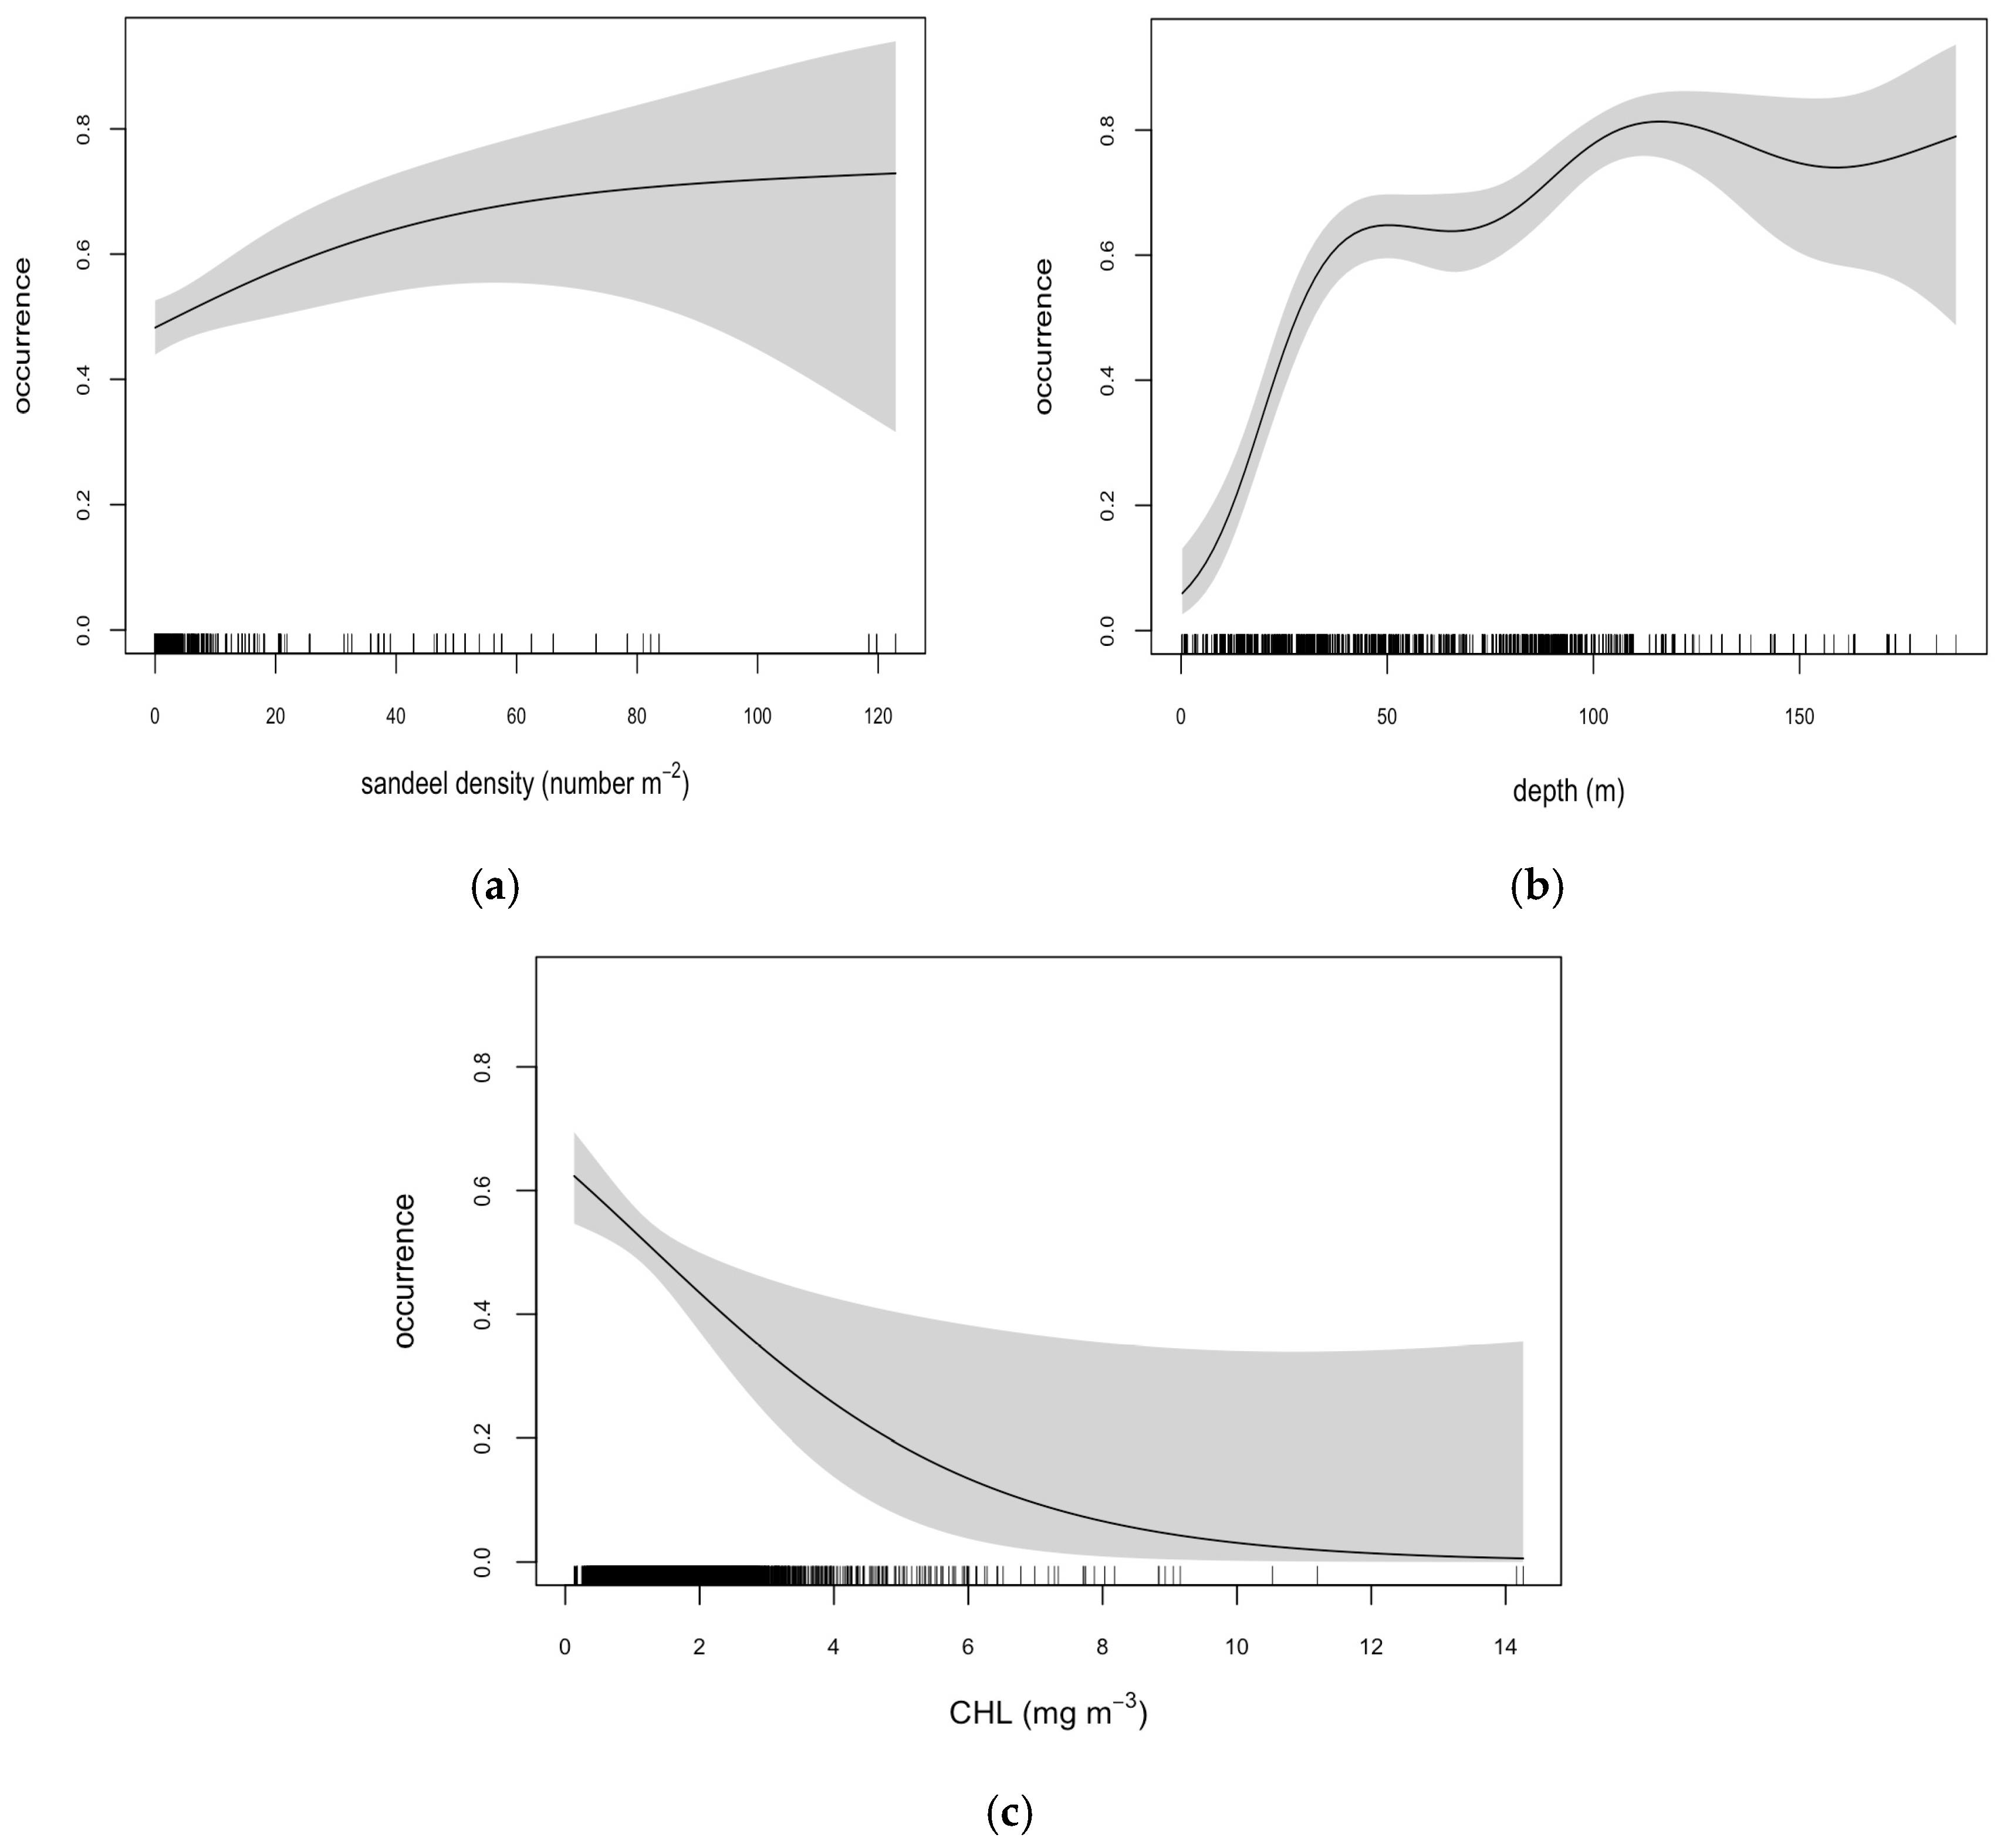
The main smooth effect of BSD had a weak but significant positive effect upon the presence of feeding/foraging minke whales (Table 2; Figure 5a). Other environmental variables, including depth and chlorophyll-a concentration (CHL), were also found to be significant predictors of the distribution of feeding/foraging whales (Table 2). Feeding/foraging minke whale presence was much more probable in water depths greater than 40 metres (Figure 5b). The smooth term for CHL showed a negative significant relationship with whale presence (Figure 5c), however the data were very limited at higher values and so interpretation of these results at these higher values should be considered conservatively. There was also significant interannual variation in feeding/foraging whale presence from year to year (Table 2). Conversely, the smooth terms for slope and the linear term for sea surface temperature (SST) had no significant effect upon minke whale presence (Table 2).

4. Discussion

The present results corroborate the importance of considering temporal changes in species distribution in the design of protected area frameworks for highly mobile species [9,11,27,45] such as minke whales. Whilst both physiographic and oceanographic environmental features can be informative for the spatial management of cetaceans, this study additionally illustrates the added importance of including prey data in habitat models for migratory whales on their feeding grounds. From May to July, feeding/foraging whales were found to show a strong preference for high-density sandeel burrowing habitat within the Moray Firth study area. However, from June through to August, the whales showed a marked proclivity for offshore frontal areas instead. In addition to environmental predictors such as depth and chlorophyll-a concentration (CHL), burrowed sandeel density (BSD) and sea surface temperature standard deviation (SST SD) were therefore concluded to provide valuable proxies for important minke whale feeding/foraging habitat and a compelling explanation for the observed spatio-temporal shifts in distribution over the summer feeding. These results further support previous studies suggesting that the temporal occurrence of these whales reflects the seasonal availability of their prey [22,25,46,47].
In Scottish waters, minke whales principally feed on sandeels, sprat and herring [48], which together contribute up to 86% of the total fish biomass in this North Sea coastal region [49]. Sandeels typically occur in the water column from April to July [50,51], but from July to August they enter their burrowing phase [50], thereby reducing predation opportunities for foraging minke whales. However, with the emergence of juvenile herring in the Moray Firth from July, followed by the inshore movements of pre-wintering sprat from August to October―as verified from monthly environmental DNA sampling in the study area [26]―whales are able to actively target these clupeid prey items with the concurrent decline in available sandeels.
The distributional changes observed in feeding/foraging minke whales in the present study―initially from high BSD areas then subsequently to frontal areas―subsequently supports seasonal prey switching by these coastal balaenopterids, as inferred from previous studies [22,26]. Predators may be flexible in their targeting of different prey species when their choices are limited or when a higher quality resource becomes more available [52] and this is assumed to occur when prey densities exceed a specific threshold that makes prey-switching more energetically efficient [22,46]. Nevertheless, the progressive decline observed herein in whale presence in high-density sandeel areas suggests that any dietary transition is gradual and more generalist foraging may occur throughout June and July when both sandeel and clupeid prey are equally available.
In contrast to sandeels, which by nature of their ecology remain bound to their habitat year-round [40], herring and sprat are highly migratory, pelagic species that are known to aggregate in areas of high zooplankton abundance [46,53,54], which proliferate along dynamic frontal systems and the transitional zones adjacent to these fronts. Frontal systems cause subtidal currents along predominant isobaths [55], serving as biological ‘hot spots’, where significant changes are observed in the pelagic food web due to enhanced vertical mixing [56]. Accordingly, the strong association of feeding/foraging whales with thermal fronts established in this study suggests the importance of these hotspots for clupeid prey and could partially explain the high interannual variability in the occurrence of whales observed within the Moray Firth study area.
The present results endorse the importance of utilising prey data for the interpretation of baleen whale occurrence on their feeding grounds. However, one obvious limitation to the use of BSD data is that these data do not necessarily reflect the sandeel densities in the water column. Although sandeels typically remain within a few kilometres of their burrows [40], the water column versus burrowed densities will be somewhat misaligned at fine spatial scales. With this in mind, the 2 km presence–absence cell size was selected to retain the fine spatial scale aspect of the study whilst providing a wider buffer, in comparison to a 1 km cell size for example, for extrapolation. Additionally, the sighting location buffers likely accounted for much of the wider area over which sighted whales were potentially foraging, and subsequently the wider area occupied by sandeels in the water column around their suitable burrowing habitat. For instance, a whale that was foraging for sandeels that was sighted within a low sandeel density grid cell adjacent to a high sandeel density grid cell would not necessarily be associated with low sandeel density in the model, as the buffered sighting locations result in adjacent cells containing higher values being considered as ‘presence’ cells. Thus, the results of this study indicate that BSD provides a convenient proxy for water column sandeel availability, supporting modelled prey data as a useful alternative to in situ prey data. However, given that the BSD main effect alone was a far less powerful predictor of whale presence than the tensor product interaction for BSD with month in the present study, the importance of incorporating a temporal component in such analyses may be essential to elucidate any seasonal trends.
In the absence of more accurate satellite-derived frontal data, SST gradients, such as SST SD, evidently provide a useful proxy for thermal fronts. However, SST SD and other gradient-based proxies may fail to capture detailed information about an animal’s position in terms of its proximate distance or placement to the front. For example, areas directly adjacent to fronts may have heightened SST SDs, since the neighbourhood method used herein to quantify fronts might confound the boundaries between thermal fronts and adjacent mixed or stratified areas when applied at fine scales. However, transitional zones further from the fronts may have lower SST SDs as the neighbourhood matrix effect will be lower, resulting in reduced SST gradients. Thus, the peak in minke whale presence recorded during the summer months at low SST SDs might indicate an association with transitional zones (supporting prey resources) where SST gradients will be lower. Additionally, due to increases in winds and falling SSTs during September and October [57,58], SST gradients will likely be lower during these periods [59], which might explain the sheer decline in the association between presence and SST SD in this period. Thus, direct, satellite-derived frontal data would be preferable to more precisely identify oceanographic fronts and associated stratified and mixed zones.
Management measures for highly mobile species remain challenging, but insights into the dynamic spatial associations by species and their prey with environmental features are essential for the identification of important habitats that should be afforded protection against prevailing threats. Anthropogenic impacts such as overfishing, for example, may result in prey depletion and/or habitat loss [60]. A recent advancement in this area was the introduction of the Sandeel (Prohibition of Fishing) (Scotland) Order 2024, prohibiting sandeel fishing within the Scottish zone, which will not only be beneficial to minkes, but to the large number of other predators also dependent upon these baitfish. Of further concern to coastal minkes, however, is the imminent risk of entanglement in fishing gear [61]. Static creel pots, for example, are currently responsible for at least 30 fatalities a year in Scottish waters [62], although mitigation actions, such as sinking lead lines, are currently being sought to address this problem. The nearshore habitats utilised by minke whales further harbour impacts from export cable corridors and landfall sites for consented wind farms, and associated increases in vessel traffic [22]. Photo-identification studies demonstrate that some whales utilising the Southern Trench MPA may remain in the region, or return in subsequent years (Robinson, unpublished data [63]). This presents the added risk of potentially exposing the same individuals to recurring anthropogenic stressors over time. Consequently, there is a need to integrate temporal data into spatial management frameworks when identifying priority areas for protection and to take these outputs into consideration when assessing the impacts of detrimental anthropogenic activities.

5. Conclusions

Dynamic management―which incorporates flexible as opposed to strict boundaries in seasonally important areas for highly mobile cetaceans [11]―is becoming increasingly articulated as a more suitable approach for the management of protected species [10]. Very little protection in the form of restrictions upon potentially harmful activities is currently provided by the Southern Trench MPA besides a set of broad management objectives [64]. The present findings could be used to inform a more dynamic, targeted approach that focusses protective measures, such as restrictions on static fishing gear, in these seasonally important minke whale feeding habitats. Such an approach in minke whale feeding areas may benefit the much wider variety of marine predators that feed on sandeels [65,66,67,68] and around fronts [8,69,70,71], thus promoting consistency with the principles of ecosystem-based MPA management [11], whilst targeting measures in the most important areas and perhaps permitting activities in the less important areas of the MPA [9]. This study also illustrates the importance of including prey data, when available, in habitat models for the spatial management of baleen whales on their feeding grounds. Indeed, the systematic monitoring of protected species and their prey, influencing environmental factors and identified anthropogenic stressors are all crucial for modelling, without which the dynamism or adaptability of these models are compromised, since failure to consider such temporal changes may conceal pertinent information crucial for management.
Anthropogenic stressors will inevitably vary both spatially and temporally in and around the Southern Trench MPA. We know, for example, that the waters of the MPA provide important feeding grounds for minke whales in northeast Scotland, yet we know little about the site fidelity and movements of individual animals. Ongoing studies employing satellite-tracking devices will increase our understanding of the movements of these animals in and beyond the MPA. This information will be used to inform management decisions for this and other UK MPAs for the species (necessity for expansion, identification/mitigation of presenting threats) and will allow us to examine the regional policy decisions crucial for the future management of these and other protected cetaceans in our regional UK waters.

Author Contributions

Conceptualisation, K.P.R. and D.A.I.M.; methodology, D.A.I.M.; software, D.A.I.M.; validation, D.A.I.M.; formal analysis, D.A.I.M.; investigation, D.A.I.M. and K.P.R.; resources, K.P.R.; data curation, K.P.R.; writing—original draft preparation, D.A.I.M. and K.P.R.; writing—review and editing, K.P.R.; visualisation, K.P.R.; supervision, K.P.R.; project administration, K.P.R. All authors have read and agreed to the published version of the manuscript.

Funding

This research received no external funding.

Institutional Review Board Statement

This study was entirely observational, but all boat-based monitoring work was carried out under licence from NatureScot.

Informed Consent Statement

Not applicable.

Data Availability Statement

The raw data supporting the conclusions of this article will be made available by the authors on request due to privacy restrictions.

Acknowledgments

The authors would like to thank all CRRU interns and volunteers who generously gave their time and support with fieldwork. We thank Marine Scotland for providing the sandeel density data and NERC Earth Observation Data Acquisition and Analysis Service (NEODAAS) for supplying the oceanographic data. We also thank the editor and reviewers for their constructive feedback, which greatly improved the final manuscript.

Conflicts of Interest

The authors declare no conflicts of interest.

References

  1. Bailey, H.; Thompson, P.M. Using Marine Mammal Habitat Modelling to Identify Priority Conservation Zones within a Marine Protected Area. Mar. Ecol. Prog. Ser. 2009, 378, 279–287. [Google Scholar] [CrossRef]
  2. Cañadas, A.; Sagarminaga, R.; García-Tiscar, S. Cetacean Distribution Related with Depth and Slope in the Mediterranean Waters off Southern Spain. Deep Sea Res. I Oceanogr. Res. Pap. 2002, 49, 2053–2073. [Google Scholar] [CrossRef]
  3. Franks, P. Sink or Swim, Accumulation of Biomass at Fronts. Mar. Ecol. Prog. Ser. 1992, 82, 1–12. [Google Scholar] [CrossRef]
  4. Panigada, S.; Sciara, G.N.D.; Panigada, M.Z.; Airoldi, S.; Borsani, J.F.; Jahoda, M. Fin Whales (Balaenoptera physalus) Summering in the Ligurian Sea: Distribution, Encounter Rate, Mean Group Size and Relation to Physiographic Variables. J. Cetacean Res. Manage. 2005, 7, 137–145. [Google Scholar] [CrossRef]
  5. Macleod, K.; Fairbairns, R.; Gill, A.; Fairbairns, B.; Gordon, J.; Blair-Myers, C.; Parsons, E. Seasonal Distribution of Minke Whales Balaenoptera acutorostrata in Relation to Physiography and Prey off the Isle of Mull, Scotland. Mar. Ecol. Prog. Ser. 2004, 277, 263–274. [Google Scholar] [CrossRef]
  6. Kimura, S.; Kasai, A.; Nakata, H.; Sugimoto, T.; Simpson, J.H.; Cheok, J.V.S. Biological Productivity of Meso-Scale Eddies Caused by Frontal Disturbances in the Kuroshio. ICES J. Mar. Sci. 1997, 54, 179–192. [Google Scholar] [CrossRef]
  7. Griffin, R.B. Sperm Whale Distributions and Community Ecology Associated with a Warm-Core Ring Off Georges Bank. Mar. Mammal Sci. 1999, 15, 33–51. [Google Scholar] [CrossRef]
  8. Scales, K.L.; Miller, P.I.; Hawkes, L.A.; Ingram, S.N.; Sims, D.W.; Votier, S.C. REVIEW: On the Front Line: Frontal Zones as Priority at-Sea Conservation Areas for Mobile Marine Vertebrates. J. Appl. Ecol. 2014, 51, 1575–1583. [Google Scholar] [CrossRef]
  9. Maxwell, S.M.; Hazen, E.L.; Lewison, R.L.; Dunn, D.C.; Bailey, H.; Bograd, S.J.; Briscoe, D.K.; Fossette, S.; Hobday, A.J.; Bennett, M.; et al. Dynamic Ocean Management: Defining and Conceptualizing Real-Time Management of the Ocean. Mar. Policy 2015, 58, 42–50. [Google Scholar] [CrossRef]
  10. Maxwell, S.M.; Gjerde, K.M.; Conners, M.G.; Crowder, L.B. Mobile Protected Areas for Biodiversity on the High Seas. Science 2020, 367, 252–254. [Google Scholar] [CrossRef]
  11. Hoyt, E. Marine Protected Areas for Whales, Dolphins and Porpoises: A World Handbook for Cetacean Habitat Conservation, 2nd ed.; Earthscan: Oxon, UK, 2011; ISBN 978-1-84407-763-2. [Google Scholar]
  12. Camphuysen, K.C.; Shamoun-Baranes, J.; Bouten, W.; Garthe, S. Identifying Ecologically Important Marine Areas for Seabirds Using Behavioural Information in Combination with Distribution Patterns. Biol. Conserv. 2012, 156, 22–29. [Google Scholar] [CrossRef]
  13. Horton, T.W.; Palacios, D.M.; Stafford, K.M.; Zerbini, A.N. Baleen Whale Migration. In Ethology and Behavioral Ecology of Mysticetes; Clark, C.W., Garland, E.C., Eds.; Springer International Publishing: Cham, Switzerland, 2022; pp. 71–104. ISBN 978-3-030-98449-6. [Google Scholar]
  14. Lee, S.H.; Schell, D.M.; McDonald, T.L.; Richardson, W.J. Regional and Seasonal Feeding by Bowhead Whales Balaena Mysticetus as Indicated by Stable Isotope Ratios. Mar. Ecol. Prog. Ser. 2005, 285, 271–287. [Google Scholar] [CrossRef]
  15. Konishi, K.; Tamura, T.; Isoda, T.; Okamoto, R.; Hakamada, T.; Kiwada, H.; Matsuoka, K. Feeding Strategies and Prey Consumption of Three Baleen Whale Species Within the Kuroshio-Current Extension. J. Northwest Atl. Fish. Sci. 2009, 42, 27–40. [Google Scholar] [CrossRef]
  16. Bentaleb, I.; Martin, C.; Vrac, M.; Mate, B.; Mayzaud, P.; Siret, D.; de Stephanis, R.; Guinet, C. Foraging Ecology of Mediterranean Fin Whales in a Changing Environment Elucidated by Satellite tracking and Baleen Plate Stable Isotopes. Mar. Ecol. Prog. Ser. 2011, 438, 285–302. [Google Scholar] [CrossRef]
  17. Mitani, Y.; Bando, T.; Takai, N.; Sakamoto, W. Patterns of Stable Carbon and Nitrogen Isotopes in the Baleen of Common Minke Whale Balaenoptera Acutorostrata from the Western North Pacific. Fish. Sci. 2006, 72, 69–76. [Google Scholar] [CrossRef]
  18. Zhang, Y.; Sun, X.; Nong, Z.; Chen, M.; Hao, Y.; Wang, J.; Wang, K.; Wang, D.; Mei, Z. The First Baleen Whale Marine Protected Area Proposed for Bryde’s Whales in the Beibu Gulf, China. Mar. Mammal Sci. 2024, 40, e13082. [Google Scholar] [CrossRef]
  19. Ashe, E.; Noren, D.P.; Williams, R. Animal Behaviour and Marine Protected Areas: Incorporating Behavioural Data into the Selection of Marine Protected Areas for an Endangered Killer Whale Population. Anim. Conserv. 2010, 13, 196–203. [Google Scholar] [CrossRef]
  20. NatureScot. Minke Whale. Available online: https://www.nature.scot/plants-animals-and-fungi/mammals/marine-mammals/minke-whale (accessed on 24 January 2025).
  21. Robinson, K.P.; Tetley, M.J.; Mitchelson-Jacob, E.G. The Distribution and Habitat Preference of Coastally Occurring Minke Whales (Balaenoptera acutorostrata) in the Outer Southern Moray Firth, Northeast Scotland. J. Coast. Conserv. 2009, 13, 39–48. [Google Scholar] [CrossRef]
  22. Robinson, K.P.; MacDougall, D.A.I.; Bamford, C.C.G.; Brown, W.J.; Dolan, C.J.; Hall, R.; Haskins, G.N.; Russell, G.; Sidiropoulos, T.; Sim, T.M.C.; et al. Ecological Habitat Partitioning and Feeding Specialisations of Coastal Minke Whales (Balaenoptera acutorostrata) Using a Recently Designated MPA in Northeast Scotland. PLoS ONE 2023, 18, e0246617. [Google Scholar] [CrossRef]
  23. Paxton, C.; Scott-Hayward, L.; Rexstad, E. Statistical Approaches to Aid the Identification of Marine Protected Areas for Minke Whale, Risso’s Dolphin, White-Beaked Dolphin and Basking Shark; Scottish Natural Heritage: Inverness, Scotland, 2014.
  24. Robinson, K.P.; Tetley, M.J. Behavioural Observations of Foraging Minke Whales (Balaenoptera acutorostrata) in the Outer Moray Firth, North-East Scotland. J. Mar. Biol. Assoc. UK 2007, 87, 85–86. [Google Scholar] [CrossRef]
  25. Tetley, M.J.; Mitchelson-Jacob, E.G.; Robinson, K.P. The Summer Distribution of Coastal Minke Whales (Balaenoptera acutorostrata) in the Southern Outer Moray Firth, NE Scotland, in Relation to Co-Occurring Mesoscale Oceanographic Features. Remote Sens. Environ. 2008, 112, 3449–3454. [Google Scholar] [CrossRef]
  26. Boyse, E.; Robinson, K.P.; Beger, M.; Carr, I.M.; Taylor, M.; Valsecchi, E.; Goodman, S.J. Environmental DNA Reveals Fine-Scale Spatial and Temporal Variation of Marine Mammals and Their Prey Species in a Scottish Marine Protected Area. Environ. DNA 2024, 6, e587. [Google Scholar] [CrossRef]
  27. Wilson, B.; Reid, R.J.; Grellier, K.; Thompson, P.M.; Hammond, P.S. Considering the Temporal When Managing the Spatial: A Population Range Expansion Impacts Protected Areas-Based Management for Bottlenose Dolphins. Anim. Conserv. Forum 2004, 7, 331–338. [Google Scholar] [CrossRef]
  28. Hooker, S.K.; Cañadas, A.; Hyrenbach, K.D.; Corrigan, C.; Polovina, J.J.; Reeves, R.R. Making Protected Area Networks Effective for Marine Top Predators. Endanger. Species Res. 2011, 13, 203–218. [Google Scholar] [CrossRef]
  29. QGIS Development Team. QGIS Geographic Information System; QGIS: London, UK, 2024. [Google Scholar]
  30. Tepsich, P.; Rosso, M.; Halpin, P.; Moulins, A. Habitat Preferences of Two Deep-Diving Cetacean Species in the Northern Ligurian Sea. Mar. Ecol. Prog. Ser. 2014, 508, 247–260. [Google Scholar] [CrossRef]
  31. Robinson, K.P. Minke Whale Sightings. Cetacean Research and Rescue Unit. 2025. Available online: https://crru.org.uk/research/minke-whales (accessed on 1 November 2024).
  32. Forney, K.A.; Becker, E.A.; Foley, D.G.; Barlow, J.; Oleson, E.M. Habitat-Based Models of Cetacean Density and Distribution in the Central North Pacific. Endanger. Species Res. 2015, 27, 1–20. [Google Scholar] [CrossRef]
  33. Gilles, A.; Viquerat, S.; Becker, E.A.; Forney, K.A.; Geelhoed, S.C.V.; Haelters, J.; Nabe-Nielsen, J.; Scheidat, M.; Siebert, U.; Sveegaard, S.; et al. Seasonal Habitat-Based Density Models for a Marine Top Predator, the Harbor Porpoise, in a Dynamic Environment. Ecosphere 2016, 7, e01367. [Google Scholar] [CrossRef]
  34. Laidre, K.L.; Heide-Jørgensen, M.P.; Heagerty, P.; Cossio, A.; Bergström, B.; Simon, M. Spatial Associations between Large Baleen Whales and Their Prey in West Greenland. Mar. Ecol. Prog. Ser. 2010, 402, 269–284. [Google Scholar] [CrossRef]
  35. Pendleton, D.E.; Holmes, E.E.; Redfern, J.; Zhang, J. Using Modelled Prey to Predict the Distribution of a Highly Mobile Marine Mammal. Divers. Distrib. 2020, 26, 1612–1626. [Google Scholar] [CrossRef]
  36. Zerbini, A.N.; Friday, N.A.; Palacios, D.M.; Waite, J.M.; Ressler, P.H.; Rone, B.K.; Moore, S.E.; Clapham, P.J. Baleen Whale Abundance and Distribution in Relation to Environmental Variables and Prey Density in the Eastern Bering Sea. Deep Sea Res. Part II Top. Stud. Oceanogr. 2016, 134, 312–330. [Google Scholar] [CrossRef]
  37. Pickens, B.; Taylor, J.; Campbell, M.; Driggers, W. Offshore Snapper and Shark Distributions Are Predicted by Prey and Area of Nearby Estuarine Environments in the Gulf of Mexico, USA. Mar. Ecol. Prog. Ser. 2022, 682, 169–189. [Google Scholar] [CrossRef]
  38. Schick, R.S.; Lutcavage, M.E. Inclusion of Prey Data Improves Prediction of Bluefin Tuna (Thunnus thynnus) Distribution. Fish. Oceanogr. 2009, 18, 77–81. [Google Scholar] [CrossRef]
  39. Friedlaender, A.S.; Halpin, P.N.; Qian, S.S.; Lawson, G.L.; Wiebe, P.H.; Thiele, D.; Read, A.J. Whale Distribution in Relation to Prey Abundance and Oceanographic Processes in Shelf Waters of the Western Antarctic Peninsula. Mar. Ecol. Prog. Ser. 2006, 317, 297–310. [Google Scholar] [CrossRef]
  40. van der Kooij, J.; Scott, B.E.; Mackinson, S. The Effects of Environmental Factors on Daytime Sandeel Distribution and Abundance on the Dogger Bank. J. Sea Res. 2008, 60, 201–209. [Google Scholar] [CrossRef]
  41. Langton, R.; Boulcott, P.; Wright, P.J. A Verified Distribution Model for the Lesser Sandeel Ammodytes Marinus. Mar. Ecol. Prog. Ser. 2021, 667, 145–159. [Google Scholar] [CrossRef]
  42. RStudio Development Team. RStudio: Integrated Development for R; RStudio: Boston, MA, USA, 2020. [Google Scholar]
  43. Wood, S.N. Fast Stable Restricted Maximum Likelihood and Marginal Likelihood Estimation of Semiparametric Generalized Linear Models. J. R. Stat. Soc. Ser. B Stat. Methodol. 2011, 73, 3–36. [Google Scholar] [CrossRef]
  44. Gelman, A.; Su, Y.-S.; Yajima, M.; Hill, J.; Pittau, M.G.; Kerman, J.; Zheng, T.; Dorie, V. Arm: Data Analysis Using Regression and Multilevel/Hierarchical Models; Cambridge University Press: Cambridge, UK, 2021. [Google Scholar]
  45. Conners, M.G.; Sisson, N.B.; Agamboue, P.D.; Atkinson, P.W.; Baylis, A.M.M.; Benson, S.R.; Block, B.A.; Bograd, S.J.; Bordino, P.; Bowen, W.D.; et al. Mismatches in Scale between Highly Mobile Marine Megafauna and Marine Protected Areas. Front. Mar. Sci. 2022, 9, 897104. [Google Scholar] [CrossRef]
  46. Anderwald, P.; Evans, P.; Dyer, R.; Dale, A.; Wright, P.; Hoelzel, A. Spatial Scale and Environmental Determinants in Minke Whale Habitat Use and Foraging. Mar. Ecol. Prog. Ser. 2012, 450, 259–274. [Google Scholar] [CrossRef]
  47. De Boer, M. Spring Distribution and Density of Minke Whale Balaenoptera acutorostrata along an Offshore Bank in the Central North Sea. Mar. Ecol. Prog. Ser. 2010, 408, 265–274. [Google Scholar] [CrossRef]
  48. Pierce, G.J.; Santos, M.B.; Reid, R.J.; Patterson, I.A.P.; Ross, H.M. Diet of Minke Whales Balaenoptera acutorostrata in Scottish (UK) Waters with Notes on Strandings of This Species in Scotland 1992–2002. J. Mar. Biol. Assoc. UK 2004, 84, 1241–1244. [Google Scholar] [CrossRef]
  49. Greenstreet, S.P.R.; McMillan, J.A.; Armstrong, E. Seasonal Variation in the Importance of Pelagic Fish in the Diet of Piscivorous Fish in the Moray Firth, NE Scotland: A Response to Variation in Prey Abundance? ICES J. Mar. Sci. 1998, 55, 121–133. [Google Scholar] [CrossRef]
  50. Winslade, P. Behavioural Studies on the Lesser Sandeel Ammodytes marinus (Raitt) III. The Effect of Temperature on Activity and the Environmental Control of the Annual Cycle of Activity. J. Fish Biol. 1974, 6, 587–599. [Google Scholar] [CrossRef]
  51. Pedersen, S.A.; Lewy, P.; Wright, P. Assessments of the Lesser Sandeel (Ammodytes marinus) in the North Sea Based on Revised Stock Divisions. Fish. Res. 1999, 41, 221–241. [Google Scholar] [CrossRef]
  52. Robinson, B.W.; Wilson, D.S. Optimal Foraging, Specialization, and a Solution to Liem’s Paradox. Am. Nat. 1998, 151, 223–235. [Google Scholar] [CrossRef] [PubMed]
  53. Maravelias, C.; Reid, D. Identifying the Effects of Oceanographic Features and Zooplankton on Prespawning Herring Abundance Using Generalized Additive Models. Mar. Ecol. Prog. Ser. 1997, 147, 1–9. [Google Scholar] [CrossRef]
  54. Maravelias, C.; Reid, D.; Swartzman, G. Seabed Substrate, Water Depth and Zooplankton as Determinants of the Prespawning Spatial Aggregation of North Atlantic Herring. Mar. Ecol. Prog. Ser. 2000, 195, 249–259. [Google Scholar] [CrossRef]
  55. Van Haren, J.J.M.; Joordens, J.C.A. Observations of Physical and Biological Parameters at the Transition between the Southern and Central North Sea. Neth. J. Sea Res. 1990, 25, 351–364. [Google Scholar] [CrossRef]
  56. Gissel, T.N.; Munk, P. Zooplankton Diversity and the Predatory Impact by Larval and Small Juvenile Fish at the Fisher Banks in the North Sea. J. Plankton Res. 1998, 20, 2313–2332. [Google Scholar] [CrossRef]
  57. Elliott, A.J.; Clarke, T. Seasonal Stratification in the Northwest European Shelf Seas. Cont. Shelf Res. 1991, 11, 467–492. [Google Scholar] [CrossRef]
  58. Van Haren, H.; Howarth, M.J.; Jones, K.; Ezzi, I. Autumnal Reduction of Stratification in the Northern North Sea and Its Impact. Cont. Shelf Res. 2003, 23, 177–191. [Google Scholar] [CrossRef]
  59. Doniol-Valcroze, T.; Berteaux, D.; Larouche, P.; Sears, R. Influence of Thermal Fronts on Habitat Selection by Four Rorqual Whale Species in the Gulf of St. Lawrence. Mar. Ecol. Prog. Ser. 2007, 335, 207–216. [Google Scholar] [CrossRef]
  60. Yan, H.F.; Kyne, P.M.; Jabado, R.W.; Leeney, R.H.; Davidson, L.N.K.; Derrick, D.H.; Finucci, B.; Freckleton, R.P.; Fordham, S.V.; Dulvy, N.K. Overfishing and Habitat Loss Drive Range Contraction of Iconic Marine Fishes to near Extinction. Sci. Adv. 2021, 7, eabb6026. [Google Scholar] [CrossRef] [PubMed]
  61. Northridge, S.; Cargill, A.; Coram, A.; Mandleberg, L.; Calderan, S.; Reid, B. Entanglement of Minke Whales in Scottish Waters; an Investigation into Occurrence, Causes and Mitigation; Sea Mammal Research Unit: Fife, Scotland, 2010. [Google Scholar]
  62. Leaper, R.; MacLennan, E.; Brownlow, A.; Calderan, S.; Dyke, K.; Evans, P.; Hartny-Mills, L.; Jarvis, D.; McWhinnie, L.; Philp, A.; et al. Estimates of Humpback and Minke Whale Entanglements in the Scottish Static Pot (Creel) Fishery. Endanger. Species Res. 2022, 49, 217–232. [Google Scholar] [CrossRef]
  63. Robinson, K.P. Minke Whale Catalogue. Cetacean Research and Rescue Unit. 2025. Available online: https://crru.org.uk/research/catalogues?catalogue=minke-whale&page=1 (accessed on 1 November 2024).
  64. NatureScot. Conservation and Management Advice: Southern Trench MPA; NatureScot: Inverness, Scotland, 2024.
  65. Wright, P.J.; Begg, G.S. A Spatial Comparison of Common Guil lemots and Sandeels in Scottish Waters. ICES J. Mar. Sci. 1997, 54, 578–592. [Google Scholar] [CrossRef]
  66. Carroll, M.J.; Bolton, M.; Owen, E.; Anderson, G.Q.A.; Mackley, E.K.; Dunn, E.K.; Furness, R.W. Kittiwake Breeding Success in the Southern North Sea Correlates with Prior Sandeel Fishing Mortality. Aquat. Conserv. Mar. Freshw. Ecosyst. 2017, 27, 1164–1175. [Google Scholar] [CrossRef]
  67. MacLeod, C.D.; Santos, M.B.; Reid, R.J.; Scott, B.E.; Pierce, G.J. Linking Sandeel Consumption and the Likelihood of Starvation in Harbour Porpoises in the Scottish North Sea: Could Climate Change Mean More Starving Porpoises? Biol. Lett. 2007, 3, 185–188. [Google Scholar] [CrossRef]
  68. Wanless, S.; Harris, M.P.; Greenstreet, S.P.R. Summer Sandeel Consumption by Seabirds Breeding in the Firth of Forth, South-East Scotland. ICES J. Mar. Sci. 1998, 55, 1141–1151. [Google Scholar] [CrossRef]
  69. Pommier, M.; O’Donnell, C.; Barile, C.; McGill, R.; Berrow, S.; O’Brien, J. Exploring Environmental and Biological Drivers of Cetacean Occurrence in the Cross-Border Region of the Malin Shelf Using Data from a European Fishery Survey. Front. Mar. Sci. 2023, 10. [Google Scholar]
  70. Scales, K.L.; Miller, P.I.; Embling, C.B.; Ingram, S.N.; Pirotta, E.; Votier, S.C. Mesoscale Fronts as Foraging Habitats: Composite Front Mapping Reveals Oceanographic Drivers of Habitat Use for a Pelagic Seabird. J. R. Soc. Interface 2014, 11, 20140679. [Google Scholar] [CrossRef]
  71. Miller, P.I.; Scales, K.L.; Ingram, S.N.; Southall, E.J.; Sims, D.W. Basking Sharks and Oceanographic Fronts: Quantifying Associations in the North-East Atlantic. Funct. Ecol. 2015, 29, 1099–1109. [Google Scholar] [CrossRef]
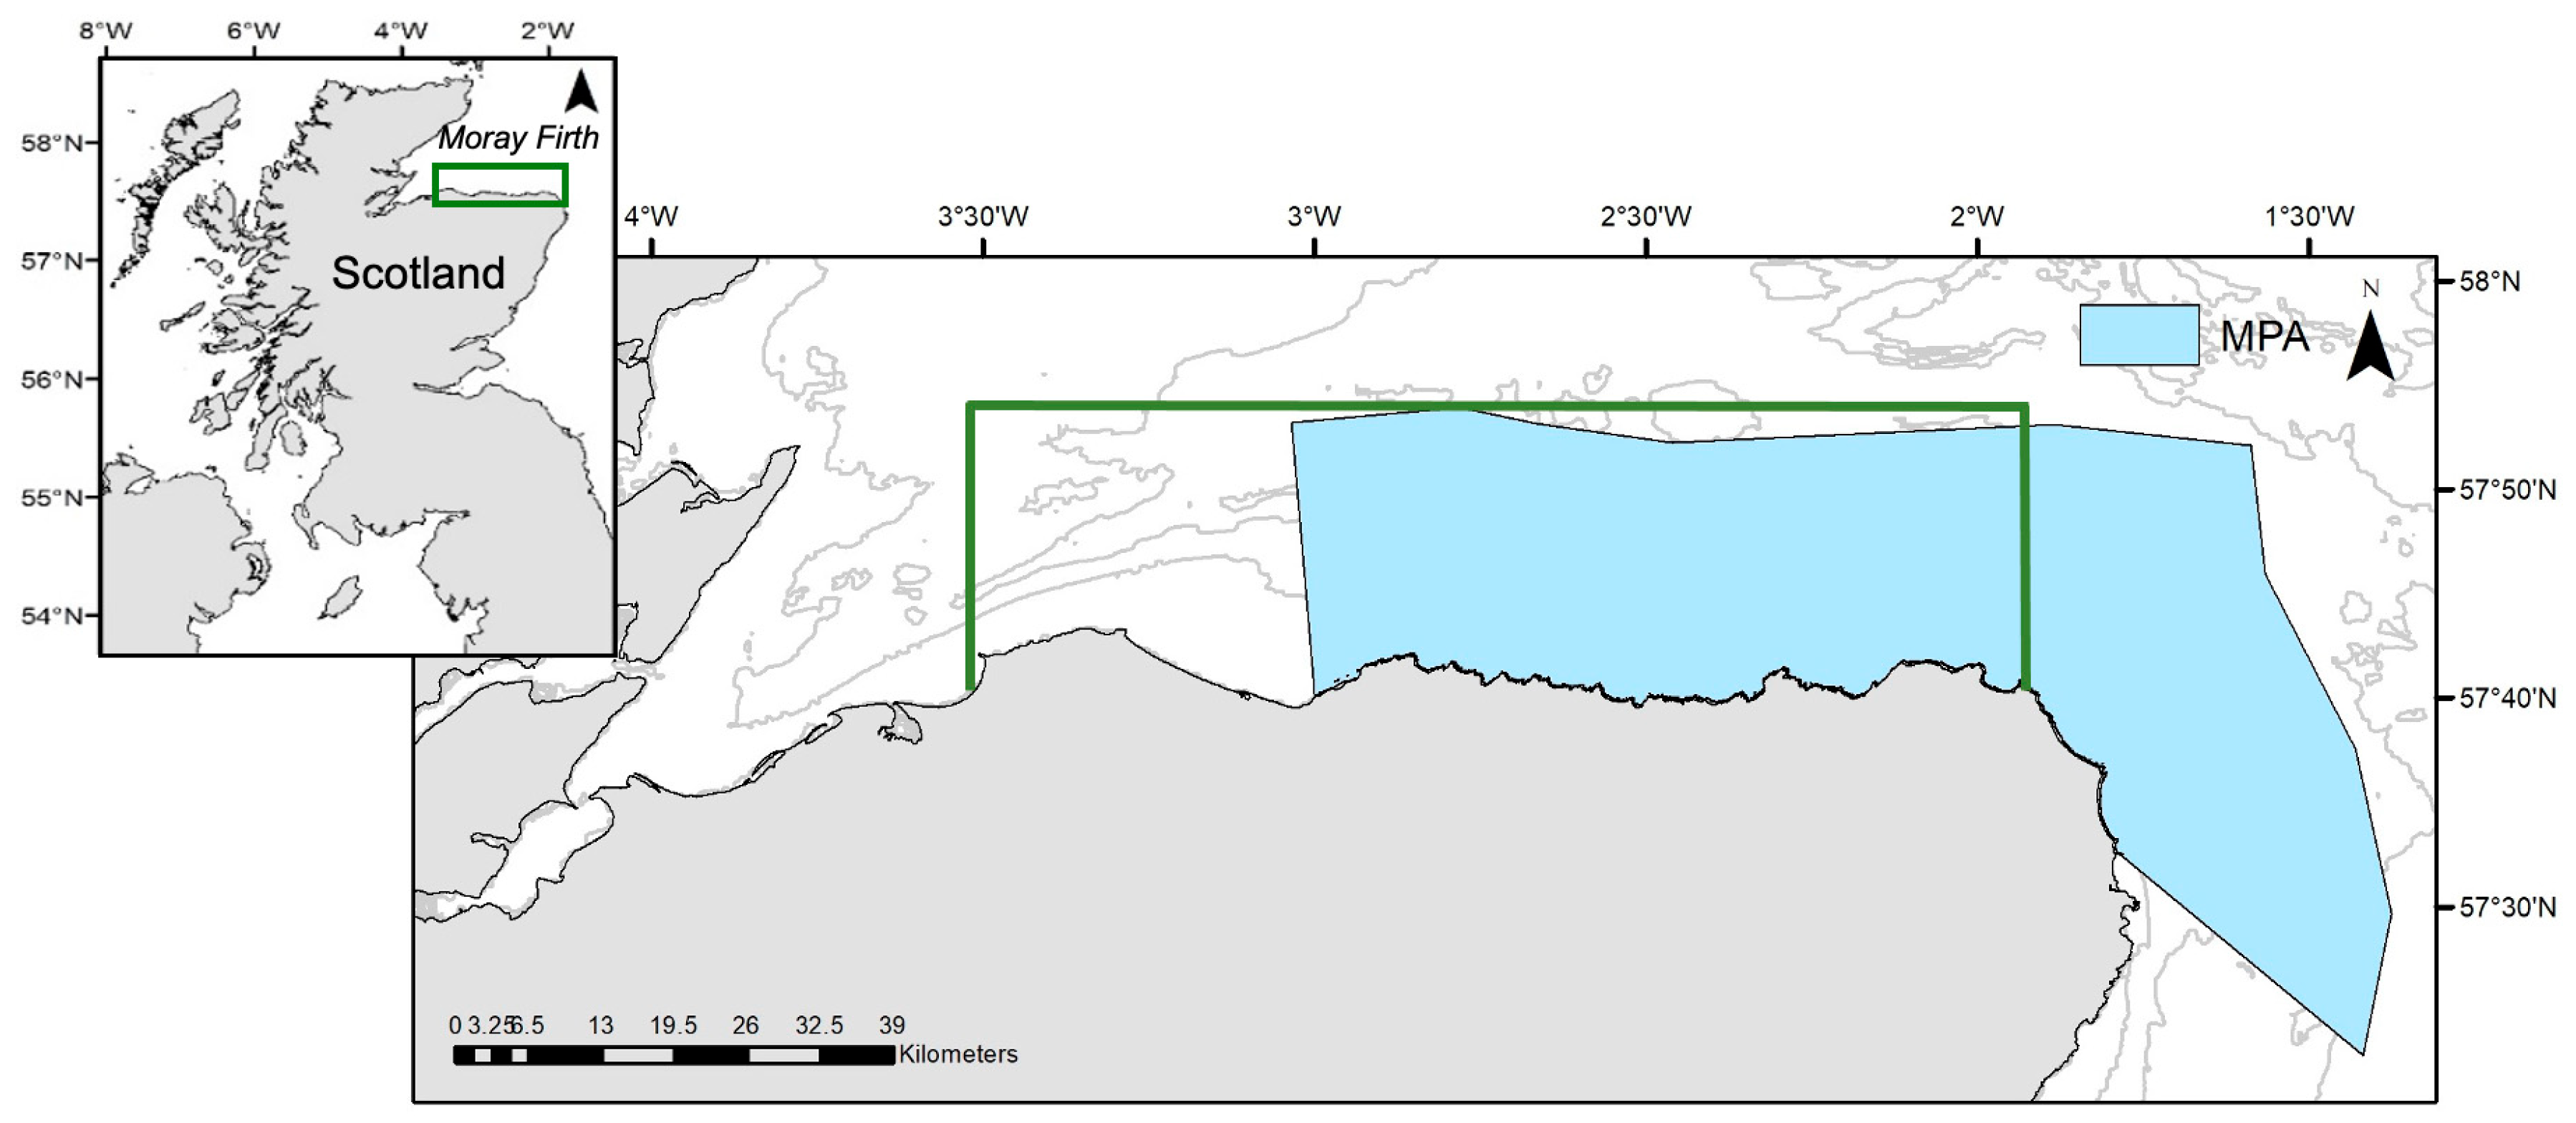
Figure 1. The location of the Moray Firth study area (green border) and the boundaries of the Southern Trench MPA along the southern coastline of the outer firth.
Oceans 06 00018 g001
Figure 2. Showing the spatial distribution of feeding/foraging minke whales (n = 458) recorded during dedicated boat-based survey work (track lines in grey) along the southern coastline of the outer Moray Firth from May to October 2009 to 2022 inclusive.
Oceans 06 00018 g002
Figure 3. Showing (a) the pooled intra-annual and (b) inter-annual variability in the sightings of feeding/foraging minke whales using the southern Moray Firth study area from May to October 2009 to 2022 inclusive.
Oceans 06 00018 g003
Figure 4. Partial effect plots showing the effect of (a) the tensor product interaction (ti) between BSD and month and (b) the tensor product smooth (te) between SST SD and month upon the presence of feeding/foraging minke whales.
Oceans 06 00018 g004
Figure 5. Partial effects plots from GAMs showing the component effect of the smooth terms for (a) BSD; (b) depth; (c) CHL. The confidence intervals take account of errors in the intercept estimation.
Oceans 06 00018 g005
Table 1. Comparison of the full and alternative generalised additive models using Akaike’s information criterion (AIC). In the model equations, n denotes the probability of presence, ti denotes a tensor product interaction, te denotes a full tensor product smooth and s denotes a smooth function of a covariate.
ModelEquationAIC
Full n ~ t i B S D : m o n t h + t e S S T S D × m o n t h + s d e p t h + s C H L + s B S D + s s l o p e + S S T + y e a r 3104.575
Alternative 1 n ~ t i B S D : m o n t h + t e S S T S D × m o n t h + s d e p t h + s C H L + s B S D + S S T + y e a r 3102.965
Alternative 2 n ~ t i B S D : m o n t h + t e S S T S D × m o n t h + s d e p t h + s C H L + s B S D + y e a r 3103.725
Table 2. Test statistics of smooth and parametric predictor terms from the final GAM outputs for the presence of feeding/foraging minke whales.
Smooth TermsEffective Degrees
of Freedom
Reference Degrees
of Freedom
Chi-Squarep
BSD1.6111.9888.390<0.05 *
ti (BSD, month)4.4485.37625.177<0.001 *
te (SST-SD, month)14.05016.66678.470<0.001 *
Depth5.7776.522133.689<0.001 *
CHL1.0201.03910.070<0.05 *
Slope1.7092.0881.1130.537
Parametric TermsEstimateStandard ErrorZp
SST−0.1960.130−1.5040.133
Year (2009 as reference)
20100.5150.2921.7660.077
20110.1300.3770.0350.972
2012−0.2350.357−0.6580.510
20130.6510.2782.341<0.05 *
2014−0.2510.530−0.4740.636
20150.5970.2991.995<0.05 *
20160.5950.2862.081<0.05 *
20170.3580.2921.2270.220
20181.9620.2527.793<0.001 *
20190.1430.3040.4720.637
20201.0460.3023.465<0.001 *
20212.4490.2519.749<0.001 *
20220.9870.2683.688<0.001 *
* p < 0.05.
Disclaimer/Publisher’s Note: The statements, opinions and data contained in all publications are solely those of the individual author(s) and contributor(s) and not of MDPI and/or the editor(s). MDPI and/or the editor(s) disclaim responsibility for any injury to people or property resulting from any ideas, methods, instructions or products referred to in the content.