1. Introduction
Maritime transport has been a key driver of globalization over the last three decades, facilitating the exchange of goods on a global scale. However, this exponential growth has generated significant challenges in terms of safety and sustainability. Ecological disasters caused by maritime accidents, such as the “
Torrey Canyon”, “
Amoco Cadiz” and “
Exxon Valdez”, are a constant reminder of the serious consequences that a lack of safety in maritime transport can cause [
1]. These events have not only caused irreversible environmental damage but have also generated significant economic losses and put the lives of numerous people at risk. It is therefore essential to implement effective measures to prevent such incidents and ensure the protection of the marine environment [
2].
In view of the growing concern about maritime accidents and their serious environmental consequences, the International Maritime Organization (IMO) established, through Resolution A.682(17) [
3], a regional cooperation framework to strengthen controls of ships in port. This system, known as Port State Control (PSC), aims to ensure that foreign ships comply with international standards of safety and protection of the marine environment. Through rigorous inspections, member states’ maritime administrations assess compliance with international conventions, such as Convention for the Safety of Life at Sea (SOLAS), Convention for the Prevention of Pollution from Ships (MARPOL) and Convention on Standards of Training, Certification and Watchkeeping for Seafarers (STCW), among others.
The evolution of the PSC inspection system has led to the creation of several Memoranda of Understanding (MoU) at regional level, such as the Paris MoU [
4]. These agreements, based on IMO guidelines, have the main objective of ensuring maritime safety and protecting the environment through the harmonization of inspection practices. The Paris MoU, which covers the countries of the European Union, is an outstanding example of this international cooperation and has contributed significantly to improving safety standards in maritime navigation.
This study aims to analyze the results of inspections carried out in the framework of the Paris MoU, in order to identify the most common types of safety deficiencies found on ships after a PSC inspection. Through a correspondence analysis of the inspection data, the aim is to establish relationships between the deficiencies detected according to the use of the ship (container ship, tanker, passenger ship, etc.), with the purpose of optimizing the inspection processes and prioritizing the areas of greatest risk, which can be an additional indication for MoU inspectors.
In order to better understand the role of PSC inspections in improving maritime safety, the following describes the inspection procedures set out in the Paris MoU and presents a review of the latest scientific literature.
1.1. PSC Inspections Procedure in the Paris MoU
PSC inspections are carried out by Port State Control Officers (PSCOs), duly qualified professionals authorized by the European Maritime Safety Agency (EMSA) [
5] and by the Maritime Authority of each country. These officers act under the responsibility of that authority and are trained to carry out inspections in accordance with the requirements of the Paris MoU [
6].
In 2011, a New System of Inspections (NIR) was implemented in the Paris MoU by Directive 2009/16 of the European Parliament and of the Council of 23 April 2009 (EU, 2009), called the ERIKA III package [
7]. This new system employs the concept of “
Prioritized inspections”, which consists of determining a “
Risk Profile” for ships, based on the shipping company, flag and the results of previous inspections. This approach allows prioritization of inspections and targeting resources on those ships most likely to fail to meet safety standards. In addition, the new system helps to harmonize inspection practices in all Paris MoU ports, ensuring a more equitable treatment of ships and avoiding unequal situations.
By implementing the NIR, each time a foreign ship calls at a Paris MoU port, a PSCO can carry out an inspection. Initially, it uses the software application called The Hybrid European Targeting and Inspection System (THETIS) [
8], managed by EMSA. This application checks all ship security inspections carried out in EU ports, generating a risk profile of the ship and determining inspection frequency and priorities. After examining the documentation on board, the inspector can decide to carry out a more thorough inspection if there are indications of non-compliance with international conventions.
The new system allows inspections to be classified into three categories according to the ship’s risk profile: initial, more detailed and expanded. If deficiencies are found, the ship may be subject to corrective action, including detention. Such deficiencies are coded and arranged in the Paris MoU in various categories, depending on their nature and where they have been detected [
9]. The results of inspections including such deficiencies and ship characteristics are stored in THETIS, in order to keep track of the condition of the ship over time and determine its risk profile. This will be the database we will use for this study, analyzing the results of the inspections carried out and the deficiencies found after the inspections.
1.2. Review of the Latest Research on Safety Controls
The authors Brooks [
10] and Håvold [
11] both commented on the privatization of maritime safety oversight and the importance of quantitative risk analysis. Brooks noted a clear shift towards privatization, while Håvold highlighted the crucial role of quantitative risk analysis in developing maritime safety measures.
Cariou et al. [
12] tried to figure out which factors should be considered when choosing ships for inspection. They used data from 4080 inspections performed by the Swedish Maritime Administration between 1996 and 2001. They used different statistical models to analyze the data and found that the relationship between a ship’s age and the number of deficiencies found is not the same for all types of ships. In this respect, our study may provide some novelty, as we found correlations between the type of ship and the deficiencies found after inspection.
The research by Li and Zheng [
13] evaluated the effectiveness of the methods used by regional PSC agreements to select ships for inspection.
Hänninen et al. [
14] analyzed PSC inspection data using Bayesian network algorithms to discover interactions between the number of different types of deficiencies found on ships and their involvement in maritime accidents and incidents. The results suggested that knowledge of the type of ship, the type of PSC inspection and the number of structural deficiencies are among those that provide the most information about involvement in accidents. This study provides the basis for this article as it confirms that deficiencies found on ships following a PSC inspection are good indicators of maritime risk.
Ravira and Piniella [
6] also concluded that professional training and teamwork influence inspection results. Their study emphasized the importance of these factors in successful inspections.
Graziano et al. [
15] examined 25 inspection reports produced by the EMSA, focusing on inspections carried out by European Union Member States. They assessed how well these inspections complied with Directive 2009/16/EC [
7] and identified any inconsistencies between the requirements of the Directive and the way inspections were actually carried out.
Wang et al. [
16] developed a Bayesian network classifier to identify high-risk foreign ships in ports. This tool aids PSC authorities in detecting ships with lower compliance standards, enabling more efficient allocation of inspection resources. This study is closely linked to our analysis, as our results also help to optimize inspection resources by showing the PSCO the most common deficiencies according to the type of ship they are working on, allowing them to set clear monitoring targets. Chen et al. [
17] conducted a comprehensive analysis of detention data from Asia-Pacific port states. Their research focused on providing practical guidelines for port states to enhance the effectiveness of ship safety inspections.
Chung et al. [
18] explored how data mining can improve ship safety inspections in Taiwan’s ports. By analyzing past inspection data, the research identified patterns and relationships between different safety issues found on ships. The research showed that analyzing specific ship types, like oil tankers, provided more useful information than simply looking at the classification society that certified the ship. These findings can help inspectors focus their efforts on the most critical areas during inspections, making them more efficient and effective. The approach used in this study can be applied to other ports to improve their own inspection practices.
Knapp et al.’s [
19] findings, as well as those presented in this study, underscored the need to refine methods for identifying and prioritizing ships for inspection. Our research makes an additional contribution by identifying the specific areas of each vessel that require particular attention depending on its use.
Fu et al. [
20] investigated how to improve maritime safety by predicting potential ship deficiencies in advance. To achieve this, the research analyzed past port state control inspections to identify patterns and relationships between different types of safety issues found on ships. The findings of this study can help inspectors prioritize their checks during inspections, making them more efficient and effective in identifying and addressing potential safety hazards.
Shen et al. [
21] proposed a new approach to assessing the risk of deficiencies on ships using data from the Tokyo MoU and the MCDM technique. By developing a risk assessment scale, ships with deficiencies were identified with 83.3% accuracy in subsequent inspections. The results obtained demonstrated the usefulness of this system in assisting inspectors in their decision-making and in improving the effectiveness of port state inspections by indicating to the PSCO the priority areas for inspection, which is fully in line with this article.
Yuhong-Wang et al. [
22] laid the foundation for understanding the factors influencing PSC inspections by identifying safety deficiencies and technical characteristics of ships as the main determinants. Our research is in line with these findings and goes deeper into the relationship between ship type and technical characteristics, as well as the impact of deficiencies found during PSC inspections. This allows us to validate the relevance of the variables selected for our analysis.
Prieto et al. [
23] conducted a detailed analysis of inspections carried out between 2013 and 2018 in the main European ports of the Paris MoU, using multivariate statistical techniques (STATIS). The results provided a valuable indicator for maritime administrations to assess the risk profile of ships and make informed decisions on inspection priorities; in this sense, our study can also provide guidance on inspection priorities according to ship type.
Demirci et al. [
24] developed I-SIA, an intelligent system using fuzzy c-means clustering and the Apriori algorithm, to analyze ship inspection data. In a test case, I-SIA identified the most critical inspection areas and items for a specific ship based on its history, providing a customized approach to improve inspection effectiveness. It is in this respect that this article contributes something new.
The work of Lai et al. [
25] demonstrated the usefulness of PSC inspection data in identifying substandard ships by analyzing the type of ship and the deficiencies found on these ships. Building on this, our study provides an accurate tool to assess the risk associated with each ship type and each deficiency code. These results can help inspection bodies to optimize their resources and focus their efforts on the areas of greatest risk.
Yan et al. [
26] proposed a data-driven bi-objective non-linear programming model, called SRP+ model, to optimize the thresholds in the original SRP framework for the sealing of high-risk ships in the PSC inspections. The results suggested that the threshold of total weighting points to classify a ship as high risk should be slightly increased, the thresholds of ship age should be significantly increased, the threshold of historical number of defects should be increased, while the threshold of historical ship detention time should be decreased.
In their study, Almorza et al. [
27] utilized the HJ-Biplot, a multivariate statistical method, to analyze PSC inspections in ten major European ports. By examining ship characteristics, the analysis effectively classified ships, aligning with existing risk assessments. This provided valuable insights for maritime authorities, including improved risk profiling for inspection prioritization. Furthermore, the study categorized ports based on their maritime traffic and identified characteristics associated with substandard ships, enhancing the understanding of PSC within the European port system.
While the PSC system offers benefits in relation to the safety control of ships, it is necessary to optimize the distribution of resources to focus on those most likely to be in non-compliance with maritime regulations. Therefore, the aim of this paper is to improve the efficiency [
20] of PSC inspections by identifying the areas that require the most attention, which will allow PSCO to concentrate their efforts on the most critical areas according to the type of vessel inspected and reduce the inspection time and resources required for the inspection. This document presents a detailed description of the database used, as well as the methodologies and techniques used for the analysis, in
Section 2. The results obtained are presented in
Section 3, while
Section 4 provides a summary of the most relevant conclusions.
2. Materials and Methods
The sample of this study consists of PSC inspections carried out in the main European ports from January 2018 to December 2022. The data from these inspections were obtained from the THETIS platform.
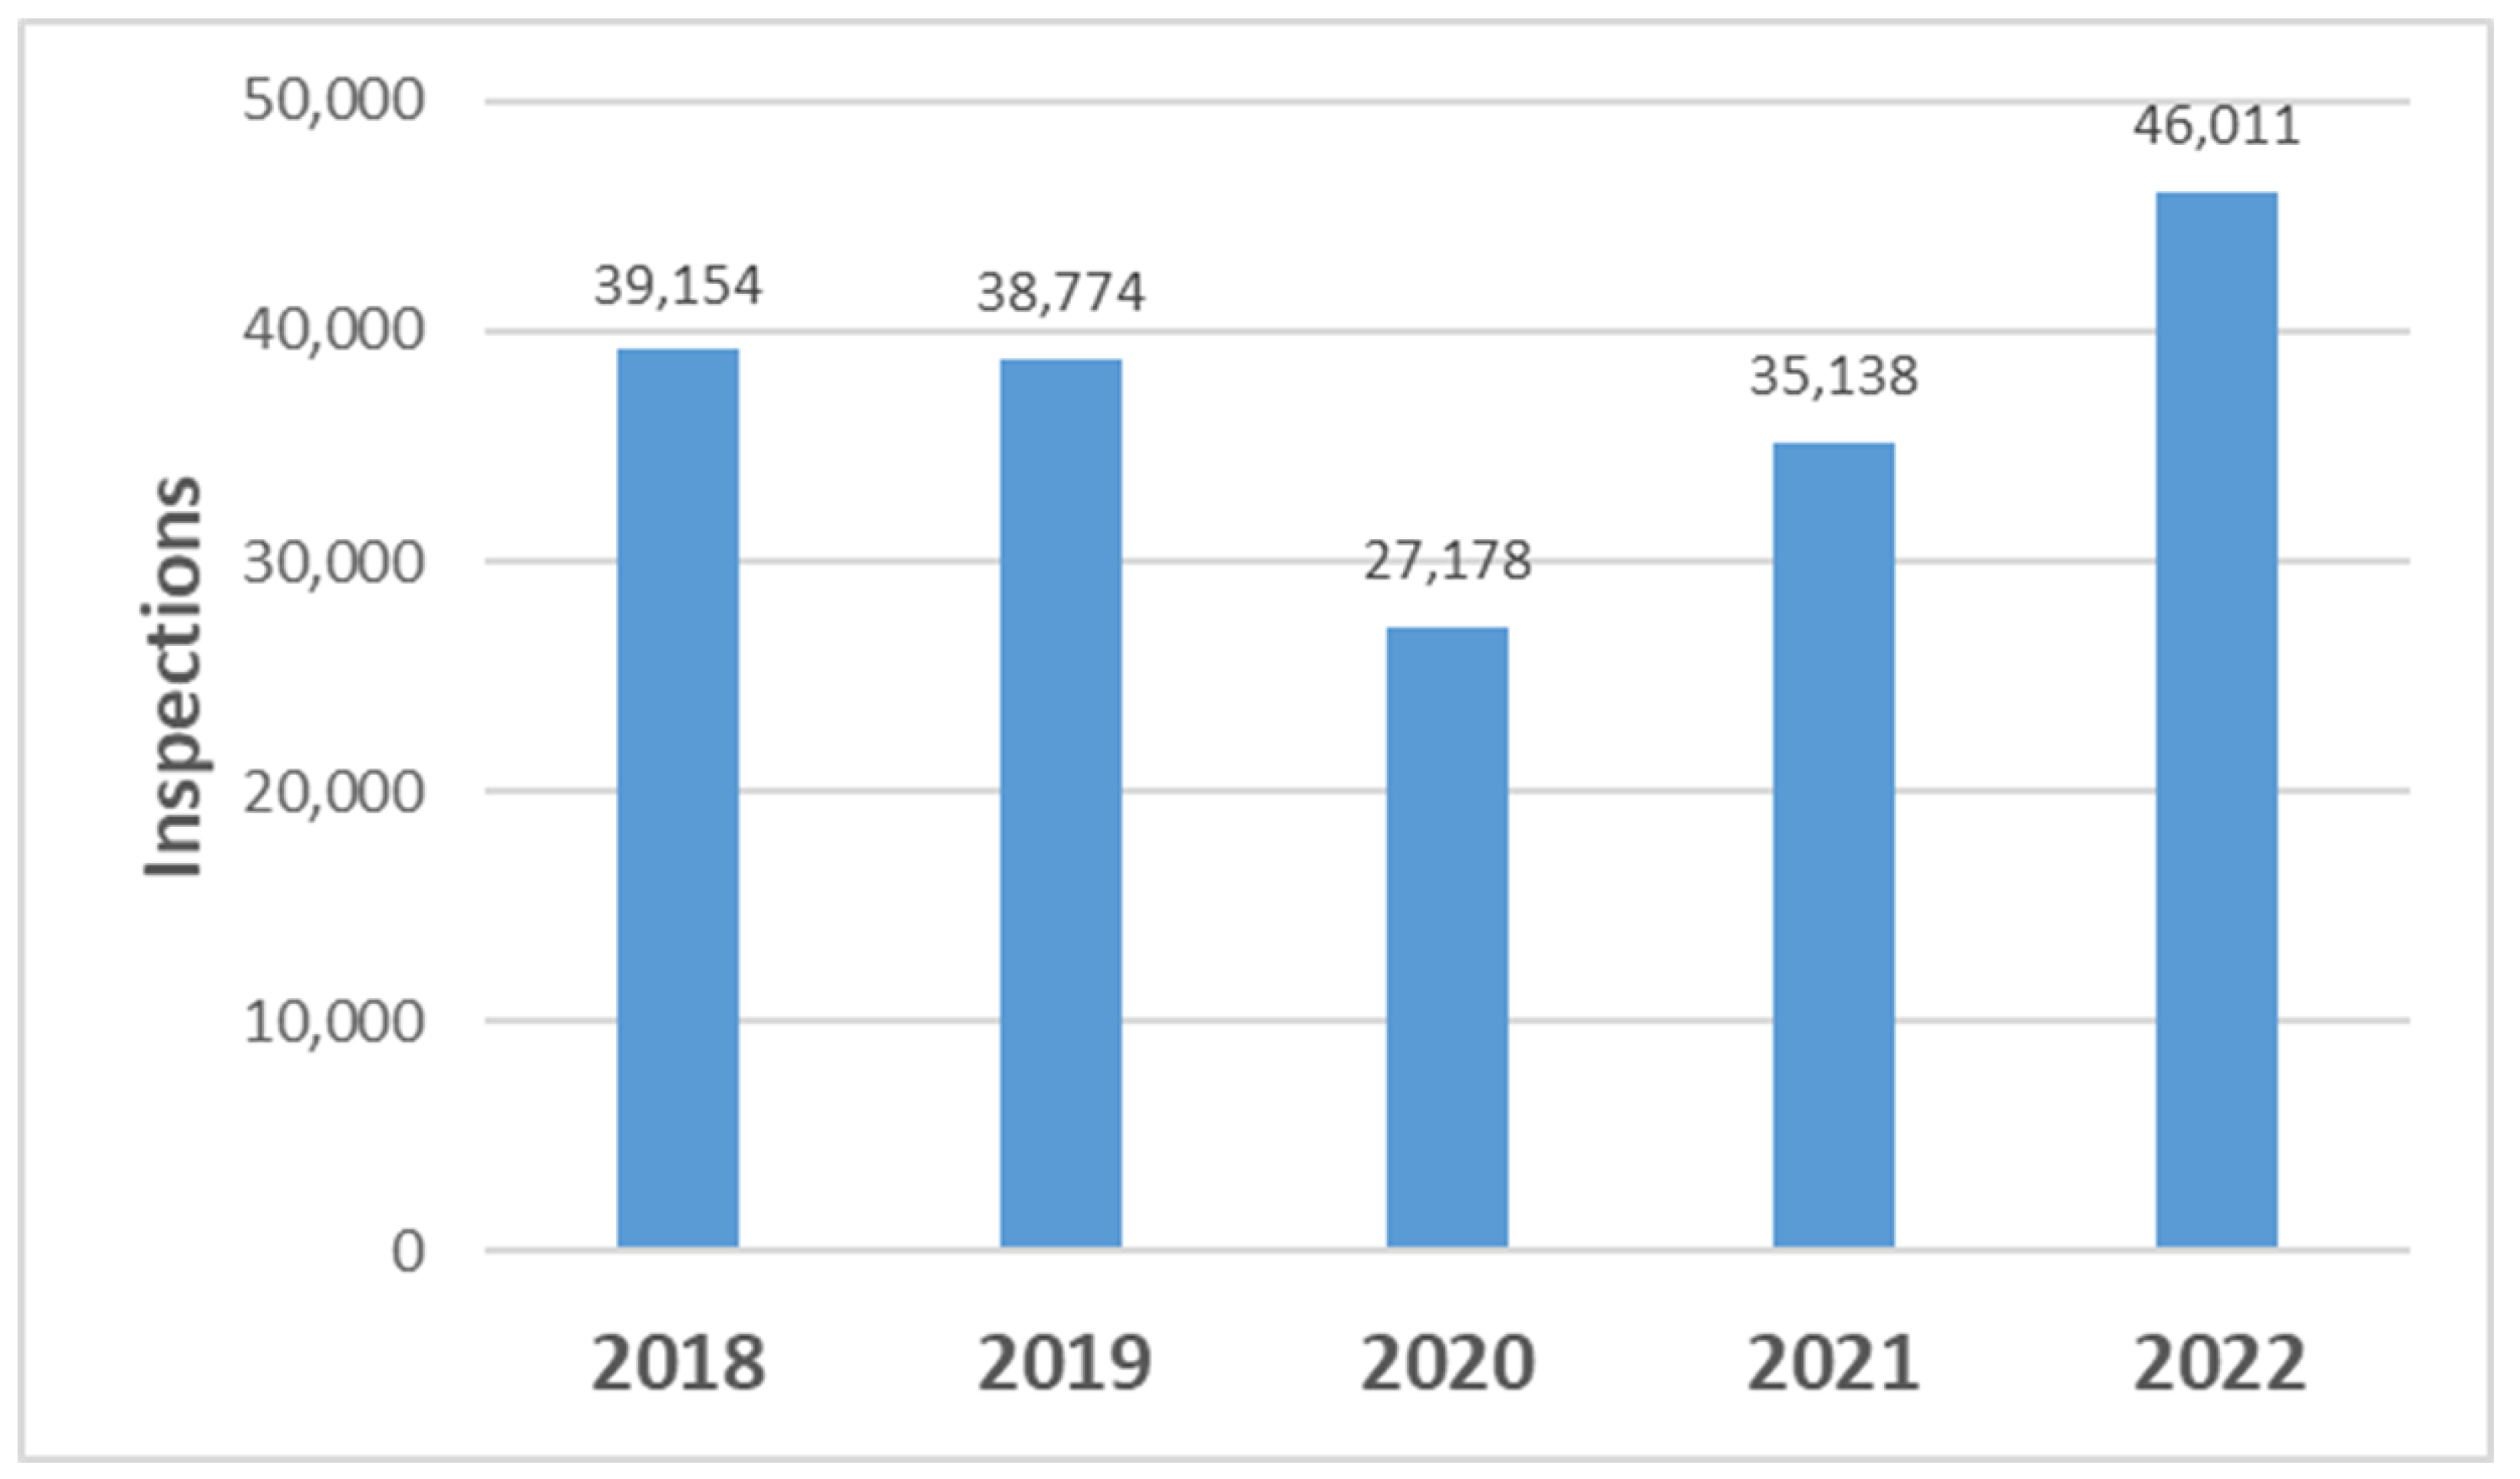
The variables used for this study are two: on the one hand, the type of ship according to its use (container ship, tanker, passenger ship, etc.), and the other variable, the type of deficiencies found after passing the PSC inspection. The dataset taken comes from a total of 186,255 PSC inspections, where it is worth noting that in the years 2018–2022 we obtain an average number of PSC inspections, observing a drastic decrease in the main year of the pandemic, with 27,178 inspections in 2020, thus showing one of its main consequences [
28].
In
Figure 1, we can see a graphical representation of the total number of inspections between 2018 and 2022 carried out according to the PSC MoU Paris, showing a clear decrease in 2020, with a smaller decrease in 2021.
In this study, the main objective is to identify deficiency patterns in PSC inspections based on the type of vessel, regardless of the year in which the inspections were conducted. Although the data cover the 2018–2022 period, the analysis is not broken down by year since temporal variability does not significantly affect the relationship between vessel types and the deficiencies found (see
Figure S1,
Supplementary Materials). Furthermore, the sharp decrease in inspections in 2020 due to the COVID-19 pandemic could lead to a biased interpretation of the evolution of deficiencies over time. Therefore, the dataset has been considered as a whole, ensuring a more robust analysis of structural risk patterns in maritime safety.
2.1. Correspondence Analysis
Correspondence analysis [
29] is a statistical technique used to explore and visualize relationships between two qualitative variables: one variable whose categories appear in rows and the other variable whose categories are represented in columns.
Let
and
be two categorical variables with values
and
, where
and m are the categories of
and
, respectively; the data are organized in a contingency table, where
represents the observed frequency of the category combination
of variable
and the category
of variable
.
Table 1 shows the frequency distribution, where the row of
corresponds to the marginal totals for the rows,
to the marginal totals for the columns and
to the total sample size.
The main purpose of a correspondence analysis is to transform a table with numerical information into a graphical representation that facilitates the interpretation of the information, looking for axes (hypothetical variables) that explain the distribution of frequencies. To do this, we do not work directly with the frequencies, we calculate the row and column profiles. A profile is the distribution of relative frequencies of a line in the table, whether row or column, in relation to its marginal total. The profile is and the profile is . Another important concept is that of mass, each profile (row or column) is assigned a mass, which is the quotient between the marginal total of the line (row or column) and the global total, being the mass and the . Not all rows have the same importance, since the profile of each row is referred to a different marginal total. Therefore, when representing the profiles, we should give more importance to those with greater mass (), same for the columns (). The use of profiles facilitates interpretation but can produce a mistaken view of the relationship between variables. To solve this problem, a distance is used that does not ignore the differences between the profiles of each line. The chi-square distance is a weighted Euclidean distance used to measure distances between profiles. It is calculated in such a way that the categories that are more frequent are weighted less and those that are less frequent are weighted more.
So, given two points and , the Euclidean distance between them is . Therefore, given two profiles, and , the chi-square distance between them will be , . Distances are not measured between rows or columns but relative to an average row or column profile, that is, relative to the average of the coordinates of that line weighted by its mass. This average profile is located at the origin of the coordinates and is called the centre of gravity or centroid. The inertia of a point cloud, which represents the profiles, is a measure of the dispersion of the profiles in a multidimensional space. It is calculated as the sum, for each point, of its mass times its distance to the centroid squared. A low value of inertia means that all products are located close to the centroid and are therefore similar, while high values of inertia indicate the opposite. The total inertia of a table coincides with the corresponding chi-square value.
As a preliminary step to correspondence analysis, we must determine whether the data can be fitted to a model, that is, determine whether there is a relationship between the variables we wish to study. It would make no sense to perform correspondence analysis if there was no relationship between the variables. This is achieved with the chi-square test on the contingency table to test the goodness of fit of the data to the model, which is given by the standardized residuals, what is known as contributions , being the observed frequencies (the data sample) and the frequencies that would be expected if the variables were independent.
Thus, the method consists of finding the singular value decomposition of the matrix , to build a coordinate system (usually two-dimensional) associated with the rows and columns of the contingency table, which reflects the relationships existing between said rows and columns. In the representation, the aforementioned chi-square distances between profiles play an important role, which the correspondence analysis attempts to reproduce in its graphic representations.
Once the basic concepts of correspondence analysis have been explained, the analysis proceeds to diagonalize the variance–covariance matrix () in order to obtain the vectors and eigenvalues that will define the new axes on which the point cloud will be projected. This method attempts to find two arrays called of cartesian coordinates.
representing the row points with: , representing the column points with: (generally dimensions).
There are several ways to calculate matrices , known as normalizations. A widely used way is known as symmetric or canonical normalization, which seeks to satisfy that the scalar product is proportional to the standardized residuals .
Correspondence analysis is therefore a technique used to represent the rows and columns of a contingency table as points in a low-dimensional vector space [
30], so that the corresponding spaces can be superimposed to obtain a joint representation, associating the proximity between the points in the graph with the relationship between the categories (
Figure 2). This method, in its different versions, is commonly applied in research in different fields such as circular economy [
31], economics [
32], nutrition [
33], medicine [
34,
35] and business [
36]; moreover, there are multiple computer implementations for its application [
37]. In our case, using the free software R version 4.3.1, we are going to superimpose in the same subspace the type of vessel and the number of deficiencies found for each of them, allowing us to find the relationships between the categories of both variables based on their proximity in this plane (
Figure 2).
2.2. Description and Processing of Data
Next, we examined the total data we worked with using frequency distribution tables for each variable from 2018 to 2022, selecting the most representative ones, excluding those with lower frequency.
The Paris MoU agreement establishes a hierarchical classification for both the deficiencies detected in ship inspections and for the types of ships. Deficiencies are categorized using numerical codes: general categories (2–3 digits) and specific categories (4–5 digits). The classification of ships is based on their use, using a specific coding system.
Figure 3 shows the number of inspections by type of vessel, considering only the type of vessels that have more than 1000 inspections/year.
Table S1 (
Supplementary Materials) presents the distribution of vessel types according to their use and the study years. The General Cargo/Multipurpose (72,543 inspections) and Bulk Carrier (44,763 inspections) types account for 63% of the total sample. Given the substantial variation in frequencies among vessel types, we selected only those above the 50th percentile, with at least 2000 inspections. An exception was made for the commercial yacht (1103 inspections) due to its relevance in the study, as its inclusion allows for a more comprehensive comparison between vessel types and prevents the loss of information on this specific category. As a result, the final sample consists of 183,154 inspections, representing a 1.7% reduction compared to the total sample of 186,255 inspections. This selection ensures a more robust statistical analysis by minimizing the influence of vessel categories with very low representation.
Table S2 (
Supplementary Materials) shows the frequency distribution of deficiency types, grouped by categories (DIC 2 Díg column) and subcategories (DIC 3 Díg column).
By categories, the most repeated type of deficiencies is “18 MLC” with 16% of the whole sample (29,792 inspections) and within this, the subcategories “183 Accommodation, recreational facilities, food and catering” with 10,918 inspections and “184 Health protection, medical care, social security” with 17,138 inspections stand out.
The second most repeated category is “01 Certificates & Documentation” with 15% of the sample; this is followed by “07 Fire safety” with 13%, followed by “10 Safety of Navigation” with 11%, “11 Lifesaving appliances” with 8%, “14 Pollution Prevention” with 7%, highlighting the subcategories “MARPOL Annex I, IV, V and VI” and “04 Emergency Systems” with 6%. The remaining categories have fewer than 10,000 inspections and have percentages of less than 5%.
Figure 4 shows the percentages by impairment type category of PSC inspections identified in the sample. Therefore, we are going to perform a simple correspondence analysis for the different categories, grouped in two digits, of the type of deficiency, highlighting the most important relationships.
3. Results and Discussion
In this section, we begin with the analysis of the variables, using correspondence tables, which show the frequencies and their visualization on a factorial plane, with their inertia percentages described for each axis (Dim 1, Dim 2), obtaining good representation qualities in all the figures shown. In order to facilitate the interpretation and understanding of the figures, each image will be accompanied by the codes of the corresponding deficiencies according to the Paris MoU classification.
We start by studying the deficiencies, but grouping them by categorie
s with the first two digits (
Table S2).
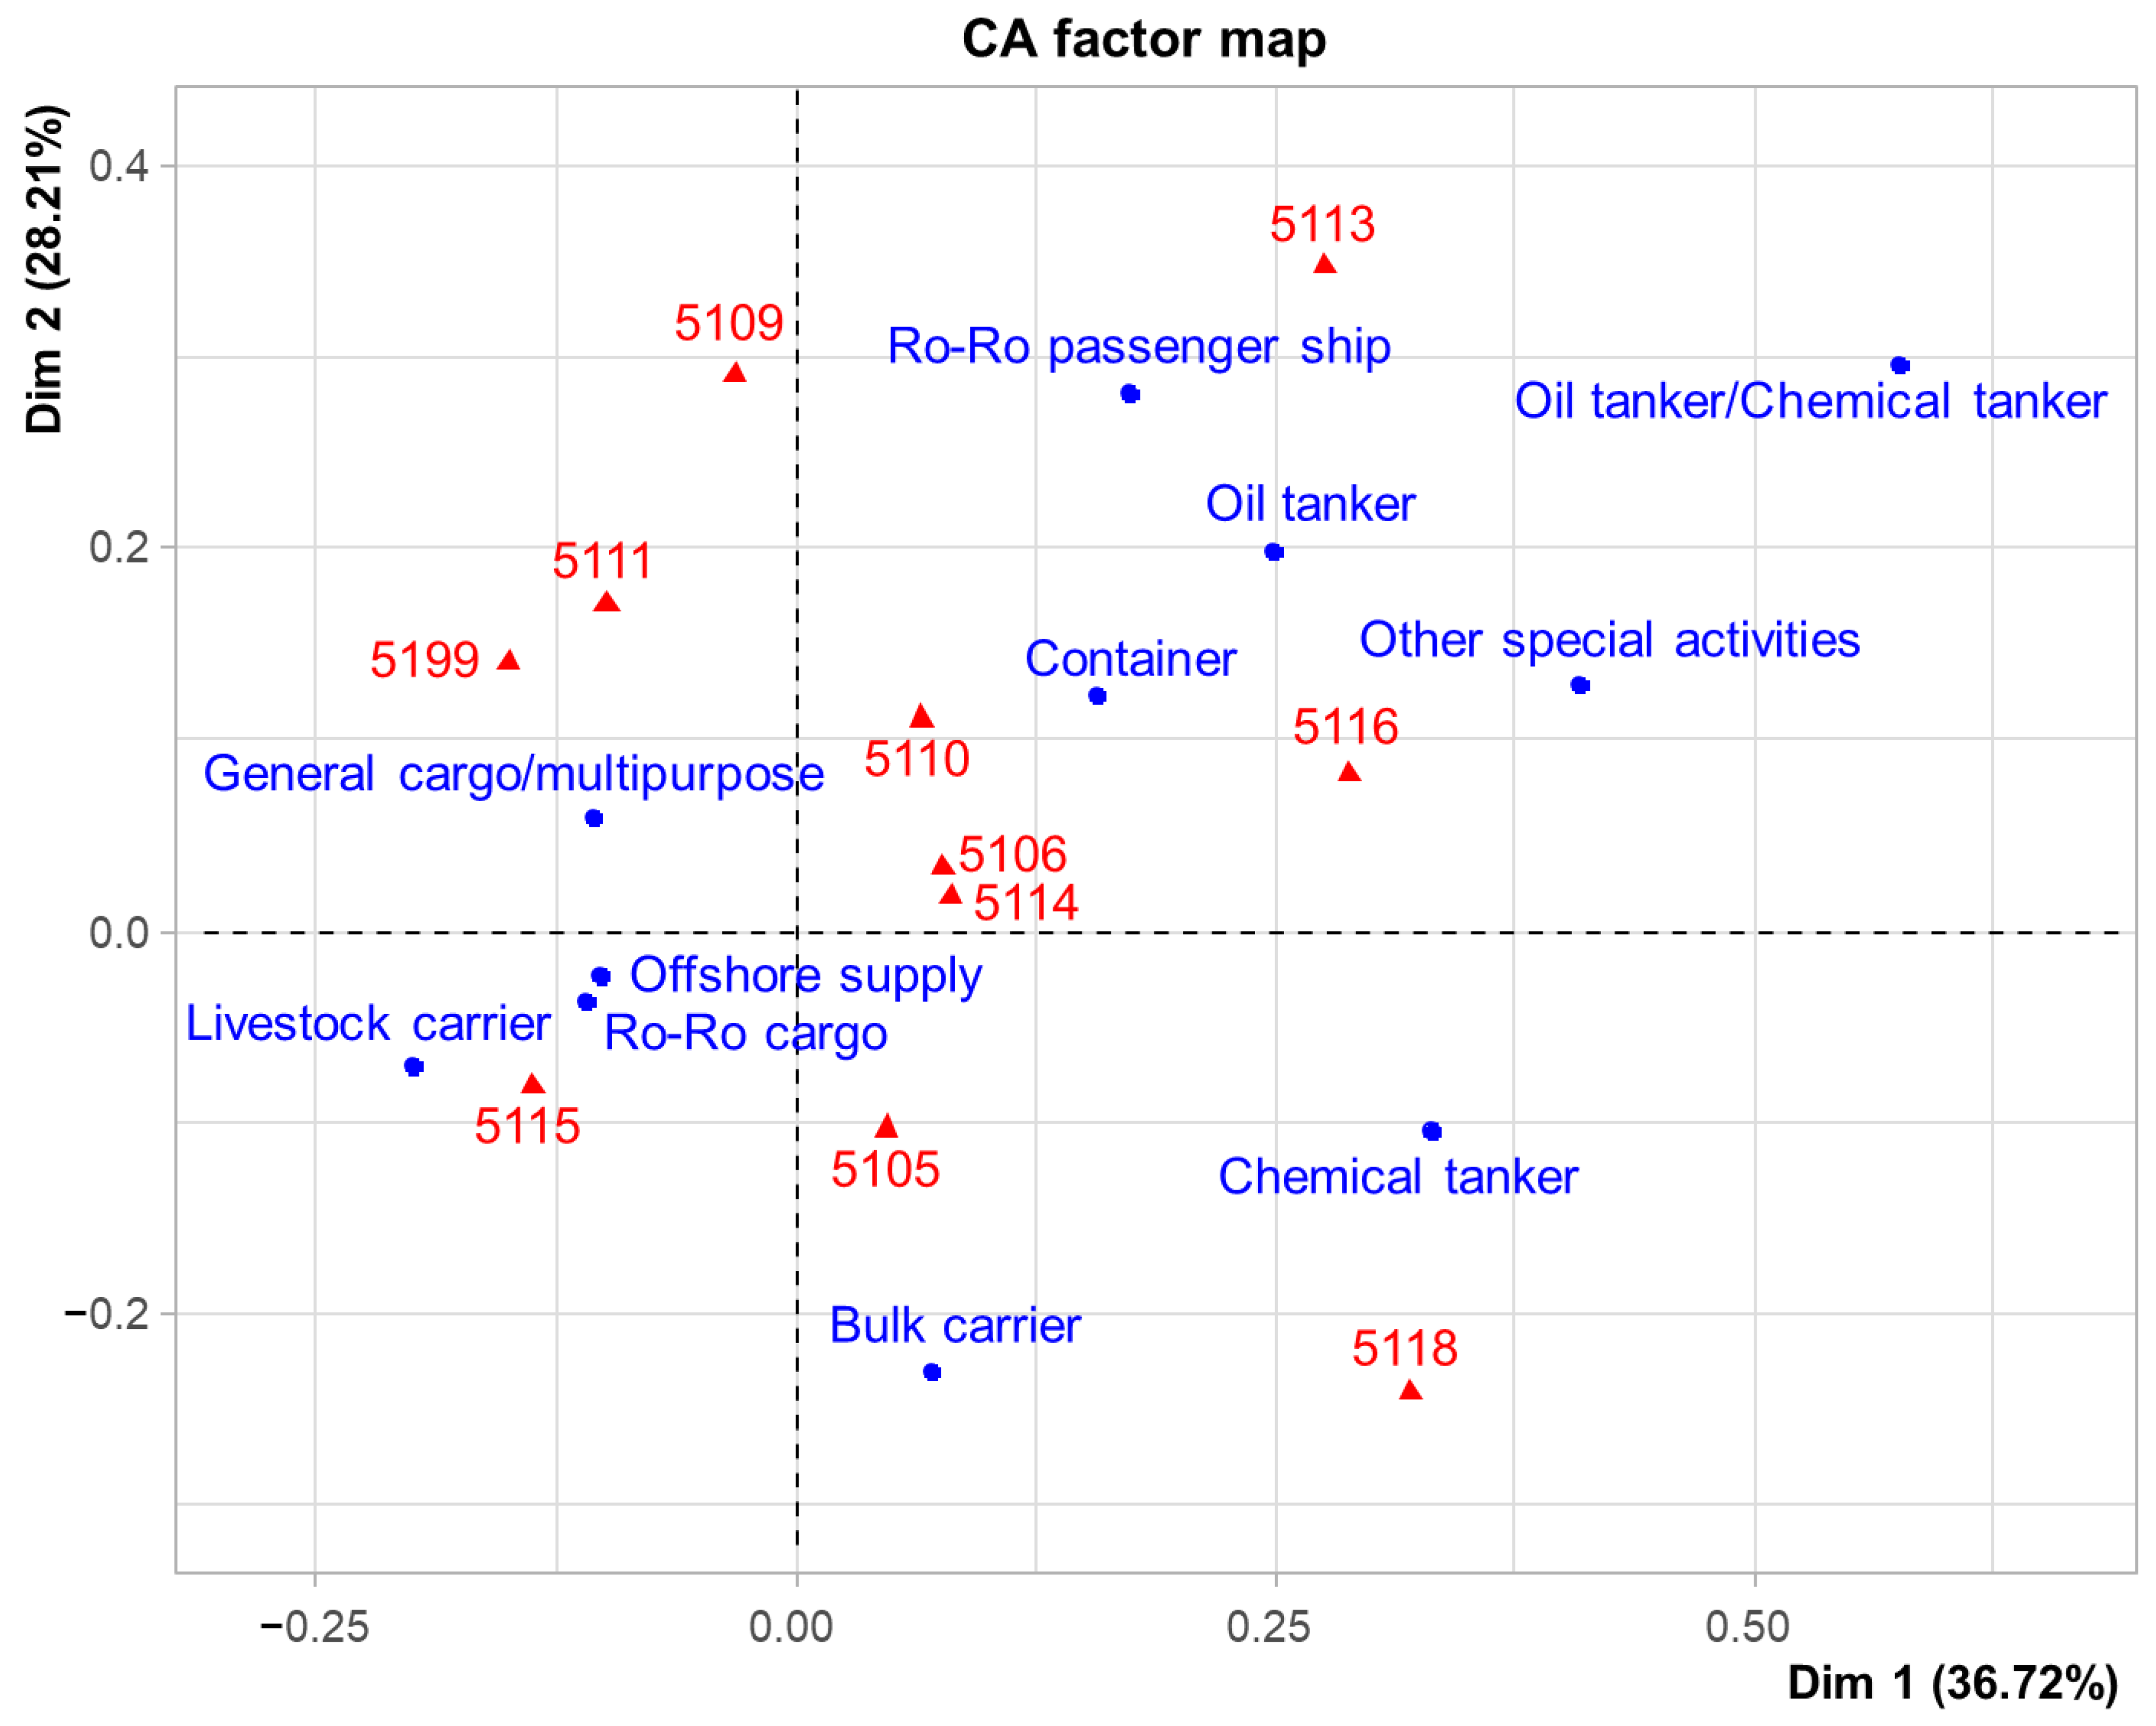
Figure 5 shows such a representation, where we observe notable differences in the type of deficiencies per ship.
Other special activities and offshore supply are close to “01 certificates and documentation”, with a similar profile in the commercial yacht.
The Livestock Carrier vessels are characterized by the deficiencies “05 radio communication” and “10 safety of navigation”, somewhat less in the Tug and General cargo vessels.
Bulk Carrier, Container and Refrigerated cargo vessels are characterized by deficiencies in categories “03 Water/Weathertight condition”, “08 Alarms”, “13 Propulsion and auxiliary machinery”, “14 Pollution Prevention”, “15 ISM” and “18 MLC”.
The Chemical tanker, Gas carrier, Oil tanker, Oil/Chemical tanker and Ro-Ro cargo vessels stand out in the categories: “02 Structural condition”, “04 Emergency Systems”, “09 Working and Living Conditions”, “11 Lifesaving appliances” and “99 Other” and to a lesser extent in “06 Cargo operations including equipment” and “07 Fire safety”.
Finally, the Passenger ship and Ro-Ro Passenger ship, which are separated from the rest of the ships, heading to “07 Fire safety”.
This representation of the deficiency profiles for each type of ship has revealed a notable heterogeneity. These initial results suggest that the different deficiencies vary significantly between each type of ship. Therefore, a more detailed analysis at the subcategory level is proposed to identify specific deficiencies and develop customized inspection strategies [
24], with the aim of improving the operational efficiency of inspectors. These subcategories (
Table S3, Column DIC 4–5 Dig.) are codified in the Paris Memorandum, and we have used their digits to represent them in the figures, making it easier to visualize and interpret the results. The codification corresponding to each of them is included in
Table S3 of the
Supplementary Material.
We start with “
01 Certificates & Documentation” with its representation in
Figure 6. This category represents 14.6% of the PSC inspections in the sample, being the second highest (below category 18 MLC with 16%). The General cargo/multipurpose vessel stands out from the rest and is located close to many of the deficiencies such as 1101, 1123, 1218, 1305, 1306, 1314 or 1320; the Livestock Carrier with 1315. Others such as Bulk Carrier or some more polluting ones such as Oil tanker with 1220, 1308, 1330. Finally, we could highlight the Container, close to 1136, 1139, 1199, 1310.
It is worth noting in this section as an important result that General Cargo/multipurpose ships are the ones with the most deficiencies with respect to “01 Certificates & Documentation”, ranking close to many categories and separated from the rest. The analysis revealed that general cargo and multipurpose ships require improvement in their compliance with documentary requirements, especially with regard to the updating of certificates.
The category “
02 Structural condition” represents 5% of the inspections and its representation is shown in
Figure 7. In this case, important relationships can be observed, such as that of the Ro-Ro Passenger ship with deficiency 2122; that of the oil/chemical tanker with 2109; that of the offshore supply with 2101; that of the bulk carrier with 2103; that of the oil and chemical tanker with 2107, 2108, 2199 and 2117 and container with 2105, among others.
The relationship between Ro-Ro Passenger ships and structural deficiencies is one of the most important results obtained from this analysis [
14]. These ships are designed to transport both cargo and passengers, the latter being regulated by the International Convention SOLAS and mandatory on all ships. More specifically, the deficiency listed as the most significant is that of openings to the cargo area, door and scuttles, which is why the inspector must place more emphasis on the inspection of the vessel in this area. Another deficiency that we consider important is that of Oil tanker/Chemical tanker with respect to structural condition, more specifically with that of permanent means of access.
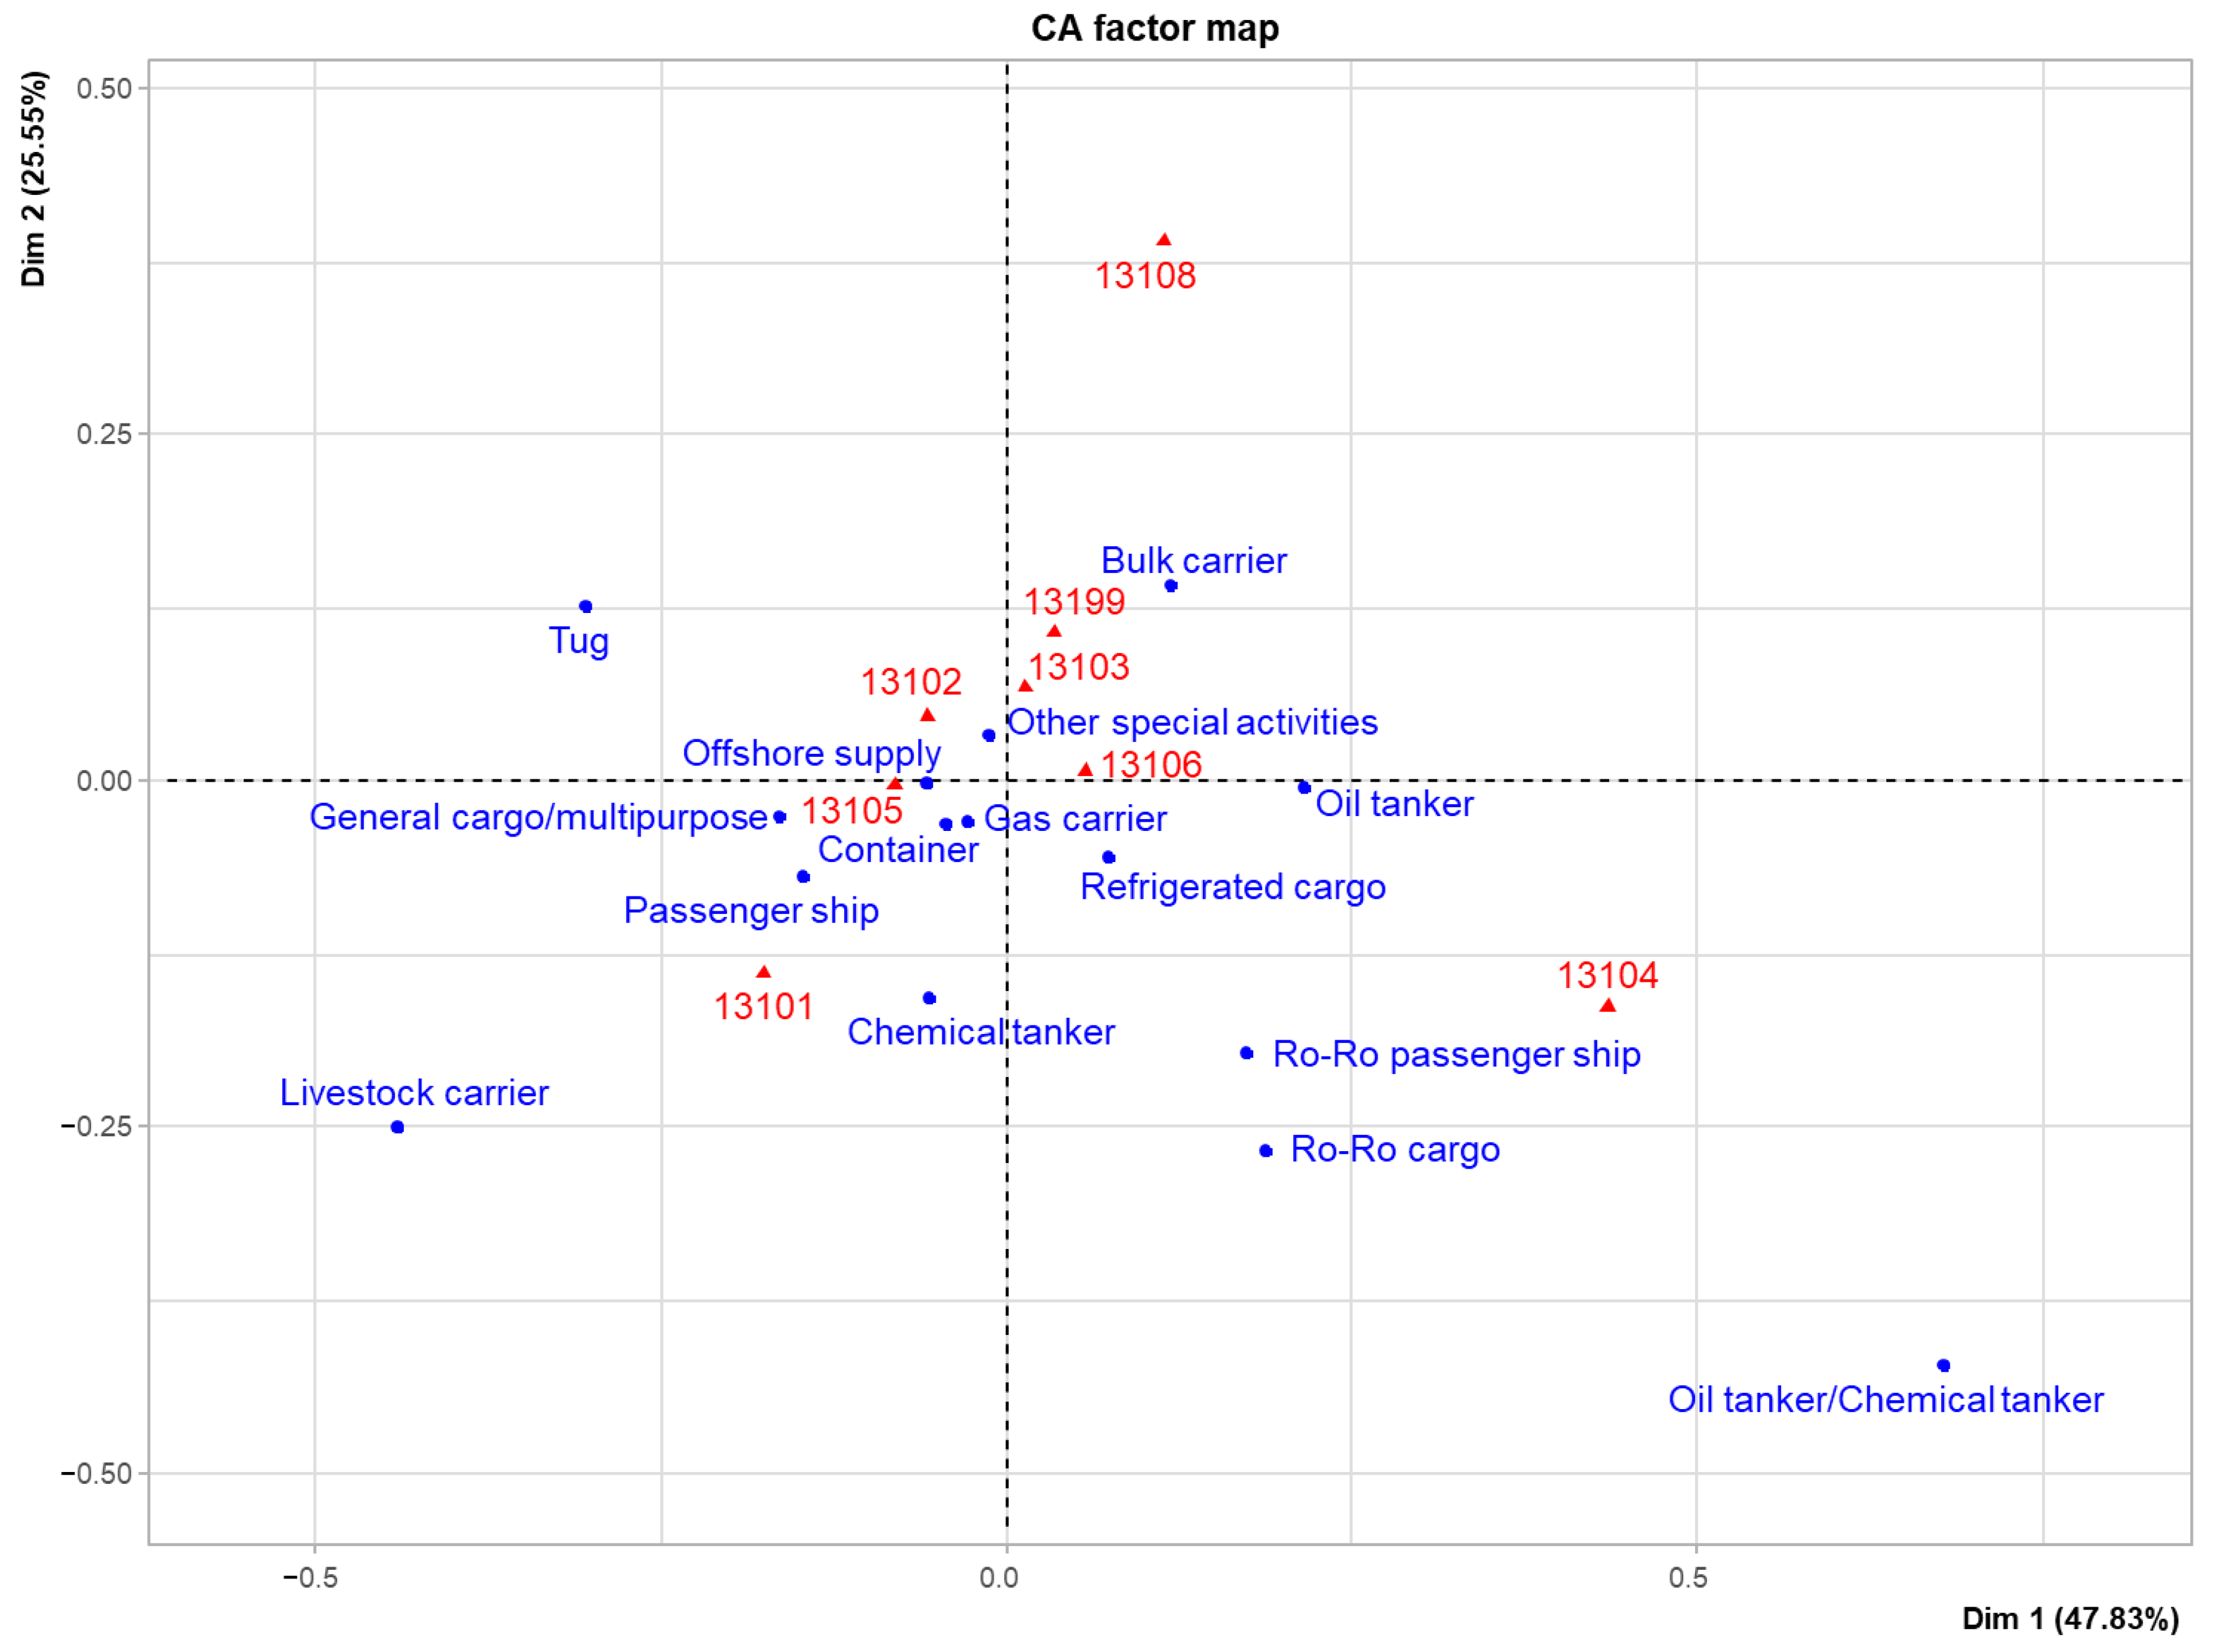
The category “
03 Water/Weathertight condition” represents 5% of the inspections and is represented in
Figure 8. We highlight the relationship between the Ro-Ro Passenger ship and deficiency 3112; livestock carrier with 3106; general cargo with 3102; other special activities with 3107; other more polluting activities such as oil or chemical tanker, container and refrigerated cargo more related to 3103, 3105 and 3108; bulk carrier with 3110, 3104, 3109 and 3199.
It is worth noting from these results that the most polluting ships, such as oil or chemical tankers, container ships and refrigerated cargo ships, are closely related to these types of deficiencies. They presented a greater number of deficiencies related to the watertight integrity of holds and compartments that can compromise the safety of the cargo and increase the risk of marine pollution. Also, the Ro-Ro Passenger ship can be deduced from this representation that it is closely related to this type of deficiencies, more specifically to that of scuppers, inlets and discharges, being another target for supervision by inspectors.
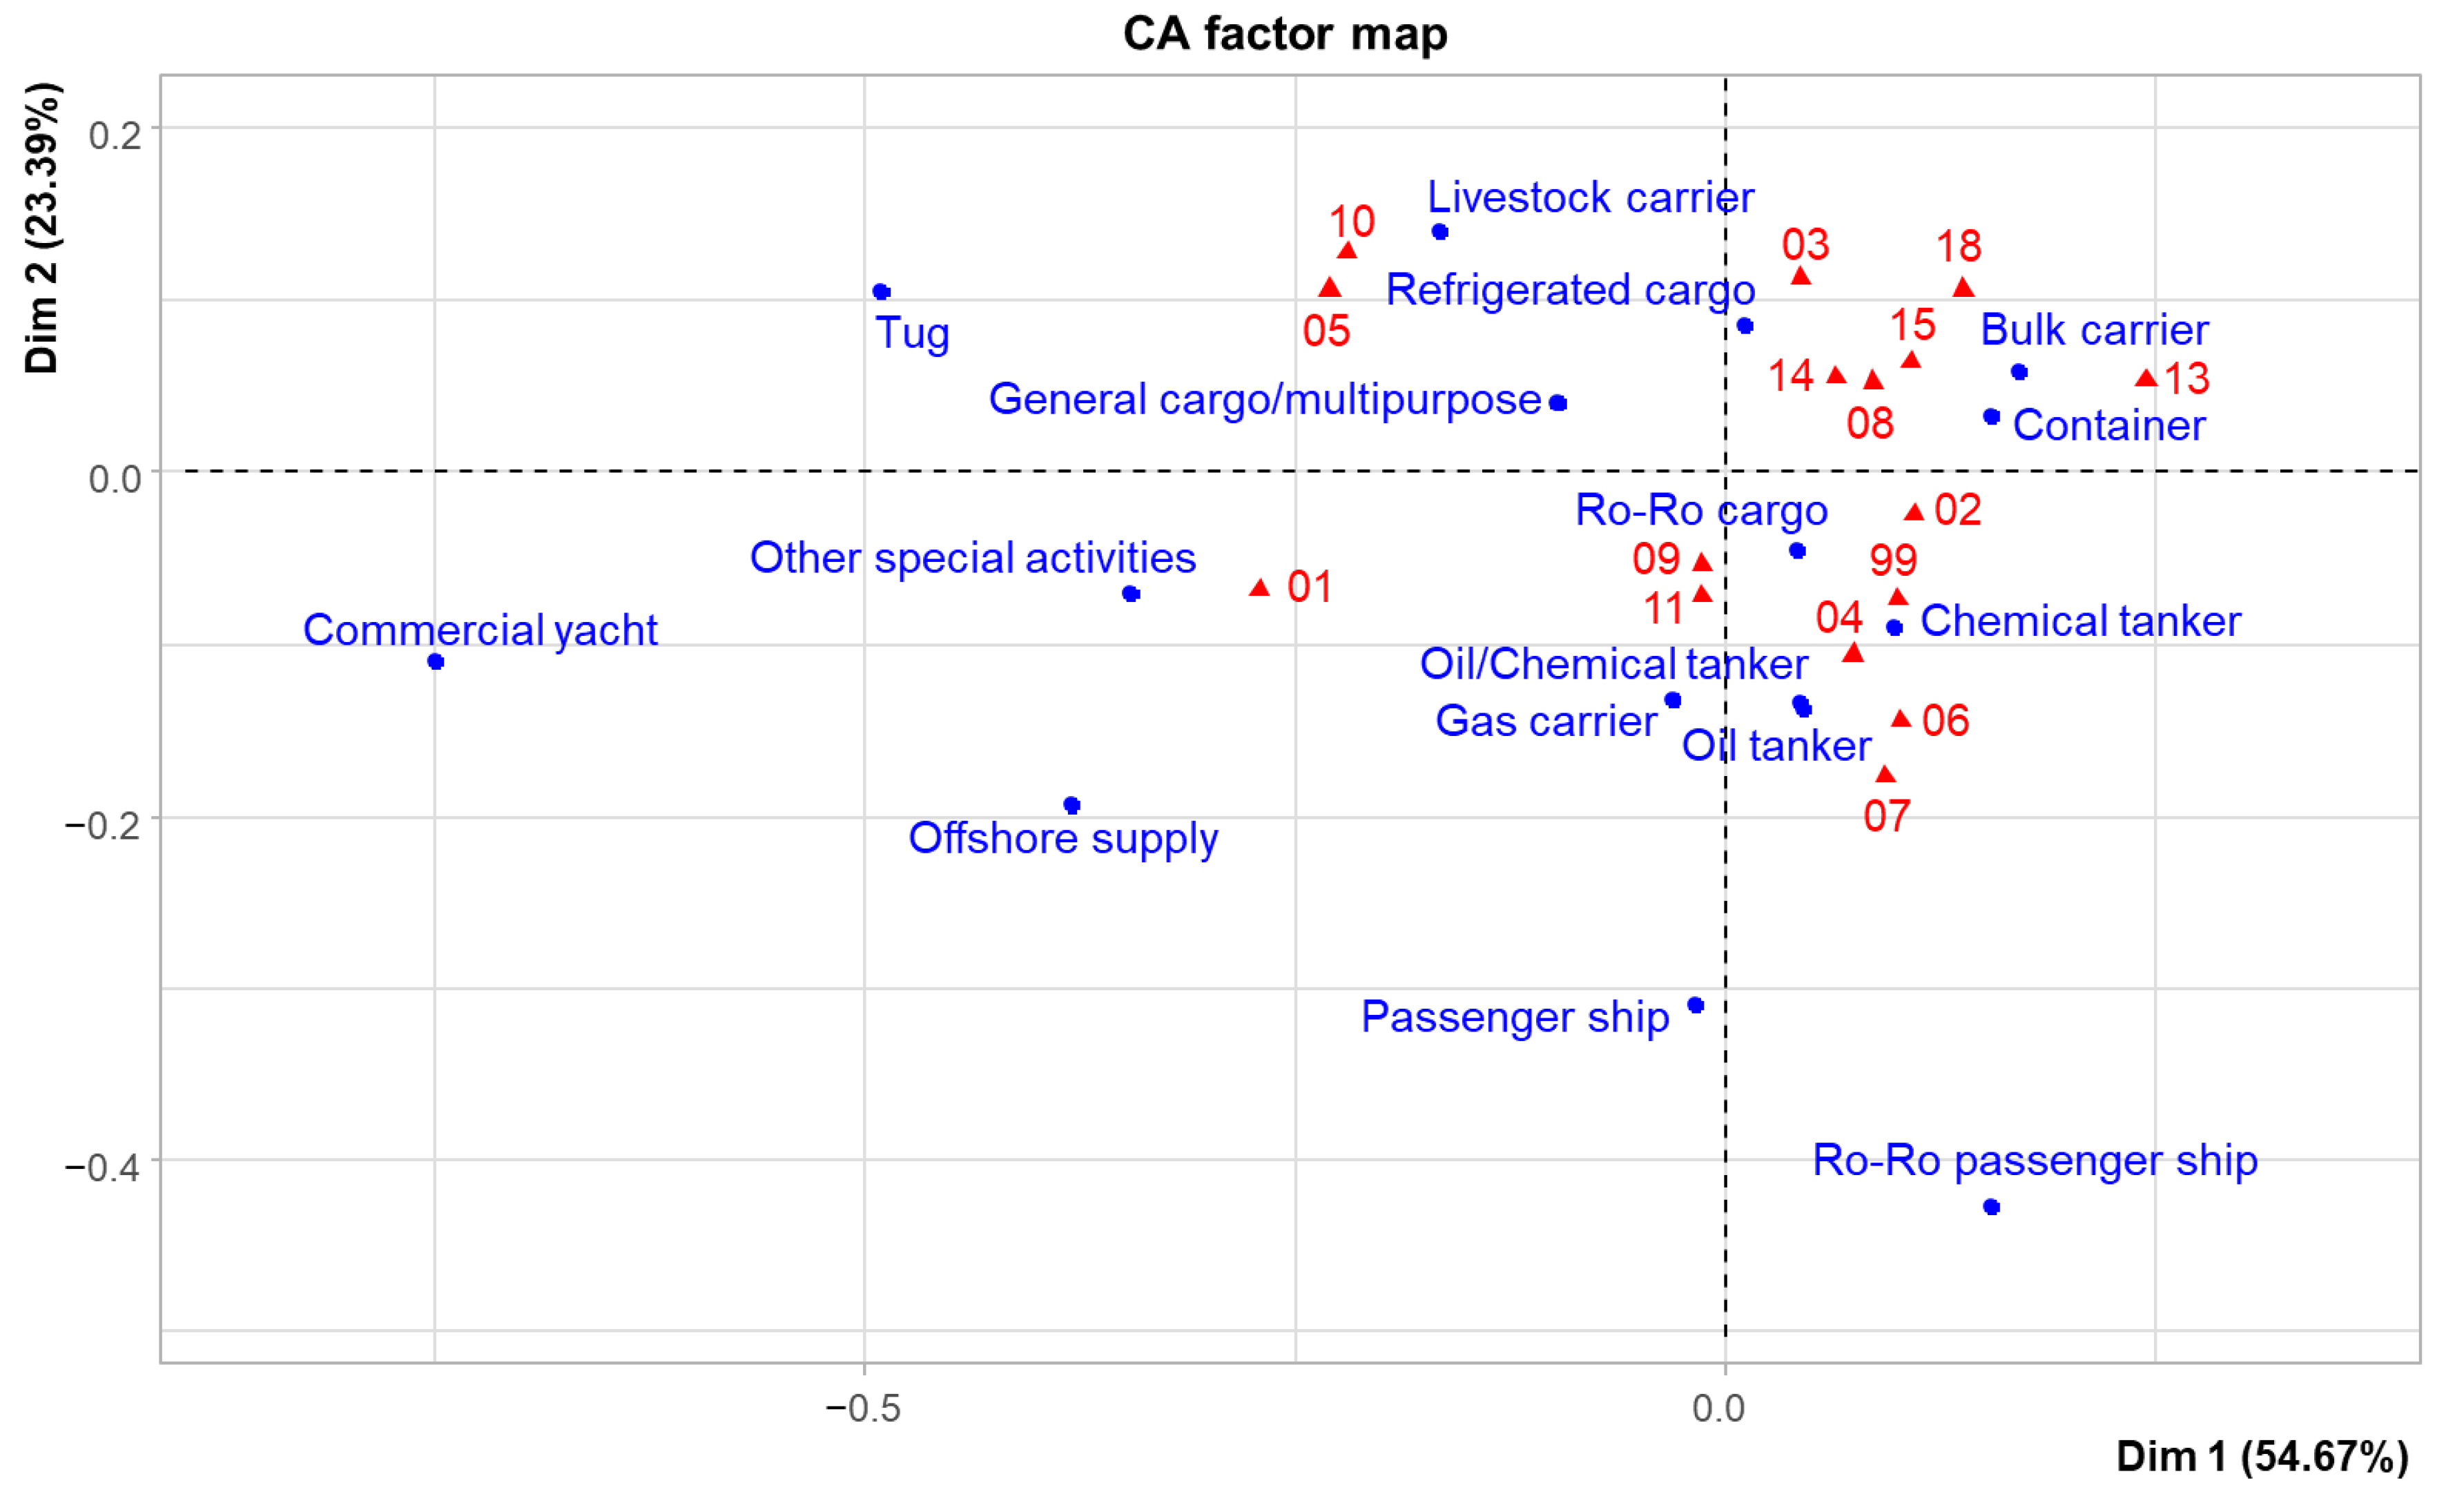
The category “
04 Emergency Systems” represents 6% of the inspections, and it is represented in
Figure 9. Once again, the most polluting ships are located close to each other and are related to deficiencies 4102, 4109 and 4114, more specifically the oil tanker/chemical tanker with 4116, 4117; refrigerated cargo with 4103; Ro-Ro Passenger ship with 4101; general cargo and livestock carrier with 4107 and 4108.
One of the most noteworthy results that we can deduce from this figure is that the most polluting ships, such as oil tankers and chemical tankers, had a significantly higher number of deficiencies in essential emergency systems, such as firefighting and life-saving equipment [
18]. These deficiencies imply serious risks in the event of incidents on board and, therefore, require exhaustive supervision due to the high risk of explosions and environmental disasters that a fire could trigger. In this representation, we also observe an aspect to consider for Ro-Ro Passenger ships, where the public address system is closely related to this type of ship and constitutes a focal point of attention for inspectors due to its importance in the safety and operation of the ship.
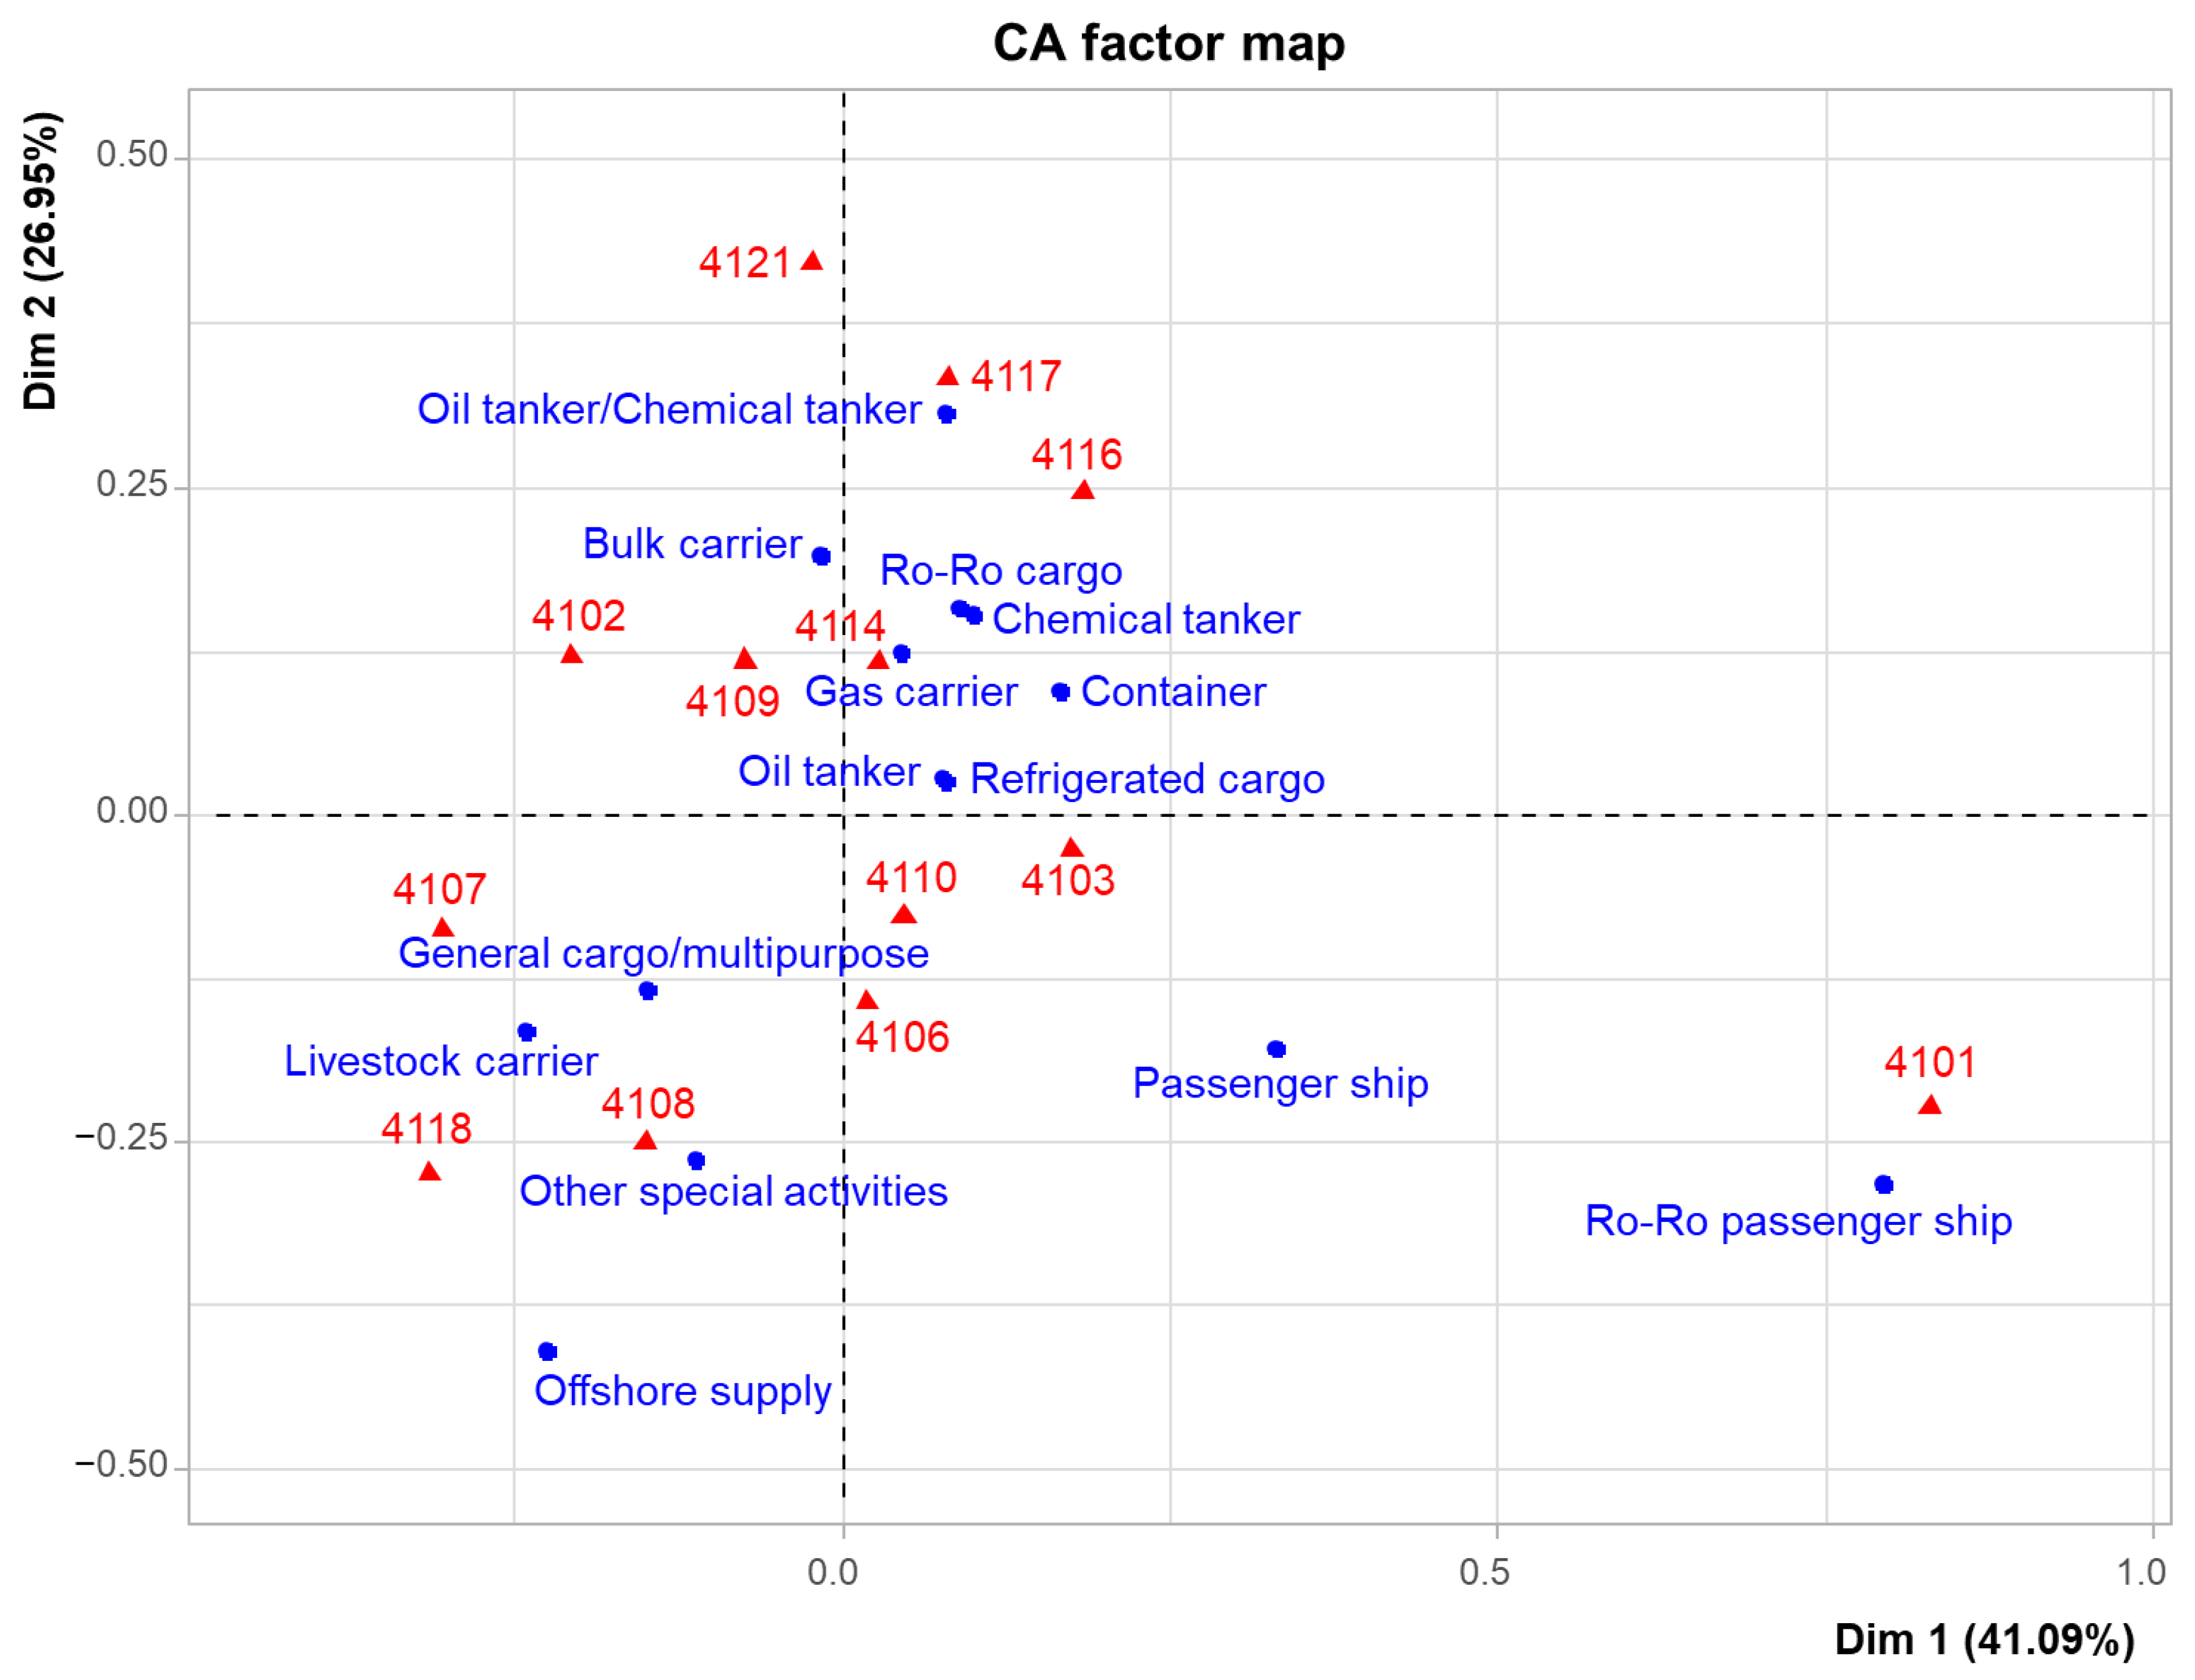
The category “
05 Radio communication” represents only 2% of the inspections, and we have its representation in
Figure 10. In this analysis, we do not highlight any relationship between the type of ship and the deficiencies found after the inspection; this reveals recurring deficiencies in PSC inspections, common to many ships. We name some relatively intense ones such as Ro-Ro Passenger ship with 5109 and 5113; container and other special activities with 5116; chemical tanker with 5118; bulk carrier with 5105; Ro-Ro cargo, livestock carrier and offshore supply with 5115 and general cargo with 5106, 5110, 5111 and 5199.
The category “
07 Fire safety” represents 13% of the inspections and is represented in
Figure 11. In this case, we can see that there are no clear relationships; the majority of ships are located in the center of the figure together with the majority of deficiencies, with the most polluting ones standing out. It is the third most frequent category in the study.
To highlight some of the relationships, we have livestock carrier with 7117, 7110 and 7111; refrigerated cargo with 7106; general cargo with 7108; bulk carrier and gas carrier with 7124; oil and chemical tanker with 7125; Ro-Ro cargo, Passenger ship, other special activities and container with 7101 and 7120.
The category “
10 Safety of Navigation” represents 11% of the inspections and is represented in
Figure 12. As can be seen, this category is among the main deficiencies detected and is made up of a large number of subcategories, as can be seen in the correspondence map. This translates into common deficiencies in PSC inspections and deficiencies common to a large number of ships, so there is no strong relationship between a type of ship and a specific deficiency.
The category “
11 Life saving appliances” represents 8% of the inspections and is shown in
Figure 13. In this category, there are few differences, as we can see all the subcategories represented are located in the center of the figure, as are the majority of ships, indicating that they tend to be deficiencies commonly found in PSC inspections.
The category “
13 Propulsion and auxiliary machinery” represents 4% of the inspections. Its representation in
Figure 14 shows few differences. It is worth noting that deficiency 13108 is not associated with any ship, and the others are located in the center of the figure.
The category “
14 Pollution Prevention” constitutes 7% of the inspections. Its representation in
Figure 15 has been made using only the main categories, so they are not contained in
Table S3 and are equivalent to deficiencies found on ships determined through the annexes of the MARPOL Convention. This point is considered very important for preserving the environment, and it should be noted in this analysis that the General Cargo/Multipurpose and Bulk Carrier ships have deficiencies related to MARPOL Annexes I, IV and V. It is also worth mentioning that the deficiencies related to MARPOL Annex VI correspond to the Oil Tanker. [
21] With regard to the Ballast Water deficiency, it is closely related to Container, Oil/Chemical Tanker and Ro-Ro Cargo ships.
The category “
15—
ISM” represents 5% of the inspections, and since it has no subcategories, we cannot perform the correspondence analysis. Instead, we present the information from
Table 2. With this information, it is not possible to draw relevant conclusions, since the highest frequencies correspond to general cargo and bulk carriers, but we remember that these are the ships that appear most in the global sample,
Table S1.
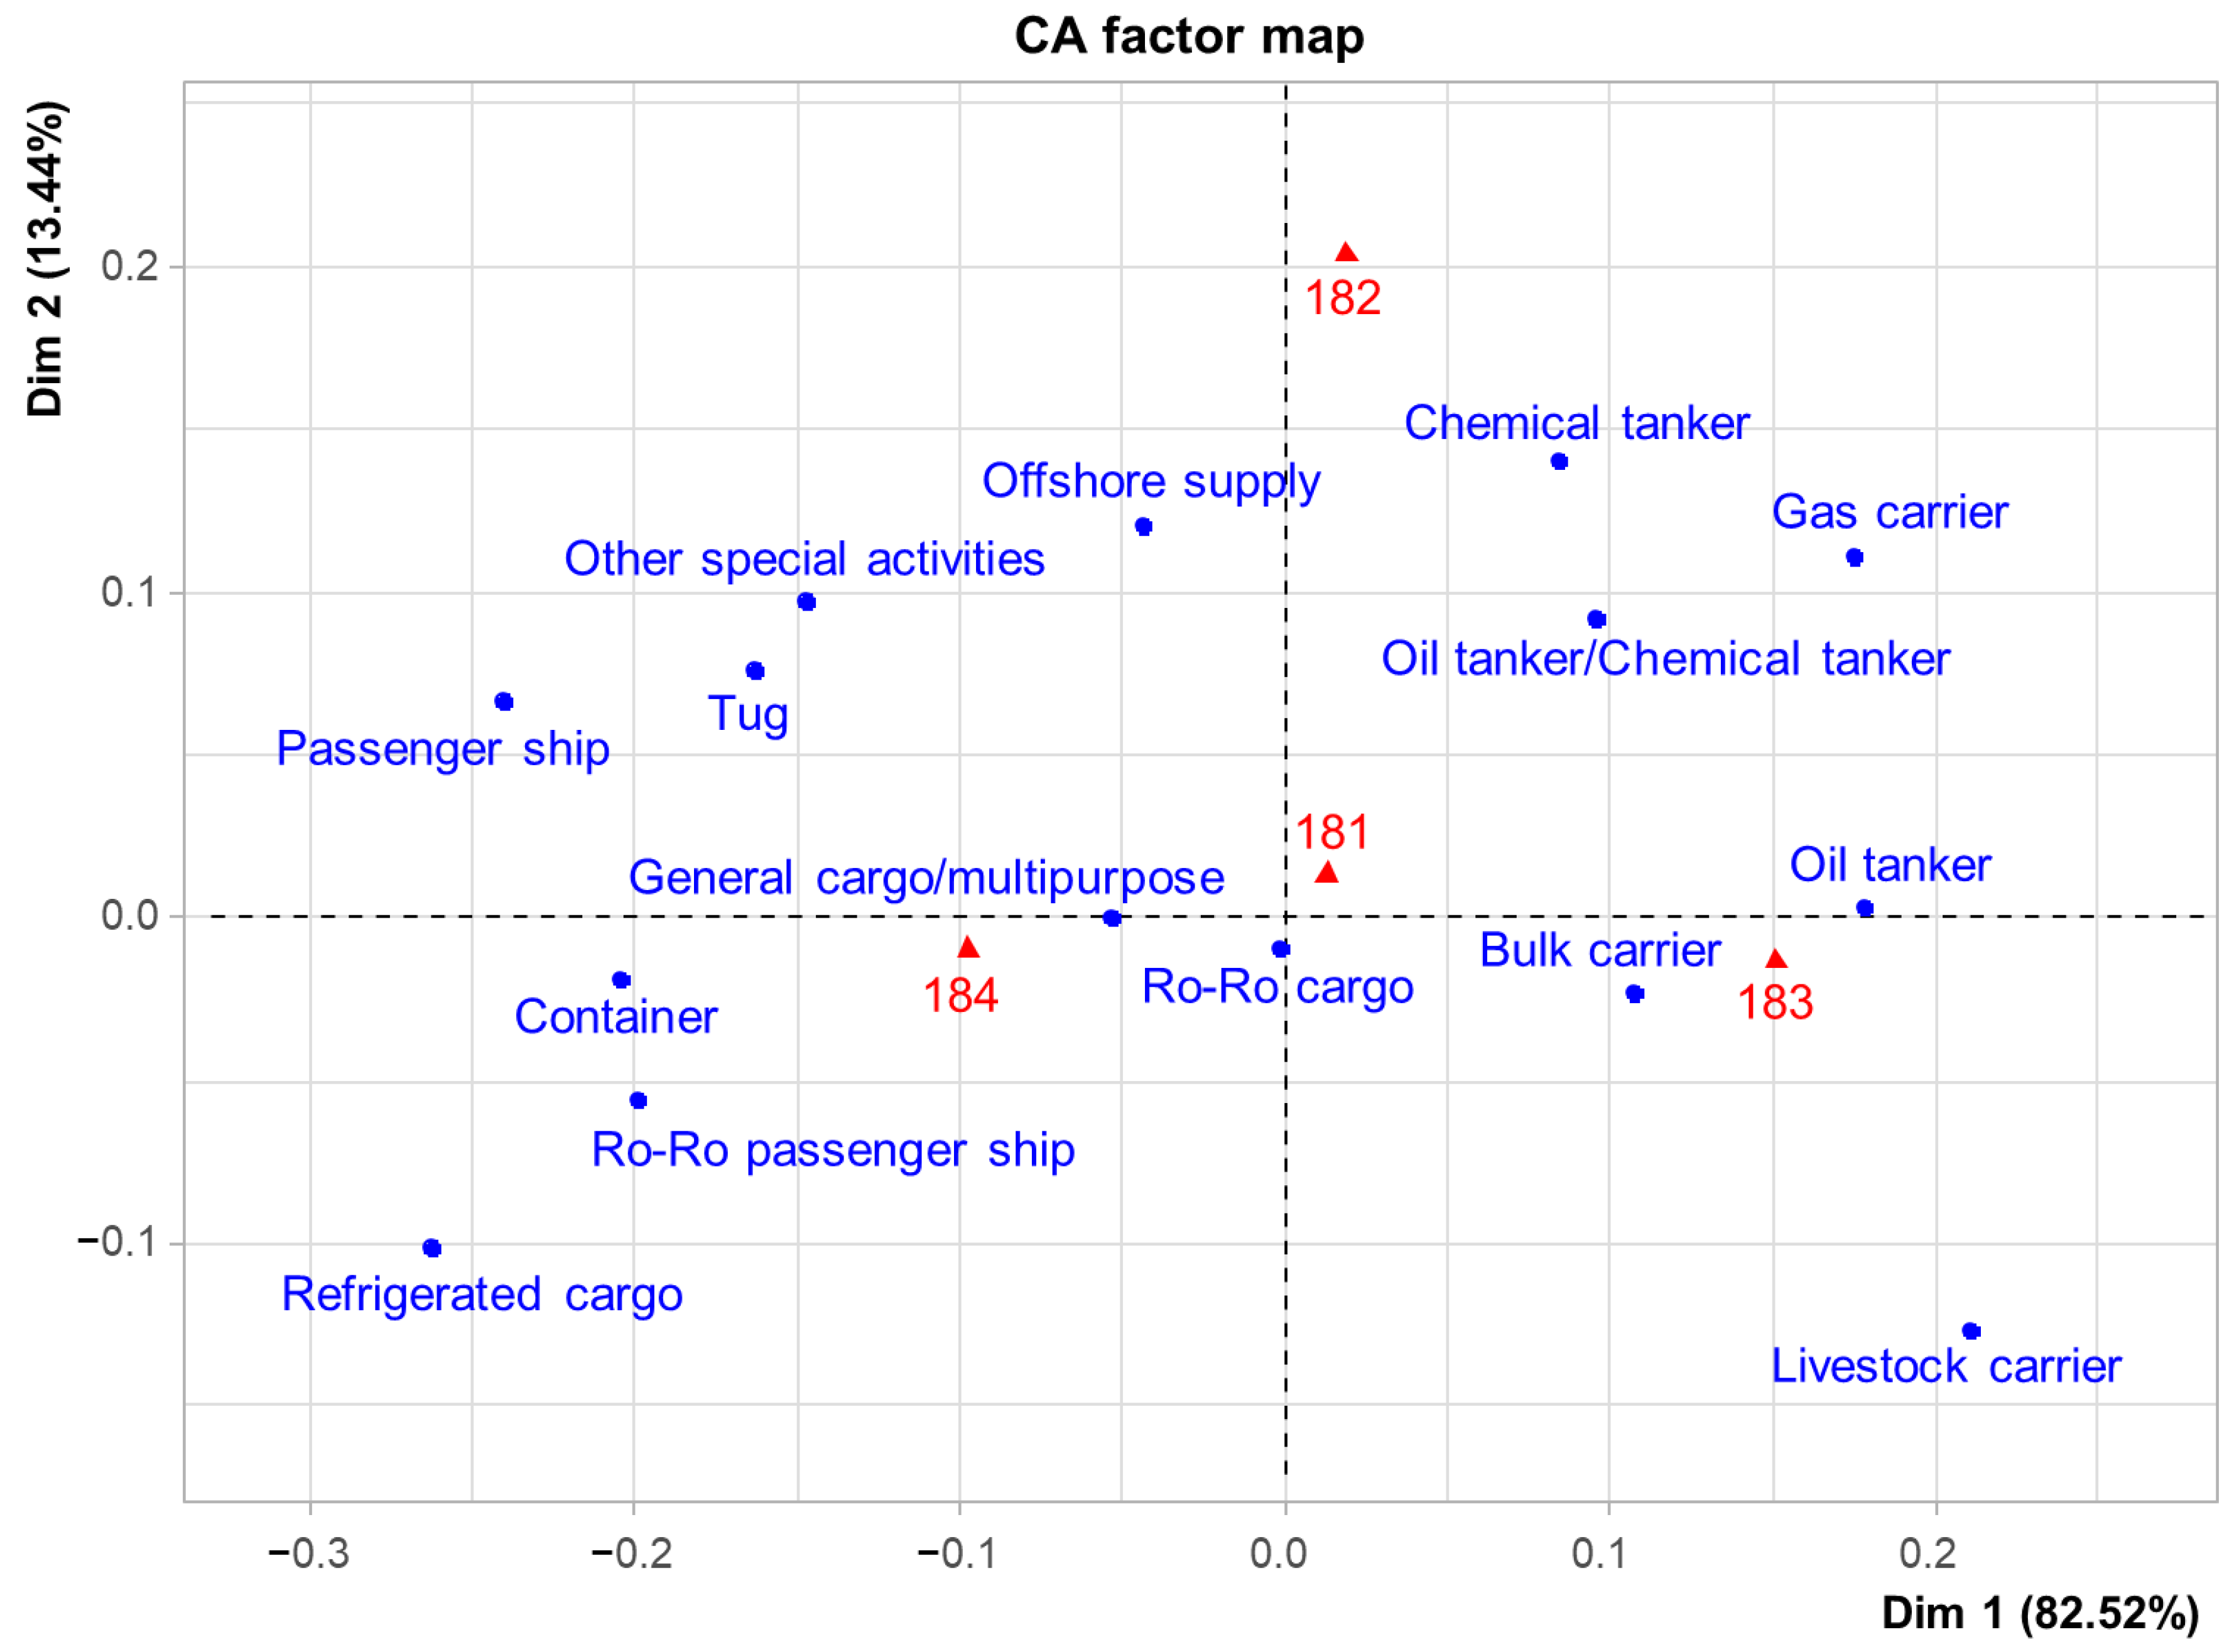
The category “
18 MLC, 2006” is the most common category in the study, representing 16% of the sample. Its representation in
Figure 16 shows the subcategories grouped into three digits. Subcategory 181 relates to general cargo and Ro-Ro cargo ships. Subcategory 184 includes the above ships as well as container ships and Ro-Ro Passenger ships. Subcategory 183 includes bulk carriers and oil tankers. And finally, subcategory 182 includes offshore supply vessels, chemical tankers and, to a lesser extent, gas carriers and oil/chemical tankers.
In this analysis, the most noteworthy aspect is that tankers, Ro-Ro ships and passenger ships presented a high number of deficiencies related to the living conditions on board, according to the inspections carried out. The lack of adequate maintenance of cabins and common areas constitutes a risk to the health and safety of the crew, in addition to affecting their well-being and productivity.
4. Conclusions
The present study has conducted an exhaustive analysis of the deficiencies detected in PSC inspections within the Paris MoU, aiming to identify patterns and trends across different types of vessels. To achieve this, correspondence analysis—a statistical technique used to identify relationships between categorical variables—was applied to 186,255 records from the THETIS platform. The data were normalized according to the Paris MoU classification and processed using statistical software (R) to generate visual representations of the relationships between vessel types and the most frequent deficiencies. However, its implementation posed challenges, such as data heterogeneity, harmonization and the interpretation of statistical results, requiring a meticulous analysis to ensure the coherence and relevance of the findings. Despite these challenges, the applied methodology optimizes resource allocation in PSC inspections and could be integrated with artificial intelligence in the future to enhance deficiency prediction and efficiency in maritime control.
One of the main findings is the heterogeneity in the deficiency profiles between the different types of ships. This variability can be attributed to factors such as design, age, type of cargo carried and the operations carried out in each of them, depending on their use. To improve the efficiency of inspections, a more in-depth study of each subcategory has been carried out. In this way, we will be able to identify the specific deficiencies of each type of vessel and develop personalized inspection strategies that will optimize time and resources.
Here, we present the relationships that have been found between the different subcategories of deficiencies and the types of vessel, presenting the most important conclusions based on the above results.
Table 3 is drawn up for this purpose, summarizing the type of vessel and its most common deficiencies detected after inspection.
Ships involved in specific operations, such as the transport of dangerous cargo or the transport of passengers, presented particular deficiency profiles [
12], which indicates the importance of adapting inspections to the characteristics of each type of operation.
The results of this study have important implications for maritime safety. By identifying the most common types of deficiencies, it is possible to be proactive and design more effective strategies to prevent accidents and protect the marine environment.
We can propose certain recommendations based on the above:
- -
Strengthen inspection programs by increasing the frequency of inspections on ships with a history of significant deficiencies [
26].
- -
Promote crew training by implementing more comprehensive and up-to-date training programs that address the specific needs of each type of vessel and operation.
- -
Encourage preventive maintenance by shipowners, who should prioritize the upkeep of their vessels to avoid major breakdowns and ensure optimal performance.
This study highlights the need for an in-depth analysis of the deficiencies detected in PSC inspections in order to identify specific vulnerabilities by ship type and thus optimize maritime safety control and improvement strategies. The results obtained offer a valuable tool for maritime authorities, shipowners and PSCO inspectors, allowing them to focus their supervision efforts more effectively [
20]. As next steps, it is proposed to deepen the practical application of these findings, developing specific guides and protocols for each type of vessel [
18]. This will facilitate the implementation of more precise preventive and corrective measures, contributing significantly to risk reduction and the protection of the marine environment. In addition, it is suggested that the research be expanded to include a comparative analysis between different regions and fleets, with the aim of identifying global patterns and promoting the adoption of best practices at an international level.


 ,
, 


