Article

Determination of Submerged Breakwater Efficiency Using Computational Fluid Dynamics

Faculty of Mechanical Engineering and Naval Architecture, University of Zagreb, Ivana Lučića 5, 1000 Zagreb, Croatia
*
Author to whom correspondence should be addressed.
Oceans 2024, 5(4), 742-757; https://doi.org/10.3390/oceans5040042
Submission received: 9 July 2024 / Revised: 10 August 2024 / Accepted: 24 September 2024 / Published: 1 October 2024
(This article belongs to the Special Issue Feature Papers of Oceans 2024)

Abstract

:
Wind-induced waves can lead to the partial or complete wash-over of beaches, causing erosion that impacts both the landscape and tourist infrastructure. In some regions of the world, e.g., Croatia, this process, which usually occurs during a harsh winter, has a major impact on the environment and the economy, and preventing or reducing this process is highly desirable. One of the simplest methods to reduce or prevent beach erosion is the use of innovative underwater structures designed to decrease wave energy by reducing wave height. In this study, submerged breakwaters are numerically investigated using various topologies, positions, and angles relative to the free surface. Not only is the optimal topology determined, but the most efficient arrangement of multiple breakwaters is also determined. The advantage of newly developed submerged breakwaters over traditional ones (rock-fixed piers) is that they do not require complex construction, massive foundations, or high investment costs. Instead, they comprise simple floating bodies connected to the seabed by mooring lines. This design makes them not only cheap, adaptable, and easy to install but also environmentally friendly, as they have little impact on the seabed and the environment. To evaluate wave damping effectiveness, the incompressible computational fluid dynamics (ICFD) method is used, which enables the use of a turbulence model and the possibility of accurate wave modelling.

1. Introduction

Beach erosion is a natural process that can lead to significant land loss, often exacerbated by high tides and strong wave action. To mitigate the effects of wave-induced erosion, structures known as breakwaters are employed in both deep and shallow waters. The function of these structures is to dissipate the kinetic energy of waves and reduce their amplitude, thereby preserving the natural beach slope [1]. Traditional breakwaters, often referred to as wave breakers, face numerous challenges, including complex construction, high costs, and significant environmental impact. They are also rigid in design, making them unsuitable for varying environmental conditions and seabed types. In contrast, non-traditional floating breakwaters consist of buoyant bodies [2] tethered by mooring systems. These floating structures offer numerous benefits: they are adaptable to both deep and shallow water environments, exert minimal impact on sediment and local ecosystems, and their costs are less dependent on water depth and foundational structures. The physical foundation of breakwater is based on wave-breaking theory [3] which states that as a wave propagates through a barrier, it is dissipated, transmitted, and reflected.
Experimental research conducted by Matsunaga et al. [4] has shown that floating breakwaters effectively manage larger waves exceeding 1.2 m in height. Further studies, such as that by Pena et al. [5], have included mooring systems in their analyses, further confirming the effectiveness of these systems. Another experimental study of double-row floating breakwaters under regular wave action conducted by Ji et al. [6] showed that including an additional second row of breakwaters significantly reduced the transmission coefficient, which is attributed to dissipation caused by eddies and the moon pool effect. An analytical approach by Kim et al. [7], which incorporated small wave amplitude theory to solve wave damping in the porous seabed, concluded that the seabed should be included as a boundary condition to obtain accurate results. A more recent study conducted by Chalmoukis et al. [8] applied numerical modelling for porous seabeds to analyse the influence of vegetation on coastal waves. A more detailed analysis of the wave breaking of a rubble-mound model was presented by Setiyawan [9] where analysis showed that the slope of the breakwater is the most important parameter. Numerical modelling has become a preferred method for studying breakwaters due to its cost-effectiveness and ability to optimise design parameters. In early studies, two-dimensional (2D) linear analysis using techniques such as the high-order boundary method [10] and the Green method [11] was often used to solve these problems. A similar study by Cheng et al. [12] compared experimental tests with 2D numerical simulations using the Smoothed Particle Hydrodynamics (SPH) method. The study found that the absence of turbulence modelling and limited degrees of freedom in mooring force calculations led to discrepancies between experimental and numerical results, though the numerical model still provided reliable outcomes. However, recent research by Fitriadhy et al. [13] and He et al. [14] suggested that three-dimensional (3D) analysis is essential for accurately modelling the complex interactions between submerged breakwaters and the wave dynamics of complex design parameters, indicating that 3D analysis should be used.
For modelling floating breakwater systems and their interaction with waves, the SPH method is becoming increasingly popular. For instance, Guo et al. [15] conducted a study focusing on tautly moored floating breakwaters to give insight into the engineering design of the mooring systems of floating breakwaters. They concluded that taut mooring systems exhibit superior performance compared to those with ropes and slack chains, in both low- and high-tide conditions. Another study by He et al. [16] introduced a novel multi-float breakwater structure. They employed the SPH method to examine wave interactions, solving the structure’s motion using Newton’s second law for rigid bodies. Their results were validated through laboratory experiments. As accurate wave modelling is a crucial parameter in assessing accurate breakwater efficiency, an accurate wave generation method should be applied. Regular waves are the most straightforward approach to applying wave conditions, and Stokes’ second-order theory is capable of accurately predicting their behaviour and energy, as shown in Lloyd et al. [17]. An extensive study on adequate mesh for wave modelling conducted by Huang et al. [18] showed that the results converge if at least 15 cells per wave height and 100 cells per wavelength are applied. As waves propagate through breakwaters, turbulence is expected at the submerged breakwater boundary layer due to its geometry. Ge et al. [19] concluded that RANS turbulence models produce accurate results in wave problems.
This study focuses on the numerical modelling of submerged breakwaters using ICFD via LS-DYNA R11.1. solver [20]. The ICFD solver, based on finite element formulation developed by LS-DYNA, handles wave–structure interactions. It incorporates Stokes’ wave theory and turbulence models, unlike the Arbitrary Lagrangian–Eulerian (ALE) method, which lacks these features. The objective of this research is to identify the optimal breakwater system that maximises wave height reduction while minimising the number of breakwater elements required. A two-stage analysis is carried out for this purpose: first assessing the most efficient topology out of three possible solutions and later finding the best arrangement of the chosen solution. The structure of this article is as follows:
  • Section 2.1 presents a detailed explanation of the ICFD method used for breakwater analysis, including a description of the theoretical background and its advantages over another method for solving fluid–structure interaction (FSI) problems, namely the ALE method.
  • Three possible topologies of breakwater systems with geometrical particulars are presented in Section 2.2.
  • Section 3 details the numerical setup for assessing the most efficient topology, including comprehensive information about the mesh and boundary conditions of the breakwater system.
  • Section 4 presents the results of both analyses, emphasising wave height reduction and drag estimation.
  • The conclusion in Section 5 focuses on the findings obtained and points out the potential issues and/or limitations of the applied methods.
This study marks the first phase in the development of a system to protect beaches from erosion. The aim is to determine the optimal topology and angle from all the solutions proposed by third parties, thus reducing costly and time-consuming experimental tests. Given the high computational cost of each breakwater analysis, the design matrix was kept concise. Initially, the solutions were evaluated taking into account numerous constraints such as the manufacturing capabilities and dimensions of the towing tank, and finally, three optimal solutions were selected.
Future testing will be conducted in the towing tank shown in Figure 1, which imposes additional constraints on the system layout. The primary constraint is the distance variation between rows; in the current setup, this would place submerged breakwaters too close to the tank sides, causing wave reflection. A larger scale than the chosen 1:20 would reduce breakwater dimensions and allow for varying row distances (Figure 1b, X dimension). However, this would result in wave amplitudes smaller than 7.5 cm, making it impractical for both numerical modelling and real wave generation in the towing tank.

2. Material and Methods

2.1. ICFD

ICFD uses the Navier–Stokes equations and the continuity equation for numerical analysis. For incompressible flow, the Mach number should be less than 0.3, i.e.,
M = V a 0.3 ,
where V is the flow velocity relative to a fixed object, and a is the speed of sound in the medium. The conservation of mass and momentum for incompressible fluids in the Eulerian conventional form is represented by the Navier–Stokes equations combined with the continuity equations:
ρ u i t + u j u i x j = σ i , j x j + ρ f i
where ρ represents density, u i t represents local acceleration, u j u i x j is convective acceleration, σ i , j x j is the divergence of the stress tensor, and ρ f i represents external forces. While the more common Finite Volume Method is used to approximate discrete fields for fluid dynamics, spatial discretisation is conducted here by the Finite Element Method. The final set of equations that are solved by the ICFD solver is written in compact matrix form:
ρ M + Δ t K μ u i * + S ρ u i n + 1 u i * = ρ M u i n ϒ Δ t G p n + Δ t F
Δ t L 1 ρ p n + 1 = D u i * + ϒ Δ t L 1 ρ p n U ~ ˙
ρ M u i n + 1 = ρ M u i * Δ t G ( p n + 1 ϒ p n )
where ρ M represents the mass term, Δt is the time step, K(μ) is the stiffness matrix, S( ρ uin+1) is a convective term for non-linear advection, ϒ is the time integration parameter, G is the gradient operator matrix, F is the external force vector, D is the divergence operator matrix, U ~ ˙ is the source term vector, and ui and pn represent velocity and pressure.
To solve Equations (3)–(5), LS-DYNA employs a predictor–corrector scheme. In this process, intermediate variables ui* and p(n+1) are computed from Equations (4) and (5), respectively, and then reintroduced into the iterative loop to determine the next step velocity ui(n+1). This approach enhances the accuracy of the final pressure and velocity values, although it is more time-consuming. LS-DYNA employs the Finite Element (FE) Method for spatial discretisation, adopting strategies similar to those in the ALE method but with a few notable differences. In particular, the element type used in the ICFD cases is tetrahedral, while the ALE method typically uses hexahedral elements. While the solver of the ALE method is designed for compressible fluids and uses an explicit time integration method, the ICFD solver is an implicit solver optimised for incompressible fluids and is able to perform double-precision calculations required for turbulence modelling and boundary layer definition. In addition to the previously mentioned advantages of ICFD over ALE for wave damping problems, the ICFD solver incorporates wave theory [21], offering options for Stokes’ 1st-, 2nd-, and 3rd-order theories. The choice of Stokes’ theory over linear theory is based on the ratio of wave height to wavelength. For 2nd-order Stokes’ theory, this ratio lies in the range 0.04 < H/L < 0.141 [22], which corresponds with the measured average wave height and length [23,24], making it the appropriate choice.
Finally, the ICFD approach benefits from advanced turbulence modelling capabilities, whereas ALE does not have implemented turbulence models. A comparative study conducted by Perin et al. [25] demonstrated that the ICFD solver is particularly effective in scenarios where turbulence is a significant factor, providing results that align closely with experimental data.

2.2. Breakwater Geometry

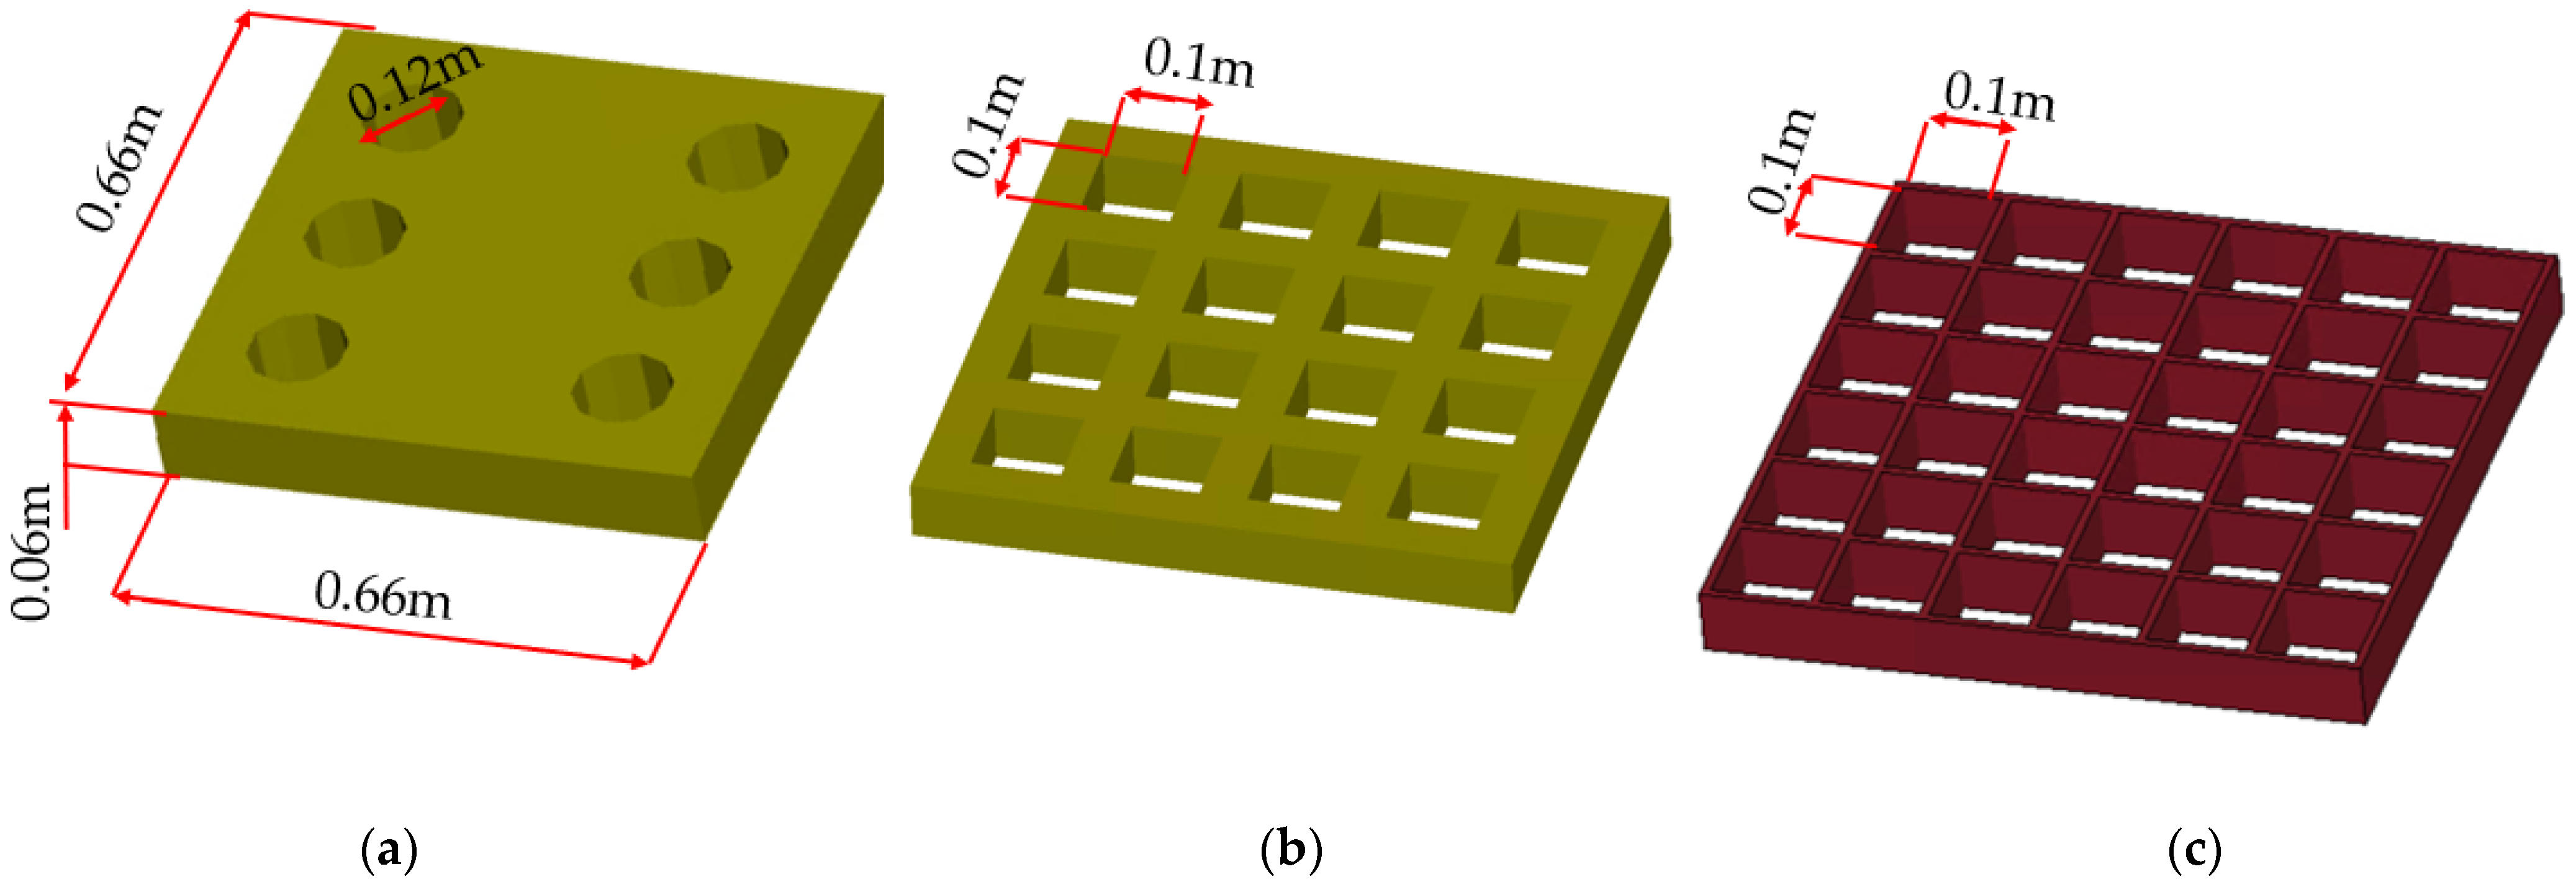
The breakwater system is costly due to several complex aspects. These include the anchoring system, proper placement on the seabed without interfering with sea lanes, and challenges such as the corrosion and fouling of the system. These factors make the system expensive to manufacture, install, and test. In the choice of geometry, there exists an infinite number of topologies, while in manufacturing, several other factors such as manufacturing capacities as well as towing tank dimensions and the numerical cost of the analysis, mentioned in the introductory section are limitations. Therefore, three different topologies were selected for the development of the beach erosion system based on their porosity percentage, as shown in Figure 2, and the most efficient solution was determined from these options. All three geometries have identical external dimensions, 0.66 × 0.66 × 0.06 m, with only the internal hole size and numbers varying. For the geometry with cylindrical holes, six holes with a diameter of 0.12 m each and a porosity of 15% were chosen (Figure 2a). In contrast, the other geometries (Figure 2b,c) have square openings of 0.1 × 0.1 m with porosities of 36 and 70%.
The breakwaters are manufactured at a 1:20 scale of their actual dimensions in preparation for future testing in the towing tank at the University of Zagreb, Faculty of Mechanical Engineering and Naval Architecture. Given that the towing tank has a length of 32.8 m, a width of 3.6 m, and a depth of 1.8 m, this scale ratio allows for multiple breakwater elements to be positioned across the tank’s width while facilitating easy installation and fixation.

3. Numerical Setup

3.1. Mesh Particulars

This beach anti-erosion system was developed for water deeper than 10 m, further away from beaches, and thus, only deep-water conditions were examined. While the literature, according to Conell and Cashman [26], suggests a minimum of 20 elements per wave height, the LS-DYNA solver did not converge with this number. Therefore, a minimum of 40 elements per height, or 20 elements per amplitude, was applied. For the wavelength, 200 elements were used. Because ICFD uses an implicit solver, a sufficiently small time step must be provided to ensure that the Courant–Friedrichs–Lewy condition is met, with the chosen time step of 0.1 s resulting in a condition number around 0.1. Turbulence was modelled while using the Large Eddy Simulation (LES) sub-grid model where the sub-grid scale represents the effect of small-scale motion. The Smagorinsky constant was set to 0.13 [27], and the boundary layer thickness was determined at 0.01 m with the first cell height being equal to 0.007 m. The LES model showed a good correlation with the experimental test conducted by Calero et al. [28] in a wave flume under different wave generation scenarios. Because the numerical domain was shortened in the X direction compared to the actual length of the tank, the beach structure did not exist in the model as it did in the towing tank, and waves in this case would not be damped but reflected off the wall. To prevent this, the damping layer was introduced at the last metre of the domain to stop any wave reflections from the wall. For the meshing procedure, surface elements were created which were later automatically extruded by LS-DYNA into 3D tetrahedral elements.

3.2. Numerical Setup for Assessing Most Efficient Topology

The initial studied case consists of a smaller domain that efficiently reduces the simulation time. A fluid domain, as shown in Figure 3a, consists of 207 k surface elements, with 15 elements per wave amplitude, used for an appropriate wave definition (Figure 3b). The waves are defined using Stokes’ 2nd-order wave definition with an amplitude of 0.075 m and a length of 1.5 m for each of the three different topologies. The wave boundary condition is applied at the inlet, and a prescribed pressure boundary condition is used at the outlet. This condition is essentially the same as a pressure outlet, which imposes a hydrostatic fluid pressure that ensures ambient environment conditions and results in a better convergence rate as it prevents backflow occurrence. The submerged breakwaters are modelled both as a surface model (ICFD boundary part) and as a solid (structural part), and their anchoring system consists of a wired chain system that is self-stiffening and allows for just enough movement to reduce the hydromechanical forces while keeping the submerged breakwater system practically in the same position. For this reason, anchoring is neglected, and all six degrees of freedom of the submerged breakwater movement are fixed in space. The influence of the submerged breakwaters is evaluated at four different positions, ranging from 20 to 5 cm from the free surface, Figure 3b, as below 20 cm, it is assumed that the submerged breakwater system has no significant influence.

3.3. Convergence Analysis

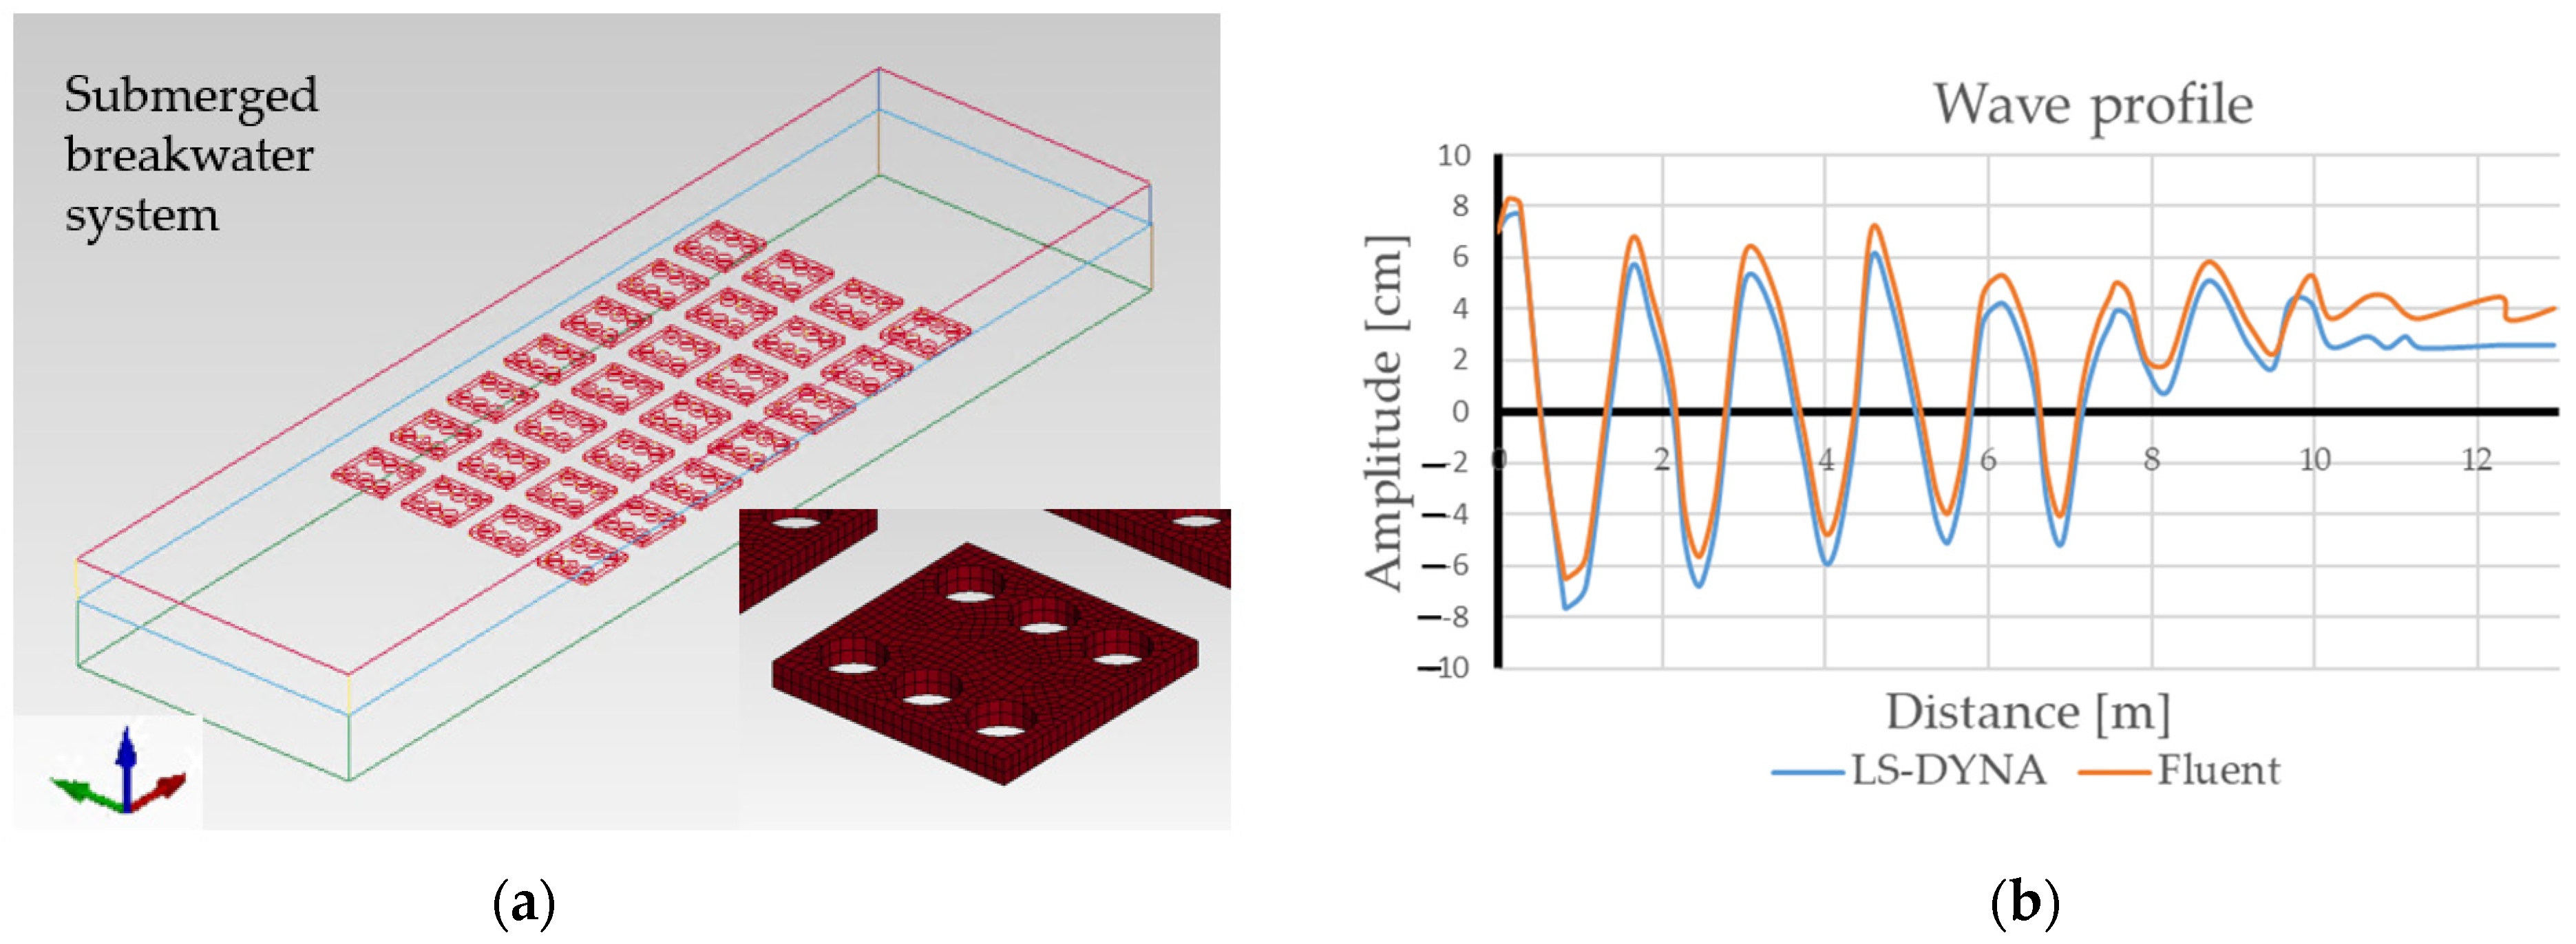
A convergence study was conducted to assess the accuracy of the ICFD method. In previous research [29], a similar wave damping study was performed by comparing the influence of cylindrical topology on the wave profile, Figure 4a, using the LS-DYNA ICFD method with the Ansys Fluent results which are presented in Figure 4b.
For convergence, a Quadratic 16-hole geometry was tested on four different meshes, 10, 13, 15, and 18 elements per wave amplitude, Figure 5a, and comparing the calculated total drag force between them, Figure 5b, while using the same boundary conditions as in Figure 4. The drag force was calculated using the database output option *ICFD_DATABASE_DRAG, and LS-DYNA calculates the drag using the following two equations:
F P = P d A
where FP is the drag force due to pressure, with P being pressure and dA being the differential area:
F v = μ u y d A
where Fv is the viscous component of drag force, μ is viscosity, and u y is the shear velocity at the wall. The convergence diagram showed that results with less than 15 elements per amplitude diverge significantly from the results obtained with 15 or more elements as wave generation is irregular, Figure 5b.

3.4. Numerical Setup for Submerged Breakwater System

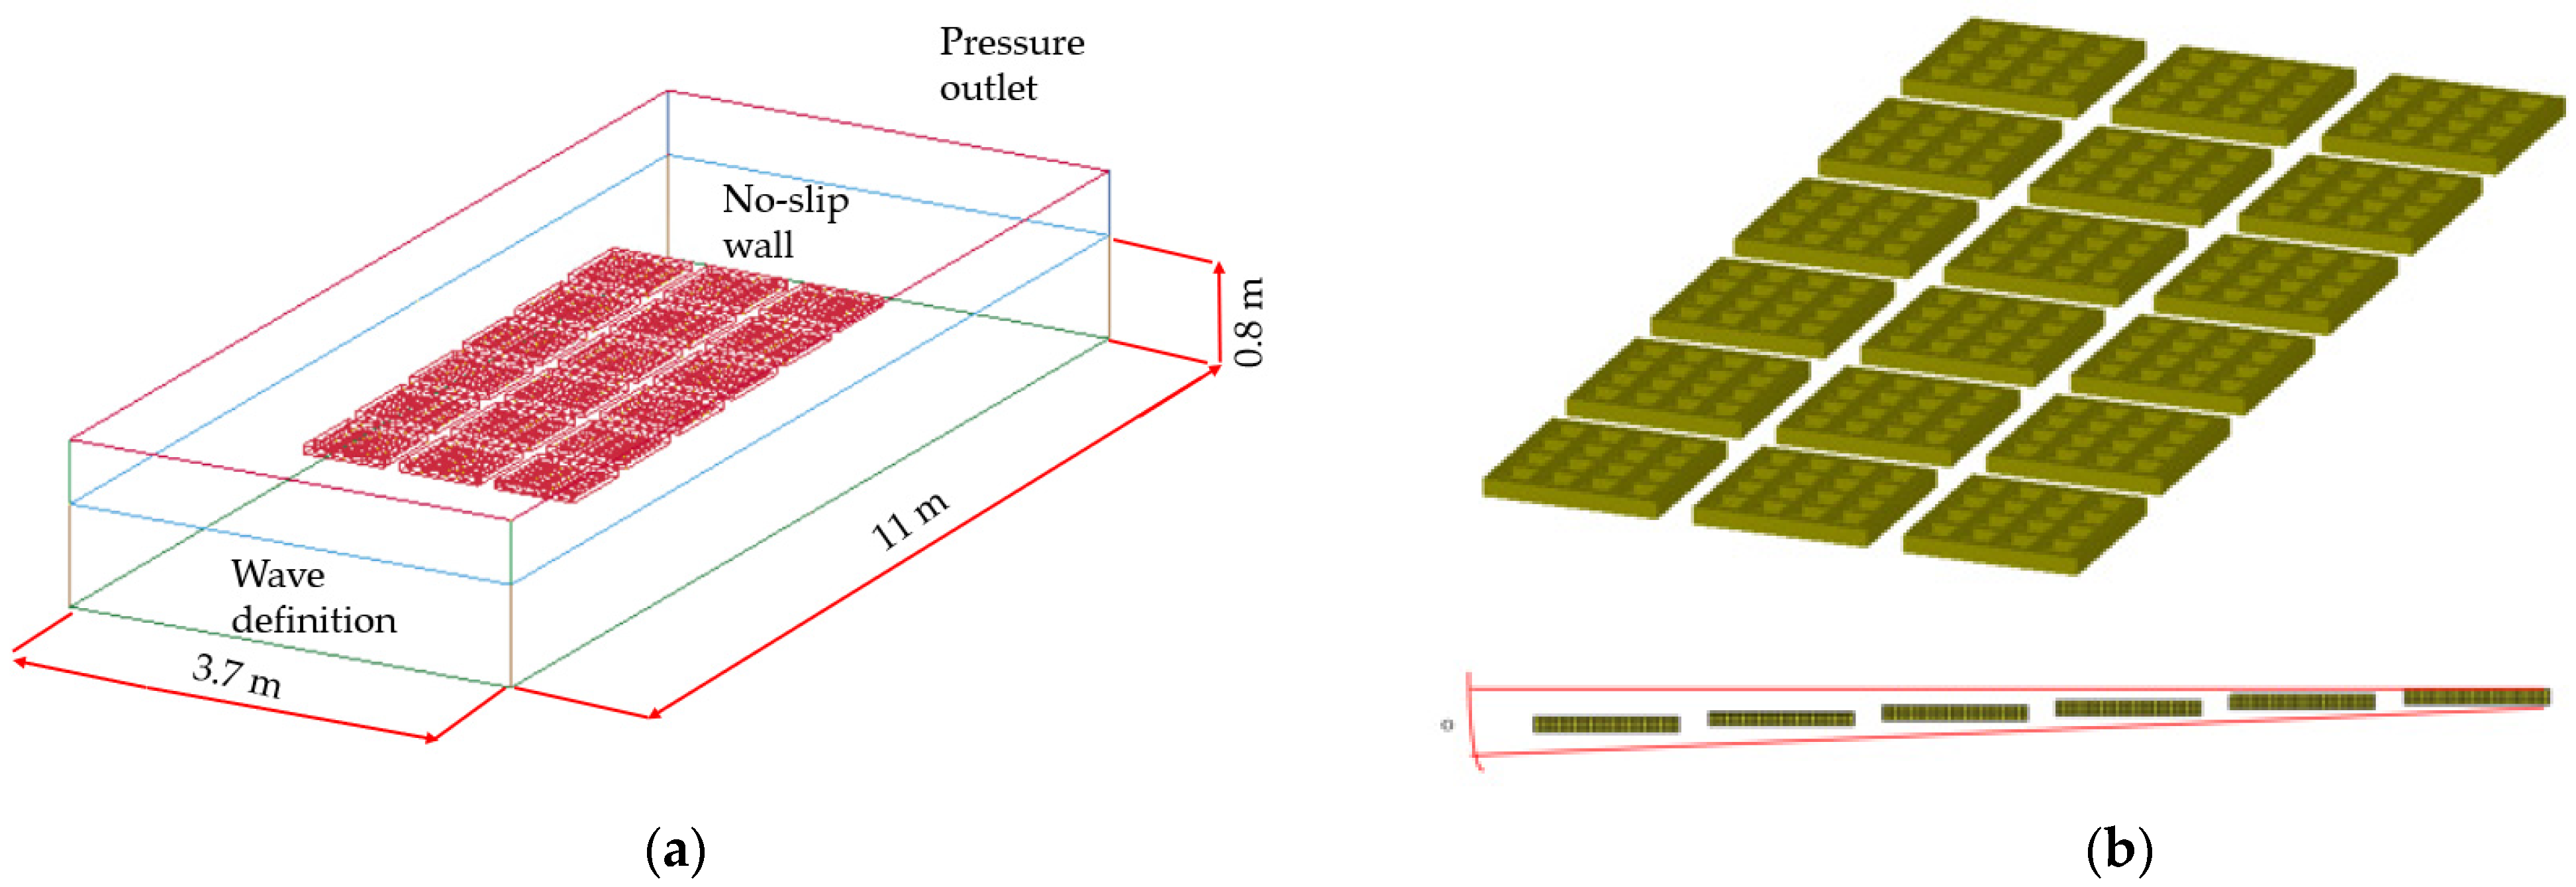
Once the most efficient topology of the submerged breakwaters is determined, a submerged breakwater system is created by varying the angle and position of each breakwater element relative to its free surface. The objective of this system is to attenuate different wave heights and lengths, maximising efficiency under expected environmental conditions. Figure 6a shows the numerical setup for the system analysis. The boundary conditions are the same as for the evaluation of the topology. At the inlet, the wave is defined as a 2nd-order Stokes wave, while the pressure is defined at the outlet. Figure 6b illustrates the submerged breakwater system, consisting of several breakwater elements arranged in three rows, with six elements in a line (as shown in Figure 6b). The angle ° between individual elements is varied. Three rows are chosen due to the towing tank’s limited width, consistent with future experiments.
To determine the most efficient and cost-effective submerged breakwater system, four different angle variations are tested. These variations provide insight into the optimal number of breakwater elements and the threshold depth below which the breakwater becomes ineffective. The angle is defined by the height difference between the elements in a row, resulting in a different number of elements in the system, as shown in Figure 7. Angle variations could reduce costs and save space once determined, as steeper angles require fewer elements in a submerged breakwater system to achieve the same wave damping. Consequently, the system becomes more efficient and economical, requiring fewer materials and less installation effort.

4. Results

As outlined in the article structure, two analyses are shown separately. First, an assessment of the most efficient topology consisting of a single submerged breakwater element is shown, and later, a complete submerged breakwater system analysis is presented. Since these simulations are intended to serve as the basis for future towing tank experiments, the wave amplitudes are shown on a centimetre scale. To determine the most efficient breakwater topology, four different wave steepness ratios (wave height/wavelength) and δ are chosen, 1/10, 1/15, 1/20, and /1/33, while simulating 12 s of real time for each analysis. Analysis particulars for each topology are shown in Table 1 for several wave steepness ratios δ and wave periods T. Each topology is analysed on the aforementioned four different wave periods and additionally four different positions for the common wave in the Adriatic Sea [24], δ = 1/20, T = 5 s, meaning that there are 24 simulation runs in total.
At the submerged breakwater system level, three different wave amplitudes with an additional three wave steepness ratios are presented, which were generated using three different meshes. A summary of the breakwater system with information about the mesh for both the ICFD fluid domain and the number of solid elements for the breakwater system topology and simulation time can be found in Table 2. Each simulation was run on 32 cores of an Intel Xeon Gold 6248 CPU using the LS-DYNA mpp_d_13_0 solver, with 15 s of wave dampening simulated. The table reveals a significant discrepancy in simulation time between the 7.5 cm amplitude wave and the other two amplitudes, 10 cm and 12.5 cm. The reason why these amplitudes are chosen lies not only in the measured average wave height in the Mediterranean basin [23] but also in wave modelling and the aspect ratio, which is especially challenging for the smallest 7.5 cm amplitude. The ICFD solver is sensitive to poor surface element quality, where elements with an aspect ratio greater than 3 can cause numerical divergence. Thus, a fine wave mesh and a small time step were required for accurate wave modelling. In this study, 15 elements per wave amplitude converged to an accurate shape, but this meant that small elements were used in the other two directions to respect the aspect ratio which resulted in almost double the mesh size compared to the other two amplitudes which finally resulted in an 8× bigger 3D mesh size once the solver extruded initial surface elements to tetrahedral elements. To reduce computational time, three additional wave steepness ratios were tested with the 12.5 cm amplitude.

4.1. Breakwater Efficiency

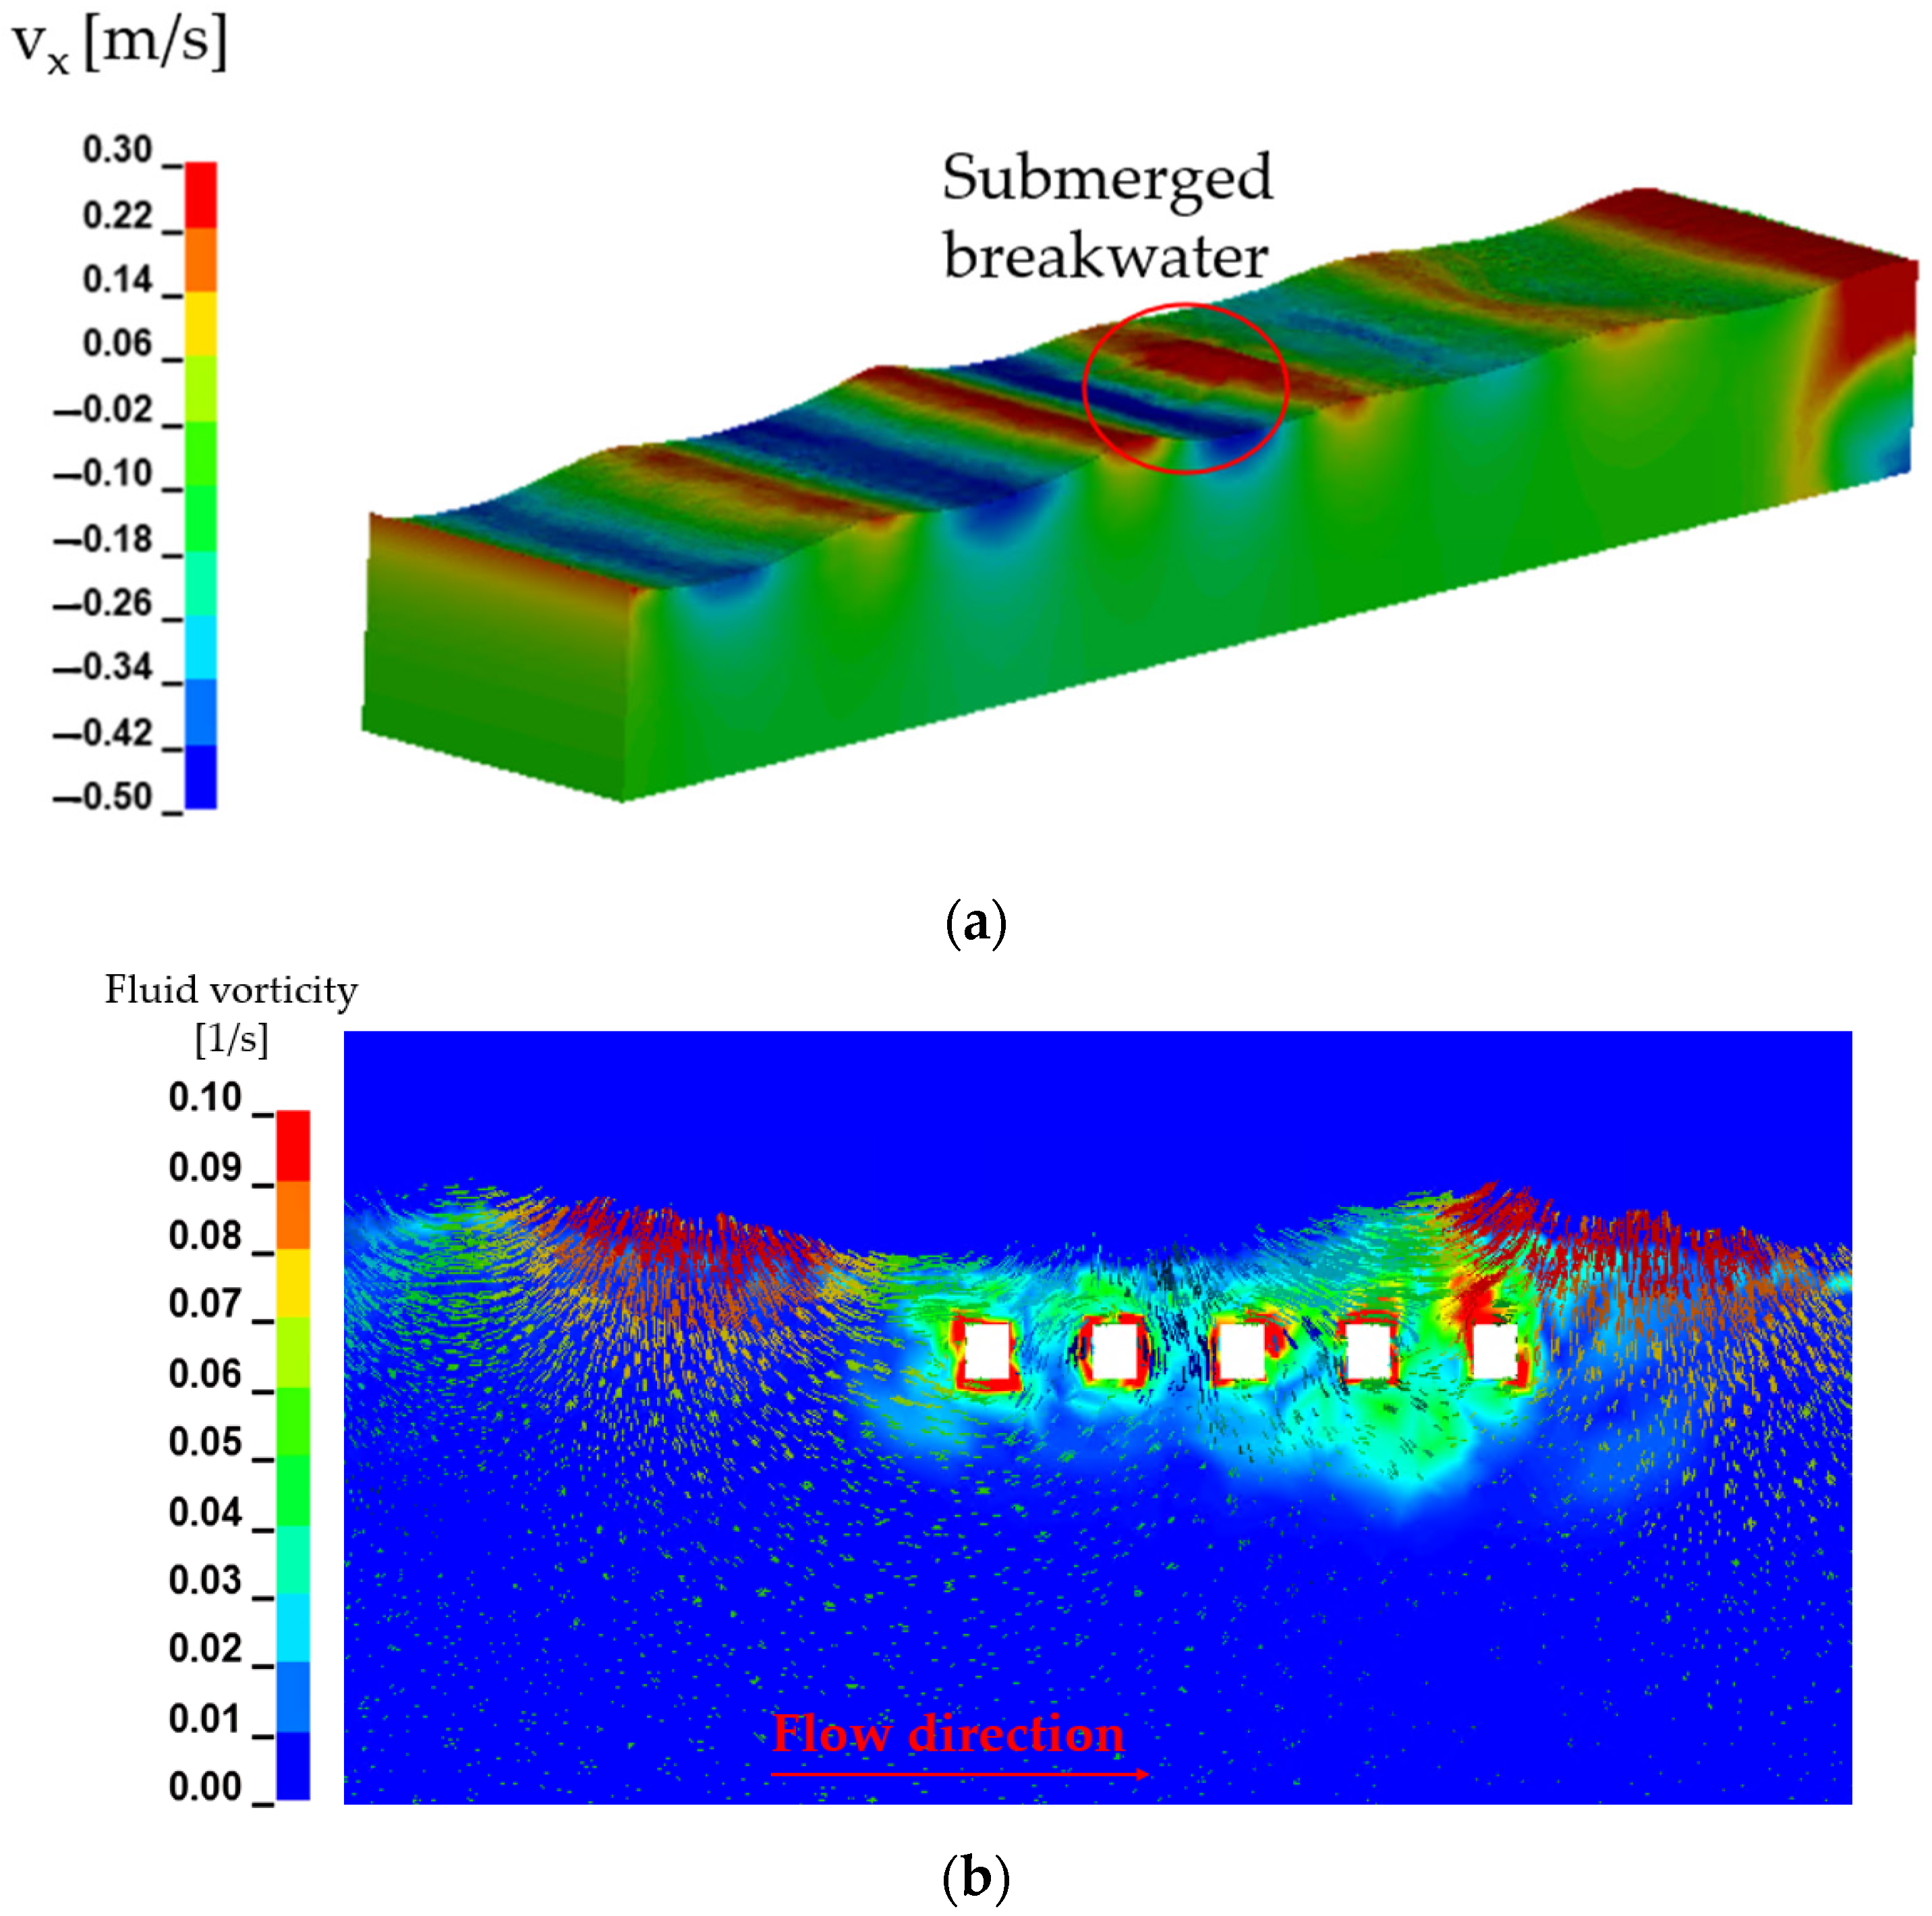
The generated waves and the streamlines around the breakwater are shown in Figure 8. The effect of wave damping can be seen even when a single breakwater is used (Figure 8a). Regular waves are generated before they reach the breakwater, and after passing through it, both the amplitude and wavelength of the wave are altered. This alteration occurs due to the deformation of the wave segment that passes directly over the system, resulting from vorticity and friction between the wave and each element of the system. The physical effect of the submerged breakwater is depicted in Figure 8b, where a section of the domain is examined. Vorticity is generated around each hole, and the fluid velocity streamlines indicate that the vertical component of the velocity is significant, meaning that the breakwater redirects water in the vertical direction (Z-axis) rather than in the wave direction (X-axis).
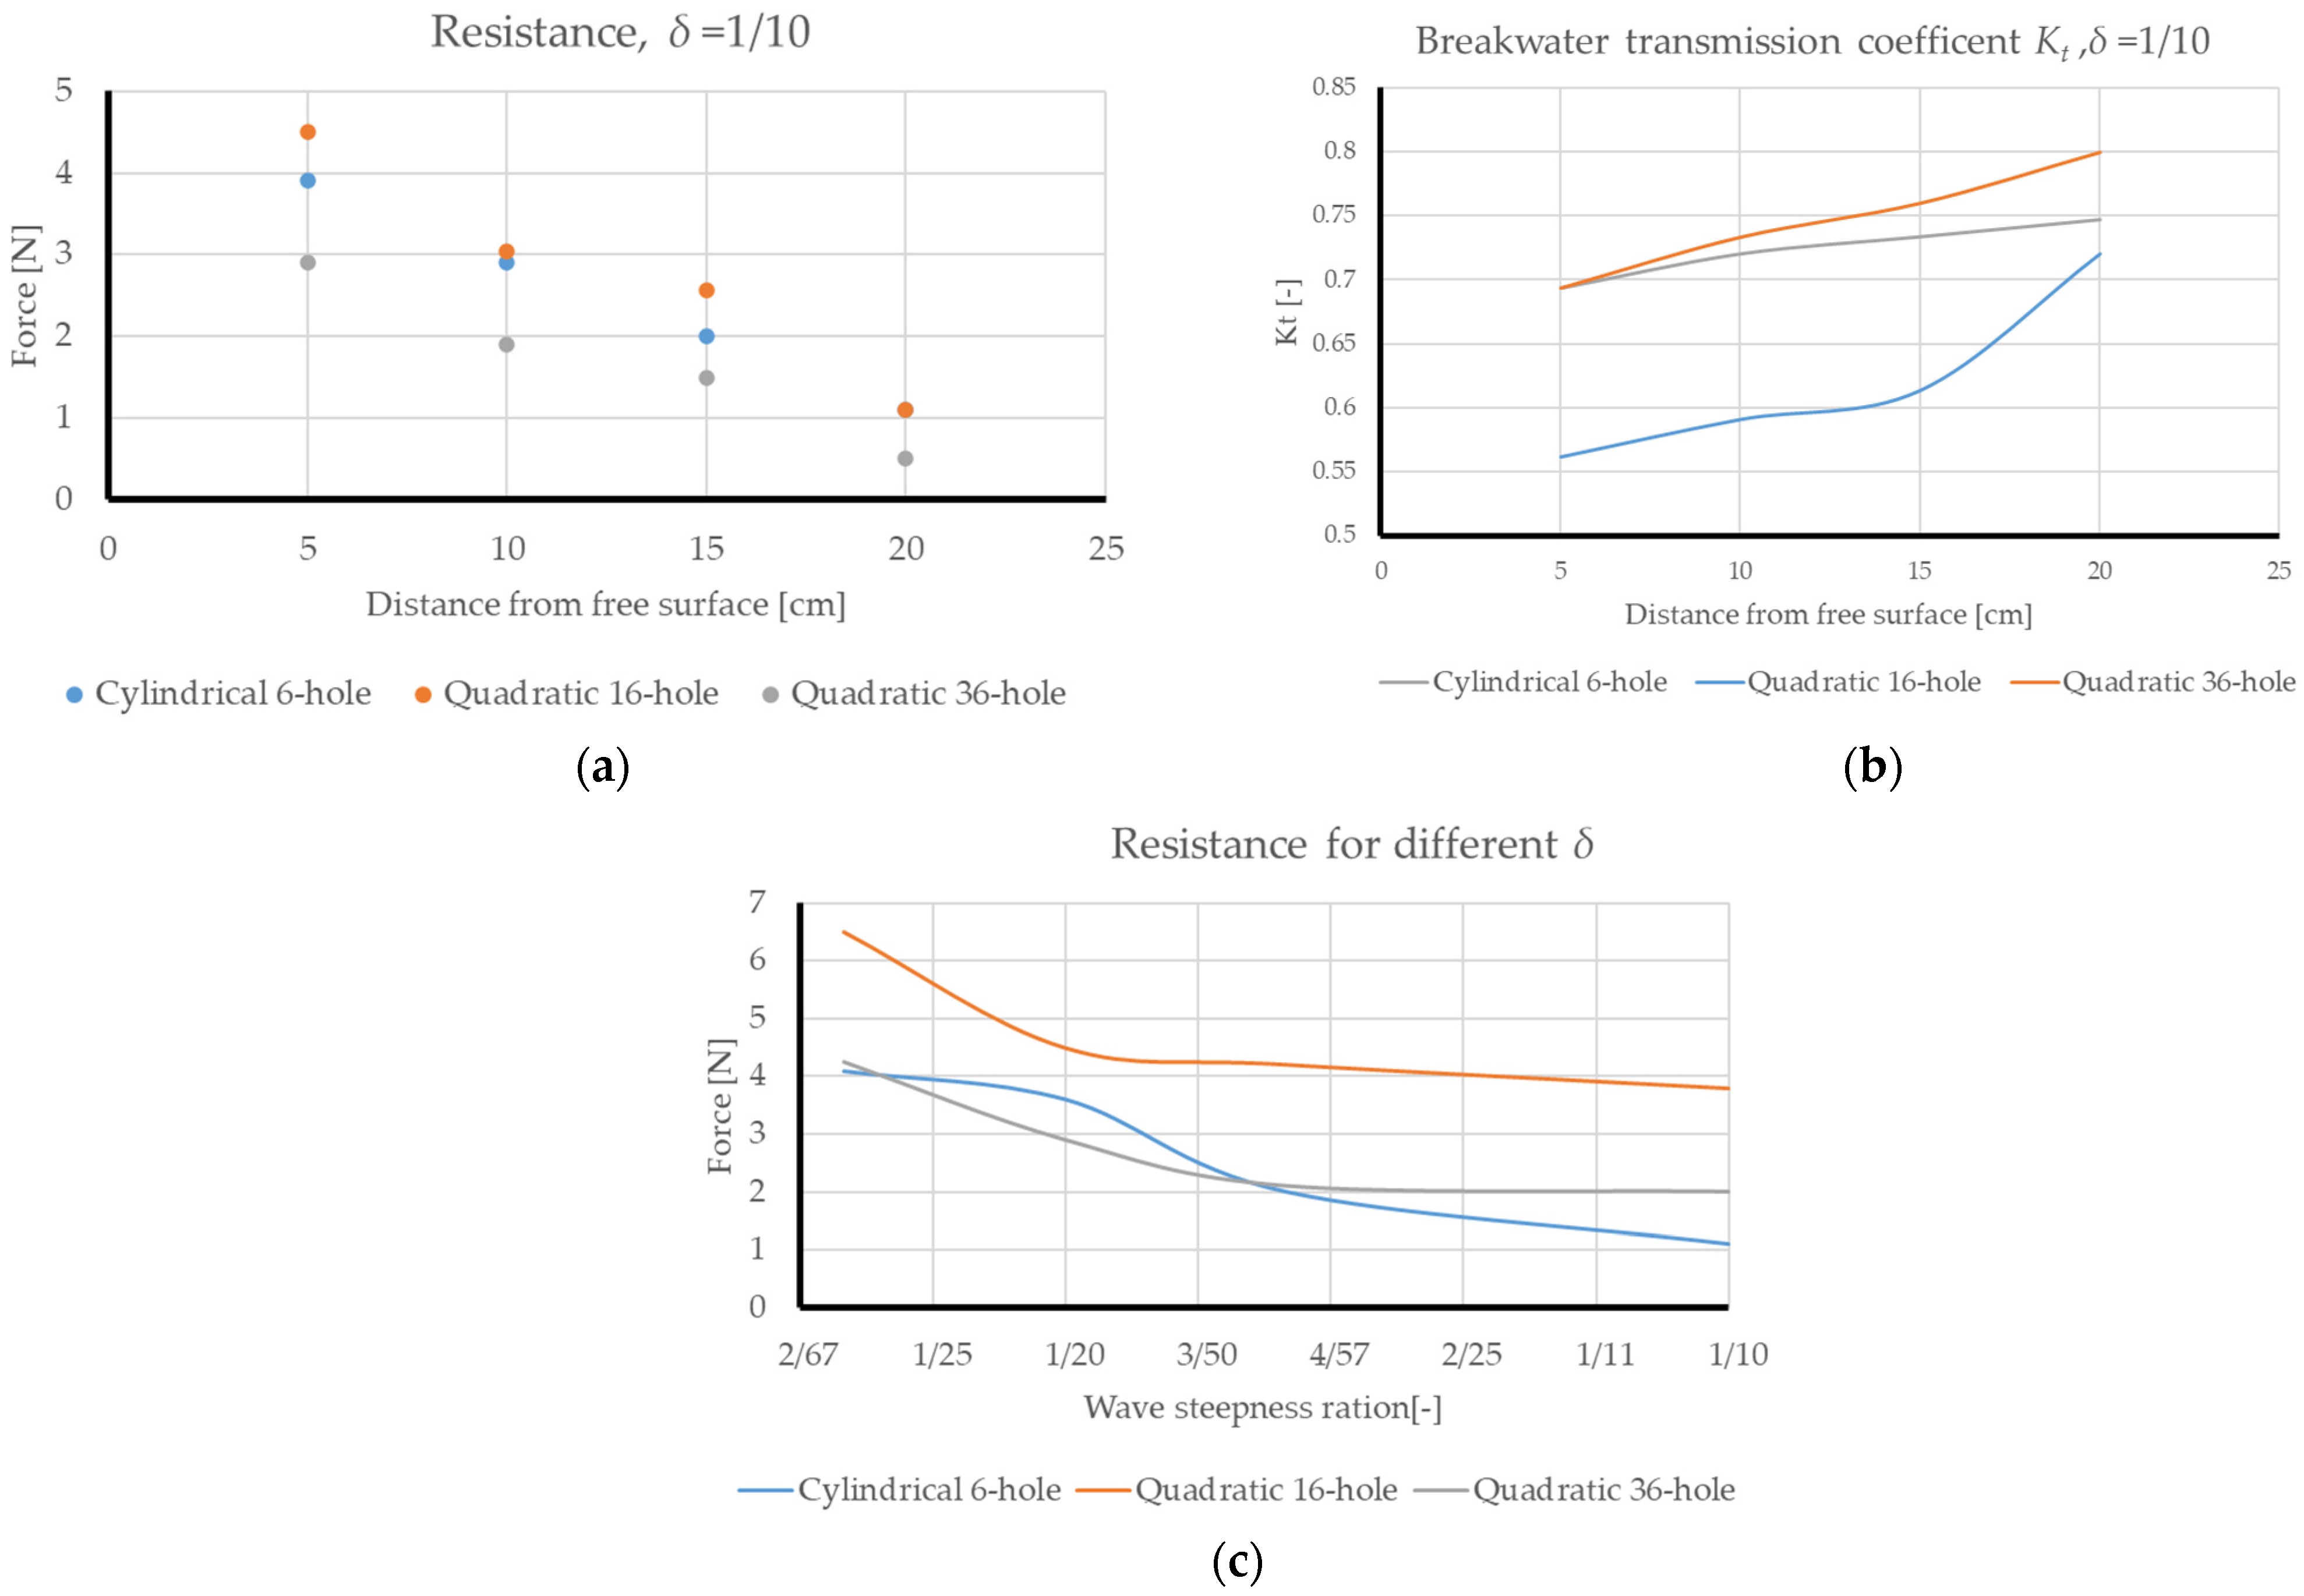
When evaluating the performance of breakwaters, two crucial factors—the drag force and the curve of the wave profile—are of paramount importance. The drag force measures the resistance that a breakwater offers to incoming waves, which has a direct impact on its stability and effectiveness. The wave profile curve provides information on how the breakwater changes the energy and shape of the waves travelling through or around it. By comparing these parameters of different designs, researchers can determine which configurations reduce wave energy the most efficiently. This comparative analysis is essential for the development of submerged breakwater systems that optimally protect coastal areas from erosion, Figure 9. The highest drag force, Figure 9a, and the lowest wave transmission coefficients, Figure 9b, were obtained with the Quadratic 16-hole topology. The cylindrical topology also showed a flattening of the waves, but it was less efficient, while the Quadratic 36-hole topology proved to be too porous. A comparison of drag force for each topology over the different steepness ratios is presented in Figure 9c. It can be seen that the Quadratic 16-hole topology results in the biggest drag for different wave steepness ratios with especially superior performance for steep waves, δ = 1/33.
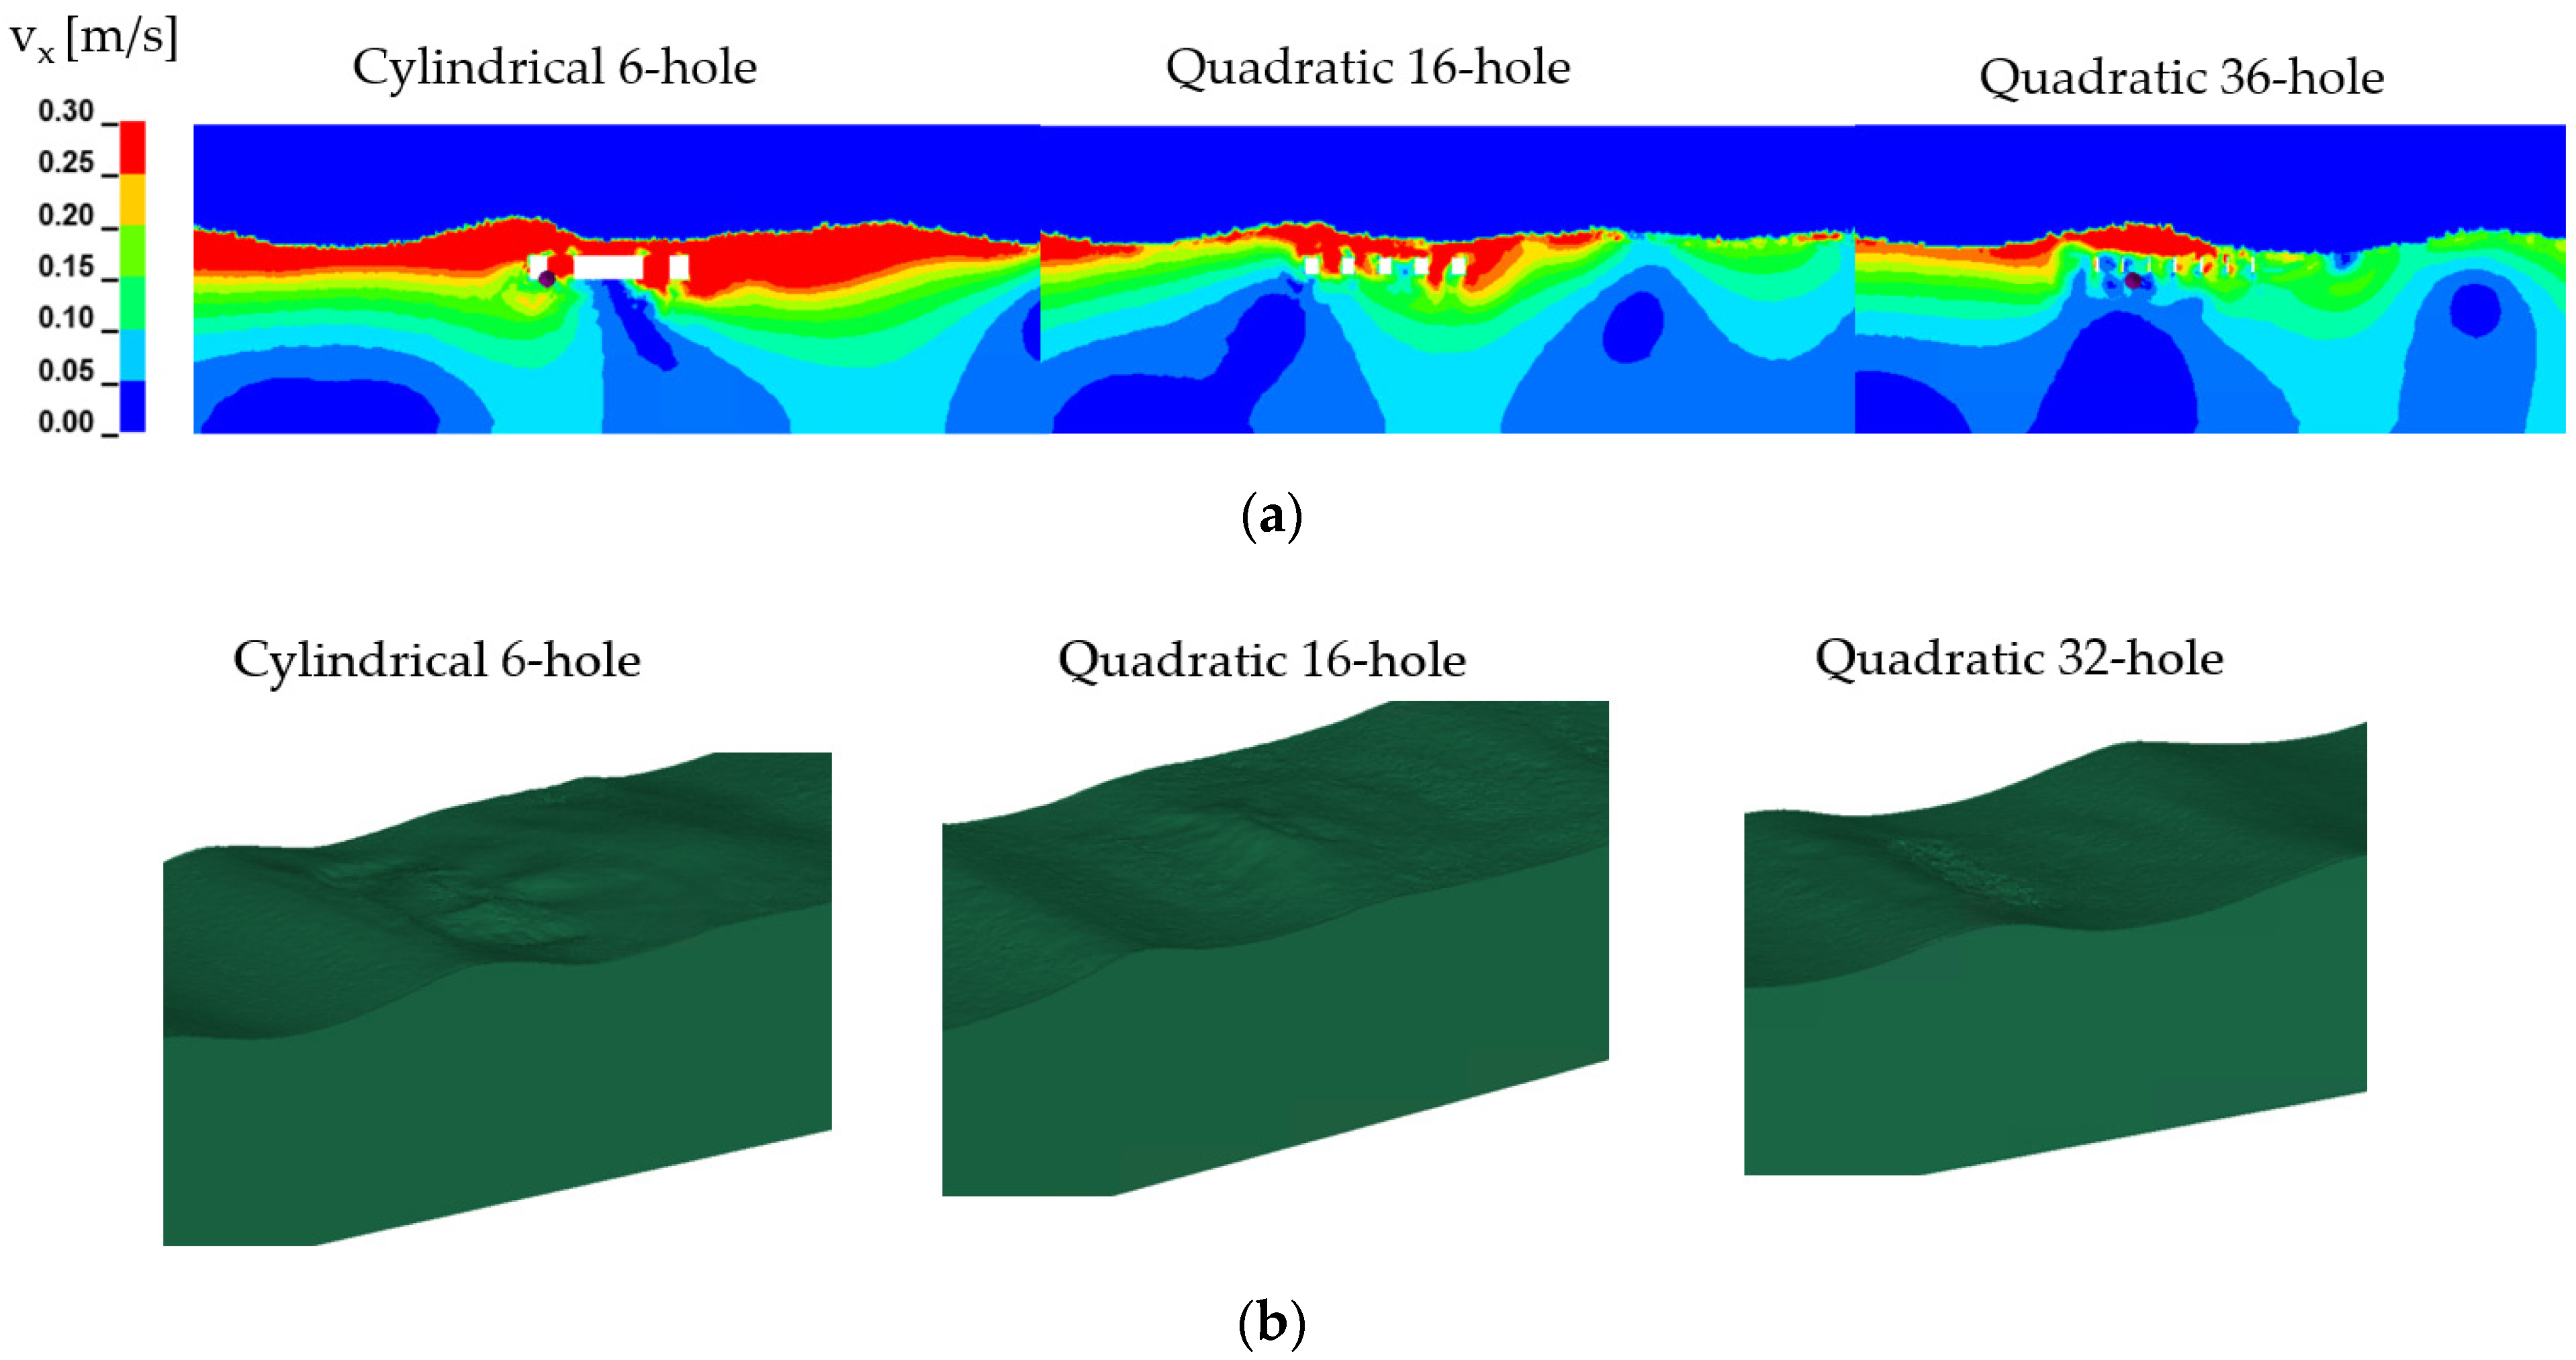
A visualisation of wave flattening for each breakwater topology can be seen in Figure 10. The wave velocity, shown in Figure 10a, does not significantly decrease in the cylindrical six-hole topology, and the amplitude remains almost unchanged as the waves pass through the breakwater system. Similarly, the amplitude of the waves in the Quadratic 36-hole topology also stays nearly the same. The effect of wave flattening is the most evident in Figure 10b, which shows a part of the domain just before the submerged breakwater, with a regular wave approaching. In the case of the Quadratic 36-hole topology, the wave remains almost identical after passing through the breakwater due to its high porosity. In contrast, the other two topologies exhibit noticeable deformation in the wave shape.

4.2. Submerged Breakwater System Analysis

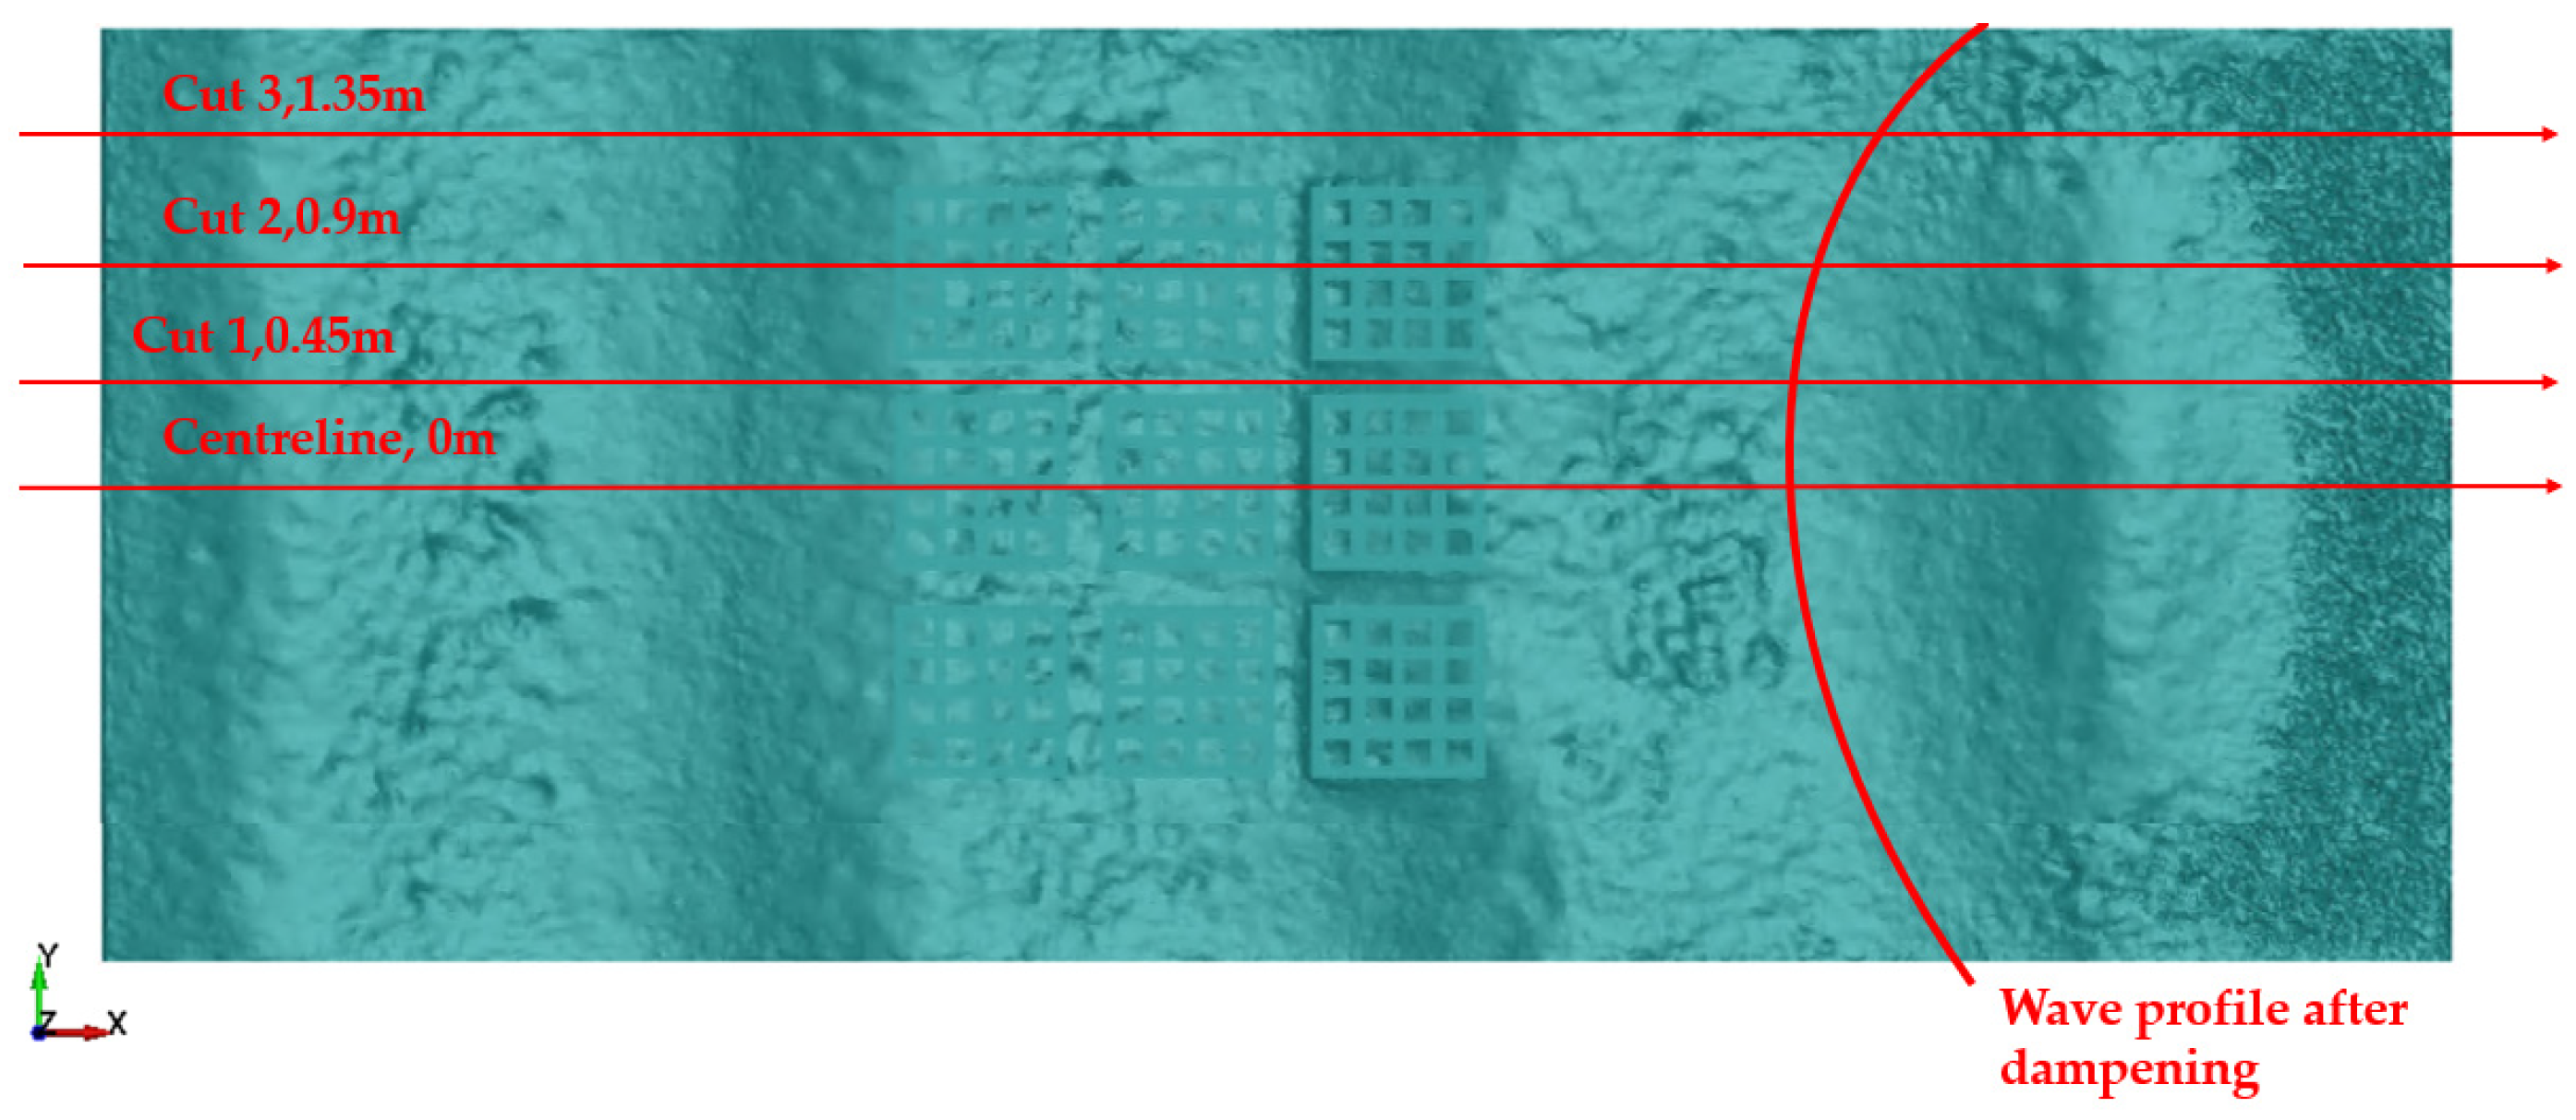
The Quadratic 16-hole topology proved to be the most efficient in terms of drag resistance, so it was chosen for the submerged breakwater system. As a wave passes the submerged breakwater system, it is slowed down and deformed not only in amplitude and length, but it is also bent, as shown in Figure 11, marked red.
Due to the irregular shape of the wave in the XY plane, wave amplitude will be measured at four different points: along the centreline, where the wave directly interacts with the submerged breakwater system, and at three additional positions spaced 0.45 m apart. This setup will help determine the system’s influence on both the centre and the periphery. The sideline location will indicate the breakwater’s influence on velocity in the Y direction and provide the wave position, which will be used for direct comparison once experimental tests are conducted. A comparison of wave transmission coefficient Kt for different positions along the Y-axis is presented in Table 3. While the centreline passes above the wall of the breakwater, Cut 1 passes between two neighbouring breakwater elements, and Cut 2 directly above holes in the breakwater, Cut 3 passes further away from the submerged breakwater system. The transmission coefficient shows small variations between the centreline and Cuts 1 and 2, with Cut 2 having the lowest Kt, meaning that breakwater holes reduce the wave the most but only for a small margin.
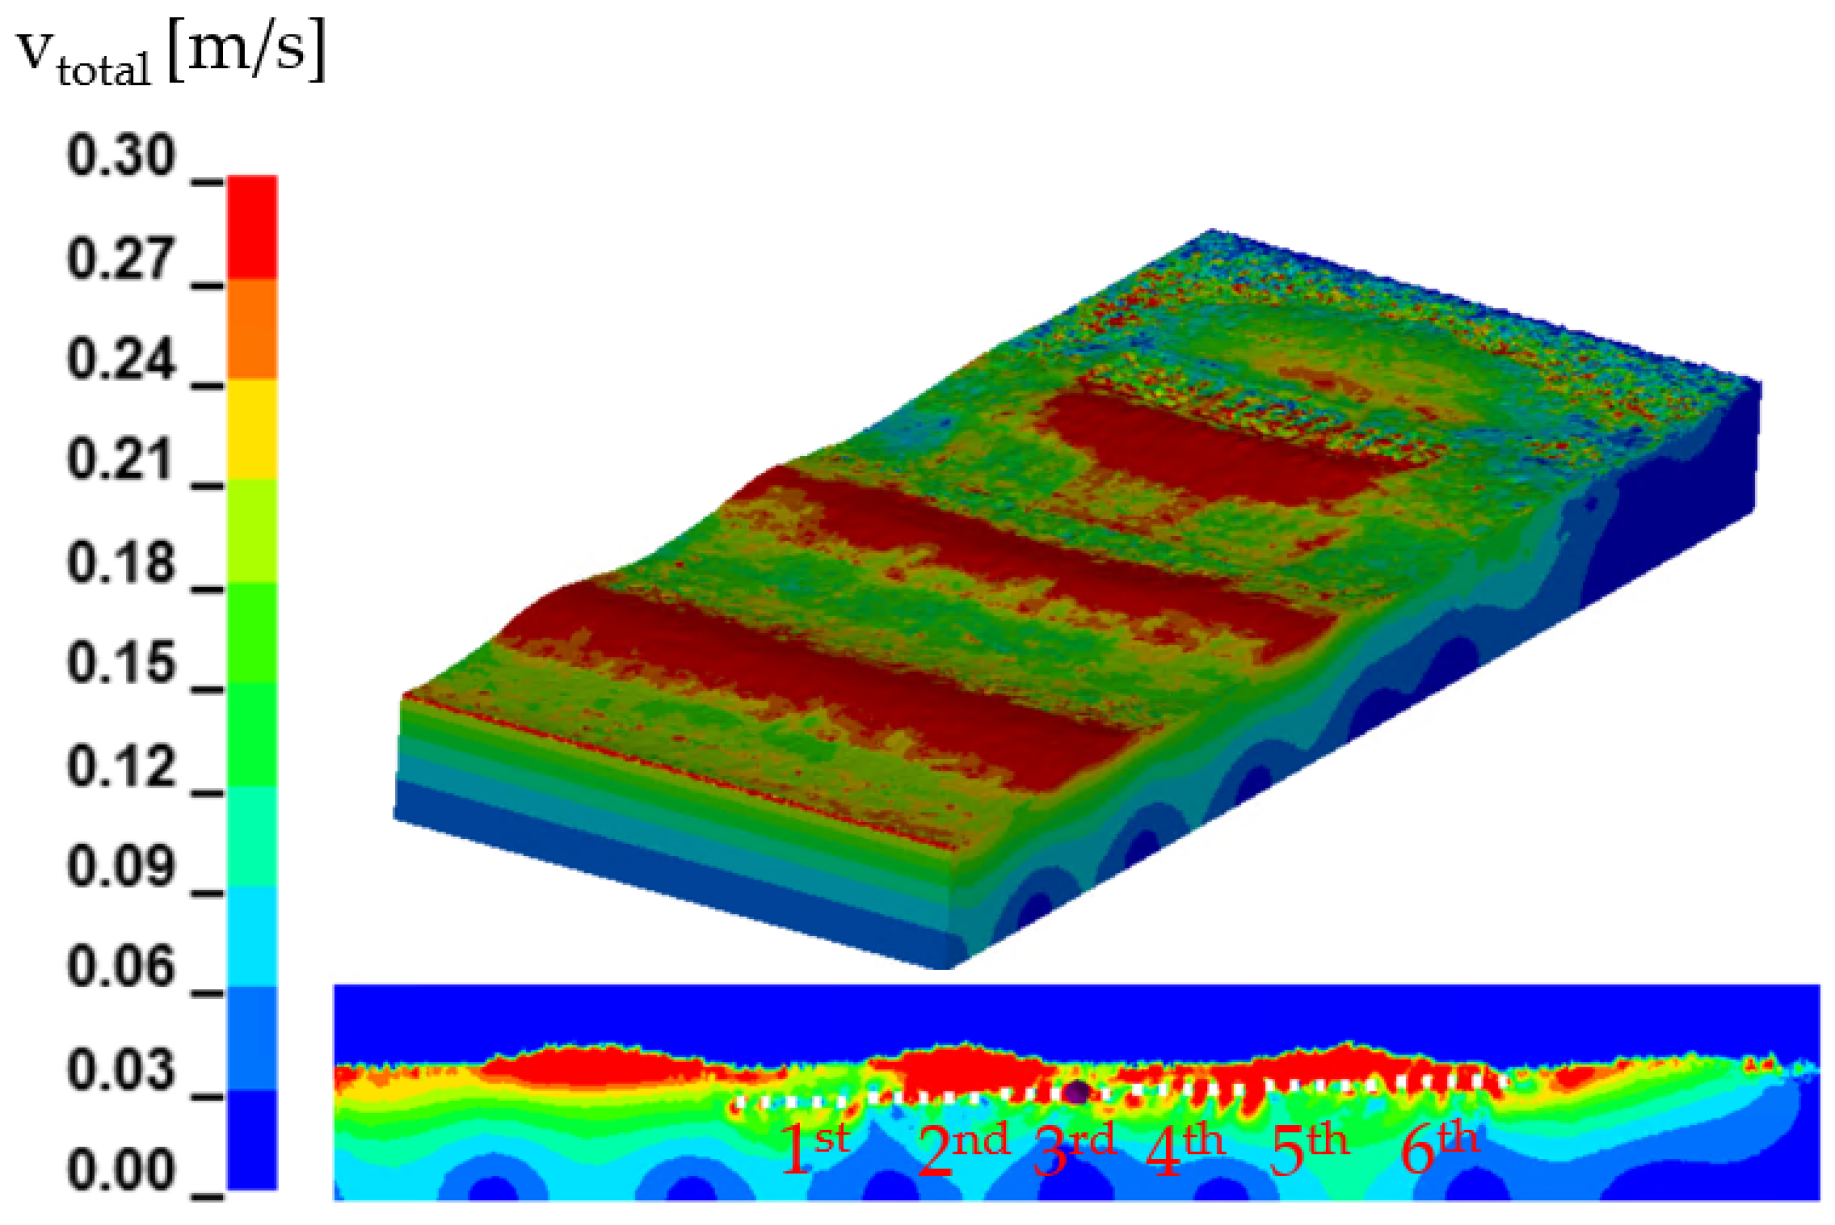
Next, Figure 12 illustrates the effect of velocity changes. A significant reduction in wave crest height is observed only after the wave has passed through the last sixth row of breakwater elements, which are positioned 5 cm from the free surface.
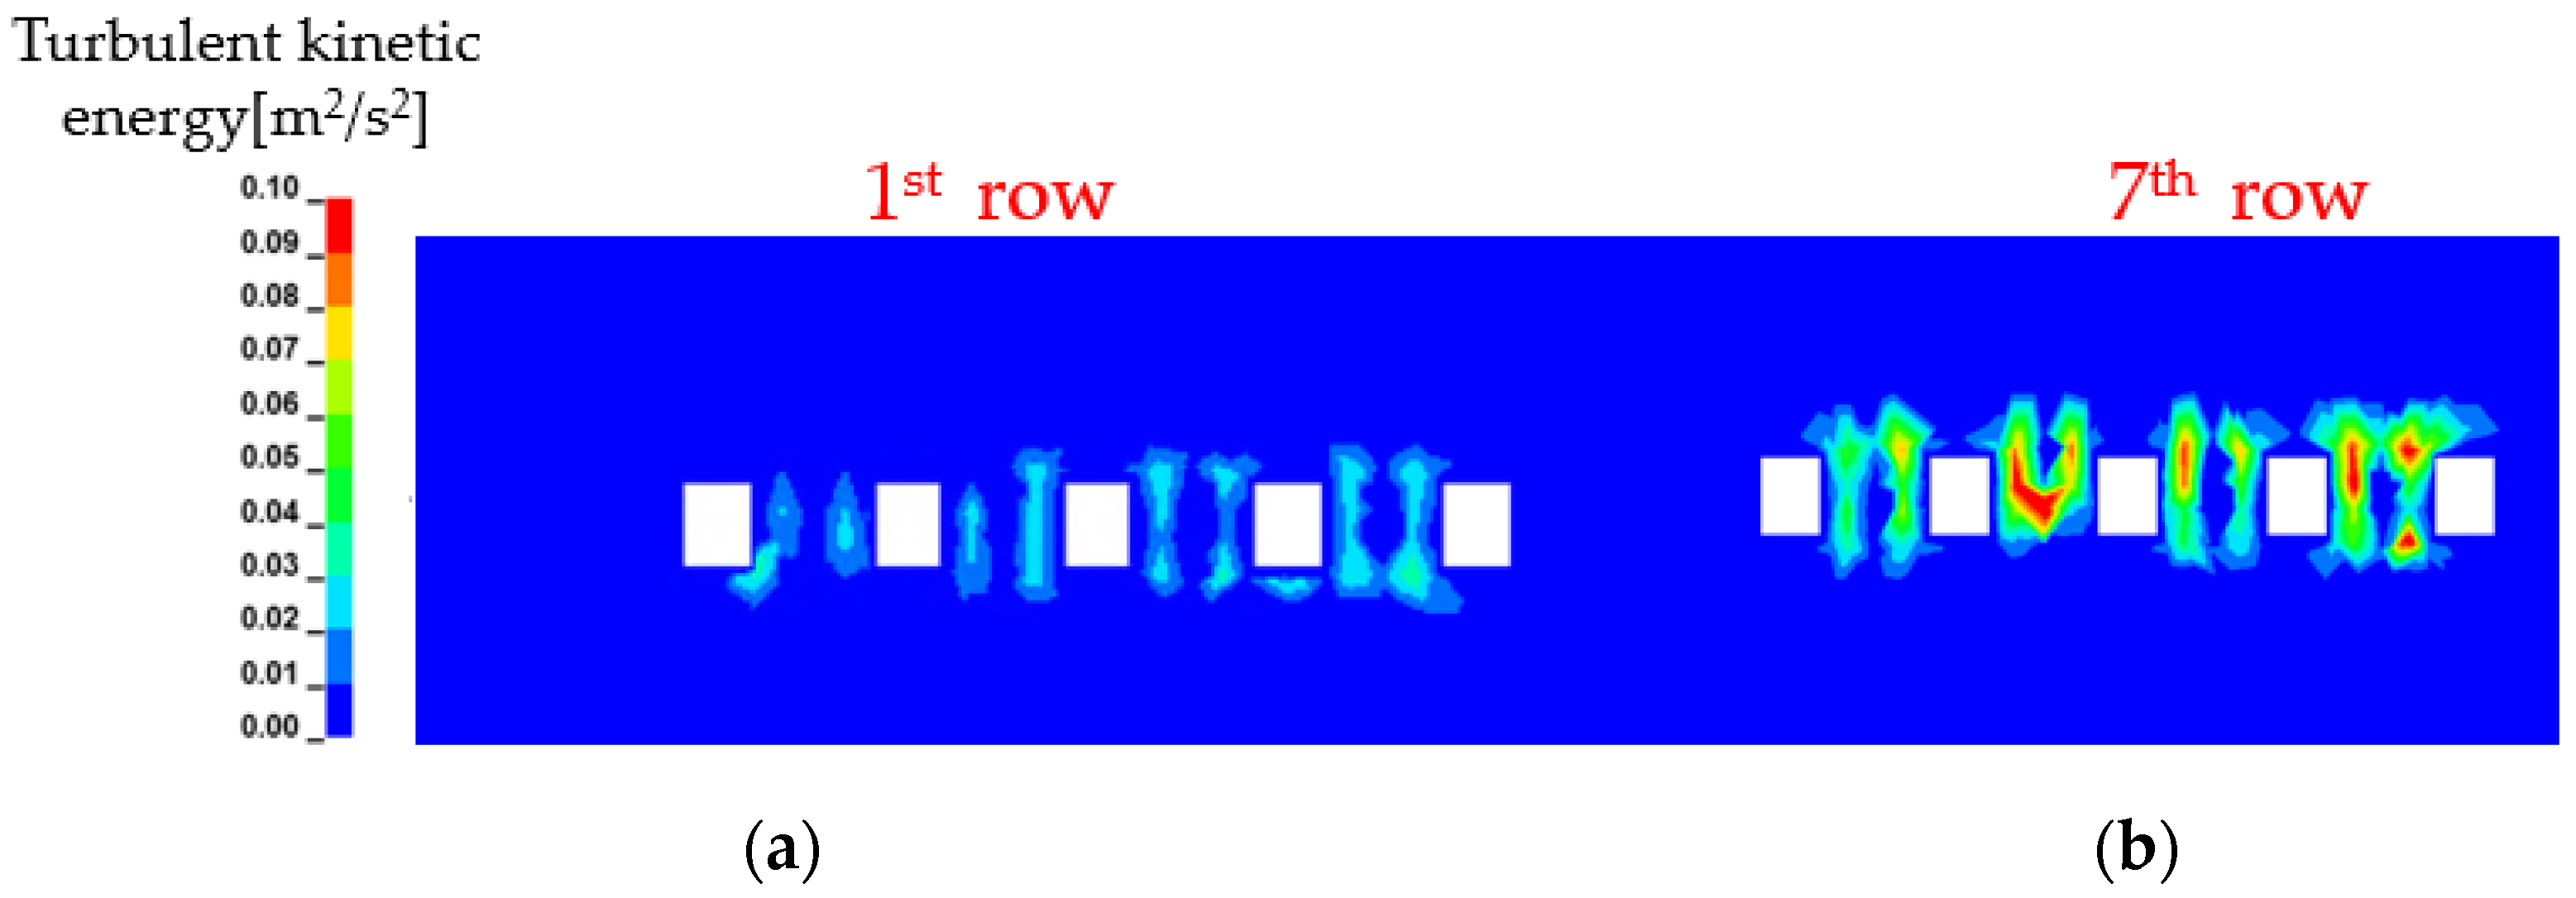
This becomes clear by analysing the turbulent kinetic energy, Figure 13. The results show that the kinetic energy of turbulence is the highest at an amplitude of 12.5 cm both at the wave crest and in the wave trough. Most of the turbulence is generated at the edges of the breakwater with a significant difference between the first row of breakwaters, Figure 13a, and the last row of breakwaters, Figure 13b. This means that the first row is far below the zone of influence and does not contribute significantly to the reduction in wave amplitude.
Next, the reduction in wave amplitude is compared for four different wave steepness ratios at the same amplitude of 12.5 cm and the same system arrangement of angle 4, Figure 14. It is visible that submerged breakwater efficiency decreases with the decrease in steepness, with the transmission coefficient being equal to 0.16 for the steepest wave and up to 0.64 for the most gradual wave.
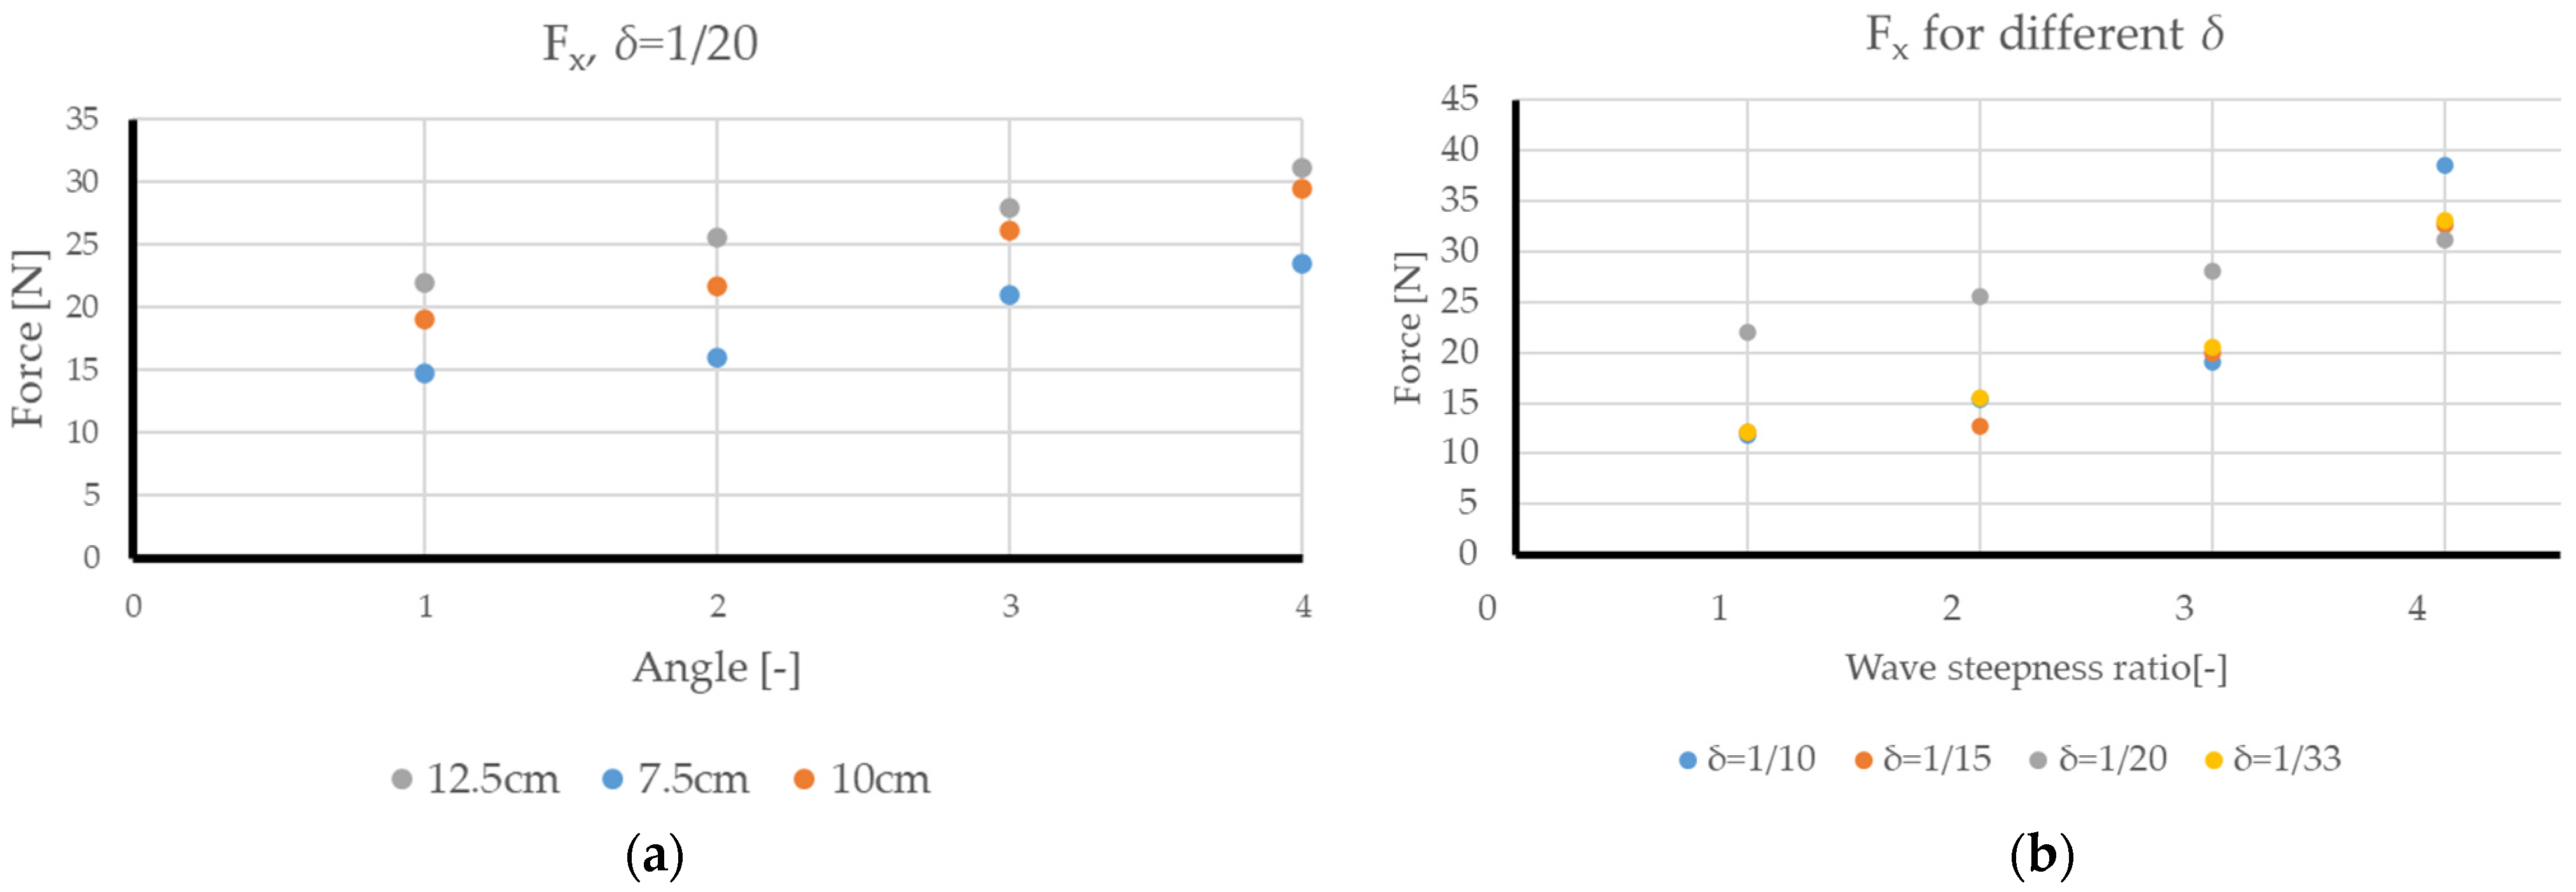
Finally, Figure 15a compares the drag force in the wave (x-axis direction) for different amplitudes, Figure 15b, for different wave steepness ratios. The efficiency of the system increases as the angle increases, with drag values being consistent across the three tested wave amplitudes. This drag predominantly consists of the viscous component, as shown in Figure 15a. Regarding the relationship between the drag force and steepness ratio, the angle 4 arrangement is the most effective at damping steeper waves. For the average wave steepness of 1/20, efficiency slightly increases with the system arrangement angle, as illustrated in Figure 15b.

5. Conclusions

The ICFD analysis demonstrated its capability to model and solve wave interactions effectively. The initial setup using 20 elements per wave height did not produce an adequate wave at the inlet and resulted in divergence further along the domain. Consequently, 30 elements per wave height and 15 elements per wave amplitude were selected to improve accuracy.
Research consisting of a two-stage analysis of submerged breakwater is presented. Testing the topology of the submerged breakwater itself, the Quadratic 16-hole topology proved to be the most efficient in terms of wave damping. The more porous option with 36 holes is less effective due to the smaller surface area, which generates both a lower drag, Figure 9a, and lower wave profile, Figure 9b, as well as an overall lower efficiency over different wave steepness ratios compared to the Quadratic 16-hole topology. This is also demonstrated when the wave profile is visualised, as shown in Figure 10a,b. In comparison, the cylindrical 6-hole topology also dampens the wave but to a lesser extent than the Quadratic 16-hole topology, while the Quadratic 36-hole topology has almost no effect on wave amplitude.
The analysis of a submerged breakwater system has shown that the damping effect becomes more pronounced by reducing the angle and increasing the length of the overall system and by connecting more elements in series. Significant damping only occurred after the fourth row of a breakwater was reached, namely at the position 10 cm from the free surface at an amplitude height of 7.5 cm. Here, amplitude shift happened, and the amplitude decreased to only 7% of the initial value. When observing system angles, it is evident that angle 1 and angle 2 are too steep, as the first row is positioned too low even for the largest wave amplitudes. A significant increase in wave damping efficiency occurs at angle 3, while angle 4 shows only a marginal improvement. Turbulence creation, Figure 13, is visible close to the surface where fluid passes through breakwater holes, and partial backflow is created. When examining single system angle across different wave steepness ratios, submerged breakwater demonstrates a more pronounced advantage of wave dampening at higher wave steepness ratios, as depicted in Figure 14.
The analysis indicates that to significantly dampen the wave amplitude, the lowest position of the breakwater should ideally be no lower than 40% of the maximum expected wave amplitude. Therefore, the first row of breakwaters can be omitted in future towing tank tests.

Author Contributions

Š.S.: investigation, methodology, validation, formal analysis, visualisation, and writing—original draft preparation and editing. S.R.: investigation, methodology, supervision, and writing—review and editing. All authors have read and agreed to the published version of the manuscript.

Funding

This research received no external funding.

Institutional Review Board Statement

Not applicable.

Informed Consent Statement

Not applicable.

Data Availability Statement

Data are contained within this article.

Conflicts of Interest

The authors declare that they have no known competing financial interests or personal relationships that could have appeared to influence the work reported in this paper.

References

  1. Zheng, Y.; Liu, M.; Chen, C.P.; Jiang, Y.P. Experimental study on the wave dissipation performance and mooring force of porous floating breakwater. IOP Conf. Ser. Earth Environ. Sci. 2018, 189, 022058. [Google Scholar] [CrossRef]
  2. Chybowski, L.; Grządziel, Z.; Gawdzińska, K. Simulation and Experimental Studies of a Multi-Tubular Floating Sea Wave Damper. Energies 2018, 11, 1012. [Google Scholar] [CrossRef]
  3. Coastal Engineering Manual-CEM. Coastal Engineering Manual Part II; US Army Coastal Engineering Research Centre: Washington, DC, USA, 2002. [Google Scholar]
  4. Matsunaga, N.; Hashida, N.; Uzaki, K.; Kanzaki, T.; Uragami, Y. Performance of Wave Absorption by a Steel Floating Breakwater with Truss Structure. In Proceedings of the Twelfth International Offshore and Polar Engineering Conference, Kitakyushu, Japan, 26–31 May 2002; pp. 768–772. [Google Scholar]
  5. Pena, E.; Ferreras, J.; Sanchez, F. Experimental study on wave transmission coefficient, mooring lines and module connector forces with different designs of floating breakwaters. Ocean Eng. 2011, 38, 1150–1160. [Google Scholar] [CrossRef]
  6. Ji, C.; Deng, X.; Cheng, Y. An experimental study of double-row floating breakwaters. J. Mar. Sci. Technol. 2018, 54, 359–371. [Google Scholar] [CrossRef]
  7. Kim, N.H.; Young, Y.L.; Yang, S.B.; Park, K.I. Wave damping analysis in a porous seabed. KSCE J. Civ. Eng. 2006, 10, 305–310. [Google Scholar] [CrossRef]
  8. Chalmoukis, I.A.; Leftheriotis, G.A.; Dimas, A.A. Large-Eddy Simulation of Wave Attenuation and Breaking on a Beach with Coastal Vegetation Modelled as Porous Medium. J. Mar. Sci. Eng. 2023, 11, 519. [Google Scholar] [CrossRef]
  9. Setiyawan. Transmission Coefficient (kt) and Reflection Coefficient (kr) on Breakwater Type Cube. Int. J. Innov. Res. Adv. Eng. 2018, 5, 158–166. [Google Scholar] [CrossRef]
  10. Ji, C.; Cheng, Y.; Yang, K.; Oleg, G. Numerical and experimental investigation of hydrodynamic performance of a cylindrical dual pontoon-net floating breakwater. Coast. Eng. 2017, 129, 1–16. [Google Scholar] [CrossRef]
  11. Syed, S.A.; Mani, J.S. Performance of rigidly interconnected multiple floating pontoons. J. Nav. Archit. Mar. Eng. 2004, 1, 3–17. [Google Scholar] [CrossRef]
  12. Cheng, X.; Liu, C.; Zhang, Q.; He, M.; Gao, X. Numerical Study on the Hydrodynamic Characteristics of a Double-Row Floating Breakwater Composed of a Pontoon and an Airbag. J. Mar. Sci. Eng. 2021, 9, 983. [Google Scholar] [CrossRef]
  13. Fitriadhy, A.; Faiz, M.A.; Abdullah, S.F. Computational fluid dynamics analysis of cylindrical floating breakwater towards reduction of sediment transport. J. Mech. Eng. Sci. 2017, 11, 3072–3085. [Google Scholar] [CrossRef]
  14. He, M.; Gao, X.; Xu, W.; Ren, B.; Wang, H. Potential application of submerged horizontal plate as a wave energy breakwater: A 2D study using the WCSPH method. Ocean Eng. 2019, 185, 27–46. [Google Scholar] [CrossRef]
  15. Guo, W.; Zou, J.; He, M.; Mao, H.; Liu, Y. Comparison of hydrodynamic performance of floating breakwater with taut, slack, and hybrid mooring systems: An SPH-based preliminary investigation. Ocean Eng. 2022, 258, 111818. [Google Scholar] [CrossRef]
  16. He, M.; Liang, D.; Ren, B.; Li, J.; Shao, S. Wave interactions with multi-float structures: SPH model, experimental validation and parametric study. Coast. Eng. 2023, 184, 104333. [Google Scholar] [CrossRef]
  17. Lloyd, C.; O’Doherty, T.; Mason-Jones, A. Development of a wave-current numerical model using Stokes 2nd Order Theory. Int. Mar. Energy J. 2019, 2, 1–14. [Google Scholar] [CrossRef]
  18. Huang, L.; Ren, K.; Li, M.; Tukovic, Z.; Cardiff, P.; Thomas, G. Fluid-structure interaction of a large ice sheet in waves. Ocean Eng. 2019, 182, 102–111. [Google Scholar] [CrossRef]
  19. Ge, G.; Zhang, W.; Xie, B.; Li, J. Turbulence model optimization of ship wake field based on data assimilation. Ocean Eng. 2024, 295, 116929. [Google Scholar] [CrossRef]
  20. Wiesent, L.; Geith, M.; Wagner, M. Simulation of Fluid-Structure Interaction between injection medium and balloon catheter using ICFD. In Proceedings of the 11th European LS-DYNA Conference, Salzburg, Austria, 9–11 May 2017. [Google Scholar]
  21. ICFD Theory Manual, Incompressible Fluid Solver in LS-DYNA; Livermore Software Technology Corporation (LSTC): Livermore, CA, USA, 2014.
  22. Maâtoug, M.A.; Ayadi, M. Numerical simulation of the second-order Stokes theory using finite difference method. Alex. Eng. J. 2016, 55, 3005–3013. [Google Scholar] [CrossRef]
  23. Farkas, A.; Parunov, J.; Katalinić, M. Wave Statistics for the Middle Adriatic Sea. J. Marit. Transp. Sci. 2016, 52, 33–47. [Google Scholar] [CrossRef]
  24. Zorović, D.; Mohović, R.; Mohović, Đ. Towards Determining the Length of the Wind Waves of the Adriatic Sea. Naše More 2003, 50, 145–150. [Google Scholar]
  25. Perin, B.; Verdrel, P.; Bordenave, P.; Grippon, E.; Belloc, H.; Caldichoury, I. Computational Fluid Dynamic of NACA0012 with LS-DYNA® (ALE & ICFD) and Wind Tunnel Tests. In Proceedings of the 14th International LS-DYNA Users Conference, Detroit, MI, USA, 12–14 June 2016. [Google Scholar]
  26. Connell, K.; Cashman, A. Development of a numerical wave tank with reduced discretization error. In Proceedings of the International Conference on Electrical, Electronics, and Optimisation Techniques (ICEEOT), Chennai, India, 3–5 March 2016. [Google Scholar] [CrossRef]
  27. da Silva, C.B. The behavior of subgrid-scale models near the turbulent/nonturbulent interface in jets. Phys. Fluids 2009, 21, 081702. [Google Scholar] [CrossRef]
  28. Calero, L.; Blanco, J.M.; Izquierdo, U.; Esteban, G. Performance Assessment of Three Turbulence Models Validated through an Experimental Wave Flume under Different Scenarios of Wave Generation. J. Mar. Sci. Eng. 2020, 8, 881. [Google Scholar] [CrossRef]
  29. Šimun, S.; Smiljko, R. Development of wave dampers using computational fluid dynamics. In Proceedings of the 24th Numerical Towing Tank Symposium, Zagreb, Croatia, 15–18 October 2022; pp. 168–174. [Google Scholar]
Figure 1. (a) Towing tank at the University of Zagreb, Faculty of Mechanical Engineering; (b) width between breakwater rows.
Oceans 05 00042 g001
Figure 2. Breakwater topology: (a) cylindrical 6-hole, (b) Quadratic 16-hole, and (c) Quadratic 36-hole topologies.
Oceans 05 00042 g002
Figure 3. Numerical setup: (a) domain and (b) wave mesh with four different positions.
Oceans 05 00042 g003
Figure 4. Comparison of LS-DYNA and Fluent: (a) numerical setup, (b) wave profile [29].
Oceans 05 00042 g004
Figure 5. Numerical setup: (a) four different wave meshes, (b) convergence diagram.
Oceans 05 00042 g005
Figure 6. The numerical setup for a submerged breakwater system: (a) the global domain, (b) a breakwater system with 6 elements in a line (angle 3 case).
Oceans 05 00042 g006
Figure 7. Variation in submerged breakwater system arrangement angle.
Oceans 05 00042 g007
Figure 8. Results: (a) 15 cm wave amplitude generation, (b) streamline around breakwater.
Oceans 05 00042 g008
Figure 9. Comparison of different breakwater topologies based on (a) drag, (b) wave profile, and (c) drag for different wave steepness ratios.
Oceans 05 00042 g009
Figure 10. Comparison of different breakwater topologies based on (a) wave velocity and (b) wave profile.
Oceans 05 00042 g010
Figure 11. Wave pattern, 12.5 cm amplitude, angle 1.
Oceans 05 00042 g011
Figure 12. Wave velocity profile for 10 cm amplitude, angle 3.
Oceans 05 00042 g012
Figure 13. Maximum turbulence creation at both wave crest and trough at (a) first row of breakwater and (b) last row of breakwater.
Oceans 05 00042 g013
Figure 14. Comparison of wave amplitude reduction for different δ ratios—angle 4.
Oceans 05 00042 g014
Figure 15. Force comparison for different wave amplitudes in (a) drag force in X direction for δ = 1/20; (b) relation between drag force in X direction and steepness ratio.
Oceans 05 00042 g015
Table 1. Assessing the efficiency of breakwater topology analysis particulars.
Model NameNumber of ICFD ElementsNumber of Solid Elements
Cylindrical holesδ = 1/10, T = 1.75 s206 k500
δ = 1/15, T = 3.75 s206 k 500
δ = 1/20, T = 5 s206 k 500
δ = 1/33, T = 7.5 s206 k 500
Quadratic 16 holesδ = 1/10, T = 1.75 s206 k1284
δ = 1/15, T = 3.75 s206 k1284
δ = 1/20, T = 5 s206 k1284
δ = 1/33, T = 7.5 s206 k1284
Quadratic 36 holesδ = 1/10, T = 1.75 s206 k2148
δ = 1/15, T = 3.75 s206 k2148
δ = 1/20, T = 5 s206 k2148
δ = 1/33, T = 7.5 s206 k2148
Table 2. Analysis information for submerged breakwater system.
Model NameNumber of ICFD ElementsNumber of Solid ElementsReal-World Time
7.5 cm amplitude, 1.5 m wavelength, δ = 1/20,
T = 3.75 s
Angle 1435 k 22 k12 h, 29 min
Angle 2435 k 33 k12 h, 43 min
Angle 3435 k 45 k13 h, 13 min
Angle 4435 k60 k13 h, 50 min
10 cm amplitude, 2 m wavelength, δ = 1/20,
T = 5 s
Angle 1284 k22 k3 h, 50 min
Angle 2284 k33 k3 h, 55 min
Angle 3284 k45 k4 h, 6 min
Angle 4284 k60 k4 h, 15 min
12.5 cm amplitude, 2.5 m wavelength, δ = 1/20,
T = 6.25 s
Angle 1197 k22 k2 h, 58 min
Angle 2197 k33 k3 h
Angle 3197 k45 k3 h, 2 min
Angle 4197 k60 k3 h, 12 min
12.5 cm amplitude, 1.25 m wavelength, δ = 1/10,
T = 3.1 s
Angle 1197 k22 k4 h, 3 min
Angle 2197 k33 k4 h, 15 min
Angle 3197 k45 k4 h, 54 min
Angle 4197 k60 k8 h, 21 min
12.5 cm amplitude, 1.875 m wavelength, δ = 1/15,
T = 6.25 s
Angle 1197 k22 k4 h, 45 min
Angle 2197 k33 k6 h, 40 min
Angle 3197 k45 k7 h, 3 min
Angle 4197 k60 k7 h, 14 min
12.5 cm amplitude, 3.6 m wavelength, δ = 1/33,
T = 9 s
Angle 1197 k22 k5 h, 46 min
Angle 2197 k33 k6 h, 36 min
Angle 3197 k45 k6 h, 42 min
Angle 4197 k60 k7 h, 24 min
Table 3. Wave transmission coefficients for different wave amplitudes.
δ = 1/20Model NameCentreline Kt [-]Cut 1 Kt [-]Cut 2 Kt [-]Cut 3 Kt [-]
7.5 cm amplitudeAngle 10.340.360.330.4
Angle 20.30.320.290.33
Angle 30.070.090.0670.16
Angle 40.040.050.0320.12
10 cm amplitudeAngle 10.460.480.450.53
Angle 20.330.350.320.42
Angle 30.220.240.210.33
Angle 40.150.170.140.28
12.5 cm amplitudeAngle 10.530.550.530.6
Angle 20.280.290.270.46
Angle 30.20.220.190.37
Angle 40.130.150.120.18
Disclaimer/Publisher’s Note: The statements, opinions and data contained in all publications are solely those of the individual author(s) and contributor(s) and not of MDPI and/or the editor(s). MDPI and/or the editor(s) disclaim responsibility for any injury to people or property resulting from any ideas, methods, instructions or products referred to in the content.