Article

Comparing the Structure of Fish Assemblage among Natural and Artificial Shallow Rocky Habitats

by
Laura García-Salines
and
Pablo Sanchez-Jerez
*
Department of Marine Science and Applied Biology, University of Alicante, 03690 San Vicente del Raspeig, Alicante, Spain
*
Author to whom correspondence should be addressed.
Oceans 2024, 5(2), 244-256; https://doi.org/10.3390/oceans5020015
Submission received: 14 December 2023 / Revised: 14 February 2024 / Accepted: 29 April 2024 / Published: 6 May 2024

Abstract

:
Artificial coastal structures, such as seawalls, breakwaters, and groins, can exert various impacts on the fish communities in the nearby regions. This study focuses on assessing the ecological effects of coastal infrastructure on marine environments, by comparing, at different seasons, the habitat complexity and heterogeneity, as well as their effects on fish assemblages, between the artificial habitat created with the intention of constructing a marina (Puerto Amor) and the natural habitats surrounding the Cabo de la Huerta area in Alicante (Spain). Employing an asymmetric design and examining two temporal and spatial scales, we utilized visual censuses in snorkeling to gauge the abundance and size of fish species, alongside various parameters related to habitat complexity and heterogeneity. The overarching hypothesis is that fish populations associated with artificial habitats will differ in terms of abundance, biomass, species richness, and diversity compared to fish populations associated with natural habitats, due to changes in complexity and heterogeneity. The findings indicate a shift in fish assemblages; for example, the family Labridae showed differences between the two habitat types for several species. These changes were due to the influences of the Posidonia oceanica meadow and algae like Jania rubens; being influenced by biological variables such as Ellisolandia elongata, Oculina patagonica, and Sarcotragus spinosulus; as well as physical variables such as stones, gravel, and blocks. While there is evidence of alteration in fish assemblages due to changes in habitat structure, there is also an increase in richness (9 species/m2) and total abundance and biomass (1000 ind./m2 and 1700 g/m2, respectively) in the artificial habitat. Multivariate analyses reveal that the fish community in Puerto Amor is less homogeneous than the one in the natural habitat. However, these analyses also indicate an overlap between the communities of both habitats, suggesting substantial similarity despite the noted differences. Consequently, although the habitat alteration has impacted fish populations, it has not diminished abundance, biomass, or species richness. In conclusion, the artificial rocky habitat resulting from the construction attempt at Puerto Amor harbor has fish populations with ecological significance and its removal could lead to undesirable impacts in the area, as the fish assemblages have become well established.

1. Introduction

In the Mediterranean, throughout the 20th century and the present century, the development of coastal constructions, such as breakwaters and marinas, has been quite common to protect the coasts and adjacent areas from the erosive effects of the sea and to improve the stability of beaches, as well as facilitating the mooring of boats and offering services to human coastal populations. However, these constructions tend to generate significant environmental impacts, changing the gentler substrate slopes of natural environments to the predominance of vertically structured habitats, as occurs in marinas and ports. Also, the introduction of non-natural building material, the reduction in the complexity of microhabitats, and the modification of water flow can create a radically new environment for marine biota [1]. It has been proven that these changes in the marine ecosystem cause the alteration of local biodiversity, with changes in the taxonomic and functional structure of biological communities [2], and change their distribution [3]. Considering that the coastline serves as a vital boundary between land and sea, the alteration of this interface through infrastructure construction is recognized as a significant danger to marine biodiversity [4]. This underscores the growing necessity to assess the influence of such structures on coastal marine ecosystems. The aim of the scientific community is to minimize or remediate any harm incurred and potentially enhance their ecological significance. This urgency is further compounded by the anticipation of heightened human intervention along the coasts, as a response to the challenges posed by climate change [5].
One of the ecological indicators widely used to determine the impact of human activities on ecosystems is fish assemblage structure. Evaluating the dynamics and composition of the fish assemblage, in terms of richness, abundance, and biomass of the species present in an area, is of great relevance, due to its ecological and economic importance, in addition to the fact that this fauna is an indicator of key ecological functions and services of marine ecosystems [6] and is closely related to shallow rocky habitats [7].
This study was conducted on the coastal area around Alicante city, since this is a clear example of great urban development, due to various actions carried out since the 1970s, related to tourism infrastructure. In general, on the Alicante coast, the most prominent waves are those that originate in the ENE–E direction [8]. Of this large area, the study focused on the environment of Cabo de la Huerta, which is also generally influenced by the waves coming from these directions. However, in the chosen artificial area (marina Puerto Amor, on the Almadraba Beach), the waves come from the ESE, SE, SSE, and S directions, since, due to the morphology of the terrain and construction modifications, it is protected from the ENE and E directions [9].
The Almadraba Beach area has undergone important changes due to the maritime works that have been carried out, one of which was the attempted construction of the marina Puerto Amor, whose work began in 1980, but was interrupted, due to discrepancies between government agencies, until today [10]. However, backfilling works and the construction of the breakwaters began to be developed (Figure 1), although both remained in the first phases [9]. The result of this unfinished project has been a deeply altered and degraded environment and the built breakwaters have acted, until today, as barriers to the circulation and renewal of waters inside the bay [11].
Over the years, due to the unfortunate management of the Puerto Amor project by an urban development company, with the permission of the Alicante council, it has been perceived, due to the erosion and the hypersedimentation of fines in the inner bay of the Almadraba Beach, that it has been degraded. Several alternatives have been proposed to solve this situation, but, until today, no action has been taken to restore this. Under these premises, and with the purpose of providing base knowledge that facilitates decision-making regarding the environmental management and possible ecological restoration of Puerto Amor, the present study, as a general objective, intended to carry out an evaluation of the ecological functioning of this artificial habitat, using the fish community as an indicator of the changes generated by it, in comparison with natural habitats surrounding the Cabo de la Huerta environment.
To carry out this evaluation, the specific objectives of this study were as follows: (1) to identify the differences in terms of complexity and heterogeneity of the natural and artificial habitat; (2) to establish the differences of the fish assemblage structures associated with the artificial and natural habitat, in terms of total abundance, biomass, richness, and diversity; and (3) to compare the abundances of the most relevant fish species at the two habitats in different seasons.

2. Materials and Methods

In this study, the structure of fish assemblages in shallow natural rocky habitats was compared with that in artificial rocky habitats. The maximum depth was 3.5 m. The data were obtained using the non-destructive method of visual censuses by snorkeling, given that it is widely accepted that this method provides accurate estimates of fish species distribution and abundance patterns [12]. The snorkeling method, instead of using SCUBA equipment, was considered most appropriate to reduce the discomfort that the sound emitted by the diving equipment generates in the observed fish [13]. It has also been comment that snorkel surveys were made possible due to the relatively shallow depth of the study area (maximum 3.5 m) and the good visibility. Three different locations around Cabo de la Huerta were selected (Figure 2), as follows: one impacted location with artificial habitats (the breakwaters under construction at the Puerto Amor in the Almadraba beach) and two control locations with natural rocky habitats around Cabo de la Huerta. The shallow habitats are a mix of rock, Posidonia oceanica and Cymodocea nodosa seagrass meadows, Caulerpa prolifera, and sandy and muddy soft bottom. This area is partially protected under EU Habitat Directive (Council Directive 92/43/EEC; N2K ES5213032 data forms, Cap de les Hortes; Europa.eu) [14].
In each location, three sites were randomly selected and, in each of them, three censuses were carried out. Each census consisted of a transect 25 m long and 2.5 m on each side of the observer [15], so an area of 125 m2 was covered in each of the visual counts. On the way out, the abundance and size of the fish were estimated. The assessment of changes in habitat heterogeneity and complexity was carried out at the following three levels: (1) coverage of the main habitats accompanying the rocky habitat (P. oceanica, C. nodosa, C. prolifera, and sandy and muddy soft bottoms); (2) complexity of the rocky habitat by estimating descriptors (number of cavities (>50 cm), stones (<1 m), blocks (1–2 m), verticality (m), and maximum depth (m); and coverage of the rocky habitat by algal and animal communities.
Sampling, following this experimental design, was repeated at three random times during the winter season (March) and three times during the spring season (April and May). These two seasons were chosen due to the lower influx of tourists, avoiding possible alterations in the shallow sampling areas. In total, 162 censuses were carried out (6 times × 3 localities × 3 sites × 3 replicates), with 25 sampling days.

Statistical Analysis

The experimental designs had five factors, as follows: treatment (artificial and natural habitat; fixed fact), location (L1 and L2; fixed and asymmetric factor), season (winter and spring; fixed factor), time (T1, T2, and T3, random factor and nested in season), and site (S1, S2, and S3; random factor and nested in the interaction of all factors). One matrix was created for the data of fish abundance and size, while another was created for the physical and biological features of the habitat.
The habitat features were classified into major habitats, rock coverture, and rock characterization. Subsequently, these categories were represented using bar graphs, based on rocky habitat type and season. The matrix with the fish abundance, together with the length–weight relationships of each species obtained from fishbase.org, were used to calculate the biomass, using the equation W = a · Lb [16], where W is the weight in grams, L is the observed size in centimeters, and a and b are the parameters of the equation. Total abundances and biomasses were obtained for each sample and were represented with a boxplot. In addition, the species richness (S’) and the Shannon–Weaver (H’) diversity index were also calculated and represented with a boxplot, depending on the type of rocky habitat. Fish abundance populations of the most relevant species, due to their abundance, were represented, grouped into the families Sparidae, Labridae, and Serranidae and the rest were grouped into another category. Unidentified juveniles were also considered, due to the ecological relevance. And all of these categories were represented using bar graphs, also based on rocky habitat type and season.
Redundancy analyses (RDAs) were performed to determine how the fish community responded to each treatment, depending on the habitat conditions, which were divided into physical and biological parameters. The Bray–Curtis dissimilarity measure was used to determine the variations in the structure of the fish community between the different treatments, although the number of variables had to be reduced so that the least abundant ones did not introduce noise into the ordination; species with an abundance of less than 10% (Diplodus cervinus, Epinephelus marginatus, and Scorpaena scrofa) and the species Chromis chromis, due to its minimal relationship with the benthic environment, as it is pelagic, were eliminated from the analysis [7]. Additionally, data were transformed using square root and Wisconsin double standardization. Also, the Pearson Coefficient was used to eliminate collinear variables and to obtain smaller models.
To observe which factors were significant, under the double quadratic transformation and using Bray–Curtis distances, a multivariate PERMANOVA was performed to characterize the entire habitat and a univariate one was performed for each habitat feature, for specific richness, total abundance and biomass, and abundance of each species, although this required modifying the abundance matrix, eliminating the treatment factor, and establishing the season and location as fixed and orthogonal, which now had the artificial, natural1, and natural2 levels, while time and site were established as random factors and nested, under this asymmetric linear model (Lo = locality, Se = Season, Ti = Time, and Si = Site) (1):
xijkl = µ + Loi + Sej + Lo*Seij + Ti (Se)k(j) + Lo*Ti (Se)ik(j) + Si (Lo*Ti (Se))l(ik(j)) + Errorn(ijkl)
Statistical analyses were conducted using the R programming language and the RStudio Graphical User Interface version 4.2.1 [17], as well as the following packages: readr version 2.1.4 [18], to open CSV files; sciplot version 1.2-0 [19], for making the bargraphs; tidyverse version 2.0.0 [20], for ggplot2 graphics; vegan version 2.6-4 [21], for nMDS and PERMANOVA; ggrepel version 0.9.3 [22], for multivariate data sorting; ggord version 1.0.0 [23], for ggplot2 graph sorting; pairwise version 0.6.1-0 [24], for comparisons; and corrplot version 0.92 [25], for represent correlations. Also, to summarize statistics and tables, the following packages were used: skimr version 2.1.5 [26], gtsummary version 1.7.2 [27], data.table version 1.14.8 [28], knitr version 1.43 [29], sjPlot version 2.8.14 [30], kableExtra version 1.3.4 [31], and huxtable version 5.5.2 [32].

3. Results

3.1. Habitat Features

In terms of habitat heterogeneity, unvegetated sandy bottoms, C. nodosa, and P. oceanica were present in both treatments, with significant differences between treatments and seasons. P. oceanica showed the highest level of cover on the natural habitat (25% cover in spring and 20% in winter, with only 5% in the artificial habitat in spring and 2% in winter). However, C. nodosa showed a similar cover in both habitats, with a higher meadow development in spring (7.5% vs. <2.5%; Figure S1). On the other hand, C. prolifera was present only in the natural habitat, with 1.75% and 0.75% in spring and winter, respectively, also showing significant differences between treatments (Table S1; Figure S1). Regarding the complexity characterization of the rocky habitat (Figure S2), gravel (3 units/m2 in natural habitat vs. 20 units/m2 in artificial habitat), stones (5 units/m2 in natural habitat vs. 40 units/m2 in artificial habitat), and blocks (0.7 units/m2 in natural habitat vs. 3.8 units/m2 in artificial habitat) clearly predominate in the artificial habitat, showing significant differences between treatments (Table S2). The number of cavities showed significant differences between treatments and sampling seasons (Table S2), as well as in verticality, not showing any statistical differences (Figure S2). Finally, regarding the cover of rocky habitats Jania rubens, Halimeda tuna, Cystoseira spp., and Codium vermilara dominated in the natural rocky habitat (Figure S3). Oppositely, Ellisolandia elongata, Oculina patagonica, and Sarcotragus spinosulus were found only in the artificial habitat (Figure S3). Likewise, cover was closely related to the season, with higher percentages generally found in spring, except for in the case of Ellisolandia elongata. Species such as Halopteris scoparia, Dictyota sp., Padina pavonica, and Colpomenia sinuosa were found in both treatments (Figure S3). These differences were confirmed using a PERMANOVA test, with significant differences for all the interactions (Table S3).

3.2. Changes in Fish Assemblages

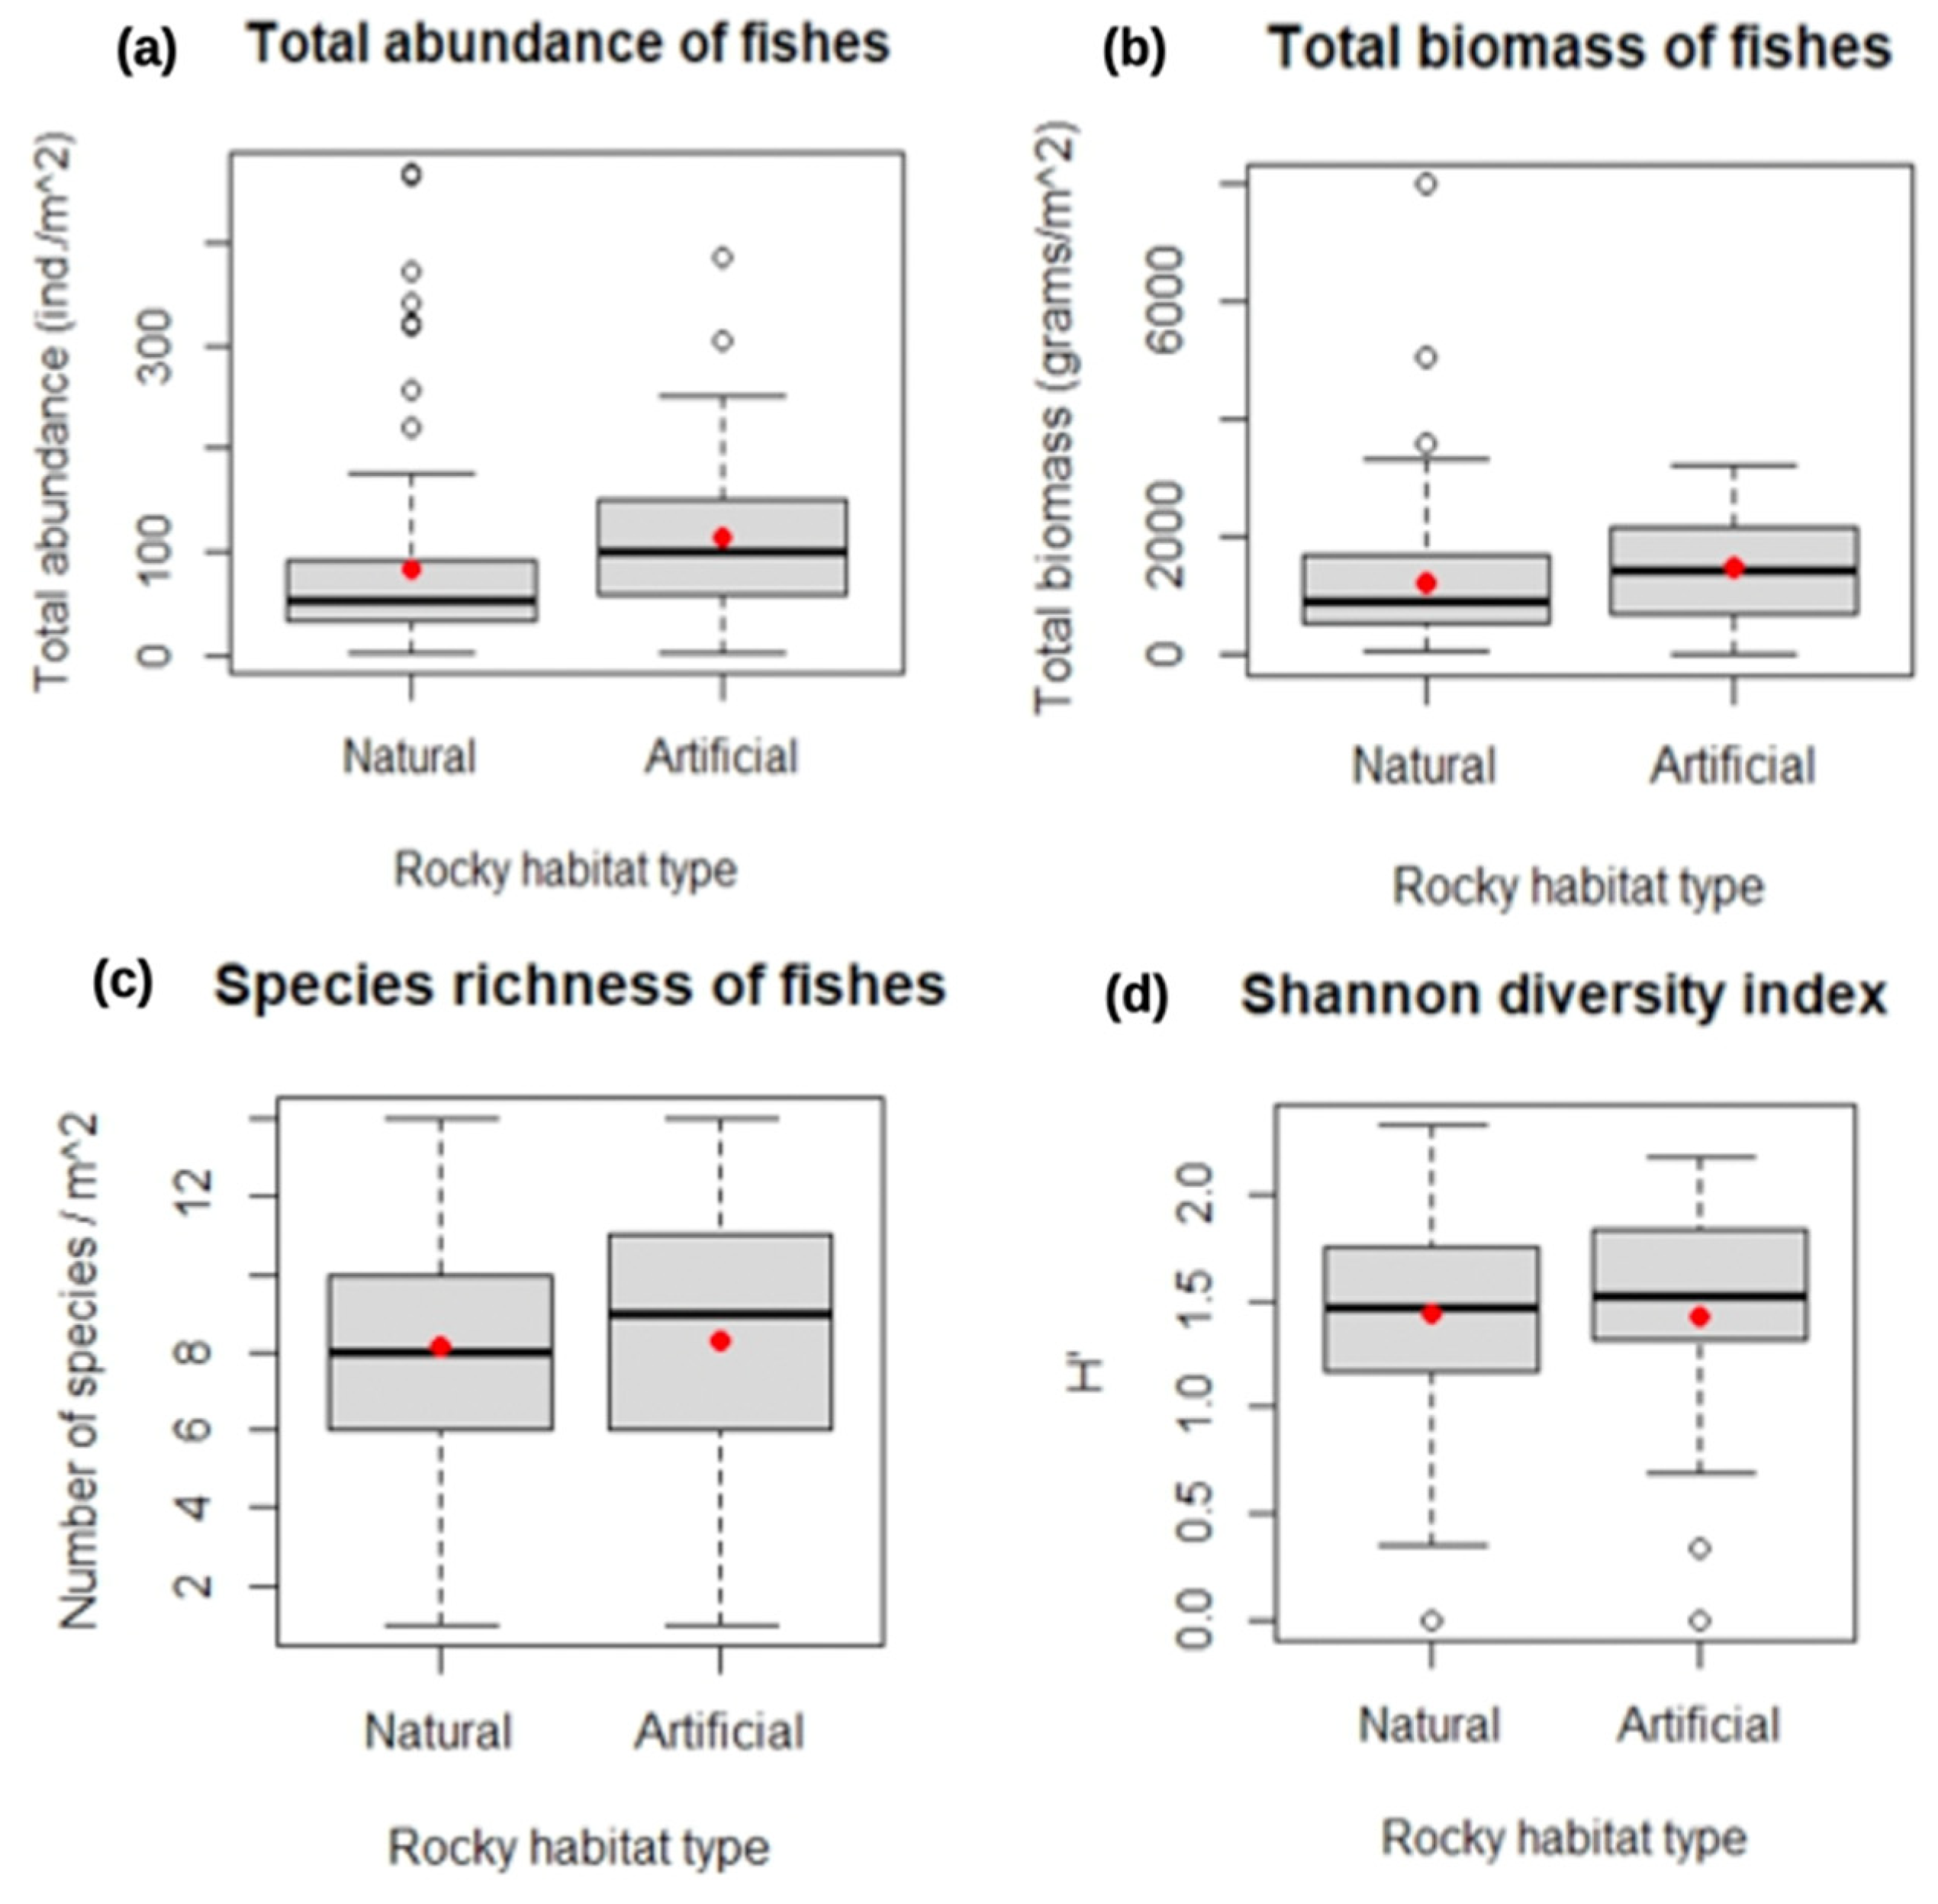
Regarding spatial changes in fish assemblages, total abundance, biomass, and species richness were slightly greater in the artificial habitat than in the natural habitat. Total abundance was 60 ind./m2 in the natural habitat, compared to 100 ind./m2 in the artificial habitat, with significant differences (Table 1, Figure 3a). The total biomass was approximately 1700 g/m2 in the artificial habitat, while in the natural habitat, it was approximately 1000 g/m2, also with significant differences (Figure 3b). Species richness did not show statistical differences between treatments, with 9 species/m2 in the artificial habitat compared to 8 species/m2, but showed a high seasonal variability (Figure 3c). Likewise, the Shannon Index did not show statistical differences between treatments and was quite similar in both habitats, with about 1.5 bit ind−1 of diversity, but showed a high seasonal variability (Figure 3d).

3.3. Relevant Fish Families and Populations

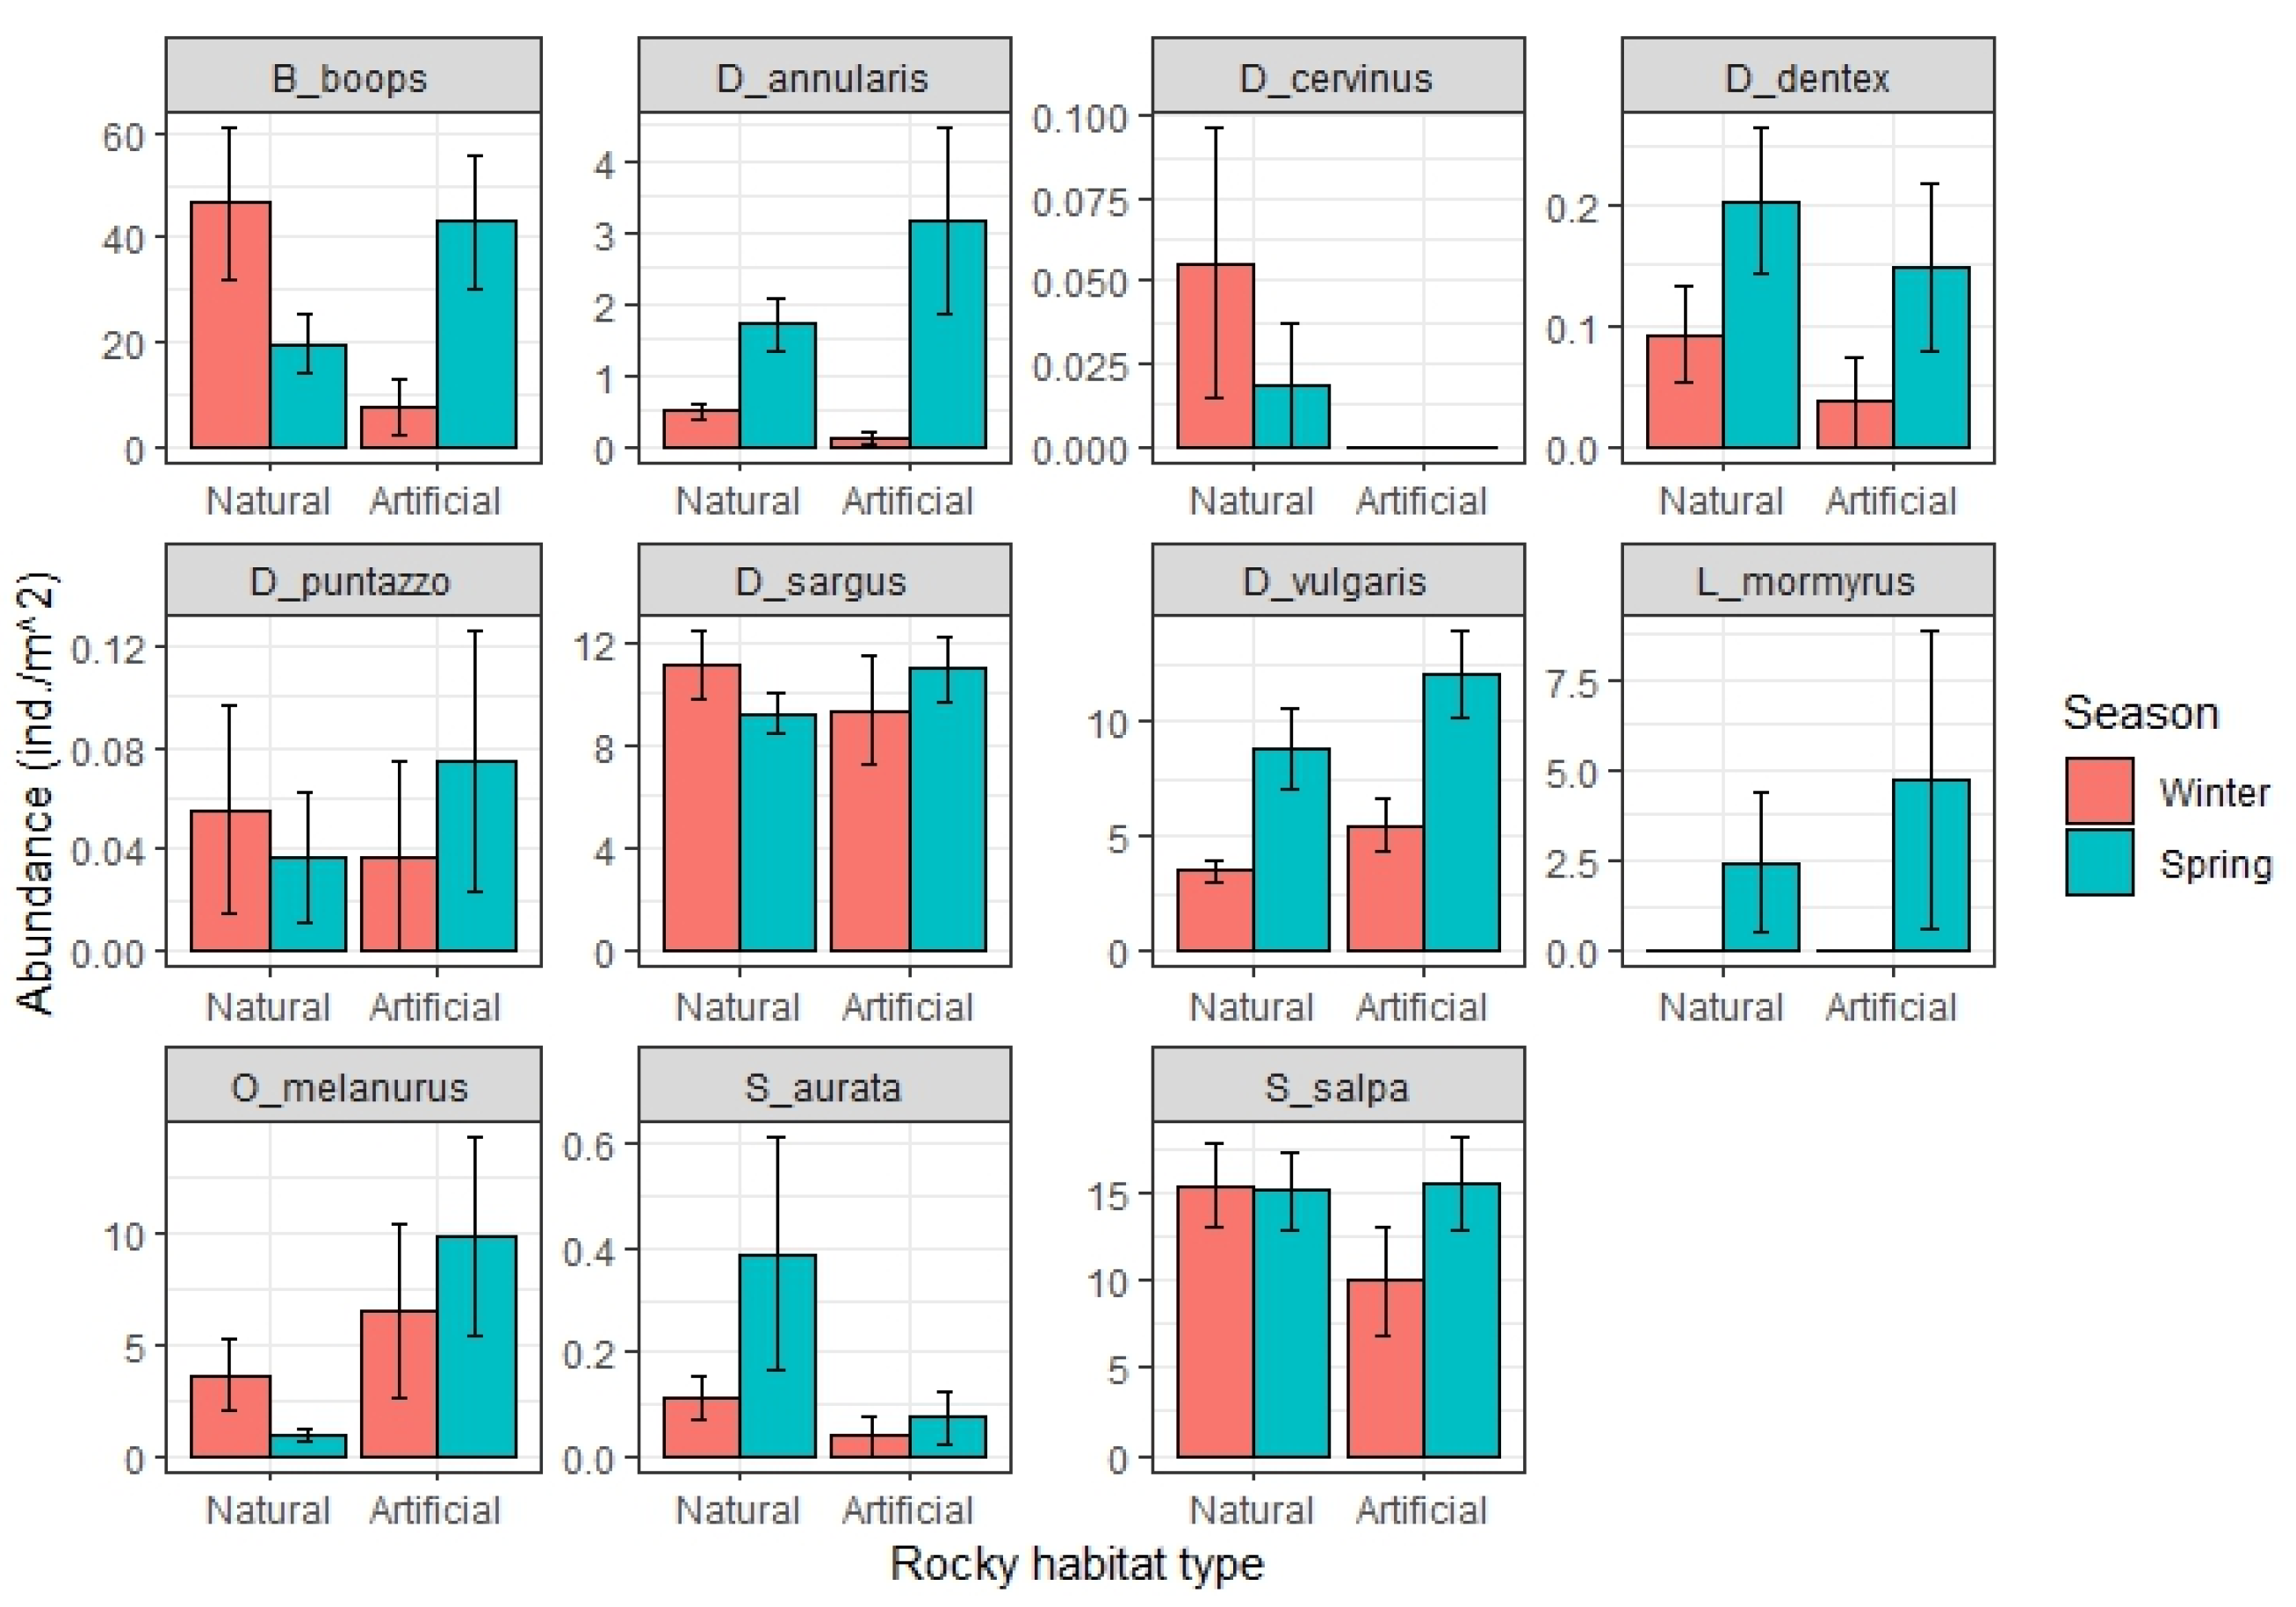
A total of 30 species and 10 families of fish were censused, although only 28 species and 3 families (Labridae, Sparidae, and Serranidae) were the most relevant for the study, in terms of abundances. The family Sparidae was composed of 11 species and showed fluctuations in abundance between the different types of rocky habitat (Figure 4). Species like Sparus aurata and Dentex dentex seemed to be more dominant in the natural habitat; however, they did not show statistical differences between treatments (Table S4). Diplodus cervinus was clearly dominant in the natural habitat, showing significant statistical differences between the different treatments (Table S4). Sarpa salpa and Diplodus sargus were present in both habitats and did not show statistical differences between treatments (Table S4). While the species Diplodus vulgaris is the one that presents the most differences among all the factors studied (Table S4); the artificial habitat is different with respect to the two locations of the natural habitat and these, in turn, are different from each other, and all these also differ with respect to the season.
The family Labridae was composed of nine species and also showed fluctuations in abundance between the different treatments (Figure 5). Species like Labrus viridis and Symphodus tinca appear to be more dominant in the natural habitat; nevertheless, they did not show statistical differences between treatments (Table S5). Symphodus rostratus was also more dominant in the natural habitat, showing statistical differences between treatments and seasons (Table S5). On the other hand, at first glance, it seems that there were more Symphodus cinereus in the artificial habitat, but this species did not show significant differences between treatments (Table S5). Likewise, Symphodus roissali was present in both habitats, showing statistical differences between seasons (Table S5).
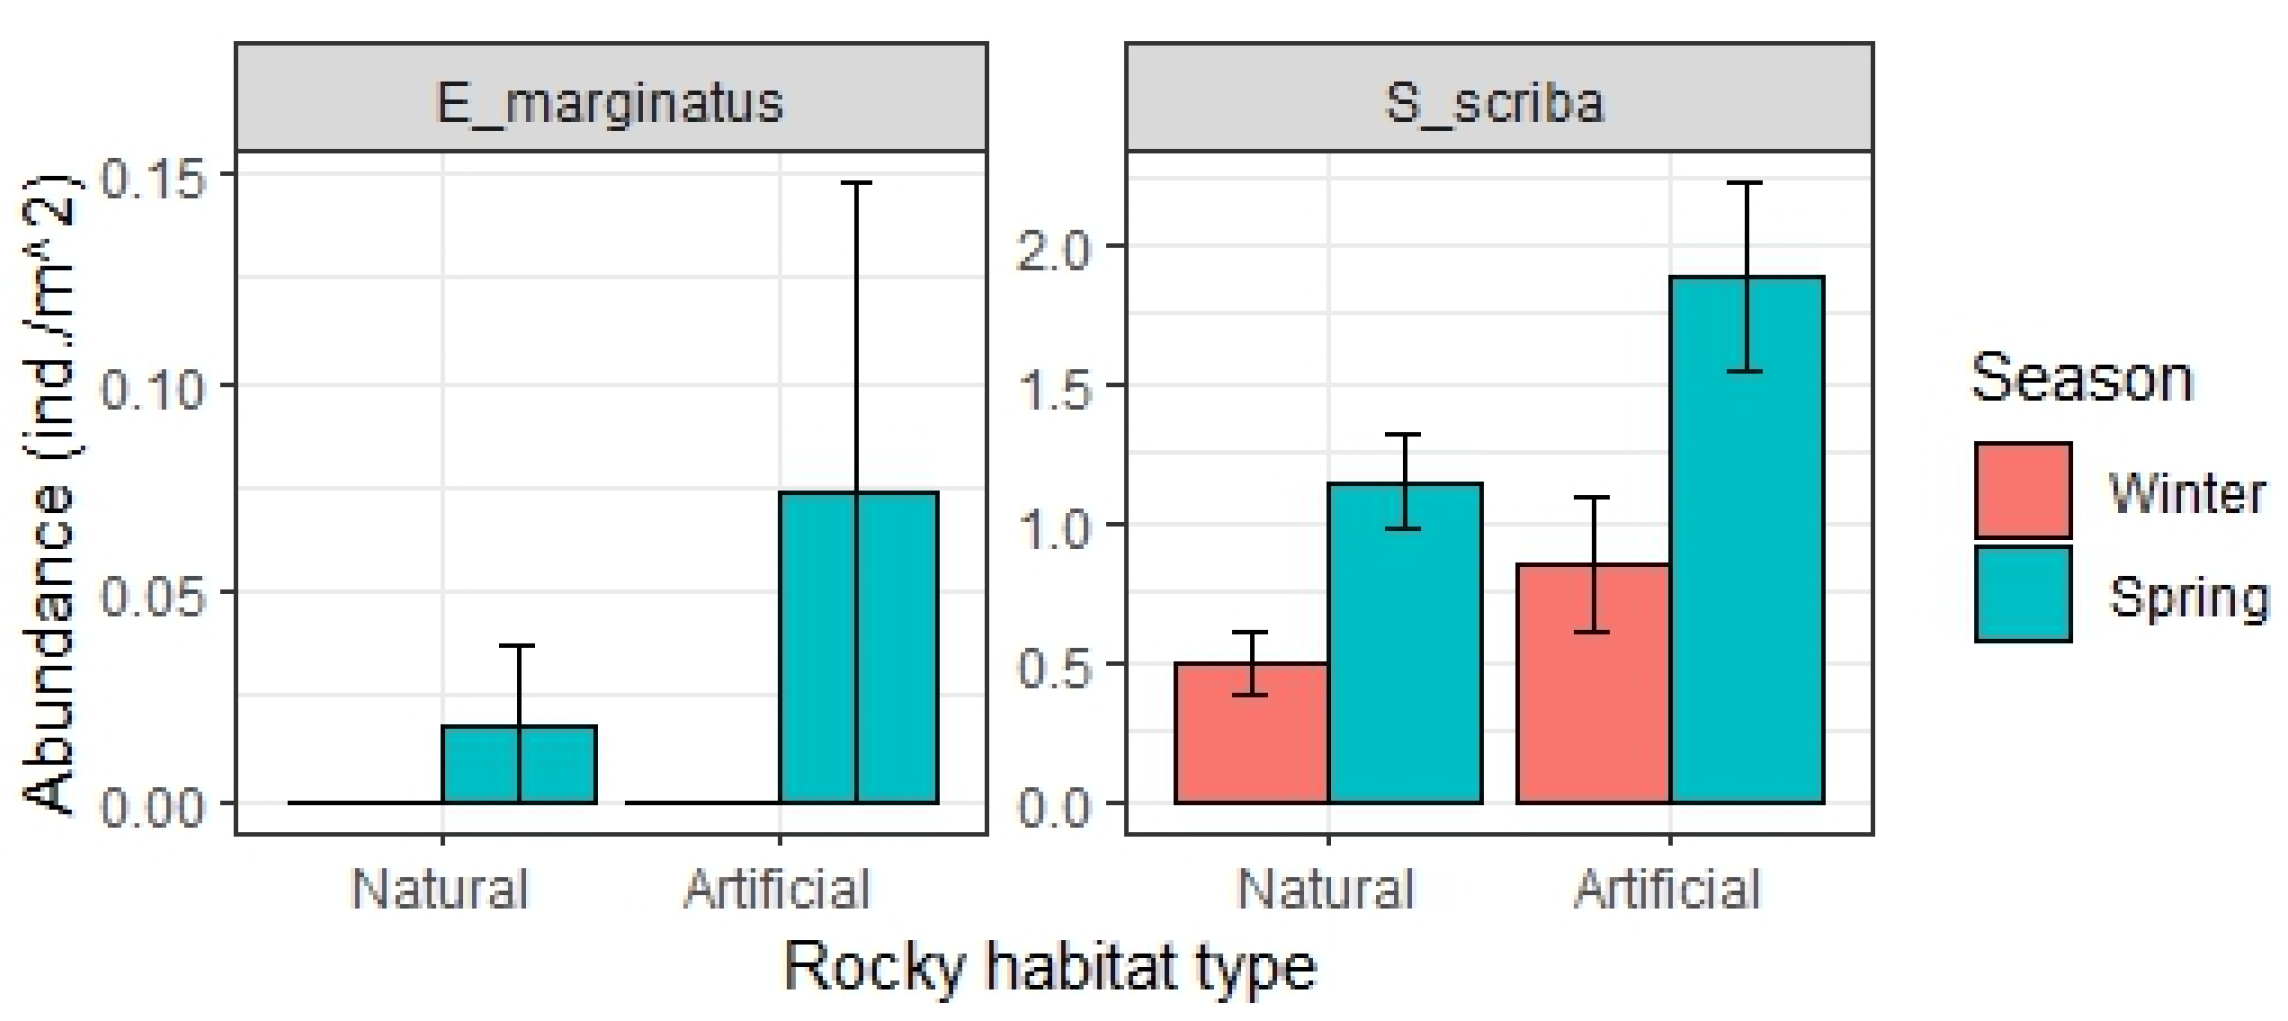
Finally, the family Serranidae was composed of two species, Serranus scriba and Epinephelus marginatus (Figure 6). The latter with an abundance of less than 10%. S. scriba, (Figure 6) along with Dicentrarchus labrax and Chelon auratus (Figure S4), clearly showed a closer connection with the artificial habitat, with significant differences between treatments (Table S4). In addition, there seemed to be more unidentified juveniles in the artificial habitat (Figure S4); however, they did not show significant differences between treatments, although they did differ between seasons (Table S4).

3.4. Multivariate Level Changes of Fish Populations and Relationships with Environmental Variables

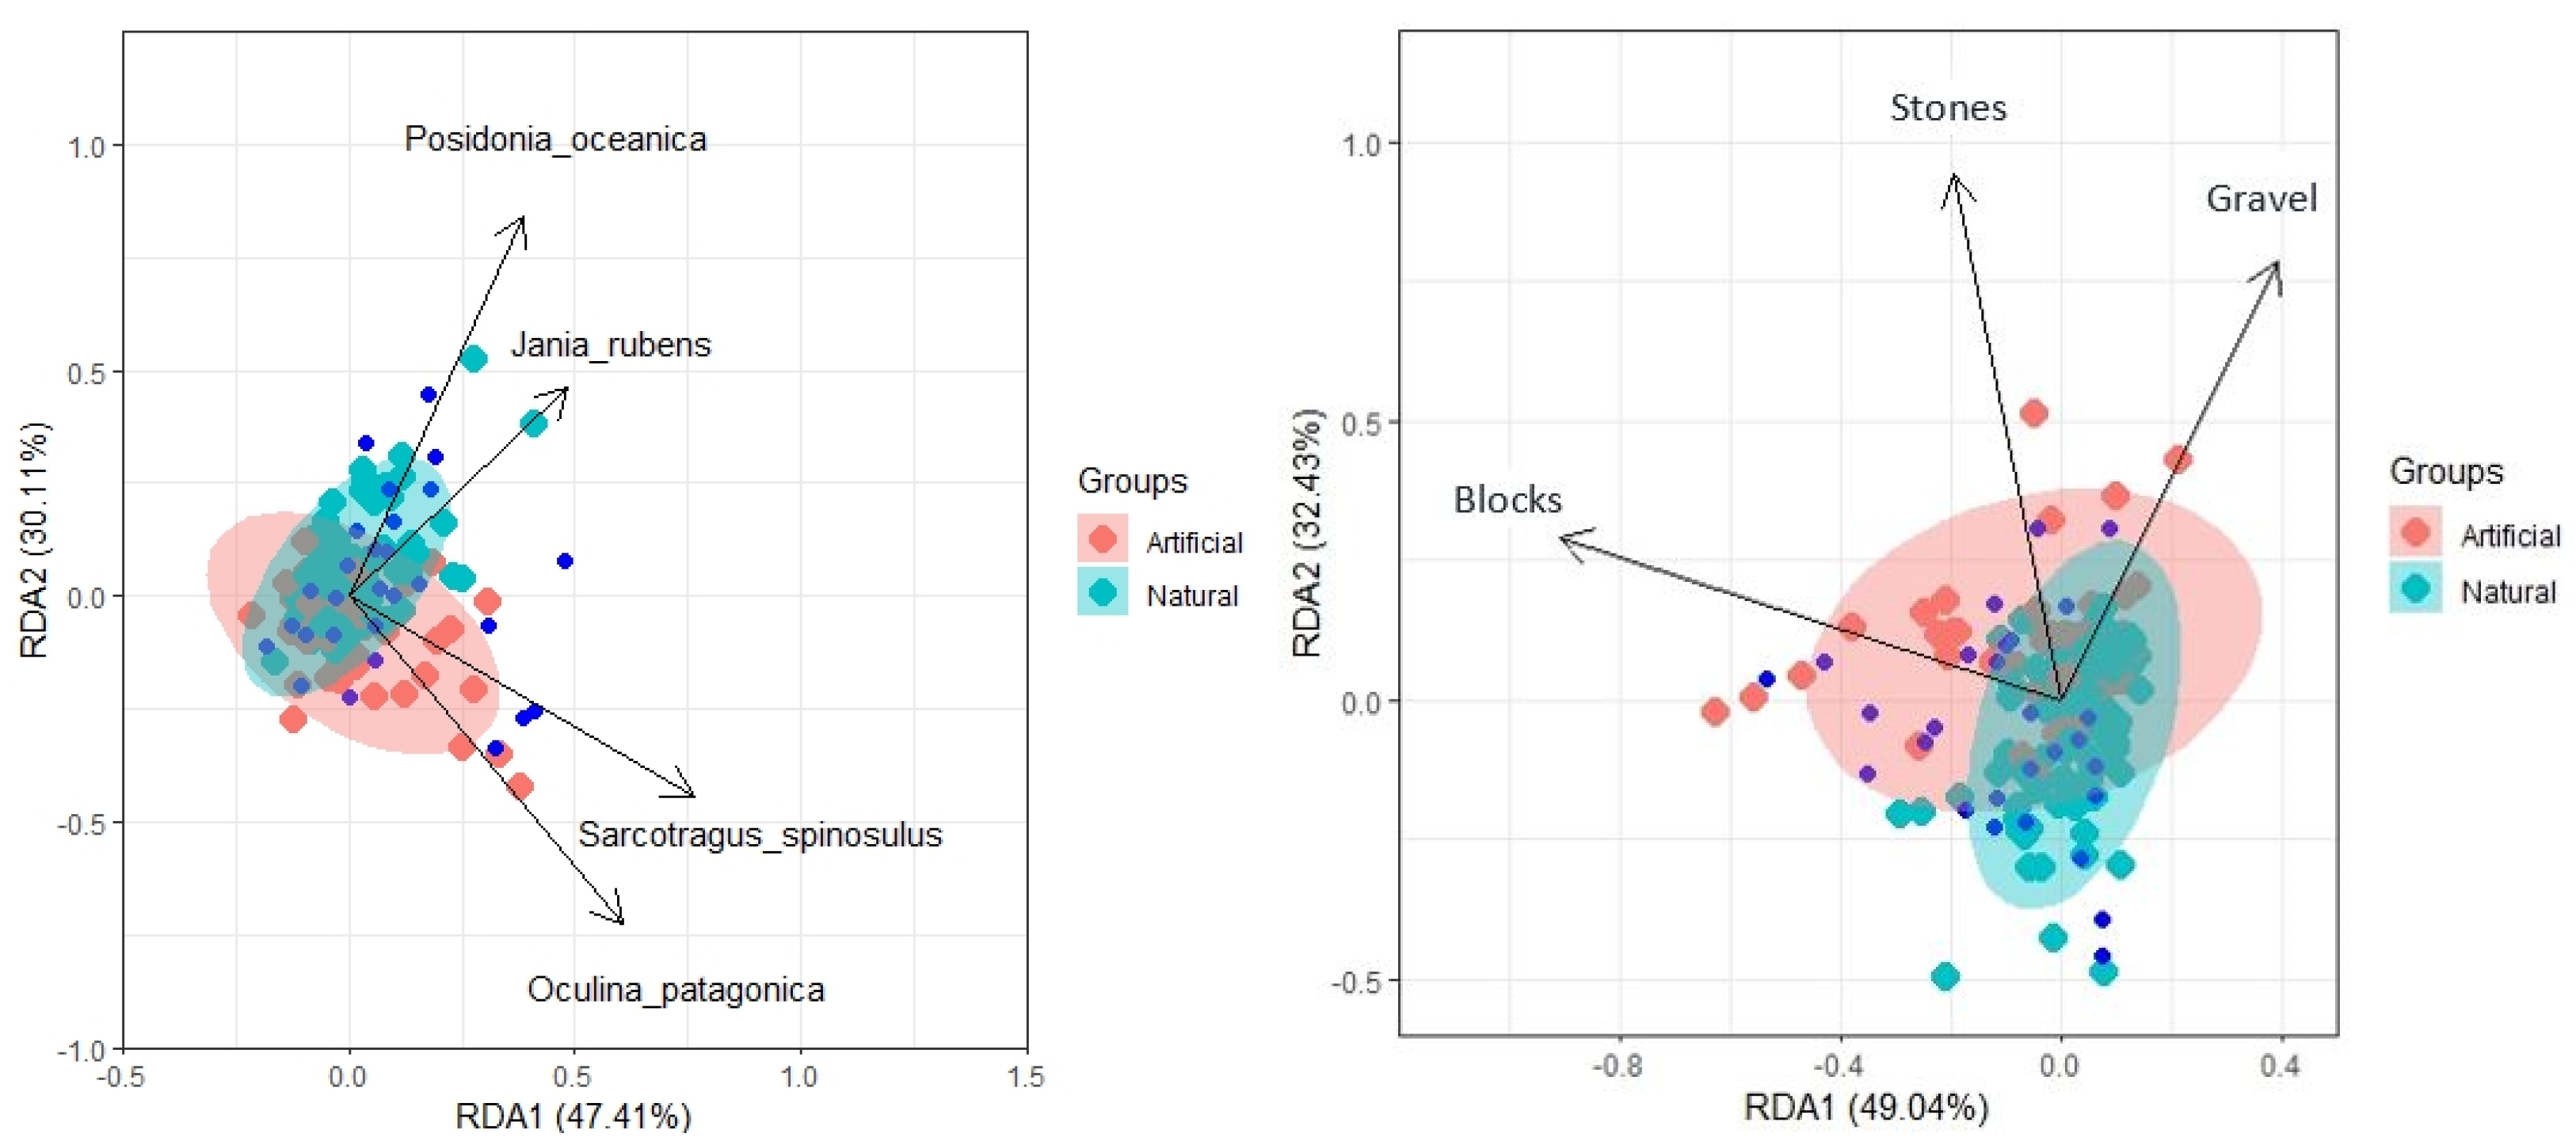
In relation to habitat heterogeneity, the distribution of samples belonging to different treatments in the RDA showed a high level of overlapping (Figure 7). However, there was some degree of ordination along RDA1 (47.41%), with only 30.11% of the variability explained by RDA2. P. oceanica and J. rubens were the relevant habitat features explaining the fish assemblage structure, related to natural habitat. Oppositely, O. patagonica and S. spinosulus were relevant for the artificial habitat (Figure 7). Regarding rocky habitat complexity, the increase in gravel, stones, and blocks was relevant in the artificial habitat, with 49.04% explained in the exe X (RDA1) and 32.43% in the exe Y (RDA2) (Figure 7).

4. Discussion

Following the results of the present study, it could be concluded that, after more than 30 years, the artificial rocky habitat plays a relevant role in terms of being a suitable habitat for fishes. However, there are important changes on habitat complexity and heterogeneity, because, normally, the native vegetation of an area is replaced by coastal urban structures and the physical factors of the habitat are modified [33], which also entails changes in the structure of its biological communities [34]. For example, P. oceanica was eliminated from this area, affecting fish species associated with this relevant habitat. Over the rocky habitat, J. rubens and Cystoseira spp. were present in the natural habitat, being substituted by algae E. elongata, the exotic cnidarian O. patagonica, and the poriferous S. spinosulus. These changes should modify the ecological process because primary producers are replaced by consumers.

4.1. Changes in Habitat Complexity

According to Charton et al. (1998) [35], there is a strong correlation between the reef fish assemblage and the habitat structure descriptors, both vertical complexity and horizontal heterogeneity. In natural rocky habitats, the three-dimensional structure is able to provide shelter from physical stressors and predation [36]. Whereas, in artificial structures, topographic complexity is generally much lower [37] and habitat complexity is strongly reduced, which may decrease functional diversity indexes at the community level, due to the replacement of species with distinct and specialized functional traits by generalist and opportunistic species with broad environmental tolerances [38], leading to the loss of native species [39]. In our study, the fish community associated with the artificial rocky habitat showed a similar taxonomic structure to the control area, with species substitution, but no abrupt changes in terms of diversity, abundance, or biomass. Therefore, despite these habitat changes produced in the artificial habitat, the spatial arrangement of blocks, stones, and gravel seems to allow a relatively well-structured community. Although, their composition and functionality has been altered, since, even though both habitats have species in common, as mentioned before, the artificial habitat replaces native specialist species, such as L. viridis and S. rostratus, which seek shelter and food in P. oceanica meadows. The increase in juveniles at the artificial habitat could explain the occasional encounter with predators such as D. labrax. Also, the enrichment of particulate organic matter (POM) accumulated in Puerto Amor, due to the reduced hydrodynamism, could favor the presence of C. auratus, which benefits from it.

4.2. Degradation of Relevant Habitats

P. oceanica serves as a critical marine habitat in the Mediterranean, contributing to biodiversity, carbon sequestration, erosion prevention, fisheries, and overall coastal ecosystem health. Understanding and preserving the ecological functions of this seagrass species are essential for the sustainable management of Mediterranean coastal environments. Therefore, the conservation of P. oceanica is of paramount importance, due to its ecological significance. However, these seagrass meadows are facing threats from human activities, such as coastal development [40], especially the constructions of marinas [41]. In our study, P. oceanica meadows were present in the shallow habitat where the docks of Puerto Amor were constructed (Figure 1). The reduction in seagrass cover has a relevant effect on fish assemblages, because these provide a structurally complex habitat, offering shelter and feeding areas for a wide variety of fish species. Changes in the abundance of species belonging to the family Labridae, such as L. viridis or Symphodus spp., are already found [42].

4.3. Heterogeneity

The heterogeneity of both artificial and natural rocky habitats plays a crucial role in influencing algae cover, which, in turn, has significant implications for fish assemblages. Understanding this relationship is essential for assessing the overall ecological dynamics of these habitats, because habitat heterogeneity is a key driver of species diversity and community structure in marine ecosystems [43]. In the context of rocky habitats, variations in substrate type, rugosity, and structural complexity contribute to the creation of diverse microhabitats. This diversity, in turn, affects the distribution and abundance of algae. Natural rocky habitats often exhibit a higher degree of heterogeneity, providing a range of niches for different algal species to establish and thrive. In contrast, artificial rocky habitats, such as those created in the construction of structures like seawalls and breakwaters, may initially lack the complexity and diversity seen in natural formations. This can impact the availability of suitable surfaces and niches for algae attachment and growth. As highlighted by Ferrario et al. (2016) [44], biological factors influencing the growth of canopy algae, such as herbivory or other non-consumptive disturbances, can differ substantially between artificial and natural habitats, affecting the growth of canopies of Cystoseria spp. Algae cover is a critical component of marine ecosystems, as it serves as a primary producer, forming the base of the food web. Fish species, especially those in rocky habitats, often rely on algae as a source of food and shelter. Therefore, in the context of the discussed study comparing artificial and natural rocky habitats, the heterogeneity of the habitats is likely to influence the algae cover, subsequently affecting fish assemblages. Natural rocky habitats, with their inherent heterogeneity, may support a more diverse and abundant array of algae, providing a richer food source and habitat structure for fish. In contrast, the artificial rocky habitat, which may lack the same degree of heterogeneity, could experience limitations in algae cover, potentially impacting the availability of resources for fish.
Likewise, the native cover of the environment is essential to preserve functionally distinct species and maintain the balance of the functional structure [45] and, as discussed above, this has been altered by the Puerto Amor development. The decline of functionally distinct species may culminate in the functional homogenization of the ecosystem [46]. So, while artificial coastal infrastructures, such as Puerto Amor, provide a habitat for a wide variety of rocky intertidal organisms, there is growing evidence that they support intertidal assemblages that differ from natural habitats, affecting the taxonomic diversity of fish populations [47], which are generally considered functionally poor substitutes for the habitats they replace [48], as has been demonstrated in the present study. Additionally, artificial habitats in marine ecosystems, like those created for various purposes such as coastal infrastructure or aquaculture, can be used as a priority habitat by exotic or invasive species. O. patagonica, for instance, is a species that can outcompete native species for resources and disrupt the balance of the ecosystem, even when it is not clear if it is an introduced species [49]. The invasion of O. patagonica has raised concerns about its ecological impact on native marine communities. It can outcompete native species for space and resources, leading to changes in community composition and biodiversity. The dense colonies formed by O. patagonica can alter the physical structure of marine habitats. This alteration may impact the availability of suitable habitats for native species and disrupt the natural balance of the ecosystem.

5. Conclusions

The ecological restoration of degraded marine coastal ecosystems is imperative for safeguarding biodiversity, promoting ecosystem resilience, and sustaining vital ecological functions. Human activities, including coastal development, pollution, and habitat destruction, have significantly impacted these ecosystems. The need for the ecological restoration of coastal marine ecosystems underscores a commitment to preserve marine biodiversity and functional ecology, as is the case of Puerto Amor in Alicante. The present study underscores the importance of rocky habitat structures for fish assemblages in the study area and highlights the potential consequences of habitat modification.
Considering that the alteration of the habitat has affected the fish assemblages, but without diminishing the abundance, biomass, and species richness, it can be inferred that the artificial rocky habitat resulting from the attempted construction of Puerto Amor hosts fish populations of a certain ecological value. One option for the ecological restoration of this area involves eliminating the docks. However, such a removal could lead to undesired impacts, given the well-established settlements. As an alternative environmental restoration measure, it would be advisable to ecologically restore the area by reimplanting P. oceanica, which was destroyed during the port construction. This approach aims to recover native species and restore the natural functional diversity of the Cabo de la Huerta environment.
Regarding the reduction in algae cover, a fact that is quite worrying for the maintenance of the balance of an ecosystem is the culmination in functional homogenization of the species. Therefore, it could be interesting to improve the habitat heterogeneity of these docks. With the purpose of increasing and/or improving the habitat for biodiversity, adaptations can be made to coastal artificial structures to encourage the colonization and survival of intertidal species, a process termed ‘ecological enhancement’ or ‘ecological engineering’. The restoration of the algae population could be also an option for increasing habitat heterogeneity based on primary producers, especially for important shallow coastal habitats such as Cystoseira forest.
Likewise, in relation to the decision to eliminate the Puerto Amor breakwaters and recover the unaltered conditions of Almadraba Beach as a restoration measure, it would be necessary to expand the study and carry out a deeper exploration of the physical mechanisms that have been modified by the construction of this project and that are generating an impact on its surroundings, especially due to the hypersedimentation of fines in the innermost area of the bay.

Supplementary Materials

The following supporting information can be downloaded at: https://www.mdpi.com/article/10.3390/oceans5020015/s1, Figure S1. Percentage of coverture of the main habitats (mean ± standard error) surrounding the rocky habitat depending on the locations and the seasons, Figure S2. Physical variables that characterized the complexity of rocky habitat (mean ± standard error) depending on the locations and the seasons, Figure S3. Percentage of coverture of the algae and benthic animals (mean ± standard error) over the rocky habitat depending on the locations and the seasons, Figure S4. Abundance of other species (mean ± standard error) depending on the locations and the seasons, Table S1. Univariate PERMANOVAs of main habitats features, Table S2. Univariate PERMANOVAs of the characterization of the rock, Table S3. Univariate PERMANOVAs of the rock cover features, Table S4. Univariate PERMANOVAs of the Sparidae family, Table S5. Univariate PERMANOVAs of dominant species of the Labridae family species in natural rocky habitat, Table S6. Univariate PERMANOVAs of the Serranidae family species and C. auratus and D. labrax.

Author Contributions

Conceptualization, P.S.-J.; investigation, L.G.-S.; data curation, P.S.-J. and L.G.-S.; writing—original draft preparation, L.G.-S.; writing—review and editing, P.S.-J.; supervision, P.S.-J. All authors have read and agreed to the published version of the manuscript.

Funding

Research Productivity Grants for Research Groups of the University of Alicante 2022. Reference: VIGROB22-015.

Institutional Review Board Statement

Not applicable.

Data Availability Statement

Data can be made available upon request to the authors of the paper.

Conflicts of Interest

The authors declare no conflict of interest.

References

  1. Samourdani, A.; Tzanatos, E. Fish distribution and behavior with regard to the time of day and the anthropogenic structural modification of the shallow littoral. J. Fish Biol. 2022, 100, 820–830. [Google Scholar] [CrossRef] [PubMed]
  2. Molina, R.; Anfuso, G.; Manno, G.; Gracia-Prieto, F.J. The Mediterranean Coast of Andalusia (Spain): Medium-Term Evolution and Impacts of Coastal Structures. Sustainability 2019, 11, 3539. [Google Scholar] [CrossRef]
  3. Dahlgren, C.P.; Eggleston, D.B. Ecological processes underlying ontogenetic habitat shifts in a coral reef fish. Ecology 2000, 81, 2227–2240. [Google Scholar] [CrossRef]
  4. Airoldi, L.; Beck, M.W. Loss, status and trends for coastal marine habitats of Europe. Oceanogr. Mar. Biol. 2007, 45, 345–405. [Google Scholar] [CrossRef]
  5. Bray, M.J.; Hooke, J.M. Prediction of soft-cliff retreat with accelerating sea-level rise. J. Coast. Res. 1997, 13, 453–467. [Google Scholar]
  6. Dulvy, N.K.; Jennings, S.; Rogers, S.I.; Maxwell, D.L. Threat and decline in fishes: An indicator of marine biodiversity. Canadian J. Fisher. Aqua. Scien. 2006, 63, 1267–1275. [Google Scholar] [CrossRef]
  7. García-Charton, J.A.; Pérez-Ruzafa, A.; Sánchez-Jerez, P.; Bayle-Sempere, J.T.; Reñones, O.; Moreno, D. Multi-scale spatial heterogeneity, habitat structure, and the effect of marine reserves on Western Mediterranean rocky reef fish assemblages. Mar. Biol. 2004, 144, 161–182. [Google Scholar] [CrossRef]
  8. López, I.; Aragonés, L.; Villacampa, Y. Analysis and modelling of cross-shore profile of gravel beaches in the province of Alicante. Ocean Eng. 2016, 118, 173–186. [Google Scholar] [CrossRef]
  9. Martínez, C. Estudio de Soluciones de las Obras de Abrigo y Ordenación Interior del Puerto Deportivo “Puerto Amor” (TM Alicante). Doctoral Thesis, Polytechnic University of Valencia, Valencia, Spain, 2016. [Google Scholar]
  10. Aragonés, L.; García-Barba, J.; Villacampa, Y.; López, I.; Gómez-Martín, M.E.; Pagán, J.I. Sustainable Development City-Beach in Alicante Sustainable Development City-Beach in Alicante. Int. J. Sustain. Dev. Plan. 2017, 12, 704–712. [Google Scholar] [CrossRef]
  11. Diario de Alicante. Compromís Pide Rehabilitar la Zona del ‘Fallido’ Puerto Amor. Available online: https://diariodealicante.net/compromis-rehabilitar-puerto-amor/ (accessed on 10 July 2023).
  12. Chou, L.M.; Lim, G.S.Y.; Leng, C.B. An assessment of fish communities of artificial reef structures in Brunei Darussalam with recommendations for management and development. Res. Manag. Opt. 1991, 1, 15–31. [Google Scholar]
  13. Lindfield, S.J.; Harvey, E.S.; McIlwain, J.L.; Halford, A.R. Silent fish surveys: Bubble-free diving highlights inaccuracies associated with SCUBA-based surveys in heavily fished areas. Meth. Ecol. Evol. 2014, 5, 1061–1069. [Google Scholar] [CrossRef]
  14. Europa.eu. N2K ES5213032 Dataforms (s.f.). Available online: https://natura2000.eea.europa.eu/Natura2000/SDF.aspx?site=ES5213032 (accessed on 16 November 2023).
  15. Harmelin-Vivien, M.L.; Harmelin, J.G.; Chauvet, C.; Duval, C.; Galzin, R.; Lejeune, P.; Barnabe, G.; Blanc, F.; Chevalier, R.; Duclerc, J.; et al. Evaluation visuelle des peuplements et populations de poissons méthodes et problèmes. Rev. D’ecol. Terre Vie 1985, 40, 467–539. [Google Scholar] [CrossRef]
  16. Valle, C.; Bayle, J.; Ramos, A. Weight-length relationships for selected fish species of the western Mediterranean Sea. J. App. Ichth. 2003, 19, 261–262. [Google Scholar] [CrossRef]
  17. R Core Team. R: A Language and Environment for Statistical Computing. In Foundation for Statistical Computing; R Core Team: Vienna, Austria, 2022; Available online: https://www.R-project.org/ (accessed on 1 December 2023).
  18. Wickham, H.; Hester, J.; Bryan, J. Readr: Read Rectangular Text Data. R Package Version 2.1.4. Available online: https://CRAN.R-project.org/package=readr (accessed on 1 December 2023).
  19. Morales, M. Team wcdbtRDC, Community wgaftRl, Murdoch. eD. sciplot: Scientific Graphing Functions for Factorial Designs. R Package Version 1.2-0. Available online: https://CRAN.R-project.org/package=sciplot (accessed on 1 December 2020).
  20. Wickham, H.; Averick, M.; Bryan, J.; Chang, W.; McGowan, L.D.; François, R.; Grolemund, G.; Hayes, A.; Henry, L.; Hester, J.; et al. Welcome to the tidyverse. J. Open Source Softw. 2019, 4, 1686. [Google Scholar] [CrossRef]
  21. Oksanen, J.; Simpson, G.; Blanchet, F.; Kindt, R.; Legendre, P.; Minchin, P.; O’Hara, R.; Solymos, P.; Stevens, M.; Szoecs, E.; et al. Vegan: Community Ecology Package. R Package Version 2.6-4. Available online: https://CRAN.R-project.org/package=vegan (accessed on 1 December 2020).
  22. Slowikowski, K. Ggrepel: Automatically Position Non-Overlapping Text Labels with ‘ggplot2’. R Package Version 0.9.3. Available online: https://CRAN.R-project.org/package=ggrepel (accessed on 1 December 2023).
  23. Beck, M. Ggord: Ordination Plots with ggplot2. R package version 1.1.7. 2022. Available online: https://fawda123.github.io/ggord/ (accessed on 1 December 2023).
  24. Heine, J. Pairwise: Rasch Model Parameters by Pairwise Algorithm. R Package Version 0.6.1-0. Available online: https://CRAN.R-project.org/package=pairwise (accessed on 1 December 2023).
  25. Wei, T.; Simko, V. R package ‘corrplot’: Visualization of a Correlation Matrix (Version 0.92). Available online: https://github.com/taiyun/corrplot (accessed on 1 December 2021).
  26. Waring, E.; Quinn, M.; McNamara, A.; Arino de la Rubia, E.; Zhu, H.; Ellis, S. Skimr: Compact and Flexible Summaries of Data. R Package Version 2.1.5. Available online: https://CRAN.R-project.org/package=skimr (accessed on 1 December 2022).
  27. Sjoberg, D.D.; Whiting, K.; Curry, M.; Lavery, J.A.; Larmarange, J. Reproducible summary tables with the gtsummary package. R J. 2021, 13, 570–580. [Google Scholar] [CrossRef]
  28. Dowle, M.; Srinivasan, A. Data.table: Extension of ‘data.frame’. R Package Version 1.14.8. Available online: https://CRAN.R-project.org/package=data.table (accessed on 1 December 2023).
  29. Xie, Y. Knitr: A General-Purpose Package for Dynamic Report Generation in R. R Package Version 1.41. 2022. Available online: https://rdrr.io/cran/knitr/ (accessed on 1 December 2023).
  30. Lüdecke, D. SjPlot: Data Visualization for Statistics in Social Science. R Package Version 2.8.14. Available online: https://CRAN.R-project.org/package=sjPlot (accessed on 1 December 2023).
  31. Zhu, H. KableExtra: Construct Complex Table with ‘kable’ and Pipe Syntax. R Package Version 1.3.4. Available online: https://CRAN.R-project.org/package=kableExtra (accessed on 1 December 2021).
  32. Hugh-Jones, D. Huxtable: Easily Create and Style Tables for LaTeX, HTML and Other Formats. R Package Version 5.5.2. Available online: https://CRAN.R-project.org/package=huxtable (accessed on 1 December 2022).
  33. Groffman, P.M.; Bain, D.J.; Band, L.E.; Belt, K.T.; Brush, G.S.; Grove, J.M.; Pouyat, R.V.; Yesilonis, I.C.; Zipperer, W.C. Down by the Riverside: Urban Riparian Ecology. Front. Ecol. Env. 2003, 1, 315–321. [Google Scholar] [CrossRef]
  34. Thompson, K.; Austin, K.C.; Smith, R.M.; Warren, P.H.; Angold, P.G.; Gaston, K.J. Urban domestic gardens (I): Putting small-scale plant diversity in context. J. Veg. Sci. 2003, 14, 71–78. [Google Scholar] [CrossRef]
  35. Charton, J.A.G.; Ruzafa, A.P. Correlation between habitat structure and a rocky reef fish assemblage in the Southwest Mediterranean. Mar. Ecol. 1998, 19, 111–128. [Google Scholar] [CrossRef]
  36. Aguilera, M.A.; Broitman, B.R.; Thiel, M. Spatial variability in community composition on a granite breakwater versus natural rocky shores: Lack of microhabitats suppresses intertidal biodiversity. Mar. Poll. Bull. 2014, 87, 257–268. [Google Scholar] [CrossRef]
  37. Moschella, P.S.; Abbiati, M.; Åberg, P.; Airoldi, L.; Anderson, J.M.; Bacchiocchi, F.; Bulleri, F.; Dinesen, G.E.; Frost, M.; Gacia, E.; et al. Low-crested coastal defence structures as artificial habitats for marine life: Using ecological criteria in design. Coast. Eng. 2005, 52, 1053–1071. [Google Scholar] [CrossRef]
  38. Pledger, A.G.; Brewin, P.; Mathers, K.L.; Phillips, J.; Wood, P.J.; Yu, D. The effects of water injection dredging on low-salinity estuarine ecosystems: Implications for fish and macroinvertebrate communities. Ecol. Indic. 2021, 122, 107244. [Google Scholar] [CrossRef]
  39. Cruz, L.C.; Pompeu, P.S. Drivers of fish assemblage structures in a Neotropical urban watershed. Urb. Ecosys. 2020, 23, 819–829. [Google Scholar] [CrossRef]
  40. Ruiz, J.M.; Romero, J. Effects of disturbances caused by coastal constructions on spatial structure, growth dynamics and photosynthesis of the seagrass Posidonia oceanica. Mar. Poll. Bull. 2003, 46, 1523–1533. [Google Scholar] [CrossRef] [PubMed]
  41. Fernández-Torquemada, Y.; González-Correa, J.M.; Martínez, J.E.; Sánchez-Lizaso, J.L. Evaluation of the effects produced by the construction and expansion of marinas on Posidonia oceanica (L.) Delile meadows. J. Coast. Res. 2005, 49, 94–99. [Google Scholar]
  42. Sánchez-Jerez, P.; Ramos Esplá, A. Detection of environmental impacts by bottom trawling on Posidonia oceanica (L.) Delile meadows: Sensitivity of fish and macroinvertebrate communities. J. Aqua. Ecosys. Health 1996, 5, 239–253. [Google Scholar] [CrossRef]
  43. Levin, L.A.; Sibuet, M.; Gooday, A.J.; Smith, C.R.; Vanreusel, A. The roles of habitat heterogeneity in generating and maintaining biodiversity on continental margins: An introduction. Mar. Ecol. 2010, 31, 1–5. [Google Scholar] [CrossRef]
  44. Ferrario, F.; Iveša, L.; Jaklin, A.; Perkol-Finkel, S.; Airoldi, L. The overlooked role of biotic factors in controlling the ecological performance of artificial marine habitats. J. App. Ecol. 2016, 53, 16–24. [Google Scholar] [CrossRef]
  45. Clavel, J.; Julliard, R.; Devictor, V. Worldwide decline of specialist species: Toward a global functional homogenization? Front. Ecol. Env. 2011, 9, 222–228. [Google Scholar] [CrossRef]
  46. Dala-Corte, R.B.; Melo, A.S.; Siqueira, T.; Bini, L.M.; Martins, R.T.; Cunico, A.M.; Pes, A.M.; Magalhães, A.L.B.; Godoy, B.S.; Leal, C.G.; et al. Thresholds of freshwater biodiversity in response to riparian vegetation loss in the Neotropical region. J. App. Ecol. 2020, 57, 1391–1402. [Google Scholar] [CrossRef]
  47. Evans, A.J.; Firth, L.B.; Hawkins, S.J.; Morris, E.S.; Goudge, H.; Moore, P. Drill-cored rock pools: An effective method of ecological enhancement on artificial structures. Mar. Freshwat. Res. 2015, 67, 123–130. [Google Scholar] [CrossRef]
  48. Leydet, K.P.; Hellberg, M.E. The invasive coral Oculina patagonica has not been recently introduced to the Mediterranean from the western Atlantic. BMC Evol. Biol. 2015, 15, 79. [Google Scholar] [CrossRef] [PubMed]
  49. FAO; SER; IUCN CEM. Standards of Practice to Guide Ecosystem Restoration. A Contribution to the United Nations Decade on Ecosystem Restoration; FAO: Rome, Italy, 2023. [Google Scholar] [CrossRef]
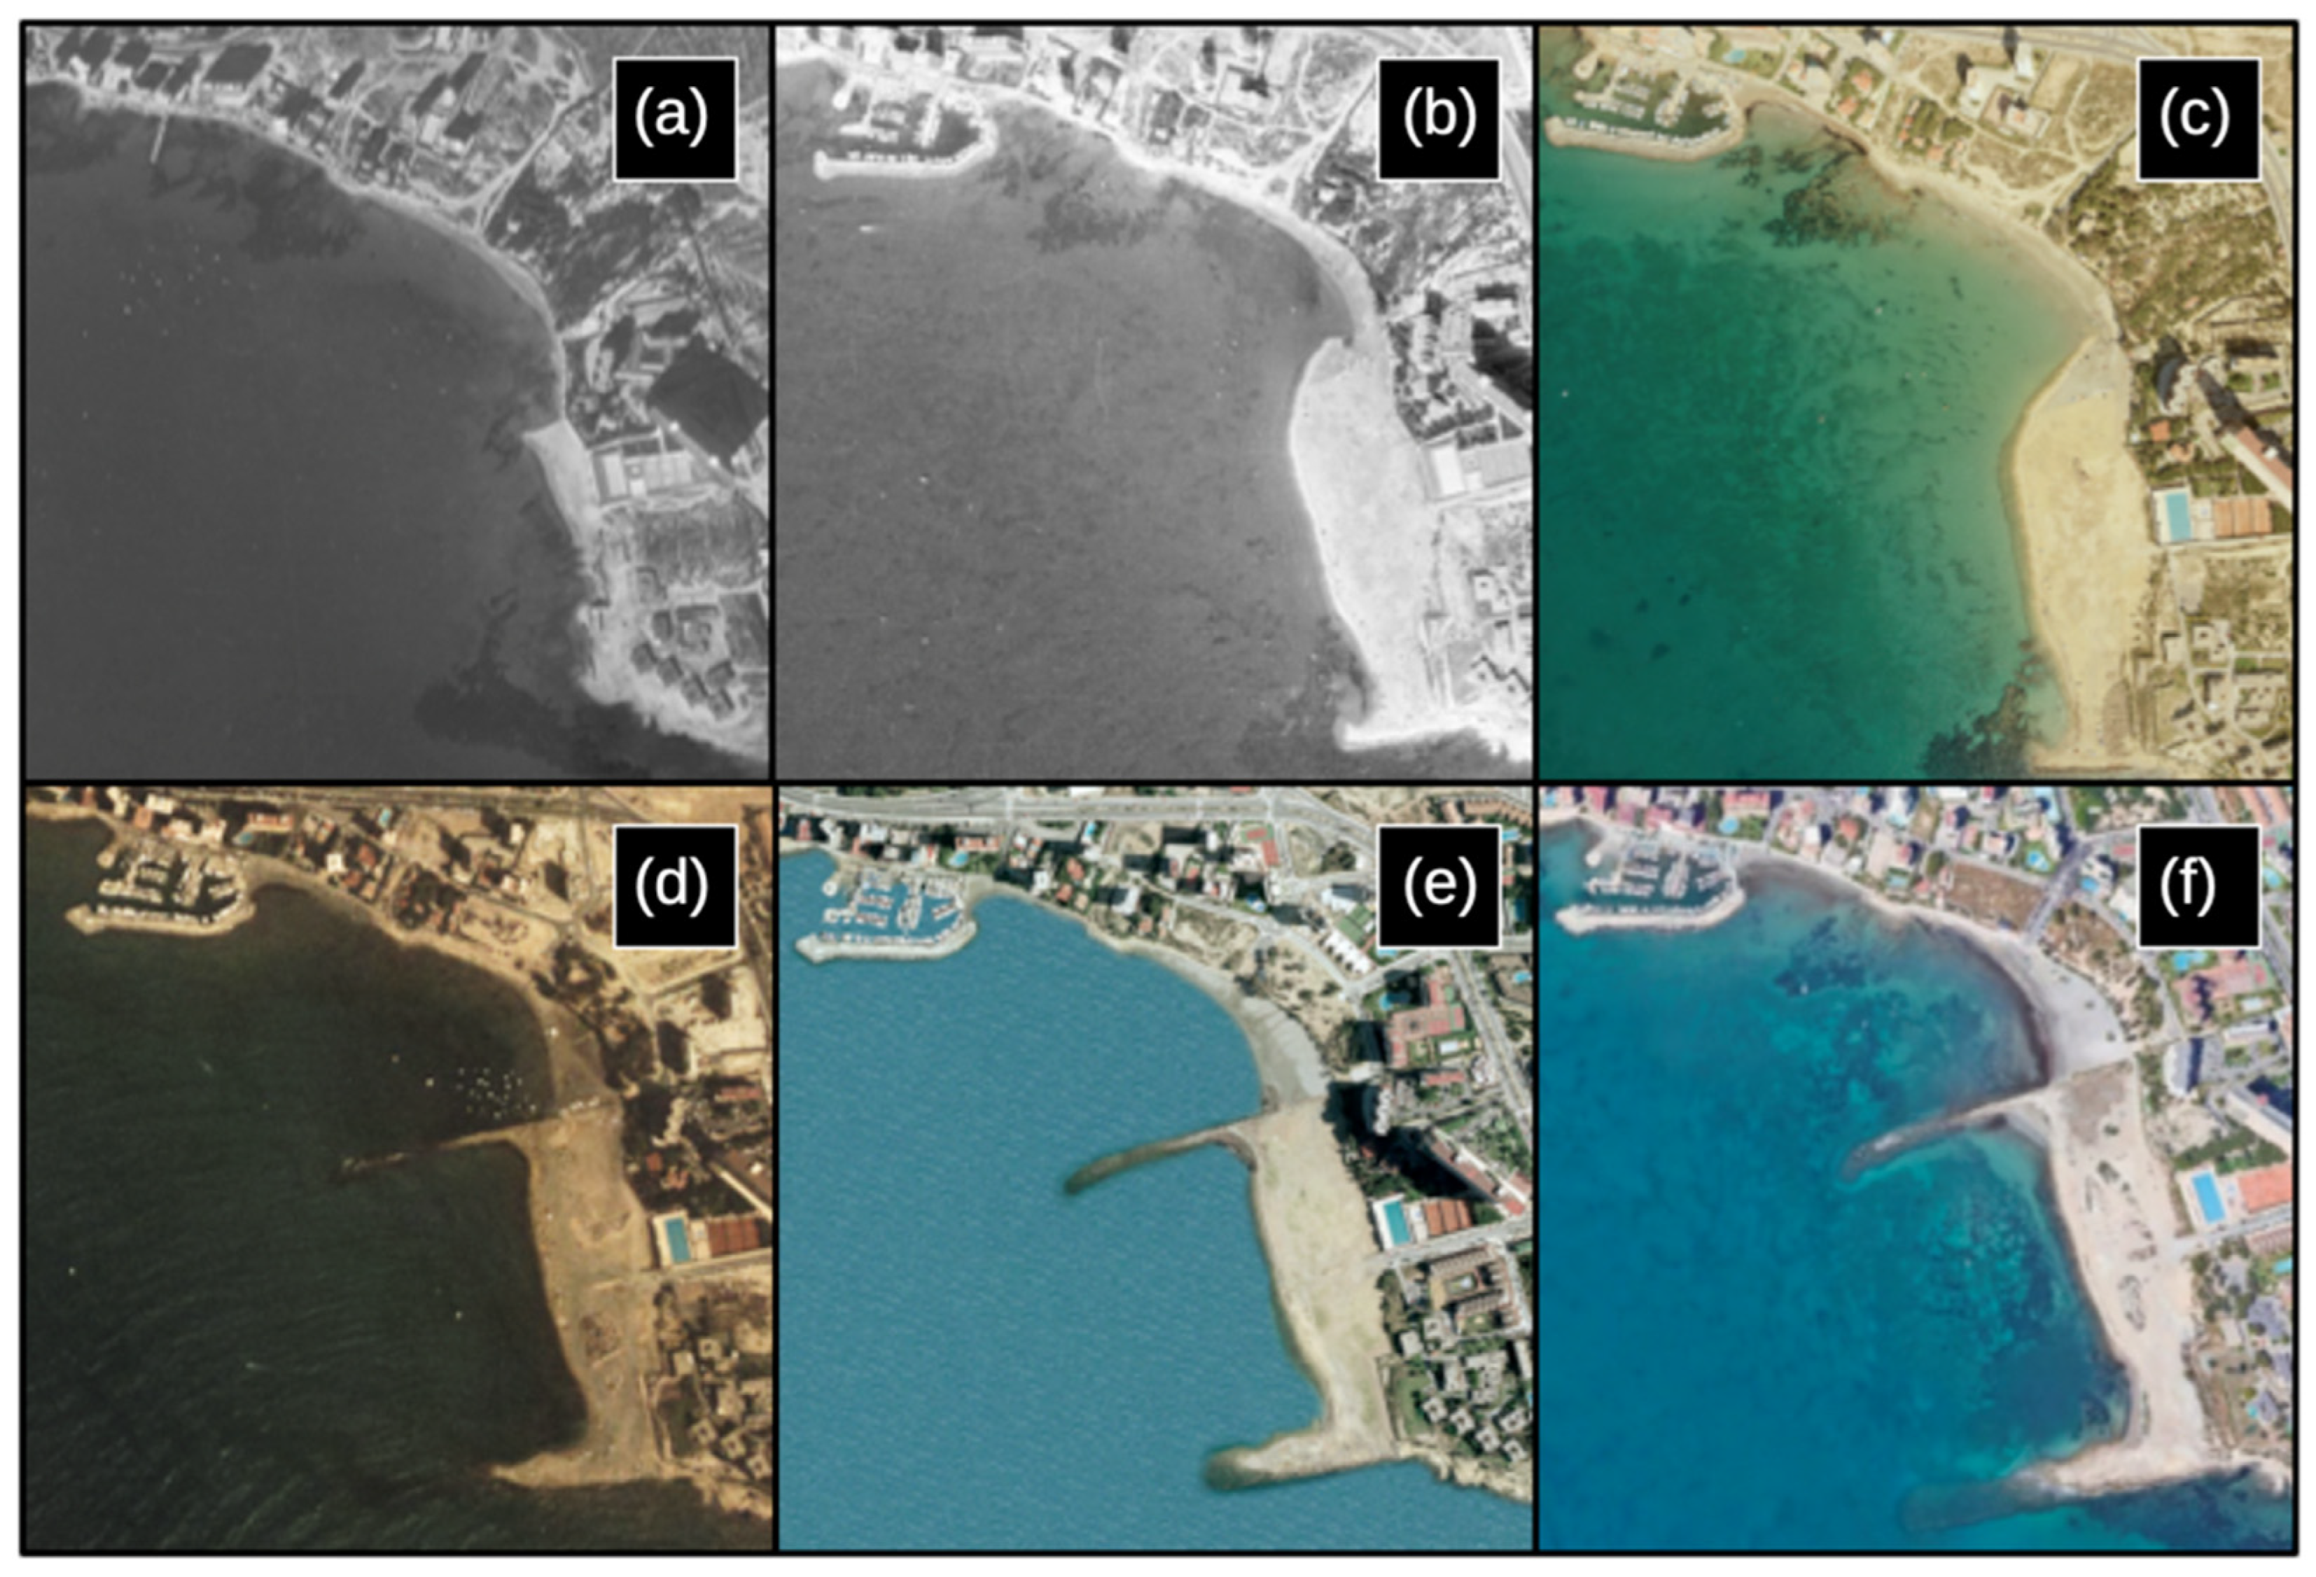
Figure 1. Impact location; evolution of the Puerto Amor project (ETRS89/UTM 30S 724,103.16 m E, 4,248,566.12 m N). (a) 1977 (Interministerial Flight, National Geographic Institute image, www.ign.es; accessed on 20 March 2022), (b) 1985 (National Flight, National Geographic Institute image, www.ign.es; accessed on 20 March 2022), (c) 1989 (Coastal Flight National Geographic Institute image, www.ign.es; accessed on 20 March 2022), (d) 1999 (Quinquennial Flight, National Geographic Institute image, www.ign.es; accessed on 20 March 2022), (e) 2002 (Photogrammetric Flight with scanned color, Valencian Cartographic Institute image, icv.gva.es; accessed on 20 March 2022), and (f) present (Google Earth Pro image; accessed on 20 March 2022).
Oceans 05 00015 g001
Figure 2. Study locations in the coastal environment of Cabo de la Huerta (modified in QGIS).
Oceans 05 00015 g002
Figure 3. (a) Boxplot of total abundance of fishes (individual/m2), (b) total biomass of fishes (g/m2), (c) species richness (number of species/m2), and (d) Shannon diversity index (bit ind−1), depending on the type of rocky habitat. Variance appears with error bars, with the mean in red, the median in black and bold, the boxes of interquartile ranges in grey, and the outliers represented with circles.
Oceans 05 00015 g003
Figure 4. Abundance of the Sparidae family species (mean ± standard error), depending on the locations and the seasons.
Oceans 05 00015 g004
Figure 5. Abundance of the Labridae family species (mean ± standard error), depending on the locations and the seasons.
Oceans 05 00015 g005
Figure 6. Abundance of the Serranidae family species (mean ± standard error), depending on the locations and the seasons.
Oceans 05 00015 g006
Figure 7. Redundancy analysis (RDA) of the biological features of the rocky habitat (left) and of the physical features of the rocky habitat (right).
Oceans 05 00015 g007
Table 1. Univariate PERMANOVAs of total abundance, biomass, species richness, and Shannon diversity index of fish assemblages. Df = degree freedom, SC = sum of squares, Pr > (F) = p-value, * Significance.
Total AbundanceTotal BiomassSpecies RichnessShannon Diversity
dfSCPr > (F)dfSCPr > (F)dfSCPr > (F)dfSCPr > (F)
Lo20.12680.004 *10.05170.027 *20.0050.35020.0090.490
Se10.05220.031 *10.03890.048 *10.0380.001 *10.0590.001 *
LoxSe20.09140.010 *10.13390.001 *20.0250.003 *20.0210.166
Ti(Se)40.15290.010 *40.03520.54840.0280.005 *40.0430.800 *
LoxTi(Se)80.08890.38240.02930.63980.0190.44180.0770.073 *
Si(LoxTi(Se))260.85380.002 *240.15060.968260.0870.459360.2430.199
Residual1081.1015-1261.3616-1080.256-1080.605-
Pairwise LoA ≠ N2---
Pairwise Se--W ≠ SW ≠ S
Pairwise LoxEpA:W ≠ A:S, N1:W ≠ A:S,
A:S ≠ N1:S, A:S ≠ N2:S
A:W ≠ N1:S, A:S ≠ N2:SA:W ≠ A:S,A:W ≠ N1:S,
N1:W ≠ A:S,N1:W ≠ N1:S,
A:S ≠ N2:S, N1:S ≠ N2:S
A:W ≠ N1:S,
N1:W ≠ N1:S
Disclaimer/Publisher’s Note: The statements, opinions and data contained in all publications are solely those of the individual author(s) and contributor(s) and not of MDPI and/or the editor(s). MDPI and/or the editor(s) disclaim responsibility for any injury to people or property resulting from any ideas, methods, instructions or products referred to in the content.